Fijian vs Choctaw Receiving Food Stamps
COMPARE
Fijian
Choctaw
Receiving Food Stamps
Receiving Food Stamps Comparison
Fijians
Choctaw
13.0%
RECEIVING FOOD STAMPS
4.3/ 100
METRIC RATING
225th/ 347
METRIC RANK
13.6%
RECEIVING FOOD STAMPS
1.0/ 100
METRIC RATING
241st/ 347
METRIC RANK
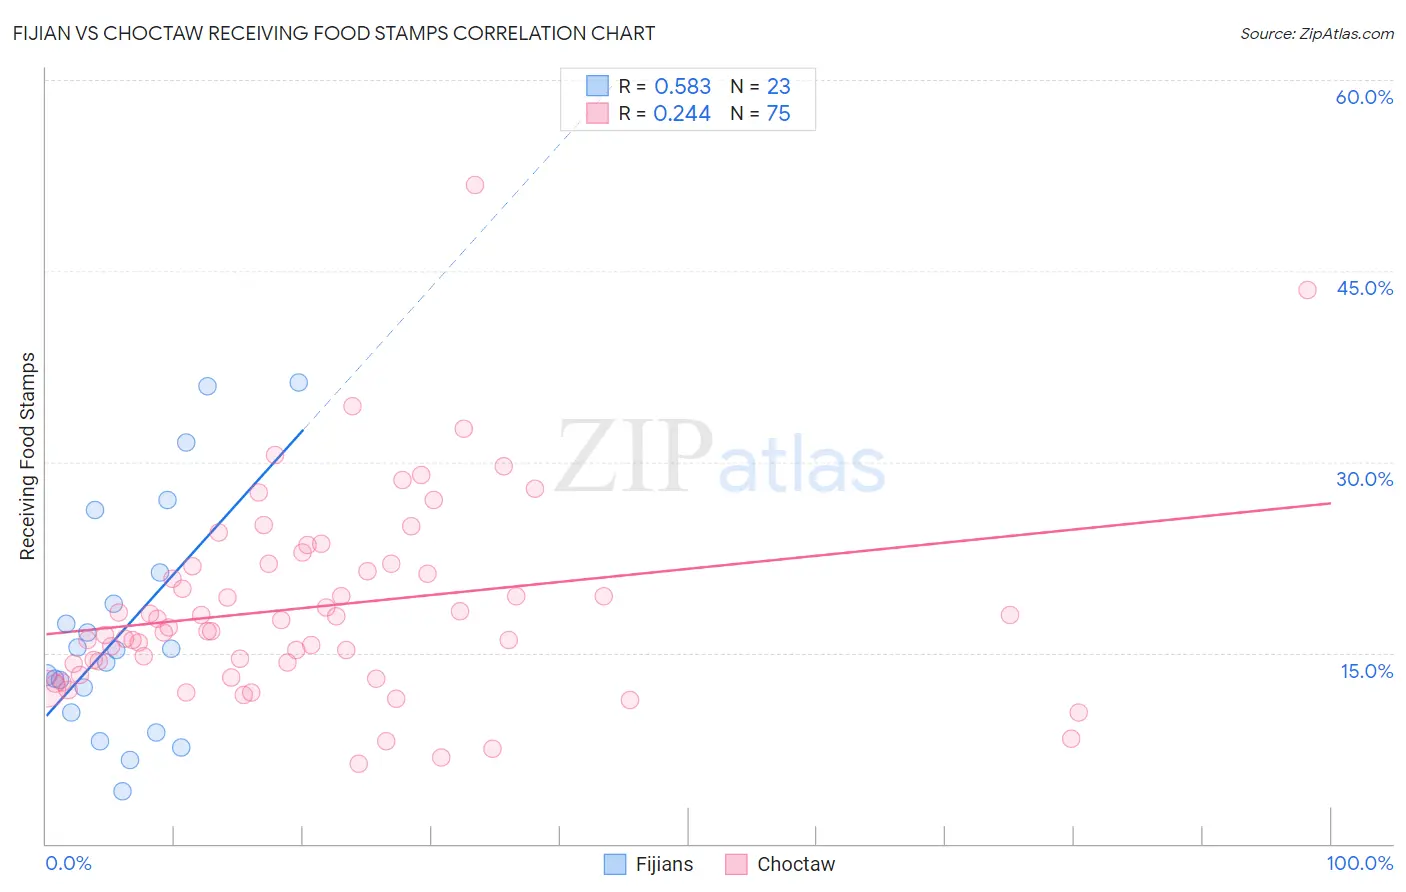
Fijian vs Choctaw Receiving Food Stamps Correlation Chart
The statistical analysis conducted on geographies consisting of 55,945,460 people shows a substantial positive correlation between the proportion of Fijians and percentage of population receiving government assistance and/or food stamps in the United States with a correlation coefficient (R) of 0.583 and weighted average of 13.0%. Similarly, the statistical analysis conducted on geographies consisting of 269,484,151 people shows a weak positive correlation between the proportion of Choctaw and percentage of population receiving government assistance and/or food stamps in the United States with a correlation coefficient (R) of 0.244 and weighted average of 13.6%, a difference of 4.5%.
Receiving Food Stamps Correlation Summary
| Measurement | Fijian | Choctaw |
| Minimum | 4.1% | 6.3% |
| Maximum | 36.2% | 51.8% |
| Range | 32.1% | 45.5% |
| Mean | 16.9% | 18.7% |
| Median | 15.2% | 17.0% |
| Interquartile 25% (IQ1) | 10.3% | 14.1% |
| Interquartile 75% (IQ3) | 21.3% | 22.0% |
| Interquartile Range (IQR) | 11.0% | 7.9% |
| Standard Deviation (Sample) | 9.0% | 7.8% |
| Standard Deviation (Population) | 8.8% | 7.8% |
Demographics Similar to Fijians and Choctaw by Receiving Food Stamps
In terms of receiving food stamps, the demographic groups most similar to Fijians are Immigrants from Armenia (13.0%, a difference of 0.020%), Immigrants from Albania (13.0%, a difference of 0.090%), Chickasaw (13.1%, a difference of 0.60%), Nigerian (13.1%, a difference of 0.65%), and Panamanian (13.1%, a difference of 0.66%). Similarly, the demographic groups most similar to Choctaw are Immigrants from Panama (13.6%, a difference of 0.18%), Somali (13.7%, a difference of 0.38%), Iroquois (13.5%, a difference of 0.43%), Immigrants from Micronesia (13.5%, a difference of 0.73%), and French American Indian (13.5%, a difference of 0.96%).
| Demographics | Rating | Rank | Receiving Food Stamps |
| Immigrants | Albania | 4.4 /100 | #223 | Tragic 13.0% |
| Immigrants | Armenia | 4.3 /100 | #224 | Tragic 13.0% |
| Fijians | 4.3 /100 | #225 | Tragic 13.0% |
| Chickasaw | 3.6 /100 | #226 | Tragic 13.1% |
| Nigerians | 3.5 /100 | #227 | Tragic 13.1% |
| Panamanians | 3.5 /100 | #228 | Tragic 13.1% |
| Ottawa | 3.5 /100 | #229 | Tragic 13.1% |
| Puget Sound Salish | 3.4 /100 | #230 | Tragic 13.1% |
| Immigrants | Nigeria | 3.4 /100 | #231 | Tragic 13.1% |
| Salvadorans | 2.7 /100 | #232 | Tragic 13.2% |
| Cherokee | 2.5 /100 | #233 | Tragic 13.2% |
| Comanche | 2.4 /100 | #234 | Tragic 13.3% |
| Immigrants | Zaire | 1.9 /100 | #235 | Tragic 13.4% |
| Crow | 1.6 /100 | #236 | Tragic 13.4% |
| Immigrants | El Salvador | 1.5 /100 | #237 | Tragic 13.5% |
| French American Indians | 1.4 /100 | #238 | Tragic 13.5% |
| Immigrants | Micronesia | 1.3 /100 | #239 | Tragic 13.5% |
| Iroquois | 1.2 /100 | #240 | Tragic 13.5% |
| Choctaw | 1.0 /100 | #241 | Tragic 13.6% |
| Immigrants | Panama | 1.0 /100 | #242 | Tragic 13.6% |
| Somalis | 0.9 /100 | #243 | Tragic 13.7% |