Immigrants from China vs Immigrants from Bulgaria Receiving Food Stamps
COMPARE
Immigrants from China
Immigrants from Bulgaria
Receiving Food Stamps
Receiving Food Stamps Comparison
Immigrants from China
Immigrants from Bulgaria
9.6%
RECEIVING FOOD STAMPS
99.5/ 100
METRIC RATING
42nd/ 347
METRIC RANK
9.8%
RECEIVING FOOD STAMPS
99.2/ 100
METRIC RATING
62nd/ 347
METRIC RANK
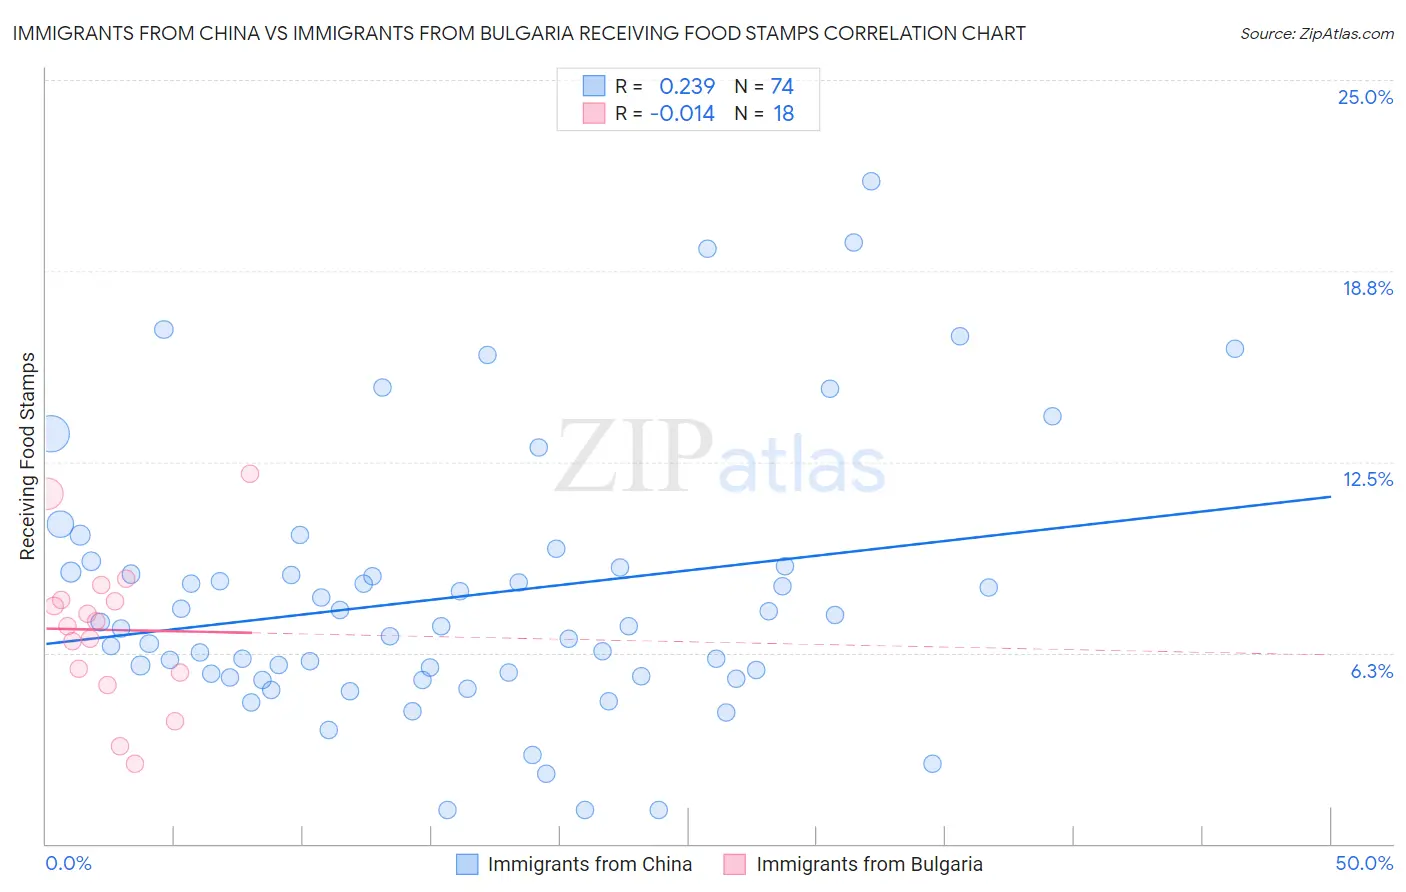
Immigrants from China vs Immigrants from Bulgaria Receiving Food Stamps Correlation Chart
The statistical analysis conducted on geographies consisting of 454,770,317 people shows a weak positive correlation between the proportion of Immigrants from China and percentage of population receiving government assistance and/or food stamps in the United States with a correlation coefficient (R) of 0.239 and weighted average of 9.6%. Similarly, the statistical analysis conducted on geographies consisting of 172,350,447 people shows no correlation between the proportion of Immigrants from Bulgaria and percentage of population receiving government assistance and/or food stamps in the United States with a correlation coefficient (R) of -0.014 and weighted average of 9.8%, a difference of 2.1%.
Receiving Food Stamps Correlation Summary
| Measurement | Immigrants from China | Immigrants from Bulgaria |
| Minimum | 1.1% | 2.6% |
| Maximum | 21.7% | 12.1% |
| Range | 20.6% | 9.5% |
| Mean | 8.1% | 7.0% |
| Median | 7.1% | 7.2% |
| Interquartile 25% (IQ1) | 5.5% | 5.6% |
| Interquartile 75% (IQ3) | 9.1% | 8.0% |
| Interquartile Range (IQR) | 3.6% | 2.4% |
| Standard Deviation (Sample) | 4.3% | 2.5% |
| Standard Deviation (Population) | 4.3% | 2.4% |
Demographics Similar to Immigrants from China and Immigrants from Bulgaria by Receiving Food Stamps
In terms of receiving food stamps, the demographic groups most similar to Immigrants from China are Croatian (9.6%, a difference of 0.30%), Immigrants from Denmark (9.6%, a difference of 0.53%), Immigrants from Belgium (9.6%, a difference of 0.56%), Australian (9.6%, a difference of 0.64%), and Indian (Asian) (9.6%, a difference of 0.71%). Similarly, the demographic groups most similar to Immigrants from Bulgaria are English (9.8%, a difference of 0.080%), German (9.7%, a difference of 0.22%), British (9.7%, a difference of 0.32%), Scandinavian (9.7%, a difference of 0.35%), and Greek (9.7%, a difference of 0.41%).
| Demographics | Rating | Rank | Receiving Food Stamps |
| Immigrants | China | 99.5 /100 | #42 | Exceptional 9.6% |
| Croatians | 99.5 /100 | #43 | Exceptional 9.6% |
| Immigrants | Denmark | 99.4 /100 | #44 | Exceptional 9.6% |
| Immigrants | Belgium | 99.4 /100 | #45 | Exceptional 9.6% |
| Australians | 99.4 /100 | #46 | Exceptional 9.6% |
| Indians (Asian) | 99.4 /100 | #47 | Exceptional 9.6% |
| Russians | 99.4 /100 | #48 | Exceptional 9.6% |
| Immigrants | Czechoslovakia | 99.4 /100 | #49 | Exceptional 9.6% |
| Lithuanians | 99.4 /100 | #50 | Exceptional 9.7% |
| Asians | 99.3 /100 | #51 | Exceptional 9.7% |
| Immigrants | South Africa | 99.3 /100 | #52 | Exceptional 9.7% |
| Tongans | 99.3 /100 | #53 | Exceptional 9.7% |
| Swiss | 99.3 /100 | #54 | Exceptional 9.7% |
| Immigrants | Switzerland | 99.3 /100 | #55 | Exceptional 9.7% |
| Immigrants | Canada | 99.3 /100 | #56 | Exceptional 9.7% |
| Greeks | 99.3 /100 | #57 | Exceptional 9.7% |
| Scandinavians | 99.2 /100 | #58 | Exceptional 9.7% |
| British | 99.2 /100 | #59 | Exceptional 9.7% |
| Germans | 99.2 /100 | #60 | Exceptional 9.7% |
| English | 99.2 /100 | #61 | Exceptional 9.8% |
| Immigrants | Bulgaria | 99.2 /100 | #62 | Exceptional 9.8% |