Immigrants from Bosnia and Herzegovina vs Barbadian Poverty
COMPARE
Immigrants from Bosnia and Herzegovina
Barbadian
Poverty
Poverty Comparison
Immigrants from Bosnia and Herzegovina
Barbadians
12.0%
POVERTY
73.7/ 100
METRIC RATING
147th/ 347
METRIC RANK
14.8%
POVERTY
0.0/ 100
METRIC RATING
274th/ 347
METRIC RANK
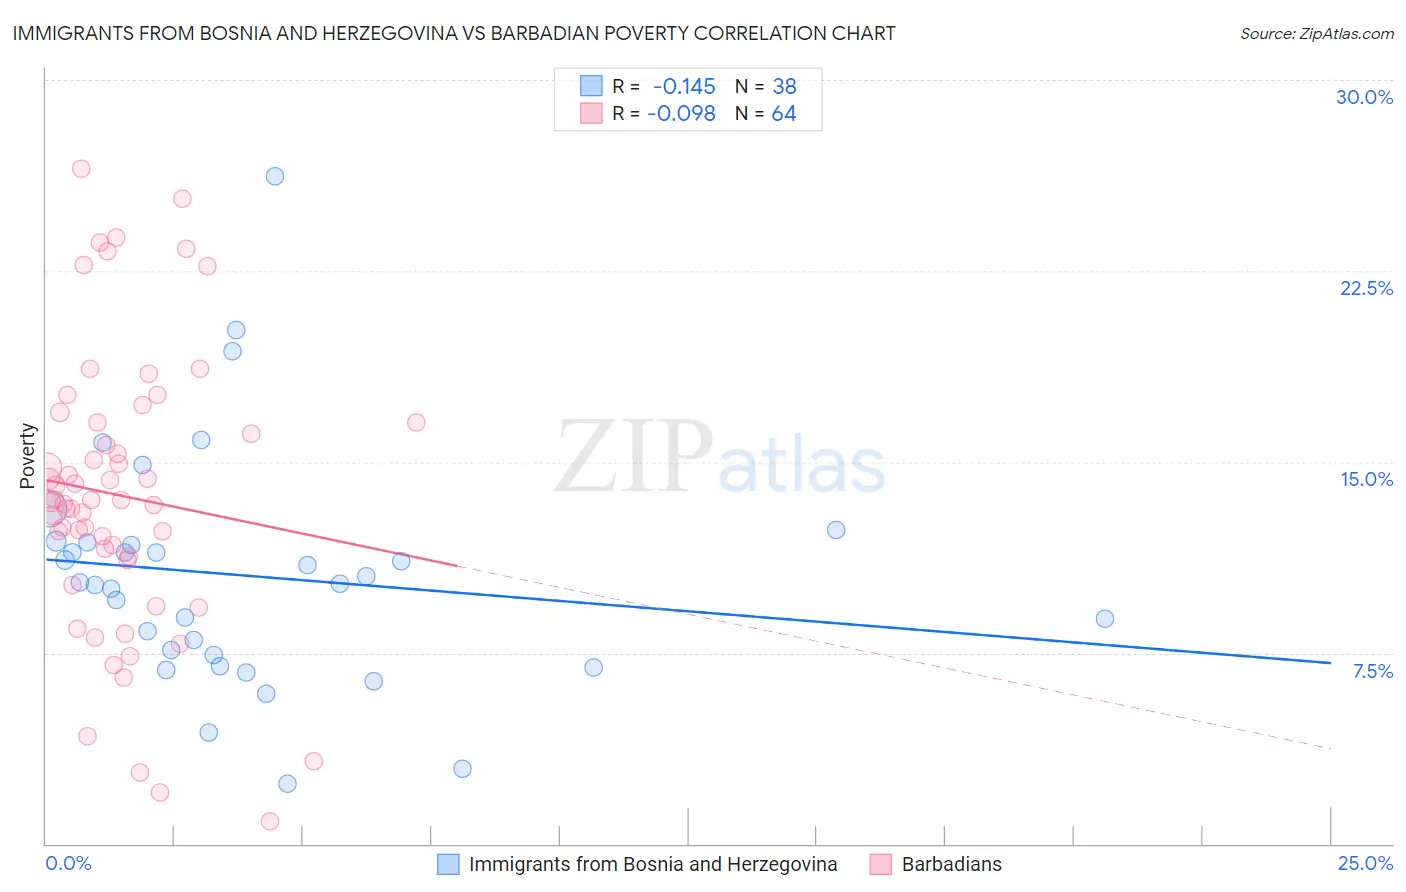
Immigrants from Bosnia and Herzegovina vs Barbadian Poverty Correlation Chart
The statistical analysis conducted on geographies consisting of 156,765,120 people shows a poor negative correlation between the proportion of Immigrants from Bosnia and Herzegovina and poverty level in the United States with a correlation coefficient (R) of -0.145 and weighted average of 12.0%. Similarly, the statistical analysis conducted on geographies consisting of 141,278,644 people shows a slight negative correlation between the proportion of Barbadians and poverty level in the United States with a correlation coefficient (R) of -0.098 and weighted average of 14.8%, a difference of 23.3%.
Poverty Correlation Summary
| Measurement | Immigrants from Bosnia and Herzegovina | Barbadian |
| Minimum | 2.3% | 0.88% |
| Maximum | 26.2% | 26.5% |
| Range | 23.9% | 25.6% |
| Mean | 10.5% | 13.7% |
| Median | 10.2% | 13.5% |
| Interquartile 25% (IQ1) | 7.4% | 11.2% |
| Interquartile 75% (IQ3) | 11.8% | 16.5% |
| Interquartile Range (IQR) | 4.4% | 5.3% |
| Standard Deviation (Sample) | 4.7% | 5.6% |
| Standard Deviation (Population) | 4.6% | 5.6% |
Similar Demographics by Poverty
Demographics Similar to Immigrants from Bosnia and Herzegovina by Poverty
In terms of poverty, the demographic groups most similar to Immigrants from Bosnia and Herzegovina are Immigrants from Germany (12.0%, a difference of 0.12%), Immigrants from Malaysia (12.0%, a difference of 0.12%), Afghan (12.0%, a difference of 0.16%), Immigrants from Kazakhstan (12.0%, a difference of 0.17%), and Syrian (12.0%, a difference of 0.19%).
| Demographics | Rating | Rank | Poverty |
| Immigrants | Peru | 81.1 /100 | #140 | Excellent 11.9% |
| Immigrants | France | 80.5 /100 | #141 | Excellent 11.9% |
| Basques | 80.4 /100 | #142 | Excellent 11.9% |
| Brazilians | 79.7 /100 | #143 | Good 11.9% |
| Icelanders | 77.9 /100 | #144 | Good 11.9% |
| Syrians | 75.1 /100 | #145 | Good 12.0% |
| Afghans | 74.9 /100 | #146 | Good 12.0% |
| Immigrants | Bosnia and Herzegovina | 73.7 /100 | #147 | Good 12.0% |
| Immigrants | Germany | 72.7 /100 | #148 | Good 12.0% |
| Immigrants | Malaysia | 72.7 /100 | #149 | Good 12.0% |
| Immigrants | Kazakhstan | 72.3 /100 | #150 | Good 12.0% |
| Samoans | 71.9 /100 | #151 | Good 12.0% |
| Armenians | 67.6 /100 | #152 | Good 12.1% |
| Immigrants | Northern Africa | 63.9 /100 | #153 | Good 12.1% |
| Guamanians/Chamorros | 63.9 /100 | #154 | Good 12.1% |
Demographics Similar to Barbadians by Poverty
In terms of poverty, the demographic groups most similar to Barbadians are Immigrants from West Indies (14.8%, a difference of 0.040%), Immigrants from Bahamas (14.8%, a difference of 0.040%), Bangladeshi (14.8%, a difference of 0.090%), Belizean (14.8%, a difference of 0.11%), and Spanish American (14.7%, a difference of 0.39%).
| Demographics | Rating | Rank | Poverty |
| Iroquois | 0.1 /100 | #267 | Tragic 14.5% |
| Sub-Saharan Africans | 0.1 /100 | #268 | Tragic 14.5% |
| Immigrants | Cuba | 0.1 /100 | #269 | Tragic 14.6% |
| Central Americans | 0.1 /100 | #270 | Tragic 14.6% |
| Shoshone | 0.0 /100 | #271 | Tragic 14.7% |
| Chickasaw | 0.0 /100 | #272 | Tragic 14.7% |
| Spanish Americans | 0.0 /100 | #273 | Tragic 14.7% |
| Barbadians | 0.0 /100 | #274 | Tragic 14.8% |
| Immigrants | West Indies | 0.0 /100 | #275 | Tragic 14.8% |
| Immigrants | Bahamas | 0.0 /100 | #276 | Tragic 14.8% |
| Bangladeshis | 0.0 /100 | #277 | Tragic 14.8% |
| Belizeans | 0.0 /100 | #278 | Tragic 14.8% |
| Immigrants | St. Vincent and the Grenadines | 0.0 /100 | #279 | Tragic 14.9% |
| Haitians | 0.0 /100 | #280 | Tragic 14.9% |
| Immigrants | Barbados | 0.0 /100 | #281 | Tragic 14.9% |