Immigrants from Bosnia and Herzegovina vs Immigrants from Albania Poverty
COMPARE
Immigrants from Bosnia and Herzegovina
Immigrants from Albania
Poverty
Poverty Comparison
Immigrants from Bosnia and Herzegovina
Immigrants from Albania
12.0%
POVERTY
73.7/ 100
METRIC RATING
147th/ 347
METRIC RANK
12.2%
POVERTY
57.7/ 100
METRIC RATING
165th/ 347
METRIC RANK
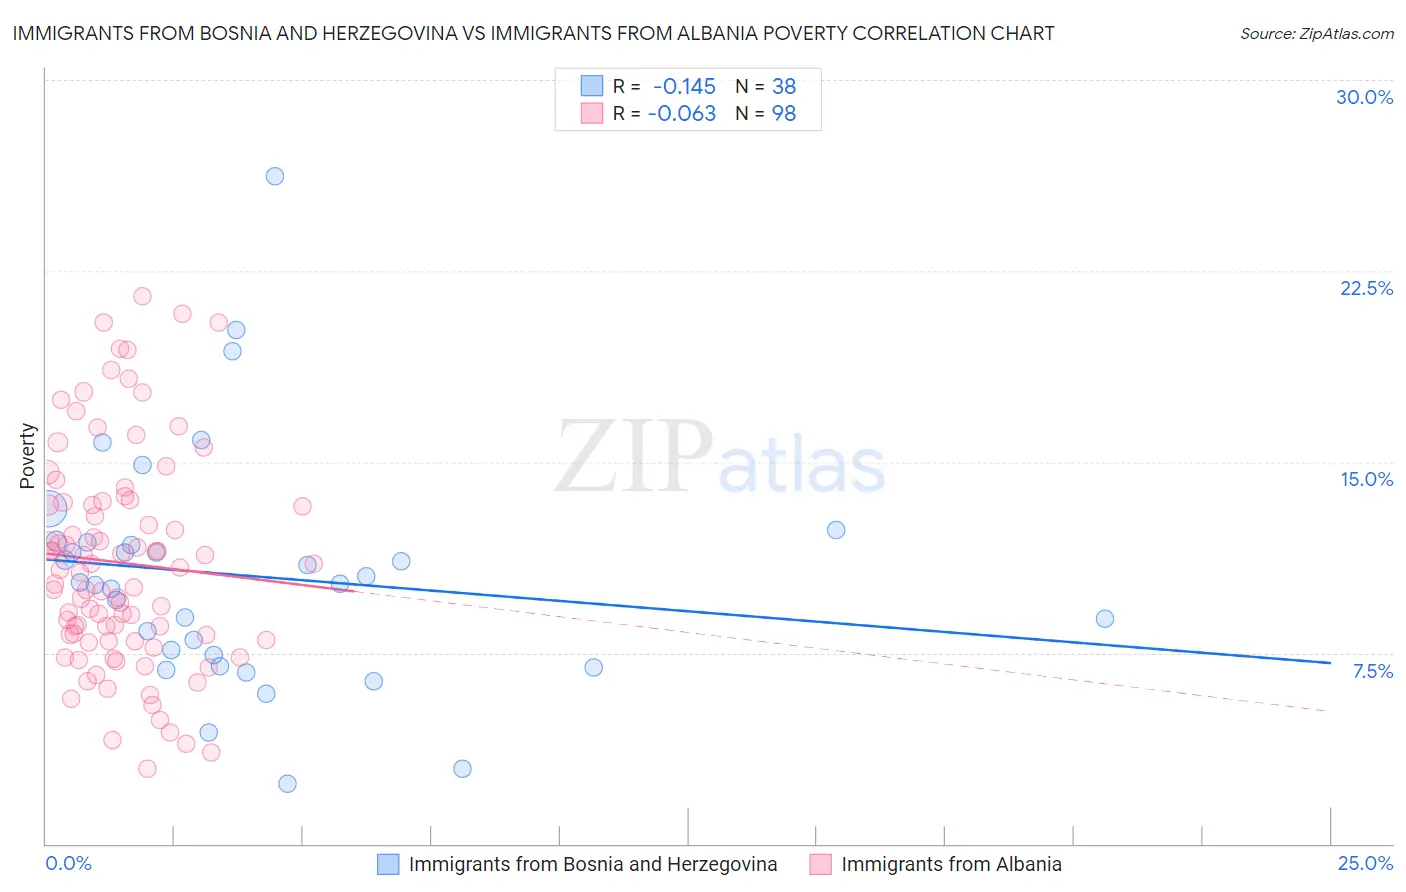
Immigrants from Bosnia and Herzegovina vs Immigrants from Albania Poverty Correlation Chart
The statistical analysis conducted on geographies consisting of 156,765,120 people shows a poor negative correlation between the proportion of Immigrants from Bosnia and Herzegovina and poverty level in the United States with a correlation coefficient (R) of -0.145 and weighted average of 12.0%. Similarly, the statistical analysis conducted on geographies consisting of 119,368,708 people shows a slight negative correlation between the proportion of Immigrants from Albania and poverty level in the United States with a correlation coefficient (R) of -0.063 and weighted average of 12.2%, a difference of 1.8%.
Poverty Correlation Summary
| Measurement | Immigrants from Bosnia and Herzegovina | Immigrants from Albania |
| Minimum | 2.3% | 3.0% |
| Maximum | 26.2% | 21.5% |
| Range | 23.9% | 18.6% |
| Mean | 10.5% | 11.0% |
| Median | 10.2% | 10.7% |
| Interquartile 25% (IQ1) | 7.4% | 8.0% |
| Interquartile 75% (IQ3) | 11.8% | 13.4% |
| Interquartile Range (IQR) | 4.4% | 5.4% |
| Standard Deviation (Sample) | 4.7% | 4.2% |
| Standard Deviation (Population) | 4.6% | 4.2% |
Demographics Similar to Immigrants from Bosnia and Herzegovina and Immigrants from Albania by Poverty
In terms of poverty, the demographic groups most similar to Immigrants from Bosnia and Herzegovina are Immigrants from Germany (12.0%, a difference of 0.12%), Immigrants from Malaysia (12.0%, a difference of 0.12%), Afghan (12.0%, a difference of 0.16%), Immigrants from Kazakhstan (12.0%, a difference of 0.17%), and Samoan (12.0%, a difference of 0.22%). Similarly, the demographic groups most similar to Immigrants from Albania are Colombian (12.2%, a difference of 0.010%), Immigrants from Ethiopia (12.2%, a difference of 0.080%), Venezuelan (12.2%, a difference of 0.090%), Ethiopian (12.2%, a difference of 0.13%), and Immigrants from Fiji (12.2%, a difference of 0.14%).
| Demographics | Rating | Rank | Poverty |
| Afghans | 74.9 /100 | #146 | Good 12.0% |
| Immigrants | Bosnia and Herzegovina | 73.7 /100 | #147 | Good 12.0% |
| Immigrants | Germany | 72.7 /100 | #148 | Good 12.0% |
| Immigrants | Malaysia | 72.7 /100 | #149 | Good 12.0% |
| Immigrants | Kazakhstan | 72.3 /100 | #150 | Good 12.0% |
| Samoans | 71.9 /100 | #151 | Good 12.0% |
| Armenians | 67.6 /100 | #152 | Good 12.1% |
| Immigrants | Northern Africa | 63.9 /100 | #153 | Good 12.1% |
| Guamanians/Chamorros | 63.9 /100 | #154 | Good 12.1% |
| Hungarians | 63.6 /100 | #155 | Good 12.2% |
| Scotch-Irish | 62.6 /100 | #156 | Good 12.2% |
| Costa Ricans | 62.2 /100 | #157 | Good 12.2% |
| Taiwanese | 61.8 /100 | #158 | Good 12.2% |
| Pennsylvania Germans | 60.8 /100 | #159 | Good 12.2% |
| Immigrants | Nepal | 60.4 /100 | #160 | Good 12.2% |
| Immigrants | Fiji | 59.1 /100 | #161 | Average 12.2% |
| Ethiopians | 59.1 /100 | #162 | Average 12.2% |
| Immigrants | Ethiopia | 58.6 /100 | #163 | Average 12.2% |
| Colombians | 57.8 /100 | #164 | Average 12.2% |
| Immigrants | Albania | 57.7 /100 | #165 | Average 12.2% |
| Venezuelans | 56.9 /100 | #166 | Average 12.2% |