Paraguayan vs Barbadian Poverty
COMPARE
Paraguayan
Barbadian
Poverty
Poverty Comparison
Paraguayans
Barbadians
11.4%
POVERTY
94.9/ 100
METRIC RATING
94th/ 347
METRIC RANK
14.8%
POVERTY
0.0/ 100
METRIC RATING
274th/ 347
METRIC RANK
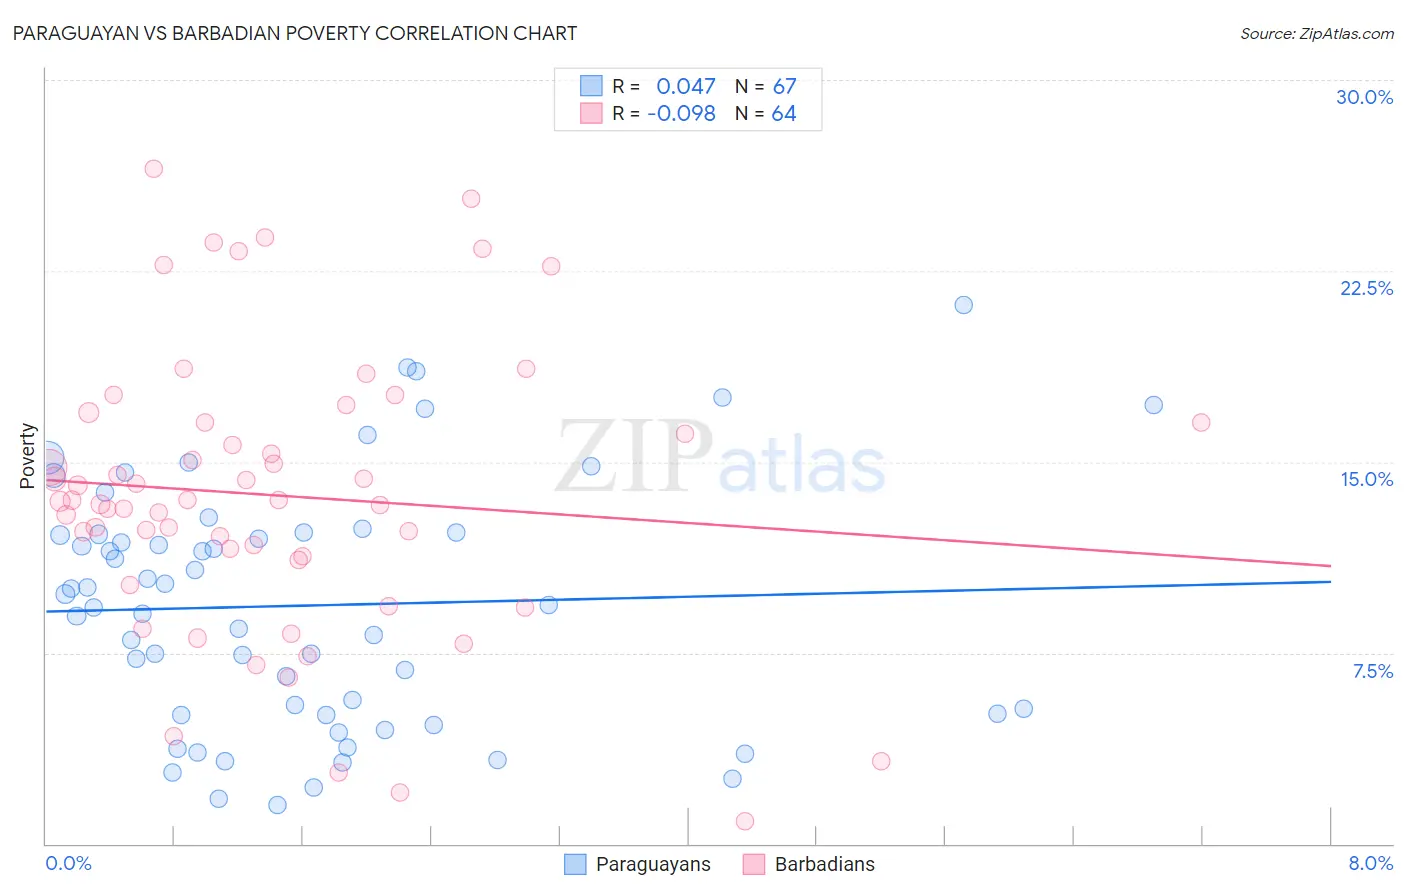
Paraguayan vs Barbadian Poverty Correlation Chart
The statistical analysis conducted on geographies consisting of 95,102,151 people shows no correlation between the proportion of Paraguayans and poverty level in the United States with a correlation coefficient (R) of 0.047 and weighted average of 11.4%. Similarly, the statistical analysis conducted on geographies consisting of 141,278,644 people shows a slight negative correlation between the proportion of Barbadians and poverty level in the United States with a correlation coefficient (R) of -0.098 and weighted average of 14.8%, a difference of 29.3%.
Poverty Correlation Summary
| Measurement | Paraguayan | Barbadian |
| Minimum | 1.5% | 0.88% |
| Maximum | 21.1% | 26.5% |
| Range | 19.6% | 25.6% |
| Mean | 9.4% | 13.7% |
| Median | 9.4% | 13.5% |
| Interquartile 25% (IQ1) | 5.1% | 11.2% |
| Interquartile 75% (IQ3) | 12.2% | 16.5% |
| Interquartile Range (IQR) | 7.2% | 5.3% |
| Standard Deviation (Sample) | 4.8% | 5.6% |
| Standard Deviation (Population) | 4.8% | 5.6% |
Similar Demographics by Poverty
Demographics Similar to Paraguayans by Poverty
In terms of poverty, the demographic groups most similar to Paraguayans are Australian (11.4%, a difference of 0.0%), Romanian (11.4%, a difference of 0.020%), British (11.4%, a difference of 0.060%), Immigrants from South Africa (11.5%, a difference of 0.12%), and Immigrants from Egypt (11.5%, a difference of 0.16%).
| Demographics | Rating | Rank | Poverty |
| Northern Europeans | 96.0 /100 | #87 | Exceptional 11.4% |
| Belgians | 95.8 /100 | #88 | Exceptional 11.4% |
| Czechoslovakians | 95.7 /100 | #89 | Exceptional 11.4% |
| Immigrants | Denmark | 95.5 /100 | #90 | Exceptional 11.4% |
| Finns | 95.2 /100 | #91 | Exceptional 11.4% |
| British | 95.0 /100 | #92 | Exceptional 11.4% |
| Romanians | 94.9 /100 | #93 | Exceptional 11.4% |
| Paraguayans | 94.9 /100 | #94 | Exceptional 11.4% |
| Australians | 94.9 /100 | #95 | Exceptional 11.4% |
| Immigrants | South Africa | 94.7 /100 | #96 | Exceptional 11.5% |
| Immigrants | Egypt | 94.6 /100 | #97 | Exceptional 11.5% |
| Immigrants | Latvia | 94.5 /100 | #98 | Exceptional 11.5% |
| Immigrants | Indonesia | 94.2 /100 | #99 | Exceptional 11.5% |
| Scottish | 94.0 /100 | #100 | Exceptional 11.5% |
| Slavs | 93.3 /100 | #101 | Exceptional 11.5% |
Demographics Similar to Barbadians by Poverty
In terms of poverty, the demographic groups most similar to Barbadians are Immigrants from West Indies (14.8%, a difference of 0.040%), Immigrants from Bahamas (14.8%, a difference of 0.040%), Bangladeshi (14.8%, a difference of 0.090%), Belizean (14.8%, a difference of 0.11%), and Spanish American (14.7%, a difference of 0.39%).
| Demographics | Rating | Rank | Poverty |
| Iroquois | 0.1 /100 | #267 | Tragic 14.5% |
| Sub-Saharan Africans | 0.1 /100 | #268 | Tragic 14.5% |
| Immigrants | Cuba | 0.1 /100 | #269 | Tragic 14.6% |
| Central Americans | 0.1 /100 | #270 | Tragic 14.6% |
| Shoshone | 0.0 /100 | #271 | Tragic 14.7% |
| Chickasaw | 0.0 /100 | #272 | Tragic 14.7% |
| Spanish Americans | 0.0 /100 | #273 | Tragic 14.7% |
| Barbadians | 0.0 /100 | #274 | Tragic 14.8% |
| Immigrants | West Indies | 0.0 /100 | #275 | Tragic 14.8% |
| Immigrants | Bahamas | 0.0 /100 | #276 | Tragic 14.8% |
| Bangladeshis | 0.0 /100 | #277 | Tragic 14.8% |
| Belizeans | 0.0 /100 | #278 | Tragic 14.8% |
| Immigrants | St. Vincent and the Grenadines | 0.0 /100 | #279 | Tragic 14.9% |
| Haitians | 0.0 /100 | #280 | Tragic 14.9% |
| Immigrants | Barbados | 0.0 /100 | #281 | Tragic 14.9% |