Immigrants from Bosnia and Herzegovina vs Macedonian Poverty
COMPARE
Immigrants from Bosnia and Herzegovina
Macedonian
Poverty
Poverty Comparison
Immigrants from Bosnia and Herzegovina
Macedonians
12.0%
POVERTY
73.7/ 100
METRIC RATING
147th/ 347
METRIC RANK
10.8%
POVERTY
99.4/ 100
METRIC RATING
33rd/ 347
METRIC RANK
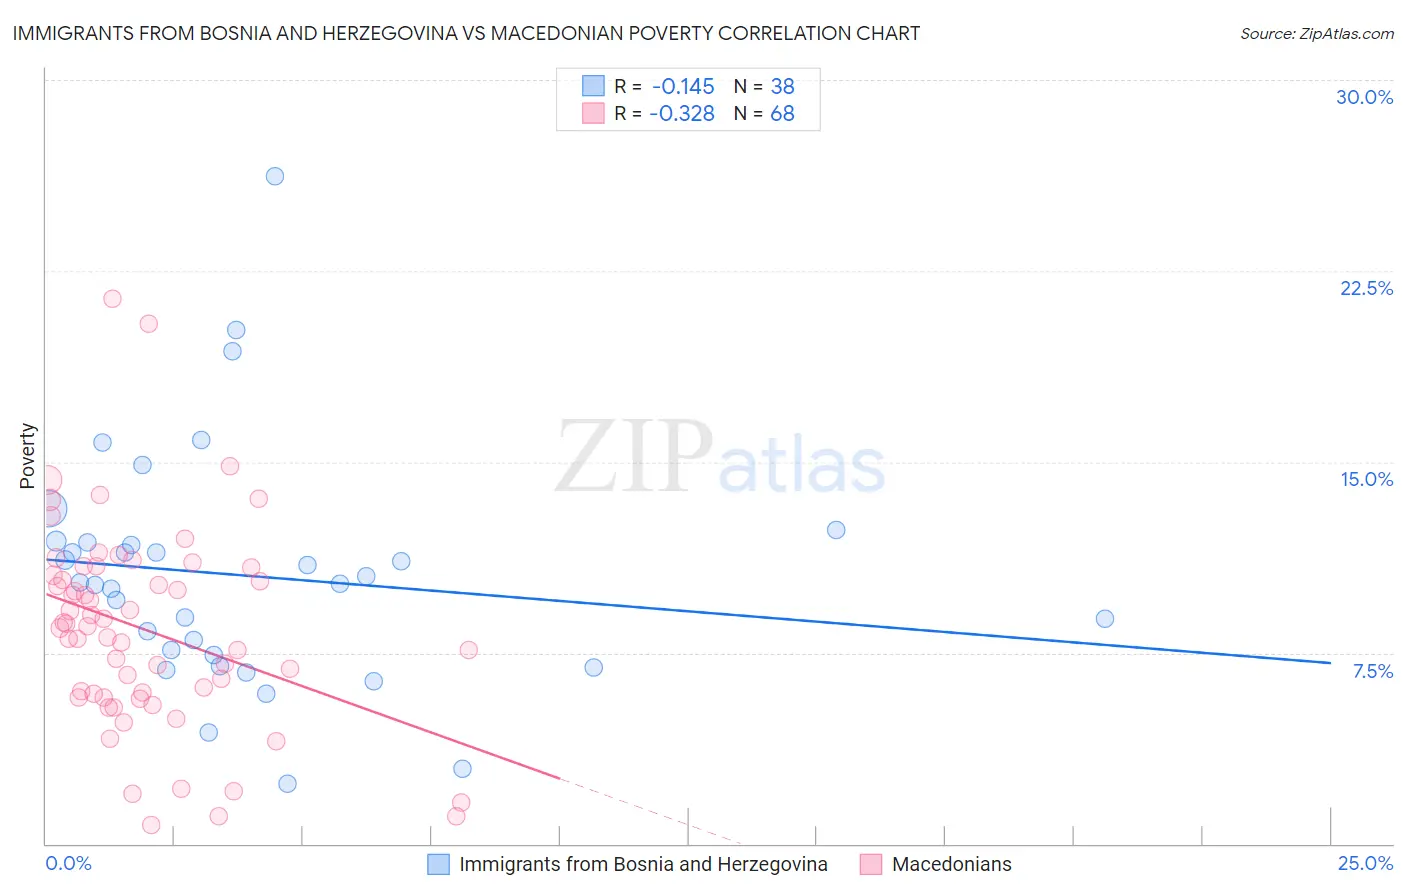
Immigrants from Bosnia and Herzegovina vs Macedonian Poverty Correlation Chart
The statistical analysis conducted on geographies consisting of 156,765,120 people shows a poor negative correlation between the proportion of Immigrants from Bosnia and Herzegovina and poverty level in the United States with a correlation coefficient (R) of -0.145 and weighted average of 12.0%. Similarly, the statistical analysis conducted on geographies consisting of 132,607,264 people shows a mild negative correlation between the proportion of Macedonians and poverty level in the United States with a correlation coefficient (R) of -0.328 and weighted average of 10.8%, a difference of 11.2%.
Poverty Correlation Summary
| Measurement | Immigrants from Bosnia and Herzegovina | Macedonian |
| Minimum | 2.3% | 0.75% |
| Maximum | 26.2% | 21.4% |
| Range | 23.9% | 20.7% |
| Mean | 10.5% | 8.4% |
| Median | 10.2% | 8.5% |
| Interquartile 25% (IQ1) | 7.4% | 5.8% |
| Interquartile 75% (IQ3) | 11.8% | 10.7% |
| Interquartile Range (IQR) | 4.4% | 4.9% |
| Standard Deviation (Sample) | 4.7% | 4.0% |
| Standard Deviation (Population) | 4.6% | 4.0% |
Similar Demographics by Poverty
Demographics Similar to Immigrants from Bosnia and Herzegovina by Poverty
In terms of poverty, the demographic groups most similar to Immigrants from Bosnia and Herzegovina are Immigrants from Germany (12.0%, a difference of 0.12%), Immigrants from Malaysia (12.0%, a difference of 0.12%), Afghan (12.0%, a difference of 0.16%), Immigrants from Kazakhstan (12.0%, a difference of 0.17%), and Syrian (12.0%, a difference of 0.19%).
| Demographics | Rating | Rank | Poverty |
| Immigrants | Peru | 81.1 /100 | #140 | Excellent 11.9% |
| Immigrants | France | 80.5 /100 | #141 | Excellent 11.9% |
| Basques | 80.4 /100 | #142 | Excellent 11.9% |
| Brazilians | 79.7 /100 | #143 | Good 11.9% |
| Icelanders | 77.9 /100 | #144 | Good 11.9% |
| Syrians | 75.1 /100 | #145 | Good 12.0% |
| Afghans | 74.9 /100 | #146 | Good 12.0% |
| Immigrants | Bosnia and Herzegovina | 73.7 /100 | #147 | Good 12.0% |
| Immigrants | Germany | 72.7 /100 | #148 | Good 12.0% |
| Immigrants | Malaysia | 72.7 /100 | #149 | Good 12.0% |
| Immigrants | Kazakhstan | 72.3 /100 | #150 | Good 12.0% |
| Samoans | 71.9 /100 | #151 | Good 12.0% |
| Armenians | 67.6 /100 | #152 | Good 12.1% |
| Immigrants | Northern Africa | 63.9 /100 | #153 | Good 12.1% |
| Guamanians/Chamorros | 63.9 /100 | #154 | Good 12.1% |
Demographics Similar to Macedonians by Poverty
In terms of poverty, the demographic groups most similar to Macedonians are Immigrants from Poland (10.8%, a difference of 0.090%), Tongan (10.8%, a difference of 0.14%), Cypriot (10.8%, a difference of 0.21%), Immigrants from Greece (10.8%, a difference of 0.31%), and Czech (10.8%, a difference of 0.36%).
| Demographics | Rating | Rank | Poverty |
| Burmese | 99.6 /100 | #26 | Exceptional 10.7% |
| Immigrants | Northern Europe | 99.6 /100 | #27 | Exceptional 10.7% |
| Immigrants | Korea | 99.5 /100 | #28 | Exceptional 10.7% |
| Greeks | 99.5 /100 | #29 | Exceptional 10.7% |
| Danes | 99.5 /100 | #30 | Exceptional 10.7% |
| Poles | 99.5 /100 | #31 | Exceptional 10.7% |
| Iranians | 99.5 /100 | #32 | Exceptional 10.7% |
| Macedonians | 99.4 /100 | #33 | Exceptional 10.8% |
| Immigrants | Poland | 99.4 /100 | #34 | Exceptional 10.8% |
| Tongans | 99.4 /100 | #35 | Exceptional 10.8% |
| Cypriots | 99.3 /100 | #36 | Exceptional 10.8% |
| Immigrants | Greece | 99.3 /100 | #37 | Exceptional 10.8% |
| Czechs | 99.3 /100 | #38 | Exceptional 10.8% |
| Immigrants | Pakistan | 99.3 /100 | #39 | Exceptional 10.8% |
| Russians | 99.3 /100 | #40 | Exceptional 10.9% |