Immigrants from Bosnia and Herzegovina vs Delaware Poverty
COMPARE
Immigrants from Bosnia and Herzegovina
Delaware
Poverty
Poverty Comparison
Immigrants from Bosnia and Herzegovina
Delaware
12.0%
POVERTY
73.7/ 100
METRIC RATING
147th/ 347
METRIC RANK
12.7%
POVERTY
21.4/ 100
METRIC RATING
193rd/ 347
METRIC RANK
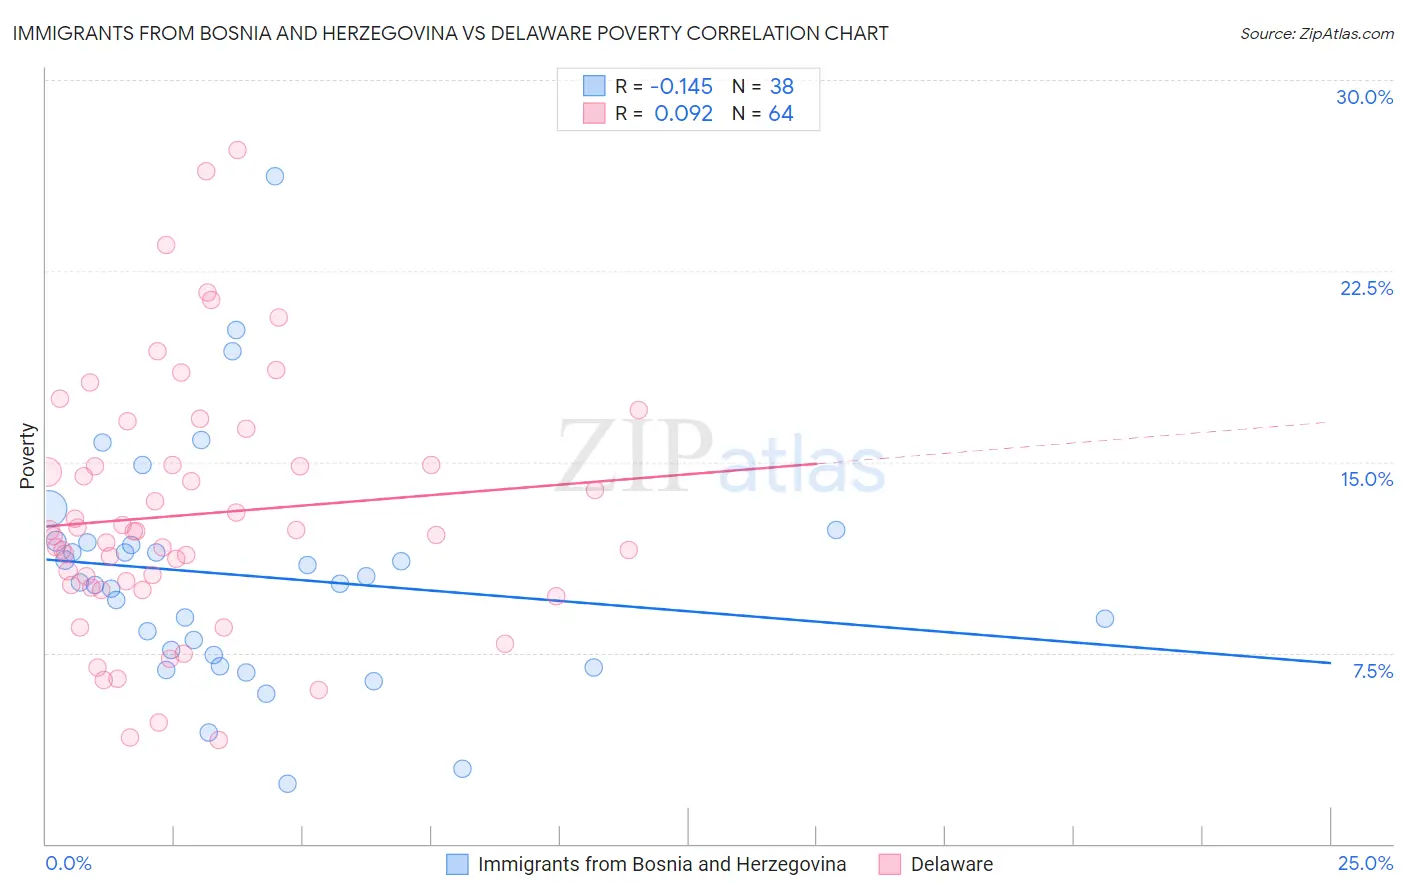
Immigrants from Bosnia and Herzegovina vs Delaware Poverty Correlation Chart
The statistical analysis conducted on geographies consisting of 156,765,120 people shows a poor negative correlation between the proportion of Immigrants from Bosnia and Herzegovina and poverty level in the United States with a correlation coefficient (R) of -0.145 and weighted average of 12.0%. Similarly, the statistical analysis conducted on geographies consisting of 96,223,629 people shows a slight positive correlation between the proportion of Delaware and poverty level in the United States with a correlation coefficient (R) of 0.092 and weighted average of 12.7%, a difference of 5.8%.
Poverty Correlation Summary
| Measurement | Immigrants from Bosnia and Herzegovina | Delaware |
| Minimum | 2.3% | 4.1% |
| Maximum | 26.2% | 27.2% |
| Range | 23.9% | 23.2% |
| Mean | 10.5% | 12.9% |
| Median | 10.2% | 12.2% |
| Interquartile 25% (IQ1) | 7.4% | 10.1% |
| Interquartile 75% (IQ3) | 11.8% | 14.9% |
| Interquartile Range (IQR) | 4.4% | 4.8% |
| Standard Deviation (Sample) | 4.7% | 5.0% |
| Standard Deviation (Population) | 4.6% | 4.9% |
Similar Demographics by Poverty
Demographics Similar to Immigrants from Bosnia and Herzegovina by Poverty
In terms of poverty, the demographic groups most similar to Immigrants from Bosnia and Herzegovina are Immigrants from Germany (12.0%, a difference of 0.12%), Immigrants from Malaysia (12.0%, a difference of 0.12%), Afghan (12.0%, a difference of 0.16%), Immigrants from Kazakhstan (12.0%, a difference of 0.17%), and Syrian (12.0%, a difference of 0.19%).
| Demographics | Rating | Rank | Poverty |
| Immigrants | Peru | 81.1 /100 | #140 | Excellent 11.9% |
| Immigrants | France | 80.5 /100 | #141 | Excellent 11.9% |
| Basques | 80.4 /100 | #142 | Excellent 11.9% |
| Brazilians | 79.7 /100 | #143 | Good 11.9% |
| Icelanders | 77.9 /100 | #144 | Good 11.9% |
| Syrians | 75.1 /100 | #145 | Good 12.0% |
| Afghans | 74.9 /100 | #146 | Good 12.0% |
| Immigrants | Bosnia and Herzegovina | 73.7 /100 | #147 | Good 12.0% |
| Immigrants | Germany | 72.7 /100 | #148 | Good 12.0% |
| Immigrants | Malaysia | 72.7 /100 | #149 | Good 12.0% |
| Immigrants | Kazakhstan | 72.3 /100 | #150 | Good 12.0% |
| Samoans | 71.9 /100 | #151 | Good 12.0% |
| Armenians | 67.6 /100 | #152 | Good 12.1% |
| Immigrants | Northern Africa | 63.9 /100 | #153 | Good 12.1% |
| Guamanians/Chamorros | 63.9 /100 | #154 | Good 12.1% |
Demographics Similar to Delaware by Poverty
In terms of poverty, the demographic groups most similar to Delaware are Arab (12.7%, a difference of 0.040%), Immigrants from Kuwait (12.7%, a difference of 0.080%), Iraqi (12.7%, a difference of 0.090%), South American Indian (12.7%, a difference of 0.25%), and Immigrants from Lebanon (12.8%, a difference of 0.40%).
| Demographics | Rating | Rank | Poverty |
| Immigrants | Sierra Leone | 36.3 /100 | #186 | Fair 12.5% |
| Hawaiians | 34.1 /100 | #187 | Fair 12.5% |
| Immigrants | Costa Rica | 33.3 /100 | #188 | Fair 12.5% |
| Aleuts | 33.2 /100 | #189 | Fair 12.5% |
| Immigrants | South America | 32.3 /100 | #190 | Fair 12.5% |
| Sierra Leoneans | 31.5 /100 | #191 | Fair 12.6% |
| South American Indians | 23.3 /100 | #192 | Fair 12.7% |
| Delaware | 21.4 /100 | #193 | Fair 12.7% |
| Arabs | 21.1 /100 | #194 | Fair 12.7% |
| Immigrants | Kuwait | 20.9 /100 | #195 | Fair 12.7% |
| Iraqis | 20.8 /100 | #196 | Fair 12.7% |
| Immigrants | Lebanon | 18.7 /100 | #197 | Poor 12.8% |
| Spanish | 18.7 /100 | #198 | Poor 12.8% |
| Immigrants | Kenya | 17.5 /100 | #199 | Poor 12.8% |
| Spaniards | 16.5 /100 | #200 | Poor 12.8% |