Immigrants from Bosnia and Herzegovina vs Ecuadorian Poverty
COMPARE
Immigrants from Bosnia and Herzegovina
Ecuadorian
Poverty
Poverty Comparison
Immigrants from Bosnia and Herzegovina
Ecuadorians
12.0%
POVERTY
73.7/ 100
METRIC RATING
147th/ 347
METRIC RANK
14.0%
POVERTY
0.4/ 100
METRIC RATING
242nd/ 347
METRIC RANK
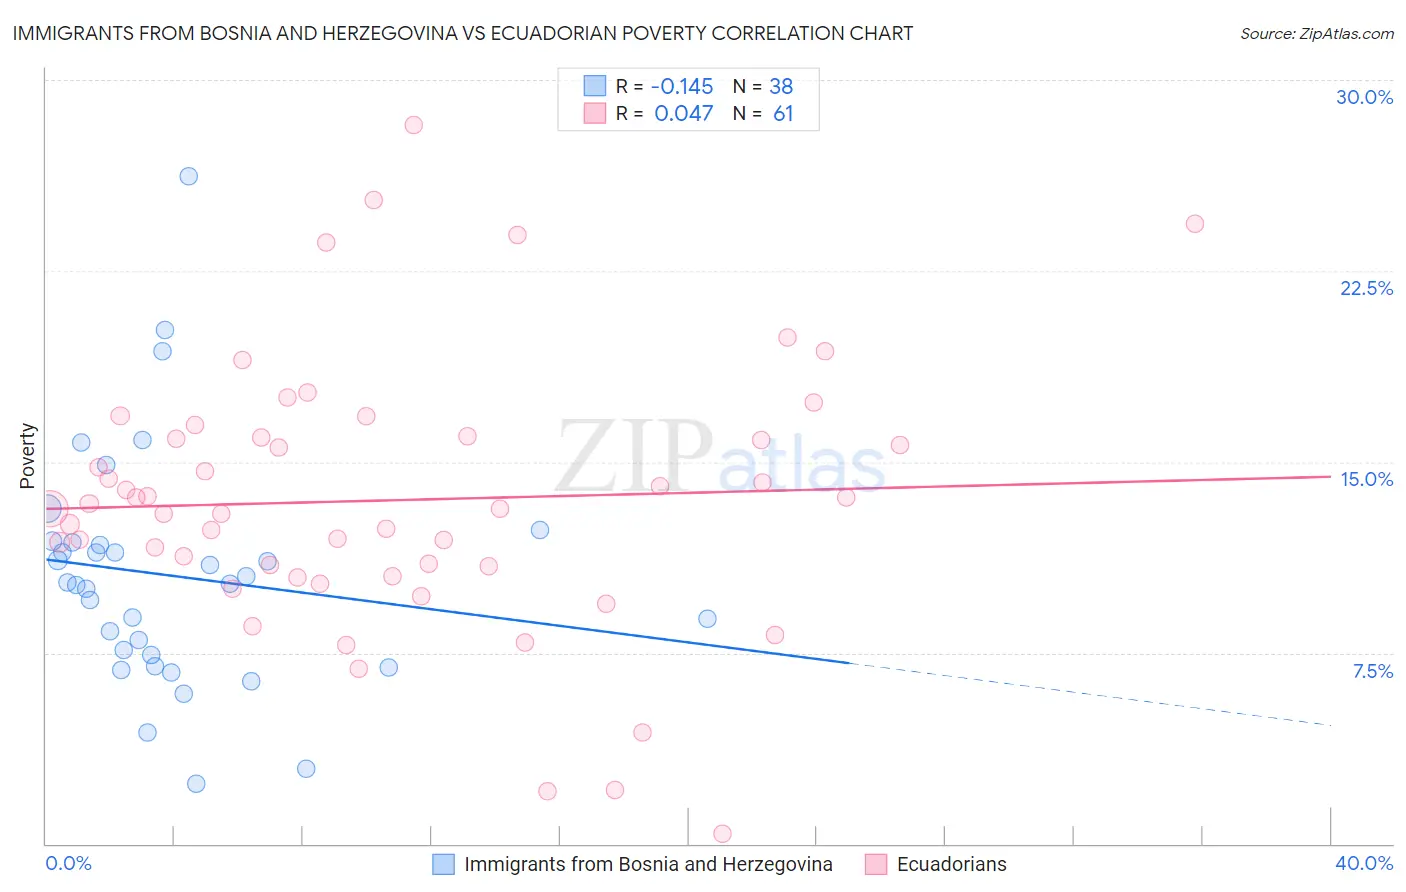
Immigrants from Bosnia and Herzegovina vs Ecuadorian Poverty Correlation Chart
The statistical analysis conducted on geographies consisting of 156,765,120 people shows a poor negative correlation between the proportion of Immigrants from Bosnia and Herzegovina and poverty level in the United States with a correlation coefficient (R) of -0.145 and weighted average of 12.0%. Similarly, the statistical analysis conducted on geographies consisting of 317,659,954 people shows no correlation between the proportion of Ecuadorians and poverty level in the United States with a correlation coefficient (R) of 0.047 and weighted average of 14.0%, a difference of 16.6%.
Poverty Correlation Summary
| Measurement | Immigrants from Bosnia and Herzegovina | Ecuadorian |
| Minimum | 2.3% | 0.41% |
| Maximum | 26.2% | 28.2% |
| Range | 23.9% | 27.8% |
| Mean | 10.5% | 13.5% |
| Median | 10.2% | 13.2% |
| Interquartile 25% (IQ1) | 7.4% | 10.7% |
| Interquartile 75% (IQ3) | 11.8% | 16.0% |
| Interquartile Range (IQR) | 4.4% | 5.3% |
| Standard Deviation (Sample) | 4.7% | 5.3% |
| Standard Deviation (Population) | 4.6% | 5.3% |
Similar Demographics by Poverty
Demographics Similar to Immigrants from Bosnia and Herzegovina by Poverty
In terms of poverty, the demographic groups most similar to Immigrants from Bosnia and Herzegovina are Immigrants from Germany (12.0%, a difference of 0.12%), Immigrants from Malaysia (12.0%, a difference of 0.12%), Afghan (12.0%, a difference of 0.16%), Immigrants from Kazakhstan (12.0%, a difference of 0.17%), and Syrian (12.0%, a difference of 0.19%).
| Demographics | Rating | Rank | Poverty |
| Immigrants | Peru | 81.1 /100 | #140 | Excellent 11.9% |
| Immigrants | France | 80.5 /100 | #141 | Excellent 11.9% |
| Basques | 80.4 /100 | #142 | Excellent 11.9% |
| Brazilians | 79.7 /100 | #143 | Good 11.9% |
| Icelanders | 77.9 /100 | #144 | Good 11.9% |
| Syrians | 75.1 /100 | #145 | Good 12.0% |
| Afghans | 74.9 /100 | #146 | Good 12.0% |
| Immigrants | Bosnia and Herzegovina | 73.7 /100 | #147 | Good 12.0% |
| Immigrants | Germany | 72.7 /100 | #148 | Good 12.0% |
| Immigrants | Malaysia | 72.7 /100 | #149 | Good 12.0% |
| Immigrants | Kazakhstan | 72.3 /100 | #150 | Good 12.0% |
| Samoans | 71.9 /100 | #151 | Good 12.0% |
| Armenians | 67.6 /100 | #152 | Good 12.1% |
| Immigrants | Northern Africa | 63.9 /100 | #153 | Good 12.1% |
| Guamanians/Chamorros | 63.9 /100 | #154 | Good 12.1% |
Demographics Similar to Ecuadorians by Poverty
In terms of poverty, the demographic groups most similar to Ecuadorians are Sudanese (14.0%, a difference of 0.070%), Nepalese (14.0%, a difference of 0.10%), Salvadoran (14.0%, a difference of 0.31%), Immigrants from Middle Africa (14.0%, a difference of 0.34%), and Nicaraguan (13.9%, a difference of 0.46%).
| Demographics | Rating | Rank | Poverty |
| Cubans | 0.6 /100 | #235 | Tragic 13.9% |
| Immigrants | Armenia | 0.5 /100 | #236 | Tragic 13.9% |
| French American Indians | 0.5 /100 | #237 | Tragic 13.9% |
| Ghanaians | 0.5 /100 | #238 | Tragic 13.9% |
| Nicaraguans | 0.4 /100 | #239 | Tragic 13.9% |
| Immigrants | Middle Africa | 0.4 /100 | #240 | Tragic 14.0% |
| Salvadorans | 0.4 /100 | #241 | Tragic 14.0% |
| Ecuadorians | 0.4 /100 | #242 | Tragic 14.0% |
| Sudanese | 0.3 /100 | #243 | Tragic 14.0% |
| Nepalese | 0.3 /100 | #244 | Tragic 14.0% |
| Immigrants | Sudan | 0.3 /100 | #245 | Tragic 14.1% |
| Potawatomi | 0.3 /100 | #246 | Tragic 14.1% |
| Liberians | 0.2 /100 | #247 | Tragic 14.1% |
| Immigrants | Western Africa | 0.2 /100 | #248 | Tragic 14.1% |
| Immigrants | Ghana | 0.2 /100 | #249 | Tragic 14.2% |