Immigrants from Australia vs Egyptian Married-Couple Family Poverty
COMPARE
Immigrants from Australia
Egyptian
Married-Couple Family Poverty
Married-Couple Family Poverty Comparison
Immigrants from Australia
Egyptians
4.4%
MARRIED-COUPLE FAMILY POVERTY
99.6/ 100
METRIC RATING
62nd/ 347
METRIC RANK
4.8%
MARRIED-COUPLE FAMILY POVERTY
92.0/ 100
METRIC RATING
127th/ 347
METRIC RANK
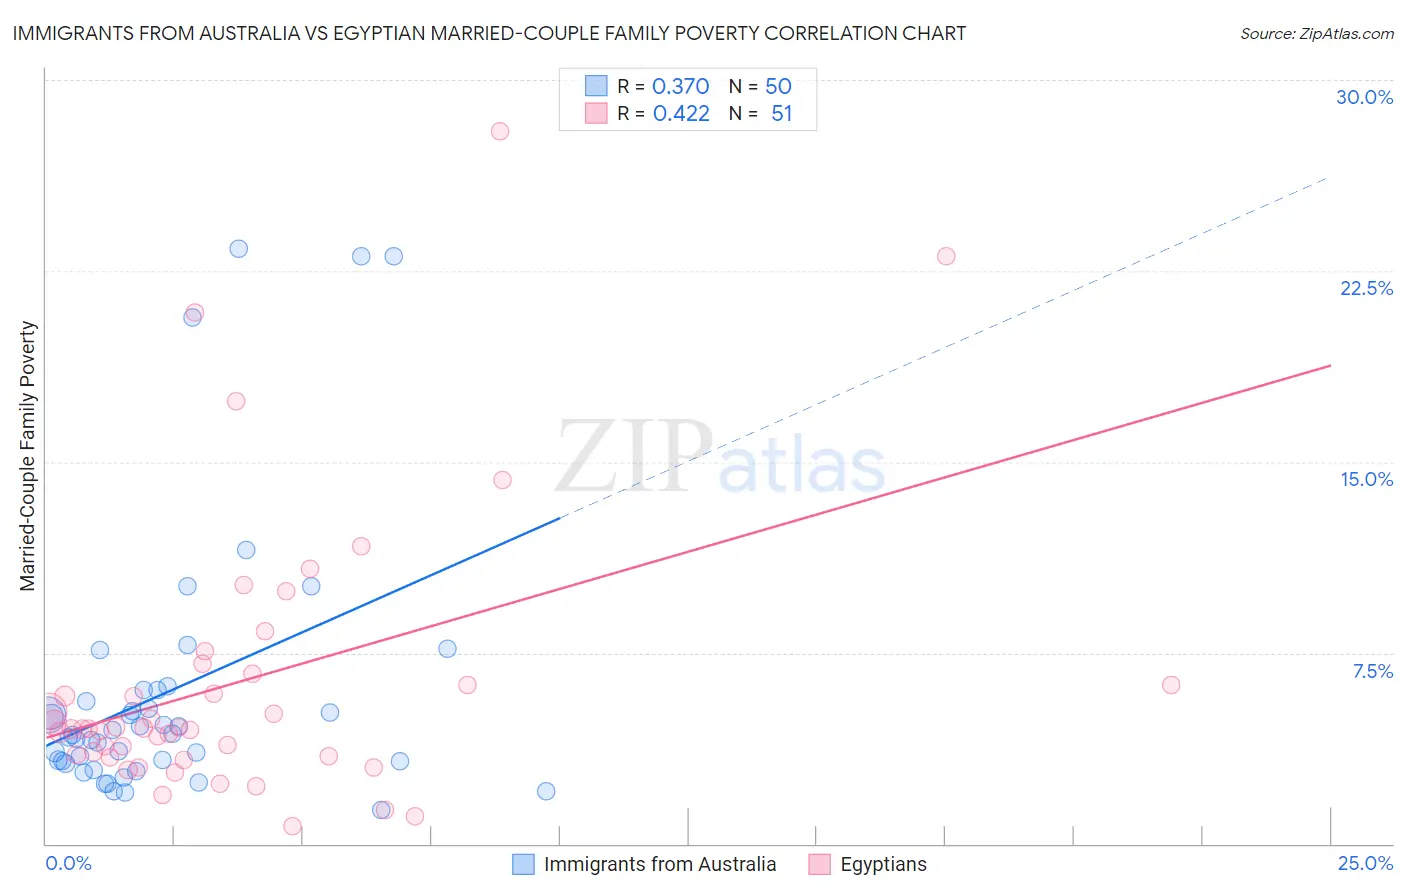
Immigrants from Australia vs Egyptian Married-Couple Family Poverty Correlation Chart
The statistical analysis conducted on geographies consisting of 225,813,318 people shows a mild positive correlation between the proportion of Immigrants from Australia and poverty level among married-couple families in the United States with a correlation coefficient (R) of 0.370 and weighted average of 4.4%. Similarly, the statistical analysis conducted on geographies consisting of 275,471,686 people shows a moderate positive correlation between the proportion of Egyptians and poverty level among married-couple families in the United States with a correlation coefficient (R) of 0.422 and weighted average of 4.8%, a difference of 10.6%.
Married-Couple Family Poverty Correlation Summary
| Measurement | Immigrants from Australia | Egyptian |
| Minimum | 1.3% | 0.67% |
| Maximum | 23.4% | 28.0% |
| Range | 22.1% | 27.3% |
| Mean | 6.0% | 6.4% |
| Median | 4.3% | 4.5% |
| Interquartile 25% (IQ1) | 3.2% | 3.4% |
| Interquartile 75% (IQ3) | 6.0% | 6.7% |
| Interquartile Range (IQR) | 2.8% | 3.2% |
| Standard Deviation (Sample) | 5.4% | 5.5% |
| Standard Deviation (Population) | 5.3% | 5.5% |
Similar Demographics by Married-Couple Family Poverty
Demographics Similar to Immigrants from Australia by Married-Couple Family Poverty
In terms of married-couple family poverty, the demographic groups most similar to Immigrants from Australia are Okinawan (4.4%, a difference of 0.010%), Tlingit-Haida (4.4%, a difference of 0.12%), Immigrants from Sweden (4.4%, a difference of 0.19%), Immigrants from Sri Lanka (4.4%, a difference of 0.36%), and Czechoslovakian (4.4%, a difference of 0.74%).
| Demographics | Rating | Rank | Married-Couple Family Poverty |
| French | 99.7 /100 | #55 | Exceptional 4.3% |
| Immigrants | Zimbabwe | 99.7 /100 | #56 | Exceptional 4.3% |
| Immigrants | Netherlands | 99.7 /100 | #57 | Exceptional 4.3% |
| Czechoslovakians | 99.7 /100 | #58 | Exceptional 4.4% |
| Immigrants | Sweden | 99.6 /100 | #59 | Exceptional 4.4% |
| Tlingit-Haida | 99.6 /100 | #60 | Exceptional 4.4% |
| Okinawans | 99.6 /100 | #61 | Exceptional 4.4% |
| Immigrants | Australia | 99.6 /100 | #62 | Exceptional 4.4% |
| Immigrants | Sri Lanka | 99.6 /100 | #63 | Exceptional 4.4% |
| Immigrants | Bulgaria | 99.5 /100 | #64 | Exceptional 4.4% |
| Macedonians | 99.4 /100 | #65 | Exceptional 4.4% |
| Immigrants | Serbia | 99.4 /100 | #66 | Exceptional 4.4% |
| Immigrants | Canada | 99.4 /100 | #67 | Exceptional 4.4% |
| Slavs | 99.4 /100 | #68 | Exceptional 4.4% |
| New Zealanders | 99.4 /100 | #69 | Exceptional 4.4% |
Demographics Similar to Egyptians by Married-Couple Family Poverty
In terms of married-couple family poverty, the demographic groups most similar to Egyptians are Immigrants from Asia (4.8%, a difference of 0.14%), Immigrants from Bosnia and Herzegovina (4.8%, a difference of 0.21%), Romanian (4.8%, a difference of 0.23%), Palestinian (4.9%, a difference of 0.32%), and Jordanian (4.8%, a difference of 0.50%).
| Demographics | Rating | Rank | Married-Couple Family Poverty |
| Immigrants | Southern Europe | 93.4 /100 | #120 | Exceptional 4.8% |
| Indians (Asian) | 93.2 /100 | #121 | Exceptional 4.8% |
| Whites/Caucasians | 93.1 /100 | #122 | Exceptional 4.8% |
| Jordanians | 93.1 /100 | #123 | Exceptional 4.8% |
| Romanians | 92.5 /100 | #124 | Exceptional 4.8% |
| Immigrants | Bosnia and Herzegovina | 92.5 /100 | #125 | Exceptional 4.8% |
| Immigrants | Asia | 92.3 /100 | #126 | Exceptional 4.8% |
| Egyptians | 92.0 /100 | #127 | Exceptional 4.8% |
| Palestinians | 91.2 /100 | #128 | Exceptional 4.9% |
| Immigrants | Pakistan | 90.7 /100 | #129 | Exceptional 4.9% |
| Soviet Union | 90.7 /100 | #130 | Exceptional 4.9% |
| Immigrants | Eastern Europe | 90.5 /100 | #131 | Exceptional 4.9% |
| Puget Sound Salish | 90.4 /100 | #132 | Exceptional 4.9% |
| Immigrants | Kenya | 90.2 /100 | #133 | Exceptional 4.9% |
| Samoans | 90.2 /100 | #134 | Exceptional 4.9% |