Houma vs Immigrants from Belarus Receiving Food Stamps
COMPARE
Houma
Immigrants from Belarus
Receiving Food Stamps
Receiving Food Stamps Comparison
Houma
Immigrants from Belarus
16.5%
RECEIVING FOOD STAMPS
0.0/ 100
METRIC RATING
307th/ 347
METRIC RANK
11.5%
RECEIVING FOOD STAMPS
62.8/ 100
METRIC RATING
166th/ 347
METRIC RANK
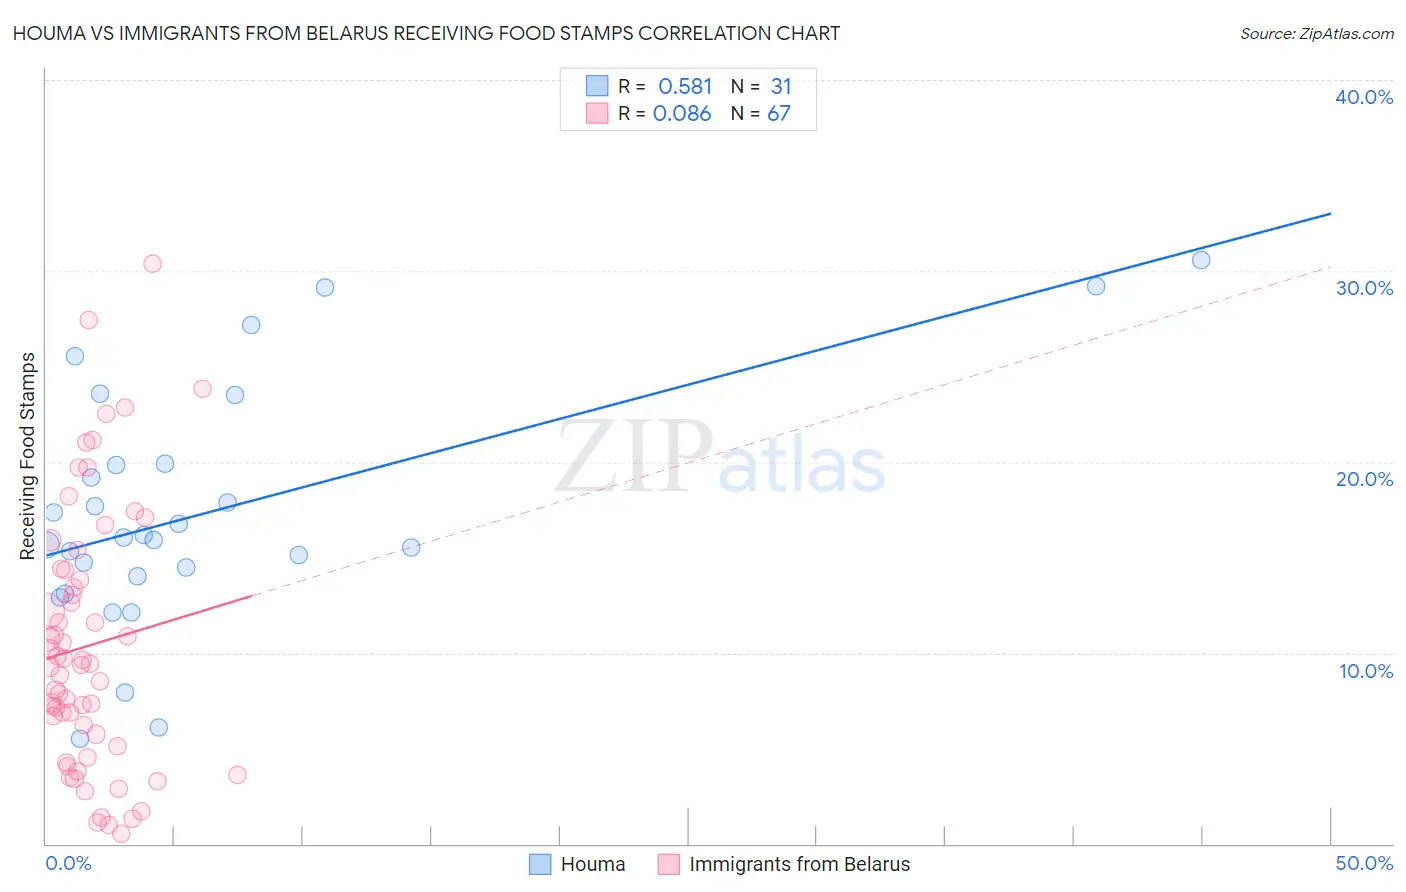
Houma vs Immigrants from Belarus Receiving Food Stamps Correlation Chart
The statistical analysis conducted on geographies consisting of 36,773,946 people shows a substantial positive correlation between the proportion of Houma and percentage of population receiving government assistance and/or food stamps in the United States with a correlation coefficient (R) of 0.581 and weighted average of 16.5%. Similarly, the statistical analysis conducted on geographies consisting of 149,924,892 people shows a slight positive correlation between the proportion of Immigrants from Belarus and percentage of population receiving government assistance and/or food stamps in the United States with a correlation coefficient (R) of 0.086 and weighted average of 11.5%, a difference of 42.8%.
Receiving Food Stamps Correlation Summary
| Measurement | Houma | Immigrants from Belarus |
| Minimum | 5.5% | 0.50% |
| Maximum | 30.6% | 30.4% |
| Range | 25.1% | 29.9% |
| Mean | 17.4% | 10.4% |
| Median | 16.0% | 9.3% |
| Interquartile 25% (IQ1) | 14.0% | 5.1% |
| Interquartile 75% (IQ3) | 19.9% | 14.3% |
| Interquartile Range (IQR) | 5.9% | 9.2% |
| Standard Deviation (Sample) | 6.3% | 6.8% |
| Standard Deviation (Population) | 6.2% | 6.8% |
Similar Demographics by Receiving Food Stamps
Demographics Similar to Houma by Receiving Food Stamps
In terms of receiving food stamps, the demographic groups most similar to Houma are Barbadian (16.5%, a difference of 0.26%), Jamaican (16.4%, a difference of 0.29%), Immigrants from the Azores (16.4%, a difference of 0.35%), U.S. Virgin Islander (16.5%, a difference of 0.50%), and Immigrants from Barbados (16.6%, a difference of 1.1%).
| Demographics | Rating | Rank | Receiving Food Stamps |
| Immigrants | Bangladesh | 0.0 /100 | #300 | Tragic 15.9% |
| Trinidadians and Tobagonians | 0.0 /100 | #301 | Tragic 16.0% |
| Immigrants | West Indies | 0.0 /100 | #302 | Tragic 16.1% |
| Nicaraguans | 0.0 /100 | #303 | Tragic 16.1% |
| West Indians | 0.0 /100 | #304 | Tragic 16.3% |
| Immigrants | Azores | 0.0 /100 | #305 | Tragic 16.4% |
| Jamaicans | 0.0 /100 | #306 | Tragic 16.4% |
| Houma | 0.0 /100 | #307 | Tragic 16.5% |
| Barbadians | 0.0 /100 | #308 | Tragic 16.5% |
| U.S. Virgin Islanders | 0.0 /100 | #309 | Tragic 16.5% |
| Immigrants | Barbados | 0.0 /100 | #310 | Tragic 16.6% |
| Guyanese | 0.0 /100 | #311 | Tragic 16.7% |
| Sioux | 0.0 /100 | #312 | Tragic 16.8% |
| Immigrants | Jamaica | 0.0 /100 | #313 | Tragic 16.9% |
| Immigrants | Guyana | 0.0 /100 | #314 | Tragic 16.9% |
Demographics Similar to Immigrants from Belarus by Receiving Food Stamps
In terms of receiving food stamps, the demographic groups most similar to Immigrants from Belarus are Arab (11.5%, a difference of 0.30%), Immigrants from Chile (11.5%, a difference of 0.35%), Kenyan (11.6%, a difference of 0.38%), Immigrants from Southern Europe (11.5%, a difference of 0.47%), and Tlingit-Haida (11.6%, a difference of 0.54%).
| Demographics | Rating | Rank | Receiving Food Stamps |
| Immigrants | Oceania | 70.4 /100 | #159 | Good 11.4% |
| French Canadians | 69.5 /100 | #160 | Good 11.4% |
| Pennsylvania Germans | 68.4 /100 | #161 | Good 11.4% |
| Alsatians | 68.0 /100 | #162 | Good 11.4% |
| Immigrants | Southern Europe | 65.8 /100 | #163 | Good 11.5% |
| Immigrants | Chile | 65.0 /100 | #164 | Good 11.5% |
| Arabs | 64.7 /100 | #165 | Good 11.5% |
| Immigrants | Belarus | 62.8 /100 | #166 | Good 11.5% |
| Kenyans | 60.2 /100 | #167 | Good 11.6% |
| Tlingit-Haida | 59.1 /100 | #168 | Average 11.6% |
| Immigrants | Eastern Africa | 58.3 /100 | #169 | Average 11.6% |
| Costa Ricans | 57.9 /100 | #170 | Average 11.6% |
| Immigrants | Western Asia | 56.4 /100 | #171 | Average 11.6% |
| Guamanians/Chamorros | 54.2 /100 | #172 | Average 11.7% |
| Immigrants | Syria | 53.4 /100 | #173 | Average 11.7% |