European vs Immigrants from Belarus Receiving Food Stamps
COMPARE
European
Immigrants from Belarus
Receiving Food Stamps
Receiving Food Stamps Comparison
Europeans
Immigrants from Belarus
9.5%
RECEIVING FOOD STAMPS
99.6/ 100
METRIC RATING
37th/ 347
METRIC RANK
11.5%
RECEIVING FOOD STAMPS
62.8/ 100
METRIC RATING
166th/ 347
METRIC RANK
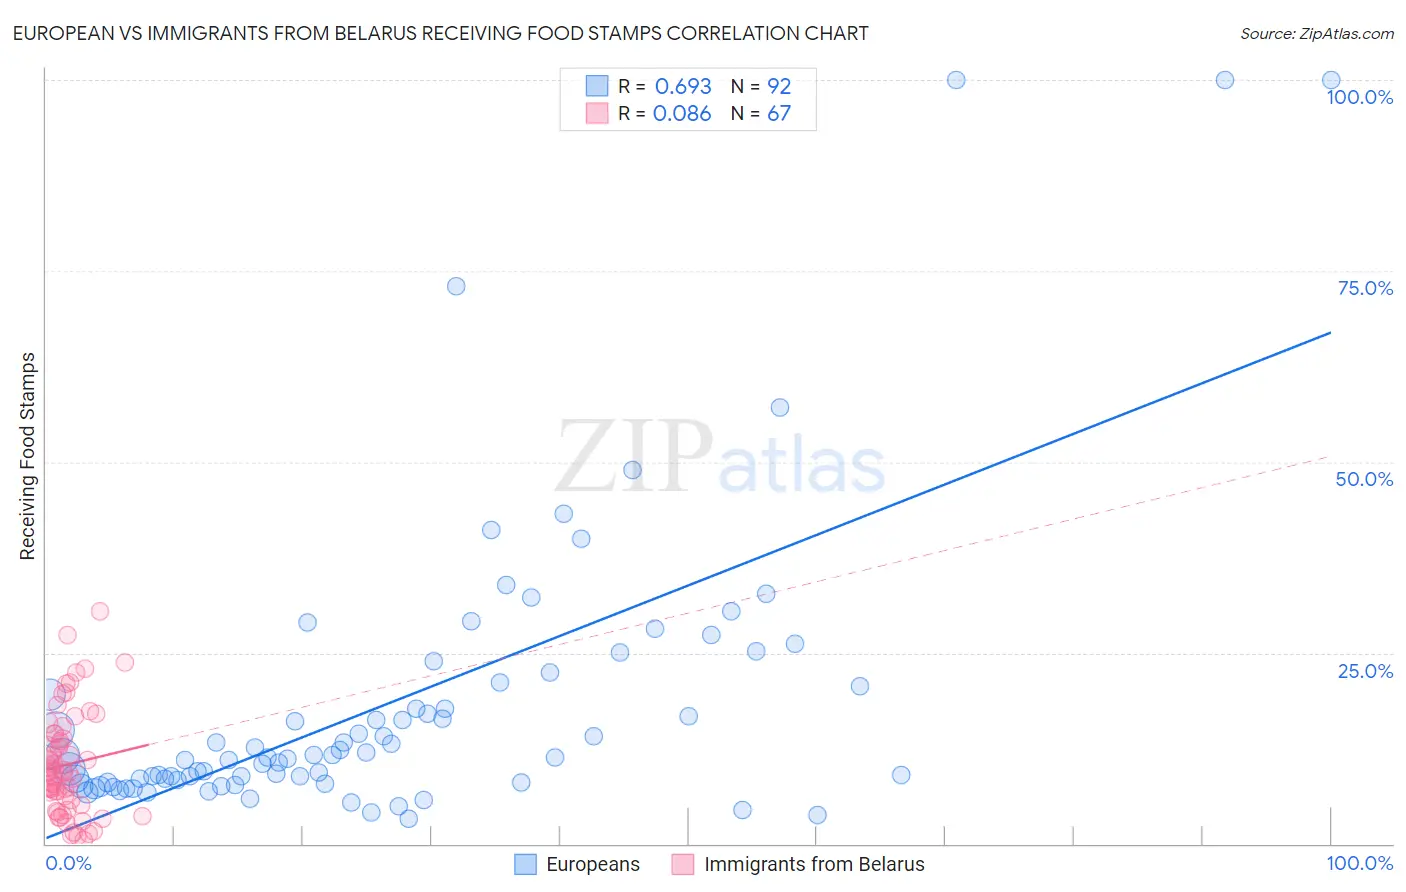
European vs Immigrants from Belarus Receiving Food Stamps Correlation Chart
The statistical analysis conducted on geographies consisting of 558,520,577 people shows a significant positive correlation between the proportion of Europeans and percentage of population receiving government assistance and/or food stamps in the United States with a correlation coefficient (R) of 0.693 and weighted average of 9.5%. Similarly, the statistical analysis conducted on geographies consisting of 149,924,892 people shows a slight positive correlation between the proportion of Immigrants from Belarus and percentage of population receiving government assistance and/or food stamps in the United States with a correlation coefficient (R) of 0.086 and weighted average of 11.5%, a difference of 21.4%.
Receiving Food Stamps Correlation Summary
| Measurement | European | Immigrants from Belarus |
| Minimum | 3.2% | 0.50% |
| Maximum | 100.0% | 30.4% |
| Range | 96.8% | 29.9% |
| Mean | 18.5% | 10.4% |
| Median | 11.4% | 9.3% |
| Interquartile 25% (IQ1) | 8.2% | 5.1% |
| Interquartile 75% (IQ3) | 20.8% | 14.3% |
| Interquartile Range (IQR) | 12.6% | 9.2% |
| Standard Deviation (Sample) | 19.3% | 6.8% |
| Standard Deviation (Population) | 19.2% | 6.8% |
Similar Demographics by Receiving Food Stamps
Demographics Similar to Europeans by Receiving Food Stamps
In terms of receiving food stamps, the demographic groups most similar to Europeans are Estonian (9.5%, a difference of 0.070%), Immigrants from Austria (9.5%, a difference of 0.090%), Turkish (9.5%, a difference of 0.12%), Zimbabwean (9.5%, a difference of 0.13%), and Immigrants from Sri Lanka (9.5%, a difference of 0.29%).
| Demographics | Rating | Rank | Receiving Food Stamps |
| Immigrants | Sweden | 99.7 /100 | #30 | Exceptional 9.3% |
| Immigrants | Eastern Asia | 99.7 /100 | #31 | Exceptional 9.3% |
| Bolivians | 99.7 /100 | #32 | Exceptional 9.3% |
| Zimbabweans | 99.6 /100 | #33 | Exceptional 9.5% |
| Turks | 99.6 /100 | #34 | Exceptional 9.5% |
| Immigrants | Austria | 99.6 /100 | #35 | Exceptional 9.5% |
| Estonians | 99.6 /100 | #36 | Exceptional 9.5% |
| Europeans | 99.6 /100 | #37 | Exceptional 9.5% |
| Immigrants | Sri Lanka | 99.5 /100 | #38 | Exceptional 9.5% |
| Immigrants | Bolivia | 99.5 /100 | #39 | Exceptional 9.5% |
| Immigrants | Netherlands | 99.5 /100 | #40 | Exceptional 9.5% |
| Cambodians | 99.5 /100 | #41 | Exceptional 9.5% |
| Immigrants | China | 99.5 /100 | #42 | Exceptional 9.6% |
| Croatians | 99.5 /100 | #43 | Exceptional 9.6% |
| Immigrants | Denmark | 99.4 /100 | #44 | Exceptional 9.6% |
Demographics Similar to Immigrants from Belarus by Receiving Food Stamps
In terms of receiving food stamps, the demographic groups most similar to Immigrants from Belarus are Arab (11.5%, a difference of 0.30%), Immigrants from Chile (11.5%, a difference of 0.35%), Kenyan (11.6%, a difference of 0.38%), Immigrants from Southern Europe (11.5%, a difference of 0.47%), and Tlingit-Haida (11.6%, a difference of 0.54%).
| Demographics | Rating | Rank | Receiving Food Stamps |
| Immigrants | Oceania | 70.4 /100 | #159 | Good 11.4% |
| French Canadians | 69.5 /100 | #160 | Good 11.4% |
| Pennsylvania Germans | 68.4 /100 | #161 | Good 11.4% |
| Alsatians | 68.0 /100 | #162 | Good 11.4% |
| Immigrants | Southern Europe | 65.8 /100 | #163 | Good 11.5% |
| Immigrants | Chile | 65.0 /100 | #164 | Good 11.5% |
| Arabs | 64.7 /100 | #165 | Good 11.5% |
| Immigrants | Belarus | 62.8 /100 | #166 | Good 11.5% |
| Kenyans | 60.2 /100 | #167 | Good 11.6% |
| Tlingit-Haida | 59.1 /100 | #168 | Average 11.6% |
| Immigrants | Eastern Africa | 58.3 /100 | #169 | Average 11.6% |
| Costa Ricans | 57.9 /100 | #170 | Average 11.6% |
| Immigrants | Western Asia | 56.4 /100 | #171 | Average 11.6% |
| Guamanians/Chamorros | 54.2 /100 | #172 | Average 11.7% |
| Immigrants | Syria | 53.4 /100 | #173 | Average 11.7% |