Houma vs Immigrants from Romania Receiving Food Stamps
COMPARE
Houma
Immigrants from Romania
Receiving Food Stamps
Receiving Food Stamps Comparison
Houma
Immigrants from Romania
16.5%
RECEIVING FOOD STAMPS
0.0/ 100
METRIC RATING
307th/ 347
METRIC RANK
10.0%
RECEIVING FOOD STAMPS
98.5/ 100
METRIC RATING
85th/ 347
METRIC RANK
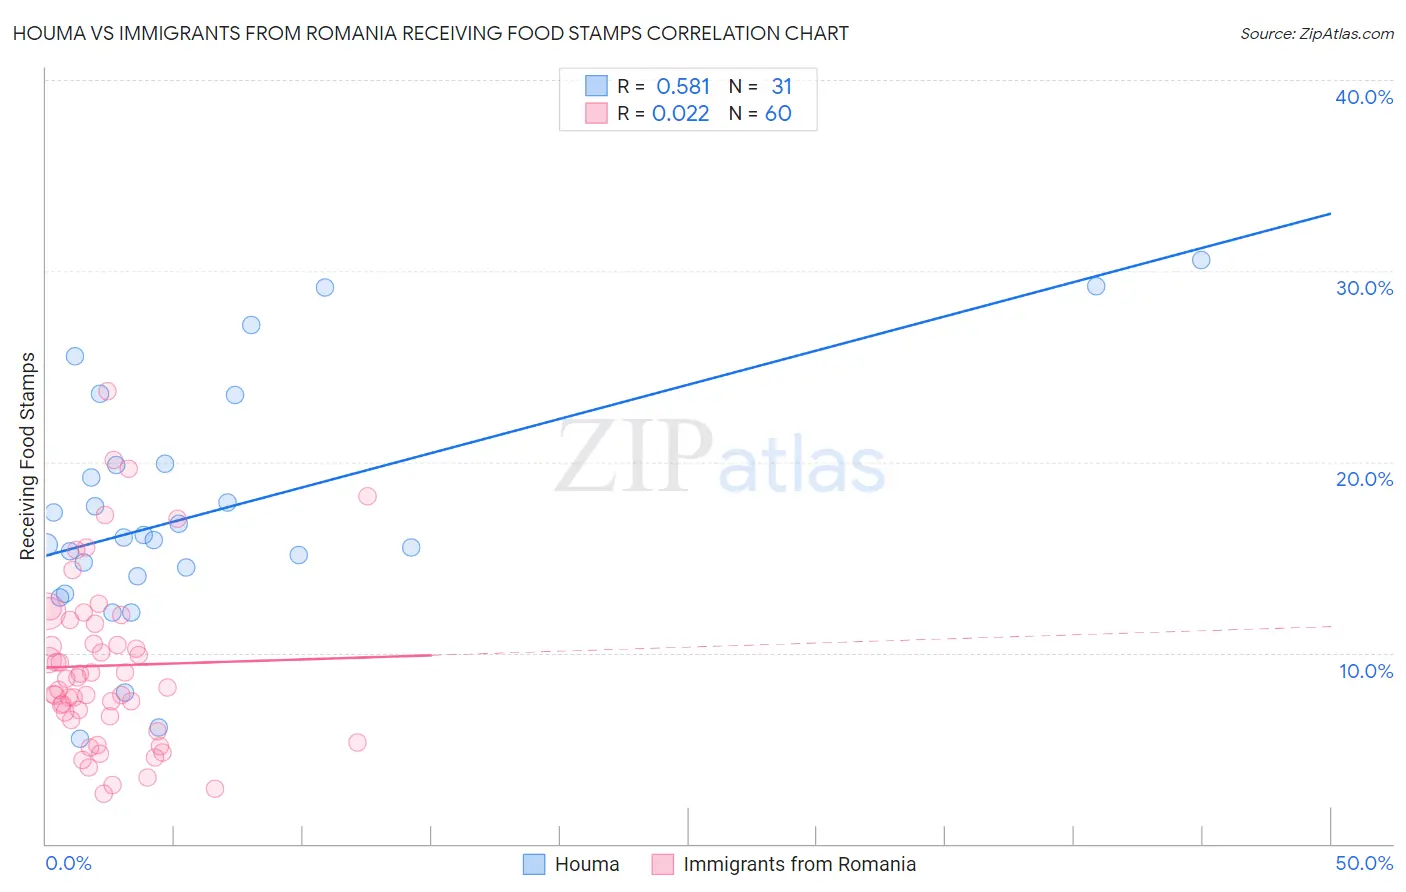
Houma vs Immigrants from Romania Receiving Food Stamps Correlation Chart
The statistical analysis conducted on geographies consisting of 36,773,946 people shows a substantial positive correlation between the proportion of Houma and percentage of population receiving government assistance and/or food stamps in the United States with a correlation coefficient (R) of 0.581 and weighted average of 16.5%. Similarly, the statistical analysis conducted on geographies consisting of 256,596,435 people shows no correlation between the proportion of Immigrants from Romania and percentage of population receiving government assistance and/or food stamps in the United States with a correlation coefficient (R) of 0.022 and weighted average of 10.0%, a difference of 64.1%.
Receiving Food Stamps Correlation Summary
| Measurement | Houma | Immigrants from Romania |
| Minimum | 5.5% | 2.6% |
| Maximum | 30.6% | 23.7% |
| Range | 25.1% | 21.1% |
| Mean | 17.4% | 9.3% |
| Median | 16.0% | 8.4% |
| Interquartile 25% (IQ1) | 14.0% | 6.6% |
| Interquartile 75% (IQ3) | 19.9% | 11.6% |
| Interquartile Range (IQR) | 5.9% | 5.1% |
| Standard Deviation (Sample) | 6.3% | 4.5% |
| Standard Deviation (Population) | 6.2% | 4.5% |
Similar Demographics by Receiving Food Stamps
Demographics Similar to Houma by Receiving Food Stamps
In terms of receiving food stamps, the demographic groups most similar to Houma are Barbadian (16.5%, a difference of 0.26%), Jamaican (16.4%, a difference of 0.29%), Immigrants from the Azores (16.4%, a difference of 0.35%), U.S. Virgin Islander (16.5%, a difference of 0.50%), and Immigrants from Barbados (16.6%, a difference of 1.1%).
| Demographics | Rating | Rank | Receiving Food Stamps |
| Immigrants | Bangladesh | 0.0 /100 | #300 | Tragic 15.9% |
| Trinidadians and Tobagonians | 0.0 /100 | #301 | Tragic 16.0% |
| Immigrants | West Indies | 0.0 /100 | #302 | Tragic 16.1% |
| Nicaraguans | 0.0 /100 | #303 | Tragic 16.1% |
| West Indians | 0.0 /100 | #304 | Tragic 16.3% |
| Immigrants | Azores | 0.0 /100 | #305 | Tragic 16.4% |
| Jamaicans | 0.0 /100 | #306 | Tragic 16.4% |
| Houma | 0.0 /100 | #307 | Tragic 16.5% |
| Barbadians | 0.0 /100 | #308 | Tragic 16.5% |
| U.S. Virgin Islanders | 0.0 /100 | #309 | Tragic 16.5% |
| Immigrants | Barbados | 0.0 /100 | #310 | Tragic 16.6% |
| Guyanese | 0.0 /100 | #311 | Tragic 16.7% |
| Sioux | 0.0 /100 | #312 | Tragic 16.8% |
| Immigrants | Jamaica | 0.0 /100 | #313 | Tragic 16.9% |
| Immigrants | Guyana | 0.0 /100 | #314 | Tragic 16.9% |
Demographics Similar to Immigrants from Romania by Receiving Food Stamps
In terms of receiving food stamps, the demographic groups most similar to Immigrants from Romania are Immigrants from Norway (10.0%, a difference of 0.10%), Egyptian (10.0%, a difference of 0.13%), Immigrants from Israel (10.0%, a difference of 0.18%), Immigrants from Kuwait (10.0%, a difference of 0.19%), and Austrian (10.0%, a difference of 0.25%).
| Demographics | Rating | Rank | Receiving Food Stamps |
| South Africans | 98.7 /100 | #78 | Exceptional 10.0% |
| Laotians | 98.7 /100 | #79 | Exceptional 10.0% |
| Poles | 98.6 /100 | #80 | Exceptional 10.0% |
| Immigrants | England | 98.6 /100 | #81 | Exceptional 10.0% |
| Austrians | 98.6 /100 | #82 | Exceptional 10.0% |
| Dutch | 98.6 /100 | #83 | Exceptional 10.0% |
| Immigrants | Israel | 98.5 /100 | #84 | Exceptional 10.0% |
| Immigrants | Romania | 98.5 /100 | #85 | Exceptional 10.0% |
| Immigrants | Norway | 98.4 /100 | #86 | Exceptional 10.0% |
| Egyptians | 98.4 /100 | #87 | Exceptional 10.0% |
| Immigrants | Kuwait | 98.4 /100 | #88 | Exceptional 10.0% |
| Immigrants | France | 98.3 /100 | #89 | Exceptional 10.1% |
| Finns | 97.9 /100 | #90 | Exceptional 10.2% |
| Jordanians | 97.9 /100 | #91 | Exceptional 10.2% |
| Irish | 97.9 /100 | #92 | Exceptional 10.2% |