Houma vs Chinese Receiving Food Stamps
COMPARE
Houma
Chinese
Receiving Food Stamps
Receiving Food Stamps Comparison
Houma
Chinese
16.5%
RECEIVING FOOD STAMPS
0.0/ 100
METRIC RATING
307th/ 347
METRIC RANK
9.8%
RECEIVING FOOD STAMPS
99.2/ 100
METRIC RATING
63rd/ 347
METRIC RANK
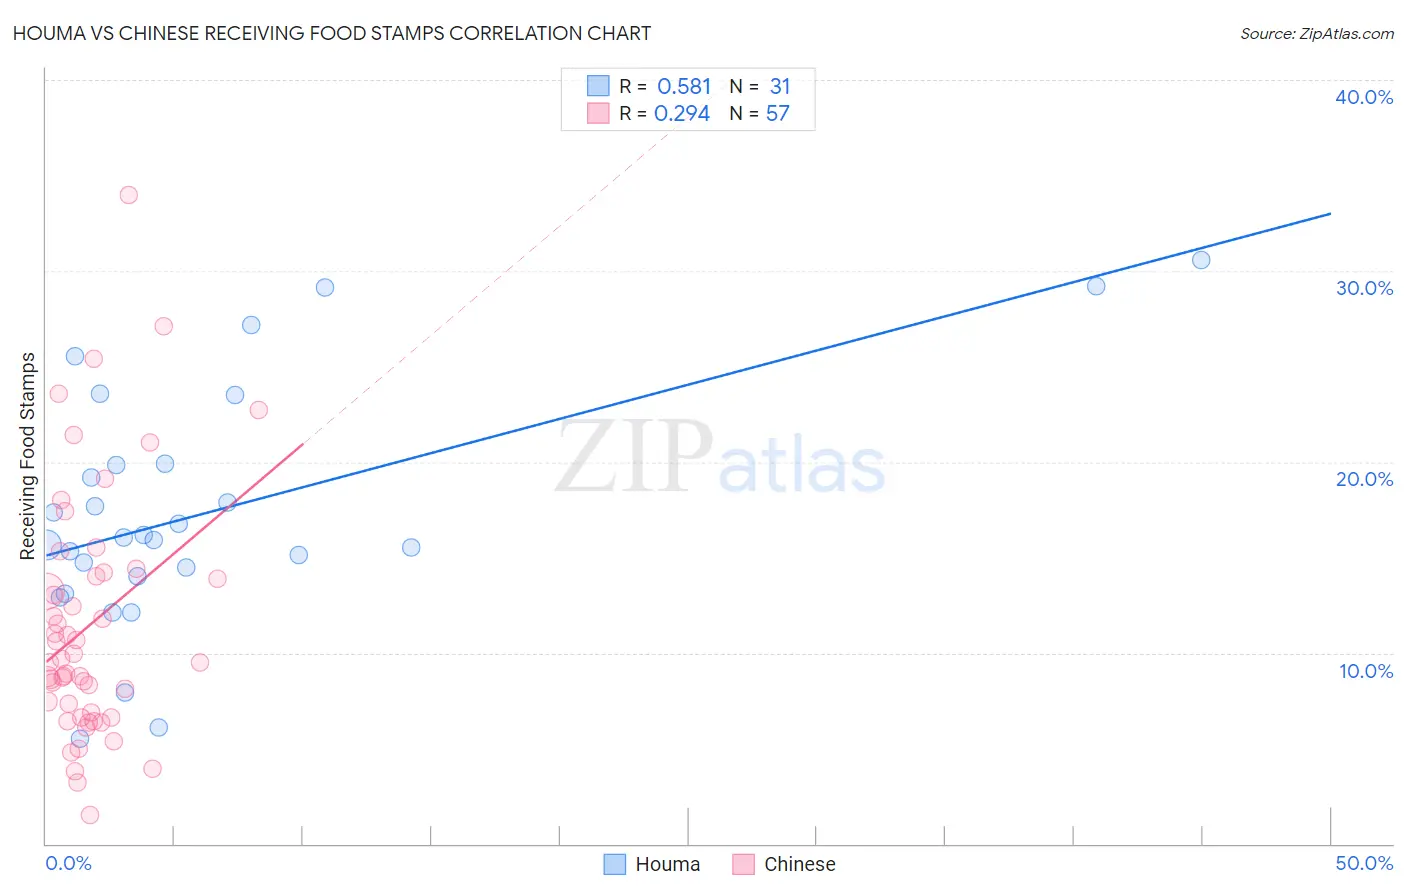
Houma vs Chinese Receiving Food Stamps Correlation Chart
The statistical analysis conducted on geographies consisting of 36,773,946 people shows a substantial positive correlation between the proportion of Houma and percentage of population receiving government assistance and/or food stamps in the United States with a correlation coefficient (R) of 0.581 and weighted average of 16.5%. Similarly, the statistical analysis conducted on geographies consisting of 64,766,872 people shows a weak positive correlation between the proportion of Chinese and percentage of population receiving government assistance and/or food stamps in the United States with a correlation coefficient (R) of 0.294 and weighted average of 9.8%, a difference of 68.4%.
Receiving Food Stamps Correlation Summary
| Measurement | Houma | Chinese |
| Minimum | 5.5% | 1.5% |
| Maximum | 30.6% | 34.0% |
| Range | 25.1% | 32.5% |
| Mean | 17.4% | 11.5% |
| Median | 16.0% | 9.5% |
| Interquartile 25% (IQ1) | 14.0% | 6.8% |
| Interquartile 75% (IQ3) | 19.9% | 14.1% |
| Interquartile Range (IQR) | 5.9% | 7.3% |
| Standard Deviation (Sample) | 6.3% | 6.5% |
| Standard Deviation (Population) | 6.2% | 6.4% |
Similar Demographics by Receiving Food Stamps
Demographics Similar to Houma by Receiving Food Stamps
In terms of receiving food stamps, the demographic groups most similar to Houma are Barbadian (16.5%, a difference of 0.26%), Jamaican (16.4%, a difference of 0.29%), Immigrants from the Azores (16.4%, a difference of 0.35%), U.S. Virgin Islander (16.5%, a difference of 0.50%), and Immigrants from Barbados (16.6%, a difference of 1.1%).
| Demographics | Rating | Rank | Receiving Food Stamps |
| Immigrants | Bangladesh | 0.0 /100 | #300 | Tragic 15.9% |
| Trinidadians and Tobagonians | 0.0 /100 | #301 | Tragic 16.0% |
| Immigrants | West Indies | 0.0 /100 | #302 | Tragic 16.1% |
| Nicaraguans | 0.0 /100 | #303 | Tragic 16.1% |
| West Indians | 0.0 /100 | #304 | Tragic 16.3% |
| Immigrants | Azores | 0.0 /100 | #305 | Tragic 16.4% |
| Jamaicans | 0.0 /100 | #306 | Tragic 16.4% |
| Houma | 0.0 /100 | #307 | Tragic 16.5% |
| Barbadians | 0.0 /100 | #308 | Tragic 16.5% |
| U.S. Virgin Islanders | 0.0 /100 | #309 | Tragic 16.5% |
| Immigrants | Barbados | 0.0 /100 | #310 | Tragic 16.6% |
| Guyanese | 0.0 /100 | #311 | Tragic 16.7% |
| Sioux | 0.0 /100 | #312 | Tragic 16.8% |
| Immigrants | Jamaica | 0.0 /100 | #313 | Tragic 16.9% |
| Immigrants | Guyana | 0.0 /100 | #314 | Tragic 16.9% |
Demographics Similar to Chinese by Receiving Food Stamps
In terms of receiving food stamps, the demographic groups most similar to Chinese are Immigrants from Bulgaria (9.8%, a difference of 0.030%), Immigrants from North America (9.8%, a difference of 0.090%), English (9.8%, a difference of 0.11%), German (9.7%, a difference of 0.25%), and Immigrants from Turkey (9.8%, a difference of 0.26%).
| Demographics | Rating | Rank | Receiving Food Stamps |
| Immigrants | Canada | 99.3 /100 | #56 | Exceptional 9.7% |
| Greeks | 99.3 /100 | #57 | Exceptional 9.7% |
| Scandinavians | 99.2 /100 | #58 | Exceptional 9.7% |
| British | 99.2 /100 | #59 | Exceptional 9.7% |
| Germans | 99.2 /100 | #60 | Exceptional 9.7% |
| English | 99.2 /100 | #61 | Exceptional 9.8% |
| Immigrants | Bulgaria | 99.2 /100 | #62 | Exceptional 9.8% |
| Chinese | 99.2 /100 | #63 | Exceptional 9.8% |
| Immigrants | North America | 99.2 /100 | #64 | Exceptional 9.8% |
| Immigrants | Turkey | 99.1 /100 | #65 | Exceptional 9.8% |
| Slovenes | 99.1 /100 | #66 | Exceptional 9.8% |
| Immigrants | Indonesia | 99.0 /100 | #67 | Exceptional 9.8% |
| Northern Europeans | 99.0 /100 | #68 | Exceptional 9.8% |
| Italians | 99.0 /100 | #69 | Exceptional 9.9% |
| Immigrants | Serbia | 99.0 /100 | #70 | Exceptional 9.9% |