Houma vs Immigrants from Burma/Myanmar Receiving Food Stamps
COMPARE
Houma
Immigrants from Burma/Myanmar
Receiving Food Stamps
Receiving Food Stamps Comparison
Houma
Immigrants from Burma/Myanmar
16.5%
RECEIVING FOOD STAMPS
0.0/ 100
METRIC RATING
307th/ 347
METRIC RANK
12.9%
RECEIVING FOOD STAMPS
6.0/ 100
METRIC RATING
217th/ 347
METRIC RANK
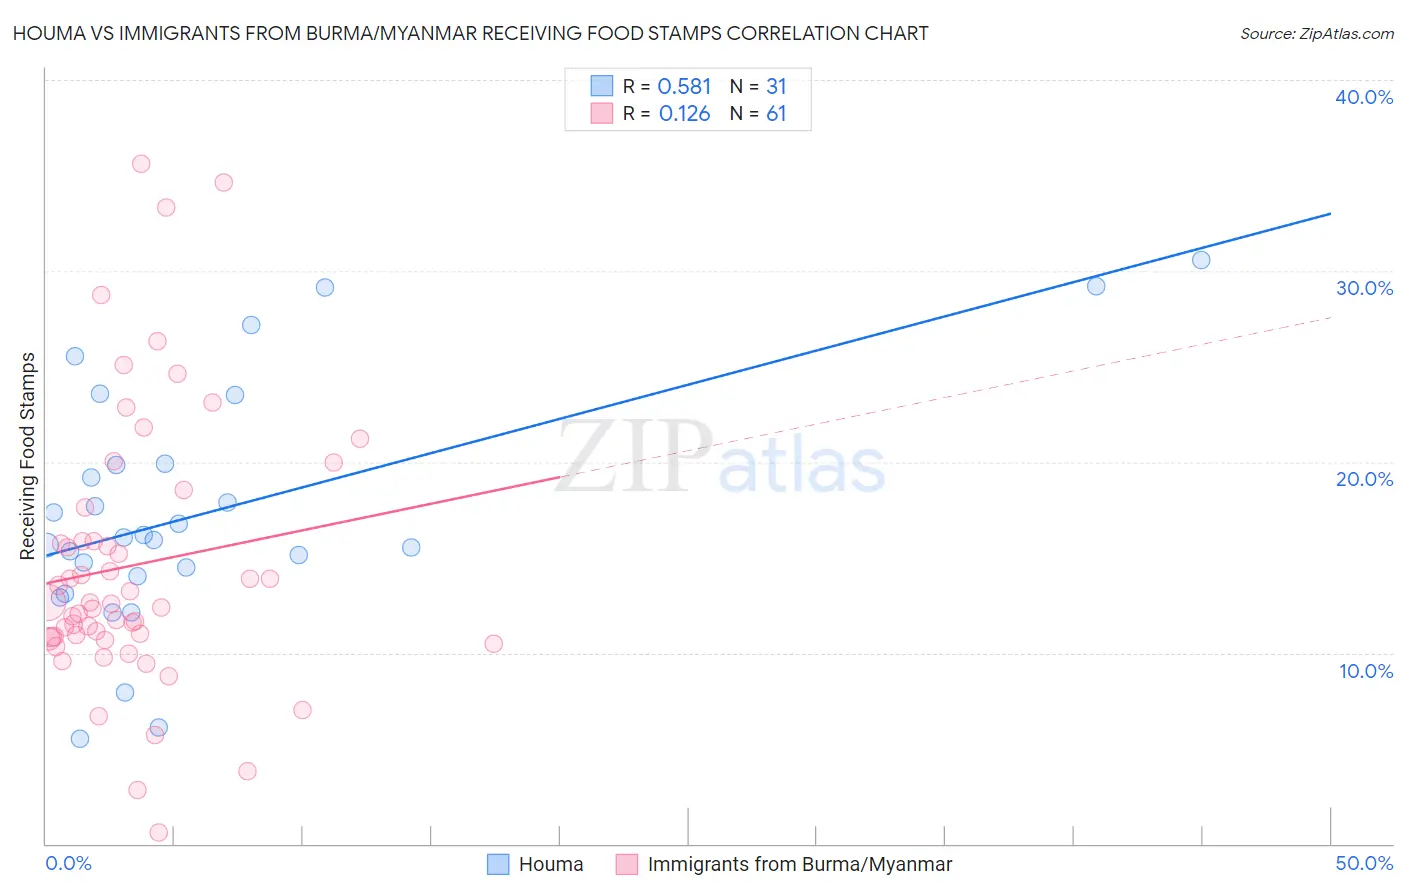
Houma vs Immigrants from Burma/Myanmar Receiving Food Stamps Correlation Chart
The statistical analysis conducted on geographies consisting of 36,773,946 people shows a substantial positive correlation between the proportion of Houma and percentage of population receiving government assistance and/or food stamps in the United States with a correlation coefficient (R) of 0.581 and weighted average of 16.5%. Similarly, the statistical analysis conducted on geographies consisting of 172,104,421 people shows a poor positive correlation between the proportion of Immigrants from Burma/Myanmar and percentage of population receiving government assistance and/or food stamps in the United States with a correlation coefficient (R) of 0.126 and weighted average of 12.9%, a difference of 27.8%.
Receiving Food Stamps Correlation Summary
| Measurement | Houma | Immigrants from Burma/Myanmar |
| Minimum | 5.5% | 0.60% |
| Maximum | 30.6% | 35.6% |
| Range | 25.1% | 35.0% |
| Mean | 17.4% | 14.6% |
| Median | 16.0% | 12.5% |
| Interquartile 25% (IQ1) | 14.0% | 10.8% |
| Interquartile 75% (IQ3) | 19.9% | 16.7% |
| Interquartile Range (IQR) | 5.9% | 6.0% |
| Standard Deviation (Sample) | 6.3% | 7.2% |
| Standard Deviation (Population) | 6.2% | 7.1% |
Similar Demographics by Receiving Food Stamps
Demographics Similar to Houma by Receiving Food Stamps
In terms of receiving food stamps, the demographic groups most similar to Houma are Barbadian (16.5%, a difference of 0.26%), Jamaican (16.4%, a difference of 0.29%), Immigrants from the Azores (16.4%, a difference of 0.35%), U.S. Virgin Islander (16.5%, a difference of 0.50%), and Immigrants from Barbados (16.6%, a difference of 1.1%).
| Demographics | Rating | Rank | Receiving Food Stamps |
| Immigrants | Bangladesh | 0.0 /100 | #300 | Tragic 15.9% |
| Trinidadians and Tobagonians | 0.0 /100 | #301 | Tragic 16.0% |
| Immigrants | West Indies | 0.0 /100 | #302 | Tragic 16.1% |
| Nicaraguans | 0.0 /100 | #303 | Tragic 16.1% |
| West Indians | 0.0 /100 | #304 | Tragic 16.3% |
| Immigrants | Azores | 0.0 /100 | #305 | Tragic 16.4% |
| Jamaicans | 0.0 /100 | #306 | Tragic 16.4% |
| Houma | 0.0 /100 | #307 | Tragic 16.5% |
| Barbadians | 0.0 /100 | #308 | Tragic 16.5% |
| U.S. Virgin Islanders | 0.0 /100 | #309 | Tragic 16.5% |
| Immigrants | Barbados | 0.0 /100 | #310 | Tragic 16.6% |
| Guyanese | 0.0 /100 | #311 | Tragic 16.7% |
| Sioux | 0.0 /100 | #312 | Tragic 16.8% |
| Immigrants | Jamaica | 0.0 /100 | #313 | Tragic 16.9% |
| Immigrants | Guyana | 0.0 /100 | #314 | Tragic 16.9% |
Demographics Similar to Immigrants from Burma/Myanmar by Receiving Food Stamps
In terms of receiving food stamps, the demographic groups most similar to Immigrants from Burma/Myanmar are Immigrants from South America (12.8%, a difference of 0.26%), Native Hawaiian (12.8%, a difference of 0.36%), Hawaiian (12.9%, a difference of 0.37%), Immigrants from Middle Africa (12.9%, a difference of 0.38%), and Immigrants from Colombia (12.9%, a difference of 0.41%).
| Demographics | Rating | Rank | Receiving Food Stamps |
| Immigrants | Uruguay | 12.8 /100 | #210 | Poor 12.5% |
| Colombians | 10.2 /100 | #211 | Poor 12.6% |
| Malaysians | 8.5 /100 | #212 | Tragic 12.7% |
| Moroccans | 7.6 /100 | #213 | Tragic 12.8% |
| Immigrants | Africa | 7.6 /100 | #214 | Tragic 12.8% |
| Native Hawaiians | 6.7 /100 | #215 | Tragic 12.8% |
| Immigrants | South America | 6.5 /100 | #216 | Tragic 12.8% |
| Immigrants | Burma/Myanmar | 6.0 /100 | #217 | Tragic 12.9% |
| Hawaiians | 5.4 /100 | #218 | Tragic 12.9% |
| Immigrants | Middle Africa | 5.4 /100 | #219 | Tragic 12.9% |
| Immigrants | Colombia | 5.3 /100 | #220 | Tragic 12.9% |
| Bermudans | 4.8 /100 | #221 | Tragic 13.0% |
| Immigrants | Immigrants | 4.4 /100 | #222 | Tragic 13.0% |
| Immigrants | Albania | 4.4 /100 | #223 | Tragic 13.0% |
| Immigrants | Armenia | 4.3 /100 | #224 | Tragic 13.0% |