Hawaiian vs Immigrants from South Eastern Asia No Schooling Completed
COMPARE
Hawaiian
Immigrants from South Eastern Asia
No Schooling Completed
No Schooling Completed Comparison
Hawaiians
Immigrants from South Eastern Asia
2.2%
NO SCHOOLING COMPLETED
27.0/ 100
METRIC RATING
195th/ 347
METRIC RANK
2.9%
NO SCHOOLING COMPLETED
0.0/ 100
METRIC RATING
301st/ 347
METRIC RANK
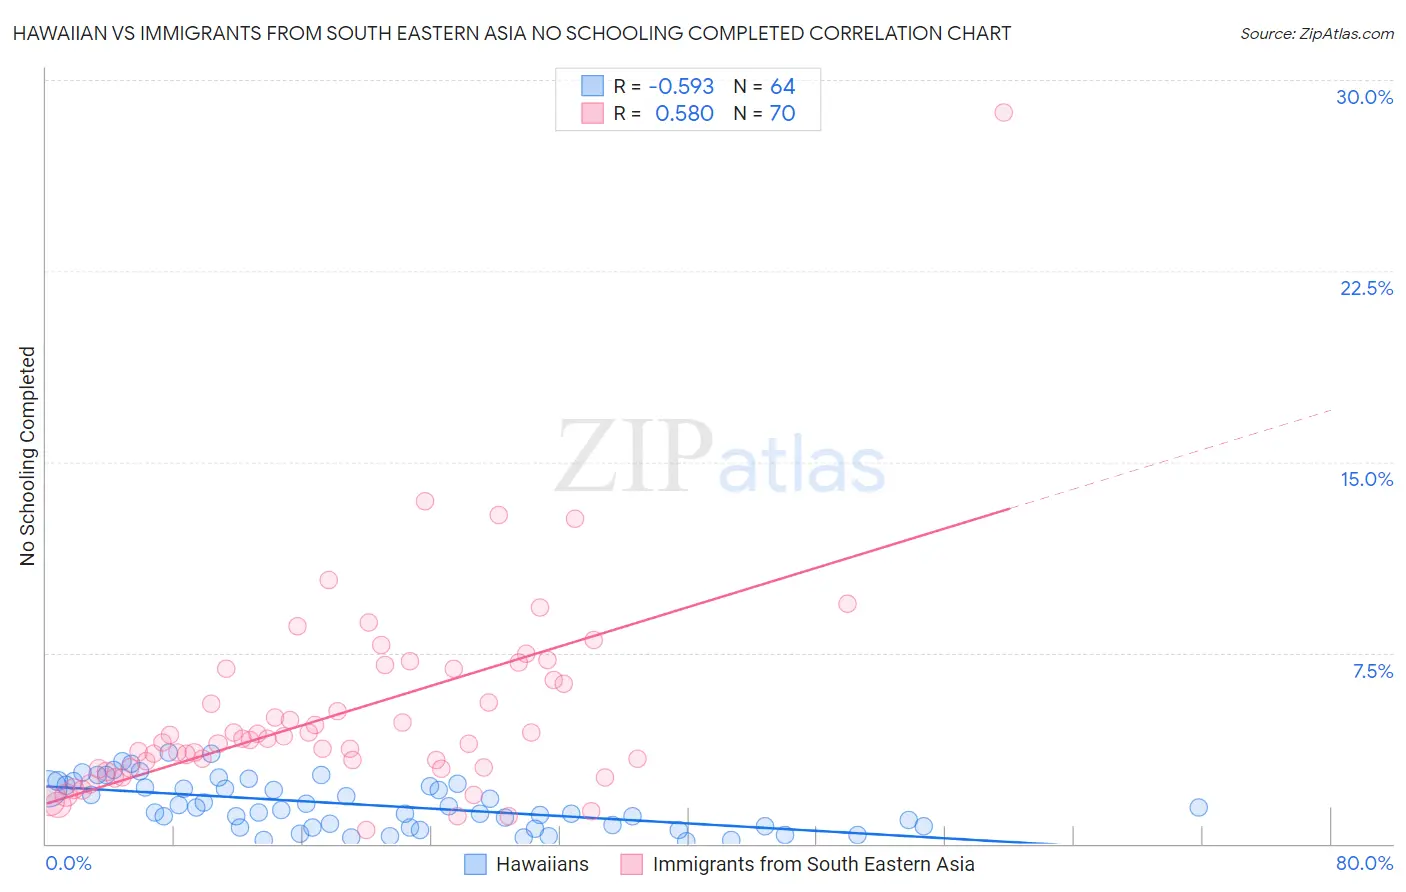
Hawaiian vs Immigrants from South Eastern Asia No Schooling Completed Correlation Chart
The statistical analysis conducted on geographies consisting of 324,490,486 people shows a substantial negative correlation between the proportion of Hawaiians and percentage of population with no schooling in the United States with a correlation coefficient (R) of -0.593 and weighted average of 2.2%. Similarly, the statistical analysis conducted on geographies consisting of 503,951,834 people shows a substantial positive correlation between the proportion of Immigrants from South Eastern Asia and percentage of population with no schooling in the United States with a correlation coefficient (R) of 0.580 and weighted average of 2.9%, a difference of 34.0%.
No Schooling Completed Correlation Summary
| Measurement | Hawaiian | Immigrants from South Eastern Asia |
| Minimum | 0.093% | 0.56% |
| Maximum | 3.6% | 28.7% |
| Range | 3.5% | 28.2% |
| Mean | 1.5% | 5.1% |
| Median | 1.4% | 4.1% |
| Interquartile 25% (IQ1) | 0.66% | 3.0% |
| Interquartile 75% (IQ3) | 2.3% | 6.9% |
| Interquartile Range (IQR) | 1.6% | 3.9% |
| Standard Deviation (Sample) | 0.96% | 4.0% |
| Standard Deviation (Population) | 0.95% | 4.0% |
Similar Demographics by No Schooling Completed
Demographics Similar to Hawaiians by No Schooling Completed
In terms of no schooling completed, the demographic groups most similar to Hawaiians are Immigrants from Ukraine (2.2%, a difference of 0.15%), Immigrants from Albania (2.2%, a difference of 0.20%), Paraguayan (2.2%, a difference of 0.37%), Guamanian/Chamorro (2.2%, a difference of 0.44%), and Immigrants from Southern Europe (2.2%, a difference of 0.56%).
| Demographics | Rating | Rank | No Schooling Completed |
| Immigrants | Kenya | 36.2 /100 | #188 | Fair 2.1% |
| Immigrants | Egypt | 36.1 /100 | #189 | Fair 2.1% |
| Spanish Americans | 32.6 /100 | #190 | Fair 2.1% |
| Bermudans | 30.7 /100 | #191 | Fair 2.1% |
| Guamanians/Chamorros | 29.8 /100 | #192 | Fair 2.2% |
| Paraguayans | 29.3 /100 | #193 | Fair 2.2% |
| Immigrants | Albania | 28.3 /100 | #194 | Fair 2.2% |
| Hawaiians | 27.0 /100 | #195 | Fair 2.2% |
| Immigrants | Ukraine | 26.1 /100 | #196 | Fair 2.2% |
| Immigrants | Southern Europe | 23.8 /100 | #197 | Fair 2.2% |
| Immigrants | Chile | 22.7 /100 | #198 | Fair 2.2% |
| Africans | 21.8 /100 | #199 | Fair 2.2% |
| Immigrants | Northern Africa | 19.5 /100 | #200 | Poor 2.2% |
| Costa Ricans | 17.1 /100 | #201 | Poor 2.2% |
| Moroccans | 13.7 /100 | #202 | Poor 2.2% |
Demographics Similar to Immigrants from South Eastern Asia by No Schooling Completed
In terms of no schooling completed, the demographic groups most similar to Immigrants from South Eastern Asia are Immigrants from Caribbean (2.9%, a difference of 0.37%), Somali (2.9%, a difference of 1.4%), Haitian (2.9%, a difference of 1.5%), Nicaraguan (2.9%, a difference of 1.5%), and Central American Indian (2.8%, a difference of 1.8%).
| Demographics | Rating | Rank | No Schooling Completed |
| Immigrants | Eritrea | 0.0 /100 | #294 | Tragic 2.8% |
| Houma | 0.0 /100 | #295 | Tragic 2.8% |
| Immigrants | Immigrants | 0.0 /100 | #296 | Tragic 2.8% |
| Immigrants | Cuba | 0.0 /100 | #297 | Tragic 2.8% |
| Immigrants | Dominica | 0.0 /100 | #298 | Tragic 2.8% |
| Central American Indians | 0.0 /100 | #299 | Tragic 2.8% |
| Haitians | 0.0 /100 | #300 | Tragic 2.9% |
| Immigrants | South Eastern Asia | 0.0 /100 | #301 | Tragic 2.9% |
| Immigrants | Caribbean | 0.0 /100 | #302 | Tragic 2.9% |
| Somalis | 0.0 /100 | #303 | Tragic 2.9% |
| Nicaraguans | 0.0 /100 | #304 | Tragic 2.9% |
| Ecuadorians | 0.0 /100 | #305 | Tragic 3.0% |
| Belizeans | 0.0 /100 | #306 | Tragic 3.0% |
| Immigrants | Haiti | 0.0 /100 | #307 | Tragic 3.0% |
| Immigrants | Somalia | 0.0 /100 | #308 | Tragic 3.0% |