Ghanaian vs Immigrants from Cameroon Male Poverty
COMPARE
Ghanaian
Immigrants from Cameroon
Male Poverty
Male Poverty Comparison
Ghanaians
Immigrants from Cameroon
12.7%
MALE POVERTY
0.4/ 100
METRIC RATING
239th/ 347
METRIC RANK
11.2%
MALE POVERTY
44.5/ 100
METRIC RATING
178th/ 347
METRIC RANK
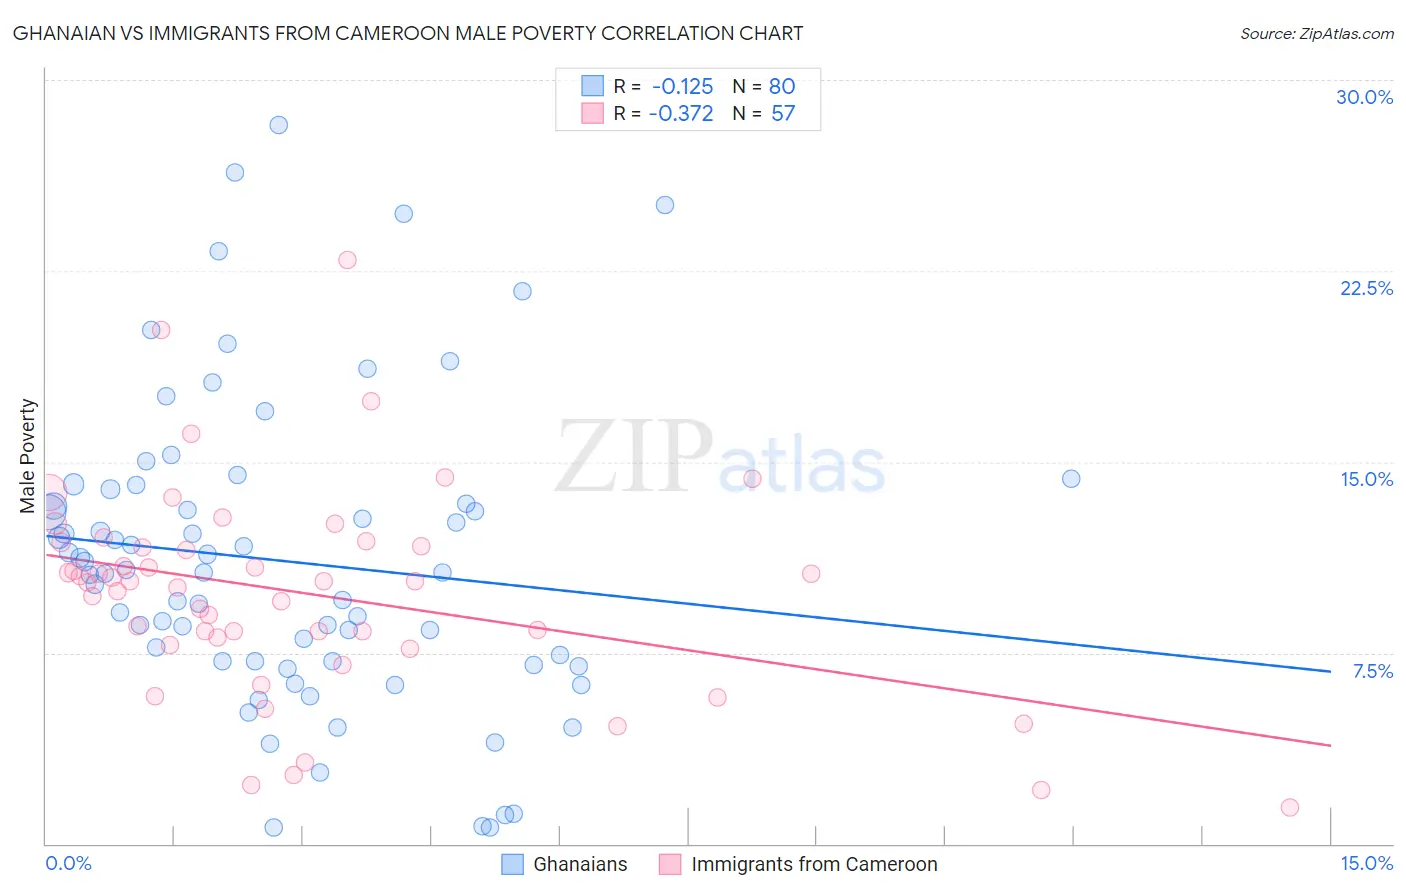
Ghanaian vs Immigrants from Cameroon Male Poverty Correlation Chart
The statistical analysis conducted on geographies consisting of 190,493,527 people shows a poor negative correlation between the proportion of Ghanaians and poverty level among males in the United States with a correlation coefficient (R) of -0.125 and weighted average of 12.7%. Similarly, the statistical analysis conducted on geographies consisting of 130,706,332 people shows a mild negative correlation between the proportion of Immigrants from Cameroon and poverty level among males in the United States with a correlation coefficient (R) of -0.372 and weighted average of 11.2%, a difference of 12.8%.
Male Poverty Correlation Summary
| Measurement | Ghanaian | Immigrants from Cameroon |
| Minimum | 0.62% | 1.4% |
| Maximum | 28.3% | 22.9% |
| Range | 27.6% | 21.5% |
| Mean | 11.1% | 9.8% |
| Median | 10.7% | 10.3% |
| Interquartile 25% (IQ1) | 7.2% | 8.0% |
| Interquartile 75% (IQ3) | 13.6% | 11.7% |
| Interquartile Range (IQR) | 6.5% | 3.8% |
| Standard Deviation (Sample) | 6.0% | 4.1% |
| Standard Deviation (Population) | 5.9% | 4.1% |
Similar Demographics by Male Poverty
Demographics Similar to Ghanaians by Male Poverty
In terms of male poverty, the demographic groups most similar to Ghanaians are Ecuadorian (12.7%, a difference of 0.0%), French American Indian (12.7%, a difference of 0.030%), Immigrants from Saudi Arabia (12.7%, a difference of 0.080%), Immigrants from Middle Africa (12.7%, a difference of 0.27%), and Immigrants from Laos (12.6%, a difference of 0.33%).
| Demographics | Rating | Rank | Male Poverty |
| Nicaraguans | 0.6 /100 | #232 | Tragic 12.6% |
| Fijians | 0.6 /100 | #233 | Tragic 12.6% |
| Immigrants | Armenia | 0.6 /100 | #234 | Tragic 12.6% |
| Immigrants | Laos | 0.5 /100 | #235 | Tragic 12.6% |
| Immigrants | Saudi Arabia | 0.4 /100 | #236 | Tragic 12.7% |
| French American Indians | 0.4 /100 | #237 | Tragic 12.7% |
| Ecuadorians | 0.4 /100 | #238 | Tragic 12.7% |
| Ghanaians | 0.4 /100 | #239 | Tragic 12.7% |
| Immigrants | Middle Africa | 0.4 /100 | #240 | Tragic 12.7% |
| Sudanese | 0.3 /100 | #241 | Tragic 12.8% |
| Nepalese | 0.3 /100 | #242 | Tragic 12.8% |
| Alaskan Athabascans | 0.3 /100 | #243 | Tragic 12.8% |
| Tsimshian | 0.3 /100 | #244 | Tragic 12.8% |
| Liberians | 0.3 /100 | #245 | Tragic 12.8% |
| Immigrants | El Salvador | 0.2 /100 | #246 | Tragic 12.8% |
Demographics Similar to Immigrants from Cameroon by Male Poverty
In terms of male poverty, the demographic groups most similar to Immigrants from Cameroon are Lebanese (11.2%, a difference of 0.11%), Immigrants from Fiji (11.2%, a difference of 0.15%), Celtic (11.2%, a difference of 0.29%), Immigrants from Syria (11.3%, a difference of 0.43%), and Immigrants from Morocco (11.3%, a difference of 0.44%).
| Demographics | Rating | Rank | Male Poverty |
| Uruguayans | 51.0 /100 | #171 | Average 11.2% |
| Immigrants | Ethiopia | 50.7 /100 | #172 | Average 11.2% |
| Pennsylvania Germans | 50.5 /100 | #173 | Average 11.2% |
| Immigrants | Oceania | 50.0 /100 | #174 | Average 11.2% |
| Celtics | 47.5 /100 | #175 | Average 11.2% |
| Immigrants | Fiji | 46.0 /100 | #176 | Average 11.2% |
| Lebanese | 45.6 /100 | #177 | Average 11.2% |
| Immigrants | Cameroon | 44.5 /100 | #178 | Average 11.2% |
| Immigrants | Syria | 40.3 /100 | #179 | Average 11.3% |
| Immigrants | Morocco | 40.1 /100 | #180 | Average 11.3% |
| Immigrants | Costa Rica | 39.5 /100 | #181 | Fair 11.3% |
| Mongolians | 39.0 /100 | #182 | Fair 11.3% |
| Kenyans | 38.4 /100 | #183 | Fair 11.3% |
| Immigrants | South America | 36.9 /100 | #184 | Fair 11.3% |
| Immigrants | Afghanistan | 33.3 /100 | #185 | Fair 11.4% |