Ghanaian vs Icelander Married-Couple Family Poverty

COMPARE

Ghanaian
Race
Ancestry
AfghanAfricanAlaska NativeAlaskan AthabascanAlbanianAleutAlsatianAmericanApacheArabArapahoArgentineanArmenianAssyrian/Chaldean/SyriacAustralianAustrianBahamianBangladeshiBarbadianBasqueBelgianBelizeanBermudanBhutaneseBlackfeetBolivianBrazilianBritishBritish West IndianBulgarianBurmeseCajunCambodianCanadianCape VerdeanCarpatho RusynCelticCentral AmericanCentral American IndianCherokeeCheyenneChickasawChileanChineseChippewaChoctawColombianColvilleComancheCosta RicanCreeCreekCroatianCrowCubanCypriotCzechCzechoslovakianDanishDelawareDominicanDutchDutch West IndianEastern EuropeanEcuadorianEgyptianEnglishEstonianEthiopianEuropeanFijianFilipinoFinnishFrenchFrench American IndianFrench CanadianGermanGerman RussianGhanaianGreekGuamanian/ChamorroGuatemalanGuyaneseHaitianHmongHonduranHopiHoumaHungarianIndian (Asian)IndonesianInupiatIranianIraqiIrishIroquoisIsraeliItalianJamaicanJapaneseJordanianKenyanKiowaKoreanLaotianLatvianLebaneseLiberianLithuanianLumbeeLuxembourgerMacedonianMalaysianMalteseMarshalleseMenomineeMexicanMexican American IndianMongolianMoroccanNative HawaiianNavajoNepaleseNew ZealanderNicaraguanNigerianNorthern EuropeanNorwegianOkinawanOsageOttawaPaiutePakistaniPalestinianPanamanianParaguayanPennsylvania GermanPeruvianPimaPolishPortuguesePotawatomiPuebloPuerto RicanPuget Sound SalishRomanianRussianSalvadoranSamoanScandinavianScotch-IrishScottishSeminoleSenegaleseSerbianShoshoneSierra LeoneanSiouxSlavicSlovakSloveneSomaliSouth AfricanSouth AmericanSouth American IndianSoviet UnionSpaniardSpanishSpanish AmericanSpanish American IndianSri LankanSubsaharan AfricanSudaneseSwedishSwissSyrianTaiwaneseThaiTlingit-HaidaTohono O'OdhamTonganTrinidadian and TobagonianTsimshianTurkishU.S. Virgin IslanderUgandanUkrainianUruguayanUteVenezuelanVietnameseWelshWest IndianYakamaYaquiYugoslavianYumanYup'ikZimbabwean
Immigration
NonimmigrantsImmigrantsAfghanistanAfricaAlbaniaArgentinaArmeniaAsiaAustraliaAustriaBahamasBangladeshBarbadosBelarusBelgiumBelizeBoliviaBosnia and HerzegovinaBrazilBulgariaBurma/MyanmarCabo VerdeCambodiaCameroonCanadaCaribbeanCentral AmericaChileChinaColombiaCongoCosta RicaCroatiaCubaCzechoslovakiaDenmarkDominicaDominican RepublicEastern AfricaEastern AsiaEastern EuropeEcuadorEgyptEl SalvadorEnglandEritreaEthiopiaEuropeFijiFranceGermanyGhanaGreeceGrenadaGuatemalaGuyanaHaitiHondurasHong KongHungaryIndiaIndonesiaIranIraqIrelandIsraelItalyJamaicaJapanJordanKazakhstanKenyaKoreaKuwaitLaosLatin AmericaLatviaLebanonLiberiaLithuaniaMalaysiaMexicoMicronesiaMiddle AfricaMoldovaMoroccoNepalNetherlandsNicaraguaNigeriaNorth AmericaNorth MacedoniaNorthern AfricaNorthern EuropeNorwayOceaniaPakistanPanamaPeruPhilippinesPolandPortugalRomaniaRussiaSaudi ArabiaScotlandSenegalSerbiaSierra LeoneSingaporeSomaliaSouth AfricaSouth AmericaSouth Central AsiaSouth Eastern AsiaSouthern EuropeSpainSri LankaSt. Vincent and the GrenadinesSudanSwedenSwitzerlandSyriaTaiwanThailandTrinidad and TobagoTurkeyUgandaUkraineUruguayUzbekistanVenezuelaVietnamWest IndiesWestern AfricaWestern AsiaWestern EuropeYemenZaireZimbabweAzores
Icelander
Race
Ancestry
AfghanAfricanAlaska NativeAlaskan AthabascanAlbanianAleutAlsatianAmericanApacheArabArapahoArgentineanArmenianAssyrian/Chaldean/SyriacAustralianAustrianBahamianBangladeshiBarbadianBasqueBelgianBelizeanBermudanBhutaneseBlackfeetBolivianBrazilianBritishBritish West IndianBulgarianBurmeseCajunCambodianCanadianCape VerdeanCarpatho RusynCelticCentral AmericanCentral American IndianCherokeeCheyenneChickasawChileanChineseChippewaChoctawColombianColvilleComancheCosta RicanCreeCreekCroatianCrowCubanCypriotCzechCzechoslovakianDanishDelawareDominicanDutchDutch West IndianEastern EuropeanEcuadorianEgyptianEnglishEstonianEthiopianEuropeanFijianFilipinoFinnishFrenchFrench American IndianFrench CanadianGermanGerman RussianGreekGuamanian/ChamorroGuatemalanGuyaneseHaitianHmongHonduranHopiHoumaHungarianIcelanderIndian (Asian)IndonesianInupiatIranianIraqiIrishIroquoisIsraeliItalianJamaicanJapaneseJordanianKenyanKiowaKoreanLaotianLatvianLebaneseLiberianLithuanianLumbeeLuxembourgerMacedonianMalaysianMalteseMarshalleseMenomineeMexicanMexican American IndianMongolianMoroccanNative HawaiianNavajoNepaleseNew ZealanderNicaraguanNigerianNorthern EuropeanNorwegianOkinawanOsageOttawaPaiutePakistaniPalestinianPanamanianParaguayanPennsylvania GermanPeruvianPimaPolishPortuguesePotawatomiPuebloPuerto RicanPuget Sound SalishRomanianRussianSalvadoranSamoanScandinavianScotch-IrishScottishSeminoleSenegaleseSerbianShoshoneSierra LeoneanSiouxSlavicSlovakSloveneSomaliSouth AfricanSouth AmericanSouth American IndianSoviet UnionSpaniardSpanishSpanish AmericanSpanish American IndianSri LankanSubsaharan AfricanSudaneseSwedishSwissSyrianTaiwaneseThaiTlingit-HaidaTohono O'OdhamTonganTrinidadian and TobagonianTsimshianTurkishU.S. Virgin IslanderUgandanUkrainianUruguayanUteVenezuelanVietnameseWelshWest IndianYakamaYaquiYugoslavianYumanYup'ikZimbabwean
Immigration
NonimmigrantsImmigrantsAfghanistanAfricaAlbaniaArgentinaArmeniaAsiaAustraliaAustriaBahamasBangladeshBarbadosBelarusBelgiumBelizeBoliviaBosnia and HerzegovinaBrazilBulgariaBurma/MyanmarCabo VerdeCambodiaCameroonCanadaCaribbeanCentral AmericaChileChinaColombiaCongoCosta RicaCroatiaCubaCzechoslovakiaDenmarkDominicaDominican RepublicEastern AfricaEastern AsiaEastern EuropeEcuadorEgyptEl SalvadorEnglandEritreaEthiopiaEuropeFijiFranceGermanyGhanaGreeceGrenadaGuatemalaGuyanaHaitiHondurasHong KongHungaryIndiaIndonesiaIranIraqIrelandIsraelItalyJamaicaJapanJordanKazakhstanKenyaKoreaKuwaitLaosLatin AmericaLatviaLebanonLiberiaLithuaniaMalaysiaMexicoMicronesiaMiddle AfricaMoldovaMoroccoNepalNetherlandsNicaraguaNigeriaNorth AmericaNorth MacedoniaNorthern AfricaNorthern EuropeNorwayOceaniaPakistanPanamaPeruPhilippinesPolandPortugalRomaniaRussiaSaudi ArabiaScotlandSenegalSerbiaSierra LeoneSingaporeSomaliaSouth AfricaSouth AmericaSouth Central AsiaSouth Eastern AsiaSouthern EuropeSpainSri LankaSt. Vincent and the GrenadinesSudanSwedenSwitzerlandSyriaTaiwanThailandTrinidad and TobagoTurkeyUgandaUkraineUruguayUzbekistanVenezuelaVietnamWest IndiesWestern AfricaWestern AsiaWestern EuropeYemenZaireZimbabweAzores
Married-Couple Family Poverty
Income
Poverty
Unemployment
Labor Participation
Family Structure
Vehicle Availability
Education Level
Disability

Married-Couple Family Poverty Comparison

Ghanaians

Icelanders

Tragic
Exceptional
5.7%
MARRIED-COUPLE FAMILY POVERTY
3.3/ 100
METRIC RATING
236th/ 347
METRIC RANK
4.5%
MARRIED-COUPLE FAMILY POVERTY
99.0/ 100
METRIC RATING
80th/ 347
METRIC RANK

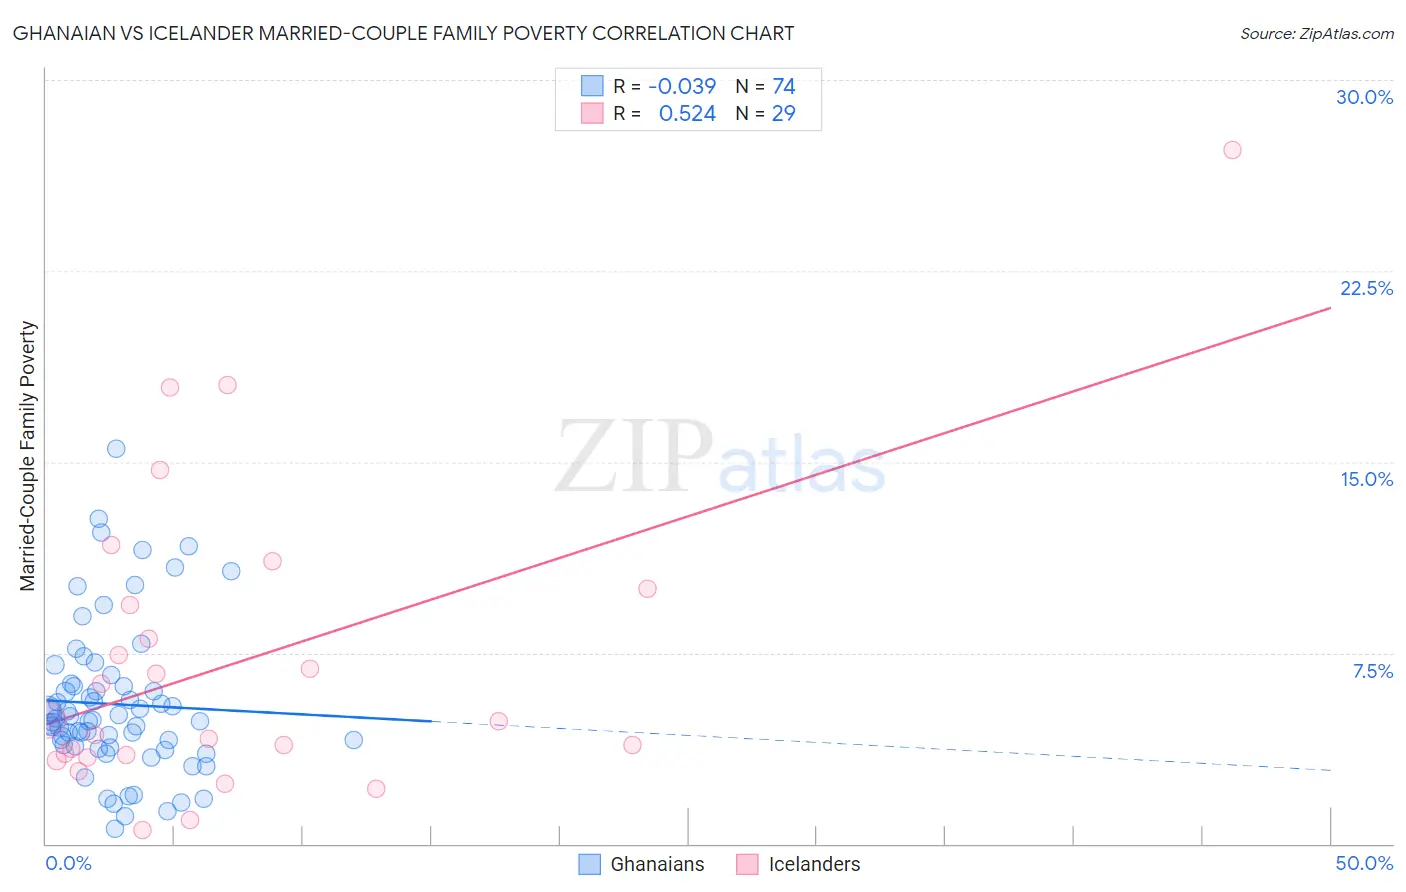
Ghanaian vs Icelander Married-Couple Family Poverty Correlation Chart

The statistical analysis conducted on geographies consisting of 189,762,764 people shows no correlation between the proportion of Ghanaians and poverty level among married-couple families in the United States with a correlation coefficient (R) of -0.039 and weighted average of 5.7%. Similarly, the statistical analysis conducted on geographies consisting of 159,057,565 people shows a substantial positive correlation between the proportion of Icelanders and poverty level among married-couple families in the United States with a correlation coefficient (R) of 0.524 and weighted average of 4.5%, a difference of 26.6%.
Ghanaian vs Icelander Married-Couple Family Poverty

Married-Couple Family Poverty Correlation Summary

MeasurementGhanaianIcelander
Minimum0.61%0.56%
Maximum15.5%27.3%
Range14.9%26.7%
Mean5.5%7.2%
Median4.8%4.8%
Interquartile 25% (IQ1)3.8%3.4%
Interquartile 75% (IQ3)6.2%9.7%
Interquartile Range (IQR)2.4%6.2%
Standard Deviation (Sample)3.0%6.0%
Standard Deviation (Population)2.9%5.9%

Similar Demographics by Married-Couple Family Poverty

Demographics Similar to Ghanaians by Married-Couple Family Poverty

In terms of married-couple family poverty, the demographic groups most similar to Ghanaians are Immigrants from Sudan (5.7%, a difference of 0.16%), Immigrants from South America (5.7%, a difference of 0.16%), Immigrants from Colombia (5.7%, a difference of 0.35%), Immigrants from Uruguay (5.7%, a difference of 0.35%), and Cherokee (5.8%, a difference of 0.53%).
DemographicsRating | RankMarried-Couple Family Poverty
Sub-Saharan Africans
4.9
/100
|
#229
Tragic
5.7%
Moroccans
4.9
/100
|
#230
Tragic
5.7%
Immigrants | Iraq
4.4
/100
|
#231
Tragic
5.7%
Immigrants | Laos
4.4
/100
|
#232
Tragic
5.7%
Immigrants | Colombia
3.7
/100
|
#233
Tragic
5.7%
Immigrants | Uruguay
3.7
/100
|
#234
Tragic
5.7%
Immigrants | Sudan
3.5
/100
|
#235
Tragic
5.7%
Ghanaians
3.3
/100
|
#236
Tragic
5.7%
Immigrants | South America
3.1
/100
|
#237
Tragic
5.7%
Cherokee
2.7
/100
|
#238
Tragic
5.8%
Venezuelans
2.7
/100
|
#239
Tragic
5.8%
Fijians
2.5
/100
|
#240
Tragic
5.8%
Immigrants | Panama
2.5
/100
|
#241
Tragic
5.8%
Immigrants | Western Africa
2.4
/100
|
#242
Tragic
5.8%
Somalis
2.3
/100
|
#243
Tragic
5.8%

Demographics Similar to Icelanders by Married-Couple Family Poverty

In terms of married-couple family poverty, the demographic groups most similar to Icelanders are Immigrants from Iran (4.5%, a difference of 0.060%), Immigrants from Greece (4.5%, a difference of 0.14%), Scotch-Irish (4.5%, a difference of 0.29%), Immigrants from Latvia (4.5%, a difference of 0.38%), and Canadian (4.5%, a difference of 0.39%).
DemographicsRating | RankMarried-Couple Family Poverty
Ukrainians
99.2
/100
|
#73
Exceptional
4.5%
Immigrants | Austria
99.2
/100
|
#74
Exceptional
4.5%
Cambodians
99.2
/100
|
#75
Exceptional
4.5%
Immigrants | South Africa
99.1
/100
|
#76
Exceptional
4.5%
Immigrants | Latvia
99.1
/100
|
#77
Exceptional
4.5%
Scotch-Irish
99.1
/100
|
#78
Exceptional
4.5%
Immigrants | Iran
99.0
/100
|
#79
Exceptional
4.5%
Icelanders
99.0
/100
|
#80
Exceptional
4.5%
Immigrants | Greece
98.9
/100
|
#81
Exceptional
4.5%
Canadians
98.8
/100
|
#82
Exceptional
4.5%
Immigrants | Denmark
98.8
/100
|
#83
Exceptional
4.6%
Immigrants | Croatia
98.7
/100
|
#84
Exceptional
4.6%
South Africans
98.7
/100
|
#85
Exceptional
4.6%
Immigrants | Turkey
98.6
/100
|
#86
Exceptional
4.6%
Immigrants | North Macedonia
98.6
/100
|
#87
Exceptional
4.6%