Eastern European vs Austrian Married-Couple Family Poverty
COMPARE
Eastern European
Austrian
Married-Couple Family Poverty
Married-Couple Family Poverty Comparison
Eastern Europeans
Austrians
4.1%
MARRIED-COUPLE FAMILY POVERTY
99.9/ 100
METRIC RATING
24th/ 347
METRIC RANK
4.3%
MARRIED-COUPLE FAMILY POVERTY
99.7/ 100
METRIC RATING
54th/ 347
METRIC RANK
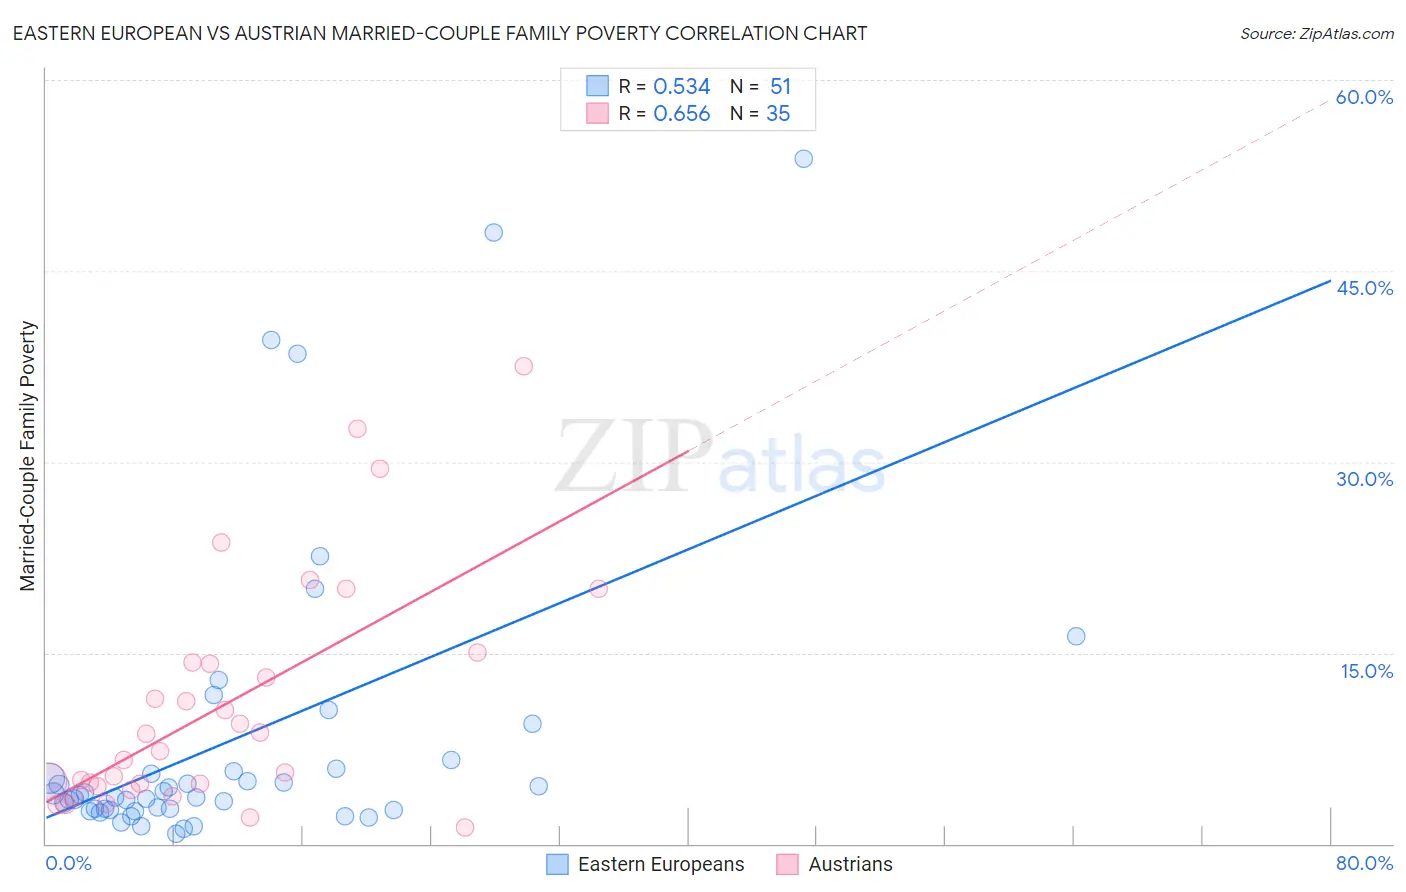
Eastern European vs Austrian Married-Couple Family Poverty Correlation Chart
The statistical analysis conducted on geographies consisting of 454,266,648 people shows a substantial positive correlation between the proportion of Eastern Europeans and poverty level among married-couple families in the United States with a correlation coefficient (R) of 0.534 and weighted average of 4.1%. Similarly, the statistical analysis conducted on geographies consisting of 445,465,391 people shows a significant positive correlation between the proportion of Austrians and poverty level among married-couple families in the United States with a correlation coefficient (R) of 0.656 and weighted average of 4.3%, a difference of 5.7%.
Married-Couple Family Poverty Correlation Summary
| Measurement | Eastern European | Austrian |
| Minimum | 0.83% | 1.3% |
| Maximum | 53.8% | 37.5% |
| Range | 53.0% | 36.2% |
| Mean | 8.3% | 10.8% |
| Median | 3.8% | 7.2% |
| Interquartile 25% (IQ1) | 2.7% | 4.5% |
| Interquartile 75% (IQ3) | 5.9% | 14.3% |
| Interquartile Range (IQR) | 3.2% | 9.8% |
| Standard Deviation (Sample) | 11.8% | 9.1% |
| Standard Deviation (Population) | 11.7% | 9.0% |
Similar Demographics by Married-Couple Family Poverty
Demographics Similar to Eastern Europeans by Married-Couple Family Poverty
In terms of married-couple family poverty, the demographic groups most similar to Eastern Europeans are Bhutanese (4.1%, a difference of 0.23%), Immigrants from Singapore (4.1%, a difference of 0.26%), Immigrants from Taiwan (4.1%, a difference of 0.57%), Zimbabwean (4.1%, a difference of 0.62%), and Maltese (4.1%, a difference of 0.65%).
| Demographics | Rating | Rank | Married-Couple Family Poverty |
| Filipinos | 100.0 /100 | #17 | Exceptional 4.0% |
| Italians | 100.0 /100 | #18 | Exceptional 4.0% |
| Immigrants | Ireland | 99.9 /100 | #19 | Exceptional 4.1% |
| Maltese | 99.9 /100 | #20 | Exceptional 4.1% |
| Zimbabweans | 99.9 /100 | #21 | Exceptional 4.1% |
| Immigrants | Singapore | 99.9 /100 | #22 | Exceptional 4.1% |
| Bhutanese | 99.9 /100 | #23 | Exceptional 4.1% |
| Eastern Europeans | 99.9 /100 | #24 | Exceptional 4.1% |
| Immigrants | Taiwan | 99.9 /100 | #25 | Exceptional 4.1% |
| Cypriots | 99.9 /100 | #26 | Exceptional 4.1% |
| Danes | 99.9 /100 | #27 | Exceptional 4.1% |
| Scandinavians | 99.9 /100 | #28 | Exceptional 4.1% |
| Immigrants | Scotland | 99.9 /100 | #29 | Exceptional 4.2% |
| Finns | 99.9 /100 | #30 | Exceptional 4.2% |
| Estonians | 99.9 /100 | #31 | Exceptional 4.2% |
Demographics Similar to Austrians by Married-Couple Family Poverty
In terms of married-couple family poverty, the demographic groups most similar to Austrians are French (4.3%, a difference of 0.020%), Immigrants from Zimbabwe (4.3%, a difference of 0.18%), Immigrants from Netherlands (4.3%, a difference of 0.18%), Welsh (4.3%, a difference of 0.26%), and Czechoslovakian (4.4%, a difference of 0.27%).
| Demographics | Rating | Rank | Married-Couple Family Poverty |
| Immigrants | South Central Asia | 99.8 /100 | #47 | Exceptional 4.3% |
| Australians | 99.7 /100 | #48 | Exceptional 4.3% |
| Turks | 99.7 /100 | #49 | Exceptional 4.3% |
| Burmese | 99.7 /100 | #50 | Exceptional 4.3% |
| Immigrants | Lithuania | 99.7 /100 | #51 | Exceptional 4.3% |
| Russians | 99.7 /100 | #52 | Exceptional 4.3% |
| Welsh | 99.7 /100 | #53 | Exceptional 4.3% |
| Austrians | 99.7 /100 | #54 | Exceptional 4.3% |
| French | 99.7 /100 | #55 | Exceptional 4.3% |
| Immigrants | Zimbabwe | 99.7 /100 | #56 | Exceptional 4.3% |
| Immigrants | Netherlands | 99.7 /100 | #57 | Exceptional 4.3% |
| Czechoslovakians | 99.7 /100 | #58 | Exceptional 4.4% |
| Immigrants | Sweden | 99.6 /100 | #59 | Exceptional 4.4% |
| Tlingit-Haida | 99.6 /100 | #60 | Exceptional 4.4% |
| Okinawans | 99.6 /100 | #61 | Exceptional 4.4% |