Dutch West Indian vs Immigrants from Kuwait Married-Couple Family Poverty
COMPARE
Dutch West Indian
Immigrants from Kuwait
Married-Couple Family Poverty
Married-Couple Family Poverty Comparison
Dutch West Indians
Immigrants from Kuwait
6.4%
MARRIED-COUPLE FAMILY POVERTY
0.0/ 100
METRIC RATING
284th/ 347
METRIC RANK
5.0%
MARRIED-COUPLE FAMILY POVERTY
76.3/ 100
METRIC RATING
153rd/ 347
METRIC RANK
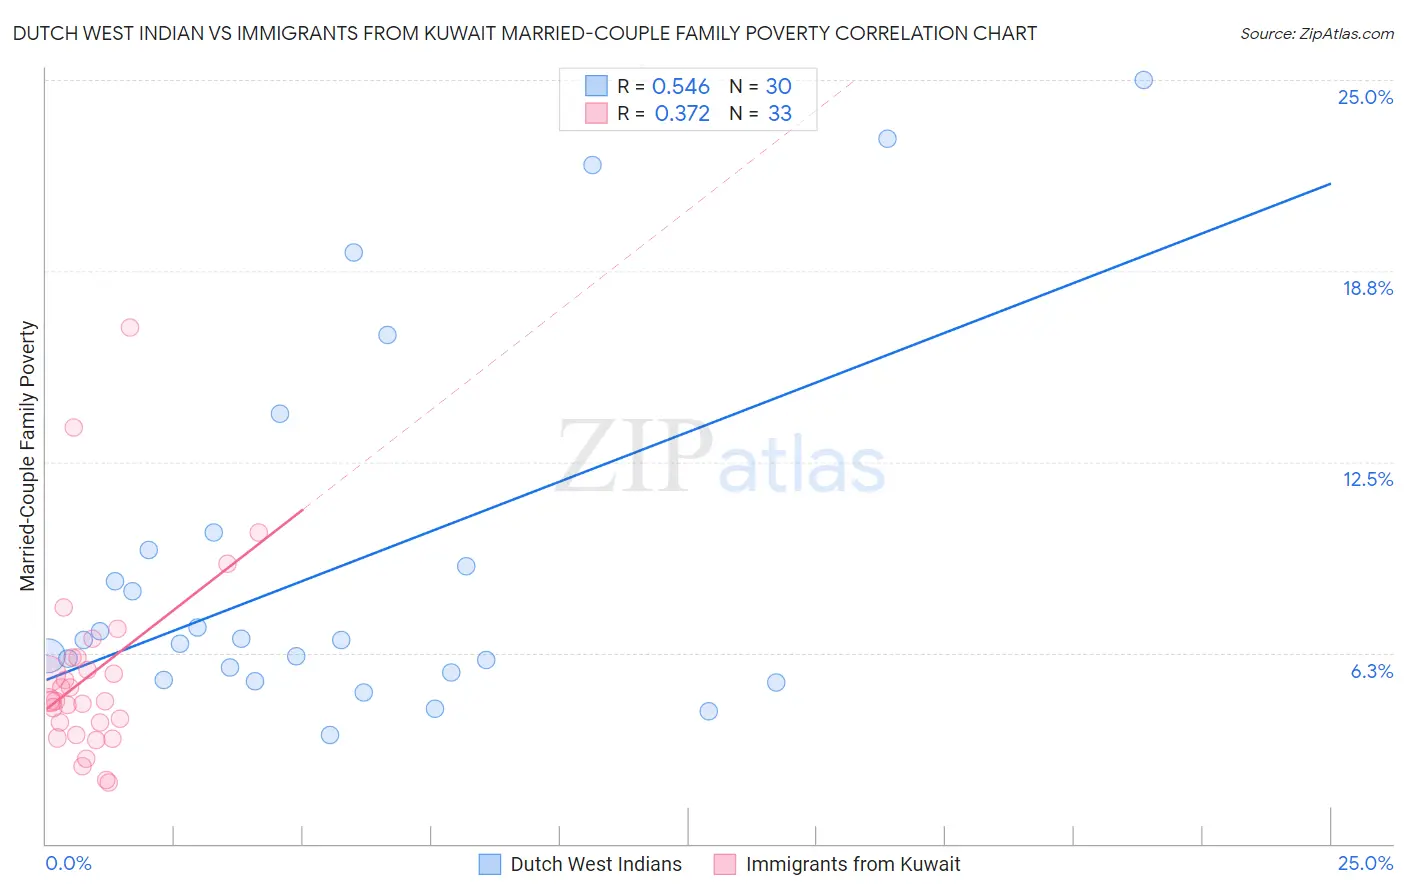
Dutch West Indian vs Immigrants from Kuwait Married-Couple Family Poverty Correlation Chart
The statistical analysis conducted on geographies consisting of 85,614,682 people shows a substantial positive correlation between the proportion of Dutch West Indians and poverty level among married-couple families in the United States with a correlation coefficient (R) of 0.546 and weighted average of 6.4%. Similarly, the statistical analysis conducted on geographies consisting of 136,568,646 people shows a mild positive correlation between the proportion of Immigrants from Kuwait and poverty level among married-couple families in the United States with a correlation coefficient (R) of 0.372 and weighted average of 5.0%, a difference of 27.9%.
Married-Couple Family Poverty Correlation Summary
| Measurement | Dutch West Indian | Immigrants from Kuwait |
| Minimum | 3.6% | 2.0% |
| Maximum | 25.0% | 16.9% |
| Range | 21.4% | 14.9% |
| Mean | 9.2% | 5.6% |
| Median | 6.7% | 4.7% |
| Interquartile 25% (IQ1) | 5.6% | 3.8% |
| Interquartile 75% (IQ3) | 9.6% | 6.1% |
| Interquartile Range (IQR) | 4.0% | 2.3% |
| Standard Deviation (Sample) | 6.0% | 3.1% |
| Standard Deviation (Population) | 5.9% | 3.1% |
Similar Demographics by Married-Couple Family Poverty
Demographics Similar to Dutch West Indians by Married-Couple Family Poverty
In terms of married-couple family poverty, the demographic groups most similar to Dutch West Indians are Ute (6.4%, a difference of 0.12%), Mexican American Indian (6.4%, a difference of 0.50%), Seminole (6.4%, a difference of 0.50%), Black/African American (6.5%, a difference of 0.51%), and Guyanese (6.5%, a difference of 0.61%).
| Demographics | Rating | Rank | Married-Couple Family Poverty |
| Indonesians | 0.1 /100 | #277 | Tragic 6.3% |
| Immigrants | Trinidad and Tobago | 0.1 /100 | #278 | Tragic 6.4% |
| Houma | 0.0 /100 | #279 | Tragic 6.4% |
| West Indians | 0.0 /100 | #280 | Tragic 6.4% |
| Mexican American Indians | 0.0 /100 | #281 | Tragic 6.4% |
| Seminole | 0.0 /100 | #282 | Tragic 6.4% |
| Ute | 0.0 /100 | #283 | Tragic 6.4% |
| Dutch West Indians | 0.0 /100 | #284 | Tragic 6.4% |
| Blacks/African Americans | 0.0 /100 | #285 | Tragic 6.5% |
| Guyanese | 0.0 /100 | #286 | Tragic 6.5% |
| Ecuadorians | 0.0 /100 | #287 | Tragic 6.5% |
| Salvadorans | 0.0 /100 | #288 | Tragic 6.5% |
| Nepalese | 0.0 /100 | #289 | Tragic 6.5% |
| Immigrants | Barbados | 0.0 /100 | #290 | Tragic 6.5% |
| Belizeans | 0.0 /100 | #291 | Tragic 6.5% |
Demographics Similar to Immigrants from Kuwait by Married-Couple Family Poverty
In terms of married-couple family poverty, the demographic groups most similar to Immigrants from Kuwait are Albanian (5.0%, a difference of 0.15%), Immigrants from Cameroon (5.0%, a difference of 0.16%), Brazilian (5.0%, a difference of 0.33%), Immigrants from Oceania (5.0%, a difference of 0.38%), and Syrian (5.0%, a difference of 0.41%).
| Demographics | Rating | Rank | Married-Couple Family Poverty |
| Mongolians | 79.8 /100 | #146 | Good 5.0% |
| Syrians | 78.7 /100 | #147 | Good 5.0% |
| Immigrants | Russia | 78.7 /100 | #148 | Good 5.0% |
| Immigrants | Oceania | 78.6 /100 | #149 | Good 5.0% |
| Brazilians | 78.3 /100 | #150 | Good 5.0% |
| Immigrants | Cameroon | 77.3 /100 | #151 | Good 5.0% |
| Albanians | 77.2 /100 | #152 | Good 5.0% |
| Immigrants | Kuwait | 76.3 /100 | #153 | Good 5.0% |
| Delaware | 73.7 /100 | #154 | Good 5.1% |
| Immigrants | Ethiopia | 72.4 /100 | #155 | Good 5.1% |
| Sri Lankans | 72.2 /100 | #156 | Good 5.1% |
| Argentineans | 70.7 /100 | #157 | Good 5.1% |
| Immigrants | South Eastern Asia | 70.4 /100 | #158 | Good 5.1% |
| Immigrants | Saudi Arabia | 70.3 /100 | #159 | Good 5.1% |
| Pennsylvania Germans | 68.5 /100 | #160 | Good 5.1% |