Cheyenne vs Yugoslavian Receiving Food Stamps
COMPARE
Cheyenne
Yugoslavian
Receiving Food Stamps
Receiving Food Stamps Comparison
Cheyenne
Yugoslavians
14.3%
RECEIVING FOOD STAMPS
0.2/ 100
METRIC RATING
266th/ 347
METRIC RANK
10.7%
RECEIVING FOOD STAMPS
92.5/ 100
METRIC RATING
129th/ 347
METRIC RANK
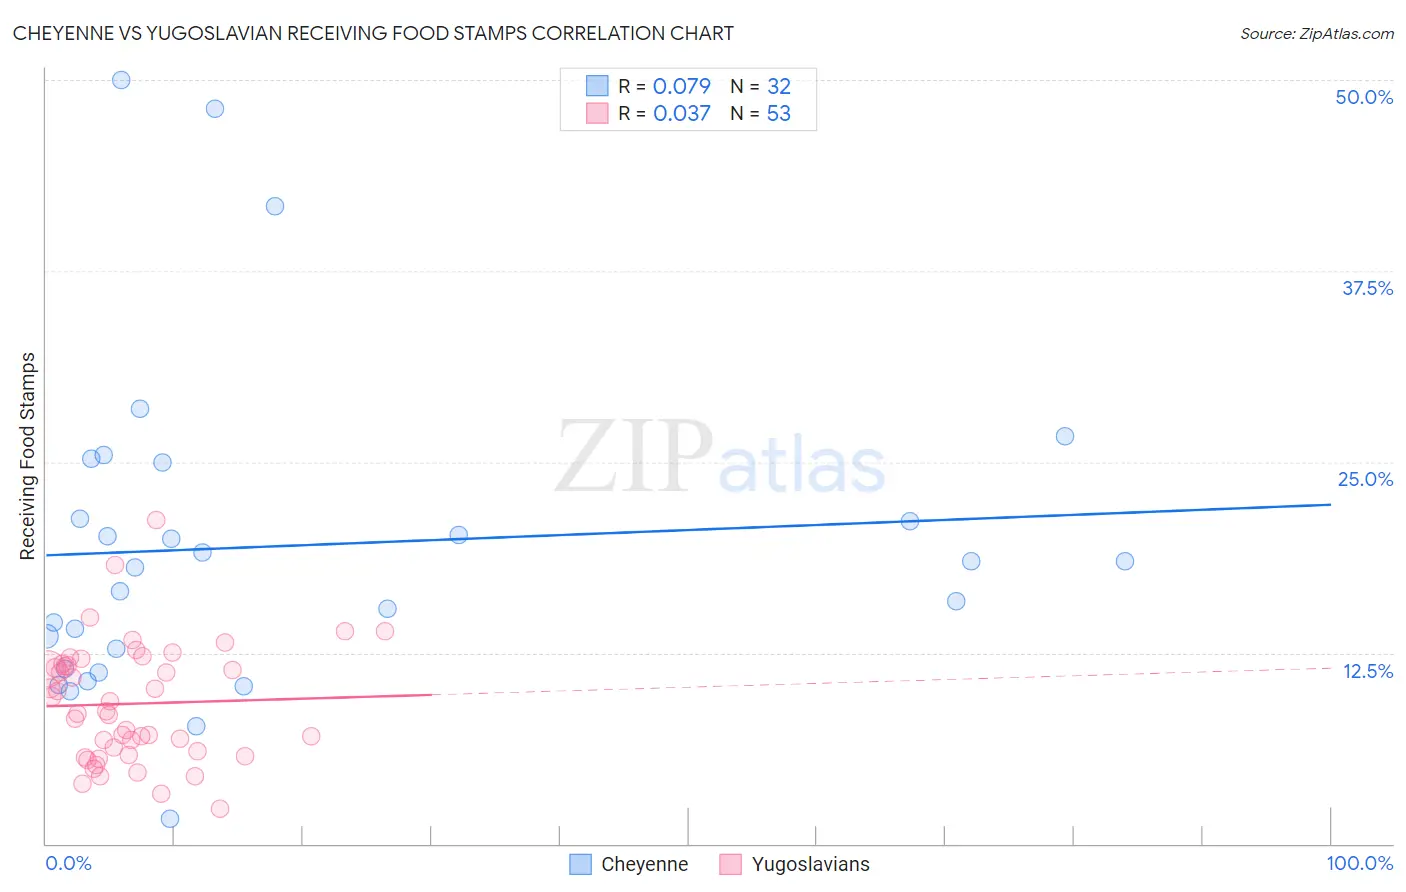
Cheyenne vs Yugoslavian Receiving Food Stamps Correlation Chart
The statistical analysis conducted on geographies consisting of 80,695,470 people shows a slight positive correlation between the proportion of Cheyenne and percentage of population receiving government assistance and/or food stamps in the United States with a correlation coefficient (R) of 0.079 and weighted average of 14.3%. Similarly, the statistical analysis conducted on geographies consisting of 285,227,567 people shows no correlation between the proportion of Yugoslavians and percentage of population receiving government assistance and/or food stamps in the United States with a correlation coefficient (R) of 0.037 and weighted average of 10.7%, a difference of 33.5%.
Receiving Food Stamps Correlation Summary
| Measurement | Cheyenne | Yugoslavian |
| Minimum | 1.6% | 2.3% |
| Maximum | 50.0% | 21.2% |
| Range | 48.4% | 18.9% |
| Mean | 19.5% | 9.2% |
| Median | 18.3% | 8.6% |
| Interquartile 25% (IQ1) | 12.1% | 5.9% |
| Interquartile 75% (IQ3) | 23.2% | 11.7% |
| Interquartile Range (IQR) | 11.0% | 5.8% |
| Standard Deviation (Sample) | 10.8% | 3.8% |
| Standard Deviation (Population) | 10.6% | 3.8% |
Similar Demographics by Receiving Food Stamps
Demographics Similar to Cheyenne by Receiving Food Stamps
In terms of receiving food stamps, the demographic groups most similar to Cheyenne are Blackfeet (14.3%, a difference of 0.080%), Immigrants from Uzbekistan (14.3%, a difference of 0.14%), Dutch West Indian (14.3%, a difference of 0.22%), Paiute (14.3%, a difference of 0.23%), and Immigrants from Portugal (14.3%, a difference of 0.23%).
| Demographics | Rating | Rank | Receiving Food Stamps |
| Creek | 0.3 /100 | #259 | Tragic 14.1% |
| Central Americans | 0.3 /100 | #260 | Tragic 14.1% |
| Immigrants | Congo | 0.3 /100 | #261 | Tragic 14.1% |
| Paiute | 0.2 /100 | #262 | Tragic 14.3% |
| Immigrants | Portugal | 0.2 /100 | #263 | Tragic 14.3% |
| Immigrants | Uzbekistan | 0.2 /100 | #264 | Tragic 14.3% |
| Blackfeet | 0.2 /100 | #265 | Tragic 14.3% |
| Cheyenne | 0.2 /100 | #266 | Tragic 14.3% |
| Dutch West Indians | 0.2 /100 | #267 | Tragic 14.3% |
| Guatemalans | 0.1 /100 | #268 | Tragic 14.4% |
| Nepalese | 0.1 /100 | #269 | Tragic 14.6% |
| Mexicans | 0.1 /100 | #270 | Tragic 14.6% |
| Immigrants | Guatemala | 0.1 /100 | #271 | Tragic 14.6% |
| Chippewa | 0.1 /100 | #272 | Tragic 14.7% |
| Alaskan Athabascans | 0.1 /100 | #273 | Tragic 14.7% |
Demographics Similar to Yugoslavians by Receiving Food Stamps
In terms of receiving food stamps, the demographic groups most similar to Yugoslavians are Immigrants from Jordan (10.7%, a difference of 0.0%), Immigrants from Ethiopia (10.7%, a difference of 0.010%), Afghan (10.7%, a difference of 0.030%), Israeli (10.7%, a difference of 0.10%), and French (10.7%, a difference of 0.10%).
| Demographics | Rating | Rank | Receiving Food Stamps |
| Sri Lankans | 93.7 /100 | #122 | Exceptional 10.6% |
| Immigrants | Philippines | 93.3 /100 | #123 | Exceptional 10.7% |
| Paraguayans | 93.0 /100 | #124 | Exceptional 10.7% |
| Ukrainians | 92.8 /100 | #125 | Exceptional 10.7% |
| Afghans | 92.6 /100 | #126 | Exceptional 10.7% |
| Immigrants | Ethiopia | 92.6 /100 | #127 | Exceptional 10.7% |
| Immigrants | Jordan | 92.5 /100 | #128 | Exceptional 10.7% |
| Yugoslavians | 92.5 /100 | #129 | Exceptional 10.7% |
| Israelis | 92.4 /100 | #130 | Exceptional 10.7% |
| French | 92.3 /100 | #131 | Exceptional 10.7% |
| Immigrants | Germany | 92.0 /100 | #132 | Exceptional 10.7% |
| Immigrants | Russia | 90.9 /100 | #133 | Exceptional 10.8% |
| Immigrants | Brazil | 90.3 /100 | #134 | Exceptional 10.8% |
| Argentineans | 90.2 /100 | #135 | Exceptional 10.8% |
| Slovaks | 89.8 /100 | #136 | Excellent 10.8% |