Immigrants from Brazil vs Yugoslavian Receiving Food Stamps
COMPARE
Immigrants from Brazil
Yugoslavian
Receiving Food Stamps
Receiving Food Stamps Comparison
Immigrants from Brazil
Yugoslavians
10.8%
RECEIVING FOOD STAMPS
90.3/ 100
METRIC RATING
134th/ 347
METRIC RANK
10.7%
RECEIVING FOOD STAMPS
92.5/ 100
METRIC RATING
129th/ 347
METRIC RANK
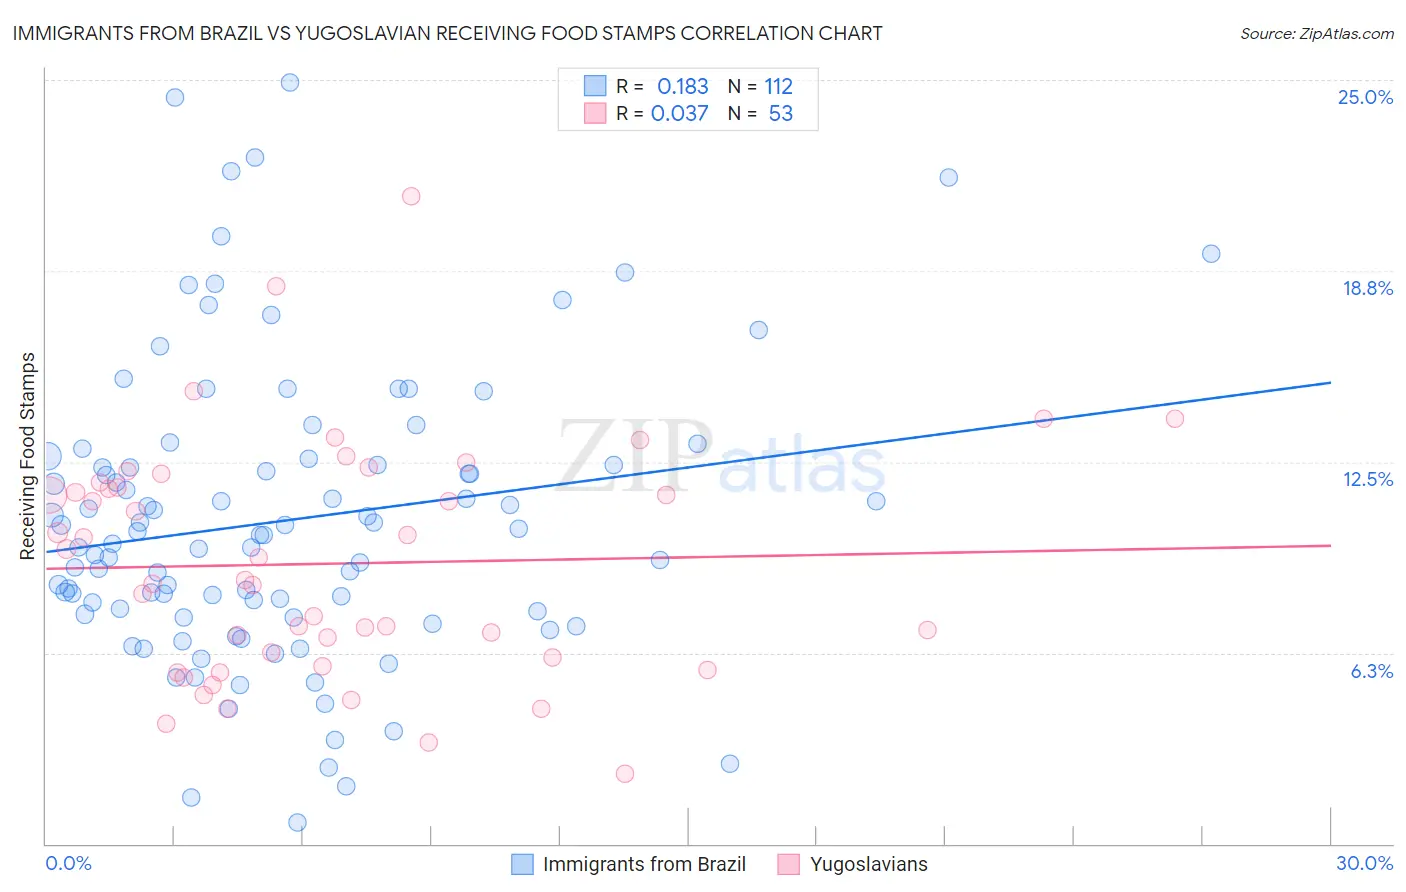
Immigrants from Brazil vs Yugoslavian Receiving Food Stamps Correlation Chart
The statistical analysis conducted on geographies consisting of 342,009,298 people shows a poor positive correlation between the proportion of Immigrants from Brazil and percentage of population receiving government assistance and/or food stamps in the United States with a correlation coefficient (R) of 0.183 and weighted average of 10.8%. Similarly, the statistical analysis conducted on geographies consisting of 285,227,567 people shows no correlation between the proportion of Yugoslavians and percentage of population receiving government assistance and/or food stamps in the United States with a correlation coefficient (R) of 0.037 and weighted average of 10.7%, a difference of 1.1%.
Receiving Food Stamps Correlation Summary
| Measurement | Immigrants from Brazil | Yugoslavian |
| Minimum | 0.70% | 2.3% |
| Maximum | 24.9% | 21.2% |
| Range | 24.2% | 18.9% |
| Mean | 10.6% | 9.2% |
| Median | 10.1% | 8.6% |
| Interquartile 25% (IQ1) | 7.6% | 5.9% |
| Interquartile 75% (IQ3) | 12.5% | 11.7% |
| Interquartile Range (IQR) | 4.9% | 5.8% |
| Standard Deviation (Sample) | 4.8% | 3.8% |
| Standard Deviation (Population) | 4.8% | 3.8% |
Demographics Similar to Immigrants from Brazil and Yugoslavians by Receiving Food Stamps
In terms of receiving food stamps, the demographic groups most similar to Immigrants from Brazil are Argentinean (10.8%, a difference of 0.020%), Slovak (10.8%, a difference of 0.19%), Immigrants from Eastern Europe (10.8%, a difference of 0.21%), Immigrants from Russia (10.8%, a difference of 0.30%), and Immigrants from Moldova (10.9%, a difference of 0.72%). Similarly, the demographic groups most similar to Yugoslavians are Immigrants from Jordan (10.7%, a difference of 0.0%), Immigrants from Ethiopia (10.7%, a difference of 0.010%), Afghan (10.7%, a difference of 0.030%), Israeli (10.7%, a difference of 0.10%), and French (10.7%, a difference of 0.10%).
| Demographics | Rating | Rank | Receiving Food Stamps |
| Slavs | 93.8 /100 | #121 | Exceptional 10.6% |
| Sri Lankans | 93.7 /100 | #122 | Exceptional 10.6% |
| Immigrants | Philippines | 93.3 /100 | #123 | Exceptional 10.7% |
| Paraguayans | 93.0 /100 | #124 | Exceptional 10.7% |
| Ukrainians | 92.8 /100 | #125 | Exceptional 10.7% |
| Afghans | 92.6 /100 | #126 | Exceptional 10.7% |
| Immigrants | Ethiopia | 92.6 /100 | #127 | Exceptional 10.7% |
| Immigrants | Jordan | 92.5 /100 | #128 | Exceptional 10.7% |
| Yugoslavians | 92.5 /100 | #129 | Exceptional 10.7% |
| Israelis | 92.4 /100 | #130 | Exceptional 10.7% |
| French | 92.3 /100 | #131 | Exceptional 10.7% |
| Immigrants | Germany | 92.0 /100 | #132 | Exceptional 10.7% |
| Immigrants | Russia | 90.9 /100 | #133 | Exceptional 10.8% |
| Immigrants | Brazil | 90.3 /100 | #134 | Exceptional 10.8% |
| Argentineans | 90.2 /100 | #135 | Exceptional 10.8% |
| Slovaks | 89.8 /100 | #136 | Excellent 10.8% |
| Immigrants | Eastern Europe | 89.8 /100 | #137 | Excellent 10.8% |
| Immigrants | Moldova | 88.5 /100 | #138 | Excellent 10.9% |
| Hmong | 88.4 /100 | #139 | Excellent 10.9% |
| Celtics | 87.8 /100 | #140 | Excellent 10.9% |
| Immigrants | Vietnam | 86.7 /100 | #141 | Excellent 11.0% |