Cheyenne vs Immigrants from Nepal Receiving Food Stamps
COMPARE
Cheyenne
Immigrants from Nepal
Receiving Food Stamps
Receiving Food Stamps Comparison
Cheyenne
Immigrants from Nepal
14.3%
RECEIVING FOOD STAMPS
0.2/ 100
METRIC RATING
266th/ 347
METRIC RANK
10.6%
RECEIVING FOOD STAMPS
94.6/ 100
METRIC RATING
117th/ 347
METRIC RANK
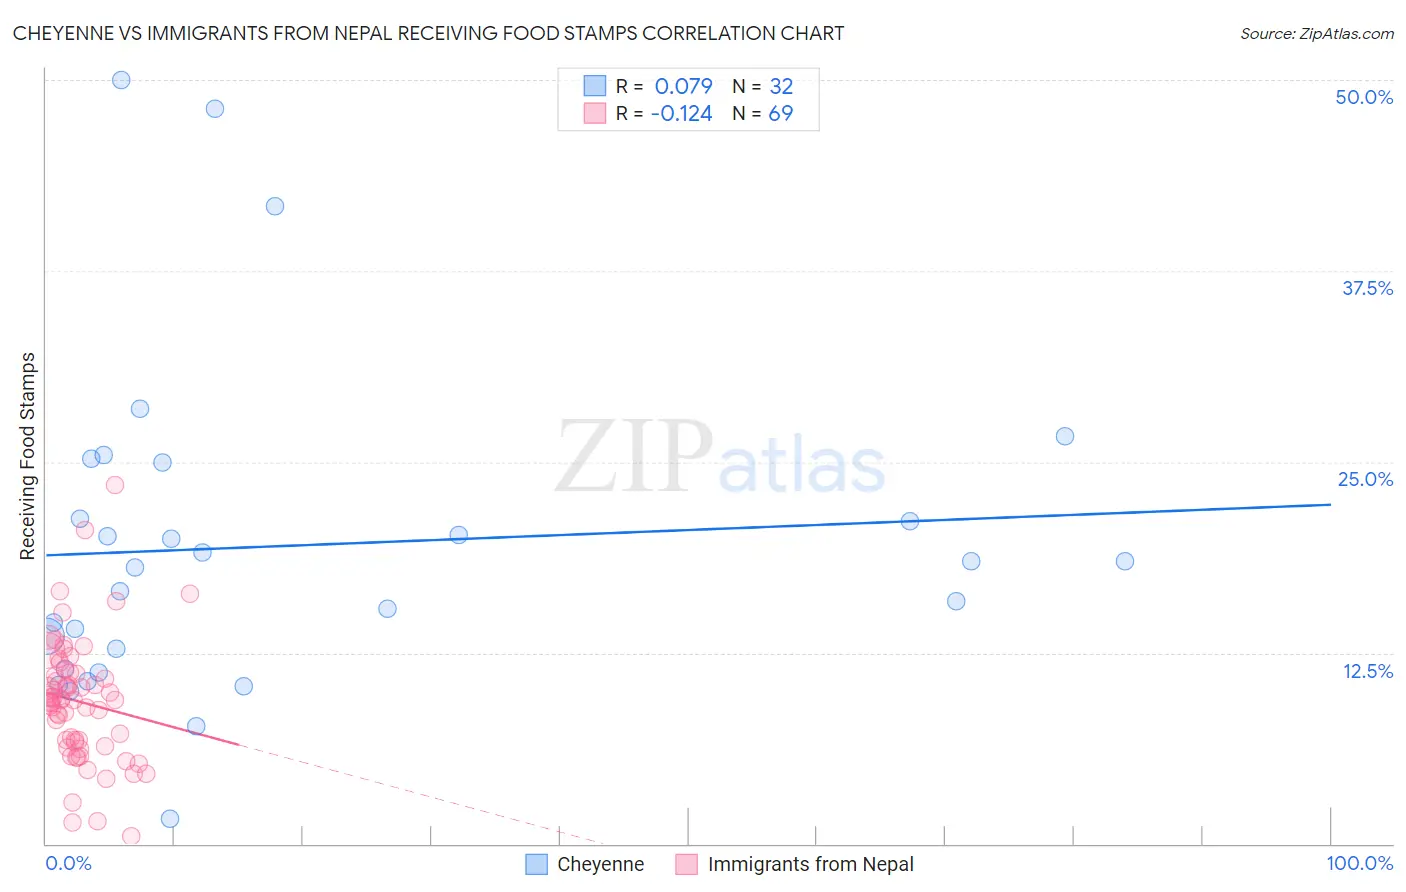
Cheyenne vs Immigrants from Nepal Receiving Food Stamps Correlation Chart
The statistical analysis conducted on geographies consisting of 80,695,470 people shows a slight positive correlation between the proportion of Cheyenne and percentage of population receiving government assistance and/or food stamps in the United States with a correlation coefficient (R) of 0.079 and weighted average of 14.3%. Similarly, the statistical analysis conducted on geographies consisting of 186,476,550 people shows a poor negative correlation between the proportion of Immigrants from Nepal and percentage of population receiving government assistance and/or food stamps in the United States with a correlation coefficient (R) of -0.124 and weighted average of 10.6%, a difference of 35.3%.
Receiving Food Stamps Correlation Summary
| Measurement | Cheyenne | Immigrants from Nepal |
| Minimum | 1.6% | 0.50% |
| Maximum | 50.0% | 23.5% |
| Range | 48.4% | 23.0% |
| Mean | 19.5% | 9.3% |
| Median | 18.3% | 9.4% |
| Interquartile 25% (IQ1) | 12.1% | 6.5% |
| Interquartile 75% (IQ3) | 23.2% | 11.2% |
| Interquartile Range (IQR) | 11.0% | 4.7% |
| Standard Deviation (Sample) | 10.8% | 4.1% |
| Standard Deviation (Population) | 10.6% | 4.0% |
Similar Demographics by Receiving Food Stamps
Demographics Similar to Cheyenne by Receiving Food Stamps
In terms of receiving food stamps, the demographic groups most similar to Cheyenne are Blackfeet (14.3%, a difference of 0.080%), Immigrants from Uzbekistan (14.3%, a difference of 0.14%), Dutch West Indian (14.3%, a difference of 0.22%), Paiute (14.3%, a difference of 0.23%), and Immigrants from Portugal (14.3%, a difference of 0.23%).
| Demographics | Rating | Rank | Receiving Food Stamps |
| Creek | 0.3 /100 | #259 | Tragic 14.1% |
| Central Americans | 0.3 /100 | #260 | Tragic 14.1% |
| Immigrants | Congo | 0.3 /100 | #261 | Tragic 14.1% |
| Paiute | 0.2 /100 | #262 | Tragic 14.3% |
| Immigrants | Portugal | 0.2 /100 | #263 | Tragic 14.3% |
| Immigrants | Uzbekistan | 0.2 /100 | #264 | Tragic 14.3% |
| Blackfeet | 0.2 /100 | #265 | Tragic 14.3% |
| Cheyenne | 0.2 /100 | #266 | Tragic 14.3% |
| Dutch West Indians | 0.2 /100 | #267 | Tragic 14.3% |
| Guatemalans | 0.1 /100 | #268 | Tragic 14.4% |
| Nepalese | 0.1 /100 | #269 | Tragic 14.6% |
| Mexicans | 0.1 /100 | #270 | Tragic 14.6% |
| Immigrants | Guatemala | 0.1 /100 | #271 | Tragic 14.6% |
| Chippewa | 0.1 /100 | #272 | Tragic 14.7% |
| Alaskan Athabascans | 0.1 /100 | #273 | Tragic 14.7% |
Demographics Similar to Immigrants from Nepal by Receiving Food Stamps
In terms of receiving food stamps, the demographic groups most similar to Immigrants from Nepal are Canadian (10.5%, a difference of 0.16%), Immigrants from Saudi Arabia (10.5%, a difference of 0.21%), Assyrian/Chaldean/Syriac (10.6%, a difference of 0.34%), Scotch-Irish (10.5%, a difference of 0.39%), and Immigrants from Poland (10.6%, a difference of 0.50%).
| Demographics | Rating | Rank | Receiving Food Stamps |
| Pakistanis | 95.9 /100 | #110 | Exceptional 10.4% |
| Romanians | 95.8 /100 | #111 | Exceptional 10.4% |
| Mongolians | 95.8 /100 | #112 | Exceptional 10.5% |
| Icelanders | 95.4 /100 | #113 | Exceptional 10.5% |
| Scotch-Irish | 95.1 /100 | #114 | Exceptional 10.5% |
| Immigrants | Saudi Arabia | 94.9 /100 | #115 | Exceptional 10.5% |
| Canadians | 94.8 /100 | #116 | Exceptional 10.5% |
| Immigrants | Nepal | 94.6 /100 | #117 | Exceptional 10.6% |
| Assyrians/Chaldeans/Syriacs | 94.1 /100 | #118 | Exceptional 10.6% |
| Immigrants | Poland | 93.9 /100 | #119 | Exceptional 10.6% |
| Ethiopians | 93.9 /100 | #120 | Exceptional 10.6% |
| Slavs | 93.8 /100 | #121 | Exceptional 10.6% |
| Sri Lankans | 93.7 /100 | #122 | Exceptional 10.6% |
| Immigrants | Philippines | 93.3 /100 | #123 | Exceptional 10.7% |
| Paraguayans | 93.0 /100 | #124 | Exceptional 10.7% |