Cheyenne vs Immigrants from Chile Receiving Food Stamps
COMPARE
Cheyenne
Immigrants from Chile
Receiving Food Stamps
Receiving Food Stamps Comparison
Cheyenne
Immigrants from Chile
14.3%
RECEIVING FOOD STAMPS
0.2/ 100
METRIC RATING
266th/ 347
METRIC RANK
11.5%
RECEIVING FOOD STAMPS
65.0/ 100
METRIC RATING
164th/ 347
METRIC RANK
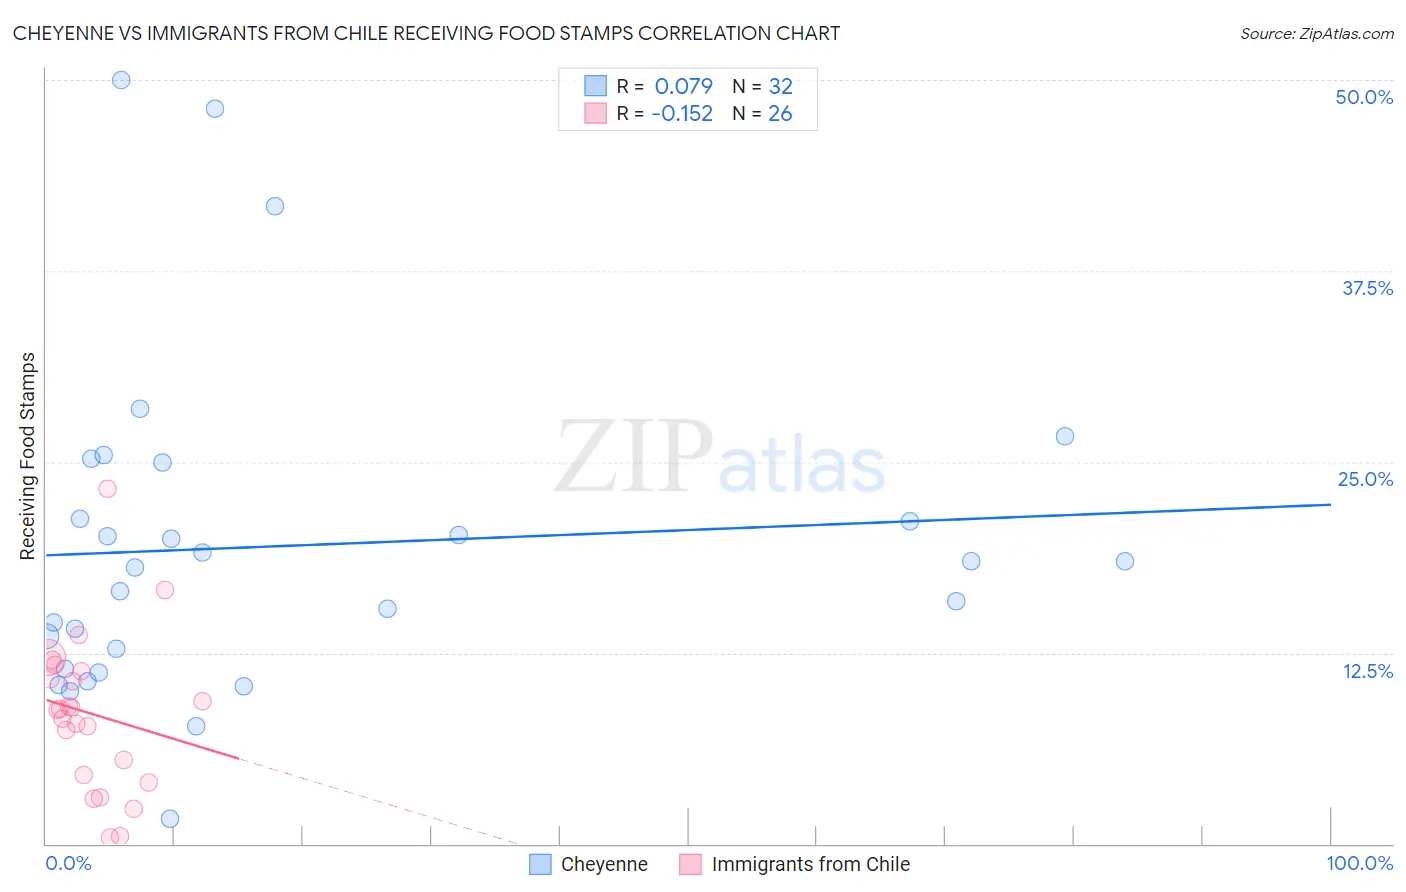
Cheyenne vs Immigrants from Chile Receiving Food Stamps Correlation Chart
The statistical analysis conducted on geographies consisting of 80,695,470 people shows a slight positive correlation between the proportion of Cheyenne and percentage of population receiving government assistance and/or food stamps in the United States with a correlation coefficient (R) of 0.079 and weighted average of 14.3%. Similarly, the statistical analysis conducted on geographies consisting of 218,329,449 people shows a poor negative correlation between the proportion of Immigrants from Chile and percentage of population receiving government assistance and/or food stamps in the United States with a correlation coefficient (R) of -0.152 and weighted average of 11.5%, a difference of 24.5%.
Receiving Food Stamps Correlation Summary
| Measurement | Cheyenne | Immigrants from Chile |
| Minimum | 1.6% | 0.40% |
| Maximum | 50.0% | 23.2% |
| Range | 48.4% | 22.8% |
| Mean | 19.5% | 8.5% |
| Median | 18.3% | 8.8% |
| Interquartile 25% (IQ1) | 12.1% | 4.5% |
| Interquartile 75% (IQ3) | 23.2% | 11.3% |
| Interquartile Range (IQR) | 11.0% | 6.8% |
| Standard Deviation (Sample) | 10.8% | 5.1% |
| Standard Deviation (Population) | 10.6% | 5.0% |
Similar Demographics by Receiving Food Stamps
Demographics Similar to Cheyenne by Receiving Food Stamps
In terms of receiving food stamps, the demographic groups most similar to Cheyenne are Blackfeet (14.3%, a difference of 0.080%), Immigrants from Uzbekistan (14.3%, a difference of 0.14%), Dutch West Indian (14.3%, a difference of 0.22%), Paiute (14.3%, a difference of 0.23%), and Immigrants from Portugal (14.3%, a difference of 0.23%).
| Demographics | Rating | Rank | Receiving Food Stamps |
| Creek | 0.3 /100 | #259 | Tragic 14.1% |
| Central Americans | 0.3 /100 | #260 | Tragic 14.1% |
| Immigrants | Congo | 0.3 /100 | #261 | Tragic 14.1% |
| Paiute | 0.2 /100 | #262 | Tragic 14.3% |
| Immigrants | Portugal | 0.2 /100 | #263 | Tragic 14.3% |
| Immigrants | Uzbekistan | 0.2 /100 | #264 | Tragic 14.3% |
| Blackfeet | 0.2 /100 | #265 | Tragic 14.3% |
| Cheyenne | 0.2 /100 | #266 | Tragic 14.3% |
| Dutch West Indians | 0.2 /100 | #267 | Tragic 14.3% |
| Guatemalans | 0.1 /100 | #268 | Tragic 14.4% |
| Nepalese | 0.1 /100 | #269 | Tragic 14.6% |
| Mexicans | 0.1 /100 | #270 | Tragic 14.6% |
| Immigrants | Guatemala | 0.1 /100 | #271 | Tragic 14.6% |
| Chippewa | 0.1 /100 | #272 | Tragic 14.7% |
| Alaskan Athabascans | 0.1 /100 | #273 | Tragic 14.7% |
Demographics Similar to Immigrants from Chile by Receiving Food Stamps
In terms of receiving food stamps, the demographic groups most similar to Immigrants from Chile are Arab (11.5%, a difference of 0.050%), Immigrants from Southern Europe (11.5%, a difference of 0.12%), Immigrants from Belarus (11.5%, a difference of 0.35%), Alsatian (11.4%, a difference of 0.48%), and Pennsylvania German (11.4%, a difference of 0.55%).
| Demographics | Rating | Rank | Receiving Food Stamps |
| Immigrants | Lebanon | 75.2 /100 | #157 | Good 11.3% |
| Immigrants | Bosnia and Herzegovina | 72.6 /100 | #158 | Good 11.3% |
| Immigrants | Oceania | 70.4 /100 | #159 | Good 11.4% |
| French Canadians | 69.5 /100 | #160 | Good 11.4% |
| Pennsylvania Germans | 68.4 /100 | #161 | Good 11.4% |
| Alsatians | 68.0 /100 | #162 | Good 11.4% |
| Immigrants | Southern Europe | 65.8 /100 | #163 | Good 11.5% |
| Immigrants | Chile | 65.0 /100 | #164 | Good 11.5% |
| Arabs | 64.7 /100 | #165 | Good 11.5% |
| Immigrants | Belarus | 62.8 /100 | #166 | Good 11.5% |
| Kenyans | 60.2 /100 | #167 | Good 11.6% |
| Tlingit-Haida | 59.1 /100 | #168 | Average 11.6% |
| Immigrants | Eastern Africa | 58.3 /100 | #169 | Average 11.6% |
| Costa Ricans | 57.9 /100 | #170 | Average 11.6% |
| Immigrants | Western Asia | 56.4 /100 | #171 | Average 11.6% |