Cheyenne vs Immigrants from Senegal Receiving Food Stamps
COMPARE
Cheyenne
Immigrants from Senegal
Receiving Food Stamps
Receiving Food Stamps Comparison
Cheyenne
Immigrants from Senegal
14.3%
RECEIVING FOOD STAMPS
0.2/ 100
METRIC RATING
266th/ 347
METRIC RANK
15.3%
RECEIVING FOOD STAMPS
0.0/ 100
METRIC RATING
289th/ 347
METRIC RANK
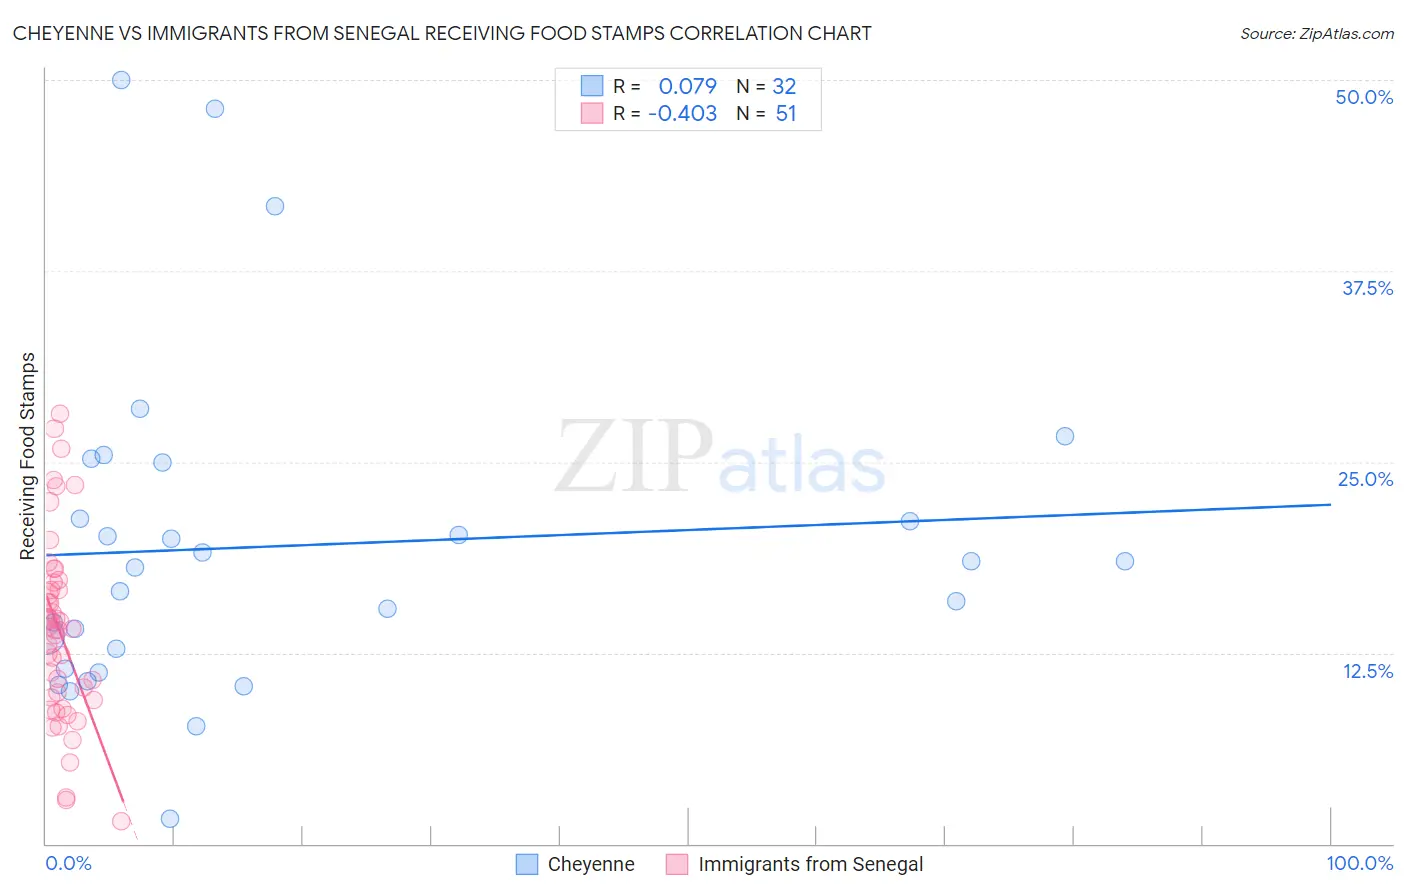
Cheyenne vs Immigrants from Senegal Receiving Food Stamps Correlation Chart
The statistical analysis conducted on geographies consisting of 80,695,470 people shows a slight positive correlation between the proportion of Cheyenne and percentage of population receiving government assistance and/or food stamps in the United States with a correlation coefficient (R) of 0.079 and weighted average of 14.3%. Similarly, the statistical analysis conducted on geographies consisting of 90,108,306 people shows a moderate negative correlation between the proportion of Immigrants from Senegal and percentage of population receiving government assistance and/or food stamps in the United States with a correlation coefficient (R) of -0.403 and weighted average of 15.3%, a difference of 7.4%.
Receiving Food Stamps Correlation Summary
| Measurement | Cheyenne | Immigrants from Senegal |
| Minimum | 1.6% | 1.5% |
| Maximum | 50.0% | 28.1% |
| Range | 48.4% | 26.6% |
| Mean | 19.5% | 13.9% |
| Median | 18.3% | 14.0% |
| Interquartile 25% (IQ1) | 12.1% | 9.4% |
| Interquartile 75% (IQ3) | 23.2% | 17.1% |
| Interquartile Range (IQR) | 11.0% | 7.7% |
| Standard Deviation (Sample) | 10.8% | 6.1% |
| Standard Deviation (Population) | 10.6% | 6.0% |
Similar Demographics by Receiving Food Stamps
Demographics Similar to Cheyenne by Receiving Food Stamps
In terms of receiving food stamps, the demographic groups most similar to Cheyenne are Blackfeet (14.3%, a difference of 0.080%), Immigrants from Uzbekistan (14.3%, a difference of 0.14%), Dutch West Indian (14.3%, a difference of 0.22%), Paiute (14.3%, a difference of 0.23%), and Immigrants from Portugal (14.3%, a difference of 0.23%).
| Demographics | Rating | Rank | Receiving Food Stamps |
| Creek | 0.3 /100 | #259 | Tragic 14.1% |
| Central Americans | 0.3 /100 | #260 | Tragic 14.1% |
| Immigrants | Congo | 0.3 /100 | #261 | Tragic 14.1% |
| Paiute | 0.2 /100 | #262 | Tragic 14.3% |
| Immigrants | Portugal | 0.2 /100 | #263 | Tragic 14.3% |
| Immigrants | Uzbekistan | 0.2 /100 | #264 | Tragic 14.3% |
| Blackfeet | 0.2 /100 | #265 | Tragic 14.3% |
| Cheyenne | 0.2 /100 | #266 | Tragic 14.3% |
| Dutch West Indians | 0.2 /100 | #267 | Tragic 14.3% |
| Guatemalans | 0.1 /100 | #268 | Tragic 14.4% |
| Nepalese | 0.1 /100 | #269 | Tragic 14.6% |
| Mexicans | 0.1 /100 | #270 | Tragic 14.6% |
| Immigrants | Guatemala | 0.1 /100 | #271 | Tragic 14.6% |
| Chippewa | 0.1 /100 | #272 | Tragic 14.7% |
| Alaskan Athabascans | 0.1 /100 | #273 | Tragic 14.7% |
Demographics Similar to Immigrants from Senegal by Receiving Food Stamps
In terms of receiving food stamps, the demographic groups most similar to Immigrants from Senegal are Senegalese (15.4%, a difference of 0.27%), Immigrants from Belize (15.2%, a difference of 0.77%), Immigrants from Mexico (15.2%, a difference of 1.2%), Honduran (15.5%, a difference of 1.3%), and African (15.1%, a difference of 1.5%).
| Demographics | Rating | Rank | Receiving Food Stamps |
| Immigrants | Central America | 0.0 /100 | #282 | Tragic 15.0% |
| Bangladeshis | 0.0 /100 | #283 | Tragic 15.0% |
| Immigrants | Ecuador | 0.0 /100 | #284 | Tragic 15.0% |
| Immigrants | Liberia | 0.0 /100 | #285 | Tragic 15.1% |
| Africans | 0.0 /100 | #286 | Tragic 15.1% |
| Immigrants | Mexico | 0.0 /100 | #287 | Tragic 15.2% |
| Immigrants | Belize | 0.0 /100 | #288 | Tragic 15.2% |
| Immigrants | Senegal | 0.0 /100 | #289 | Tragic 15.3% |
| Senegalese | 0.0 /100 | #290 | Tragic 15.4% |
| Hondurans | 0.0 /100 | #291 | Tragic 15.5% |
| Alaska Natives | 0.0 /100 | #292 | Tragic 15.6% |
| Vietnamese | 0.0 /100 | #293 | Tragic 15.7% |
| Immigrants | Latin America | 0.0 /100 | #294 | Tragic 15.7% |
| Immigrants | Honduras | 0.0 /100 | #295 | Tragic 15.7% |
| Tsimshian | 0.0 /100 | #296 | Tragic 15.7% |