White/Caucasian vs Yugoslavian Receiving Food Stamps
COMPARE
White/Caucasian
Yugoslavian
Receiving Food Stamps
Receiving Food Stamps Comparison
Whites/Caucasians
Yugoslavians
11.1%
RECEIVING FOOD STAMPS
83.9/ 100
METRIC RATING
147th/ 347
METRIC RANK
10.7%
RECEIVING FOOD STAMPS
92.5/ 100
METRIC RATING
129th/ 347
METRIC RANK
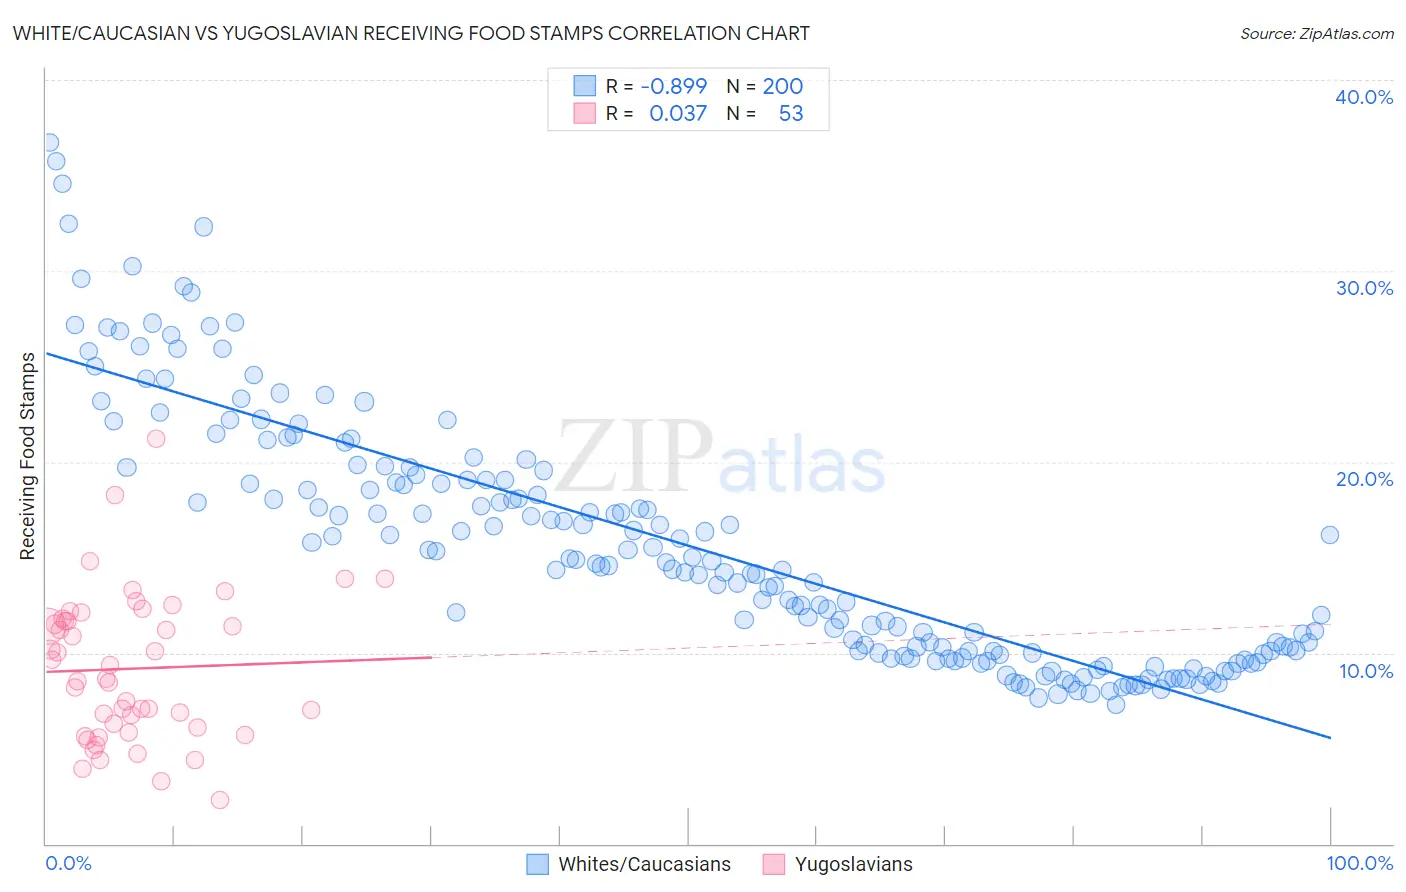
White/Caucasian vs Yugoslavian Receiving Food Stamps Correlation Chart
The statistical analysis conducted on geographies consisting of 580,507,167 people shows a very strong negative correlation between the proportion of Whites/Caucasians and percentage of population receiving government assistance and/or food stamps in the United States with a correlation coefficient (R) of -0.899 and weighted average of 11.1%. Similarly, the statistical analysis conducted on geographies consisting of 285,227,567 people shows no correlation between the proportion of Yugoslavians and percentage of population receiving government assistance and/or food stamps in the United States with a correlation coefficient (R) of 0.037 and weighted average of 10.7%, a difference of 3.3%.
Receiving Food Stamps Correlation Summary
| Measurement | White/Caucasian | Yugoslavian |
| Minimum | 7.3% | 2.3% |
| Maximum | 36.7% | 21.2% |
| Range | 29.4% | 18.9% |
| Mean | 15.6% | 9.2% |
| Median | 14.5% | 8.6% |
| Interquartile 25% (IQ1) | 10.0% | 5.9% |
| Interquartile 75% (IQ3) | 19.1% | 11.7% |
| Interquartile Range (IQR) | 9.1% | 5.8% |
| Standard Deviation (Sample) | 6.5% | 3.8% |
| Standard Deviation (Population) | 6.5% | 3.8% |
Demographics Similar to Whites/Caucasians and Yugoslavians by Receiving Food Stamps
In terms of receiving food stamps, the demographic groups most similar to Whites/Caucasians are Taiwanese (11.0%, a difference of 0.090%), Immigrants from South Eastern Asia (11.1%, a difference of 0.16%), Hungarian (11.0%, a difference of 0.34%), Syrian (11.0%, a difference of 0.45%), and Immigrants from Northern Africa (11.0%, a difference of 0.60%). Similarly, the demographic groups most similar to Yugoslavians are Immigrants from Jordan (10.7%, a difference of 0.0%), Israeli (10.7%, a difference of 0.10%), French (10.7%, a difference of 0.10%), Immigrants from Germany (10.7%, a difference of 0.30%), and Immigrants from Russia (10.8%, a difference of 0.81%).
| Demographics | Rating | Rank | Receiving Food Stamps |
| Immigrants | Jordan | 92.5 /100 | #128 | Exceptional 10.7% |
| Yugoslavians | 92.5 /100 | #129 | Exceptional 10.7% |
| Israelis | 92.4 /100 | #130 | Exceptional 10.7% |
| French | 92.3 /100 | #131 | Exceptional 10.7% |
| Immigrants | Germany | 92.0 /100 | #132 | Exceptional 10.7% |
| Immigrants | Russia | 90.9 /100 | #133 | Exceptional 10.8% |
| Immigrants | Brazil | 90.3 /100 | #134 | Exceptional 10.8% |
| Argentineans | 90.2 /100 | #135 | Exceptional 10.8% |
| Slovaks | 89.8 /100 | #136 | Excellent 10.8% |
| Immigrants | Eastern Europe | 89.8 /100 | #137 | Excellent 10.8% |
| Immigrants | Moldova | 88.5 /100 | #138 | Excellent 10.9% |
| Hmong | 88.4 /100 | #139 | Excellent 10.9% |
| Celtics | 87.8 /100 | #140 | Excellent 10.9% |
| Immigrants | Vietnam | 86.7 /100 | #141 | Excellent 11.0% |
| Chileans | 86.2 /100 | #142 | Excellent 11.0% |
| Immigrants | Northern Africa | 86.0 /100 | #143 | Excellent 11.0% |
| Syrians | 85.5 /100 | #144 | Excellent 11.0% |
| Hungarians | 85.1 /100 | #145 | Excellent 11.0% |
| Taiwanese | 84.2 /100 | #146 | Excellent 11.0% |
| Whites/Caucasians | 83.9 /100 | #147 | Excellent 11.1% |
| Immigrants | South Eastern Asia | 83.3 /100 | #148 | Excellent 11.1% |