Immigrants from Caribbean vs Immigrants from Nepal Receiving Food Stamps
COMPARE
Immigrants from Caribbean
Immigrants from Nepal
Receiving Food Stamps
Receiving Food Stamps Comparison
Immigrants from Caribbean
Immigrants from Nepal
19.6%
RECEIVING FOOD STAMPS
0.0/ 100
METRIC RATING
331st/ 347
METRIC RANK
10.6%
RECEIVING FOOD STAMPS
94.6/ 100
METRIC RATING
117th/ 347
METRIC RANK
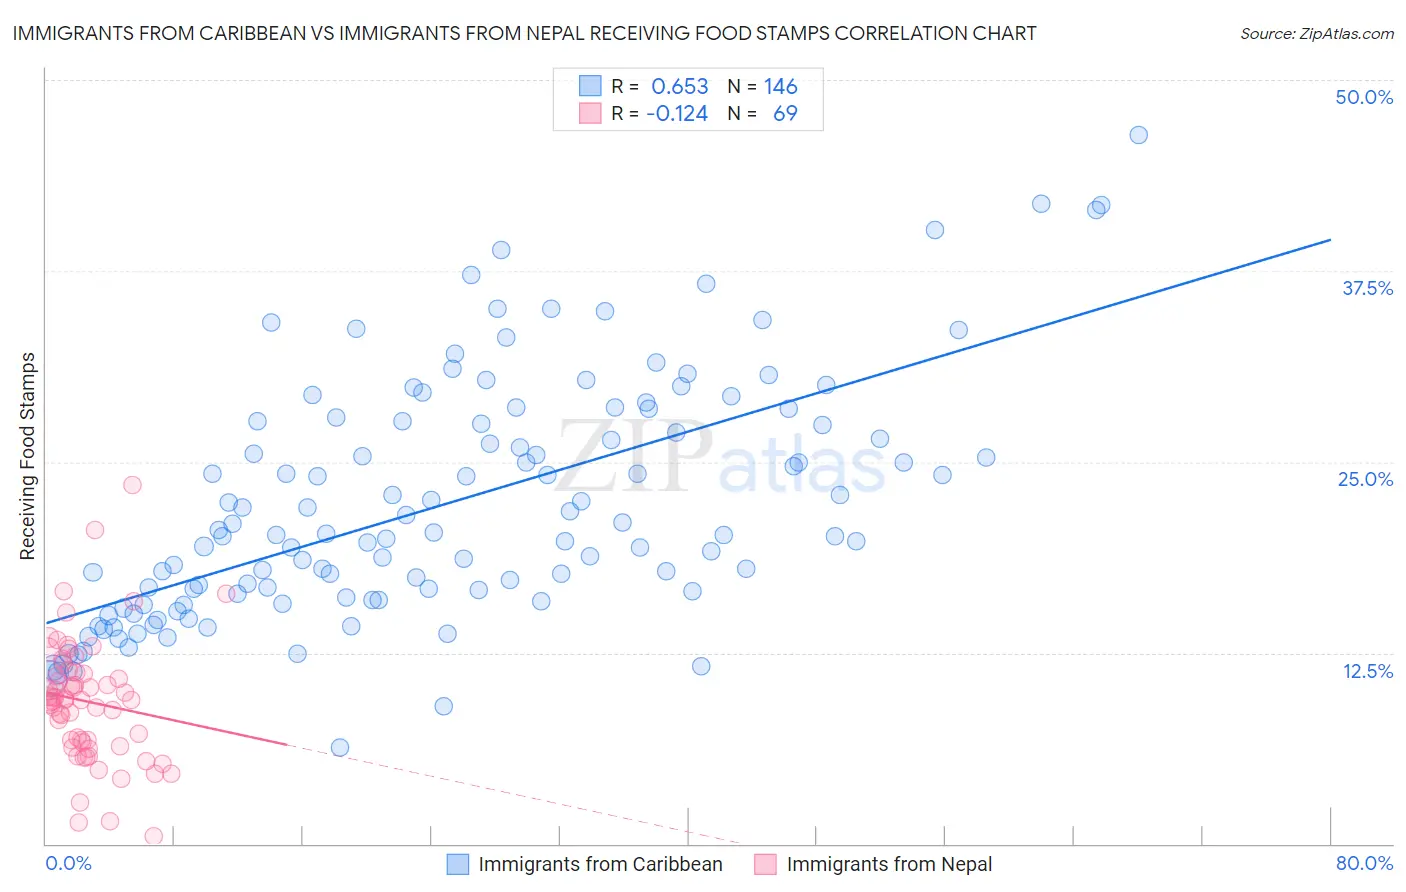
Immigrants from Caribbean vs Immigrants from Nepal Receiving Food Stamps Correlation Chart
The statistical analysis conducted on geographies consisting of 448,445,784 people shows a significant positive correlation between the proportion of Immigrants from Caribbean and percentage of population receiving government assistance and/or food stamps in the United States with a correlation coefficient (R) of 0.653 and weighted average of 19.6%. Similarly, the statistical analysis conducted on geographies consisting of 186,476,550 people shows a poor negative correlation between the proportion of Immigrants from Nepal and percentage of population receiving government assistance and/or food stamps in the United States with a correlation coefficient (R) of -0.124 and weighted average of 10.6%, a difference of 85.7%.
Receiving Food Stamps Correlation Summary
| Measurement | Immigrants from Caribbean | Immigrants from Nepal |
| Minimum | 6.3% | 0.50% |
| Maximum | 46.4% | 23.5% |
| Range | 40.1% | 23.0% |
| Mean | 22.2% | 9.3% |
| Median | 20.3% | 9.4% |
| Interquartile 25% (IQ1) | 16.1% | 6.5% |
| Interquartile 75% (IQ3) | 27.7% | 11.2% |
| Interquartile Range (IQR) | 11.5% | 4.7% |
| Standard Deviation (Sample) | 7.8% | 4.1% |
| Standard Deviation (Population) | 7.8% | 4.0% |
Similar Demographics by Receiving Food Stamps
Demographics Similar to Immigrants from Caribbean by Receiving Food Stamps
In terms of receiving food stamps, the demographic groups most similar to Immigrants from Caribbean are Pueblo (19.9%, a difference of 1.5%), Inupiat (20.1%, a difference of 2.2%), Yuman (20.2%, a difference of 3.1%), Pima (19.0%, a difference of 3.4%), and Immigrants from Cuba (20.8%, a difference of 6.2%).
| Demographics | Rating | Rank | Receiving Food Stamps |
| British West Indians | 0.0 /100 | #324 | Tragic 17.9% |
| Immigrants | Haiti | 0.0 /100 | #325 | Tragic 18.2% |
| Cubans | 0.0 /100 | #326 | Tragic 18.2% |
| Apache | 0.0 /100 | #327 | Tragic 18.3% |
| Colville | 0.0 /100 | #328 | Tragic 18.3% |
| Immigrants | Dominica | 0.0 /100 | #329 | Tragic 18.4% |
| Pima | 0.0 /100 | #330 | Tragic 19.0% |
| Immigrants | Caribbean | 0.0 /100 | #331 | Tragic 19.6% |
| Pueblo | 0.0 /100 | #332 | Tragic 19.9% |
| Inupiat | 0.0 /100 | #333 | Tragic 20.1% |
| Yuman | 0.0 /100 | #334 | Tragic 20.2% |
| Immigrants | Cuba | 0.0 /100 | #335 | Tragic 20.8% |
| Navajo | 0.0 /100 | #336 | Tragic 21.1% |
| Cape Verdeans | 0.0 /100 | #337 | Tragic 21.1% |
| Dominicans | 0.0 /100 | #338 | Tragic 21.4% |
Demographics Similar to Immigrants from Nepal by Receiving Food Stamps
In terms of receiving food stamps, the demographic groups most similar to Immigrants from Nepal are Canadian (10.5%, a difference of 0.16%), Immigrants from Saudi Arabia (10.5%, a difference of 0.21%), Assyrian/Chaldean/Syriac (10.6%, a difference of 0.34%), Scotch-Irish (10.5%, a difference of 0.39%), and Immigrants from Poland (10.6%, a difference of 0.50%).
| Demographics | Rating | Rank | Receiving Food Stamps |
| Pakistanis | 95.9 /100 | #110 | Exceptional 10.4% |
| Romanians | 95.8 /100 | #111 | Exceptional 10.4% |
| Mongolians | 95.8 /100 | #112 | Exceptional 10.5% |
| Icelanders | 95.4 /100 | #113 | Exceptional 10.5% |
| Scotch-Irish | 95.1 /100 | #114 | Exceptional 10.5% |
| Immigrants | Saudi Arabia | 94.9 /100 | #115 | Exceptional 10.5% |
| Canadians | 94.8 /100 | #116 | Exceptional 10.5% |
| Immigrants | Nepal | 94.6 /100 | #117 | Exceptional 10.6% |
| Assyrians/Chaldeans/Syriacs | 94.1 /100 | #118 | Exceptional 10.6% |
| Immigrants | Poland | 93.9 /100 | #119 | Exceptional 10.6% |
| Ethiopians | 93.9 /100 | #120 | Exceptional 10.6% |
| Slavs | 93.8 /100 | #121 | Exceptional 10.6% |
| Sri Lankans | 93.7 /100 | #122 | Exceptional 10.6% |
| Immigrants | Philippines | 93.3 /100 | #123 | Exceptional 10.7% |
| Paraguayans | 93.0 /100 | #124 | Exceptional 10.7% |