Norwegian vs Immigrants from Nepal Receiving Food Stamps
COMPARE
Norwegian
Immigrants from Nepal
Receiving Food Stamps
Receiving Food Stamps Comparison
Norwegians
Immigrants from Nepal
9.0%
RECEIVING FOOD STAMPS
99.9/ 100
METRIC RATING
15th/ 347
METRIC RANK
10.6%
RECEIVING FOOD STAMPS
94.6/ 100
METRIC RATING
117th/ 347
METRIC RANK
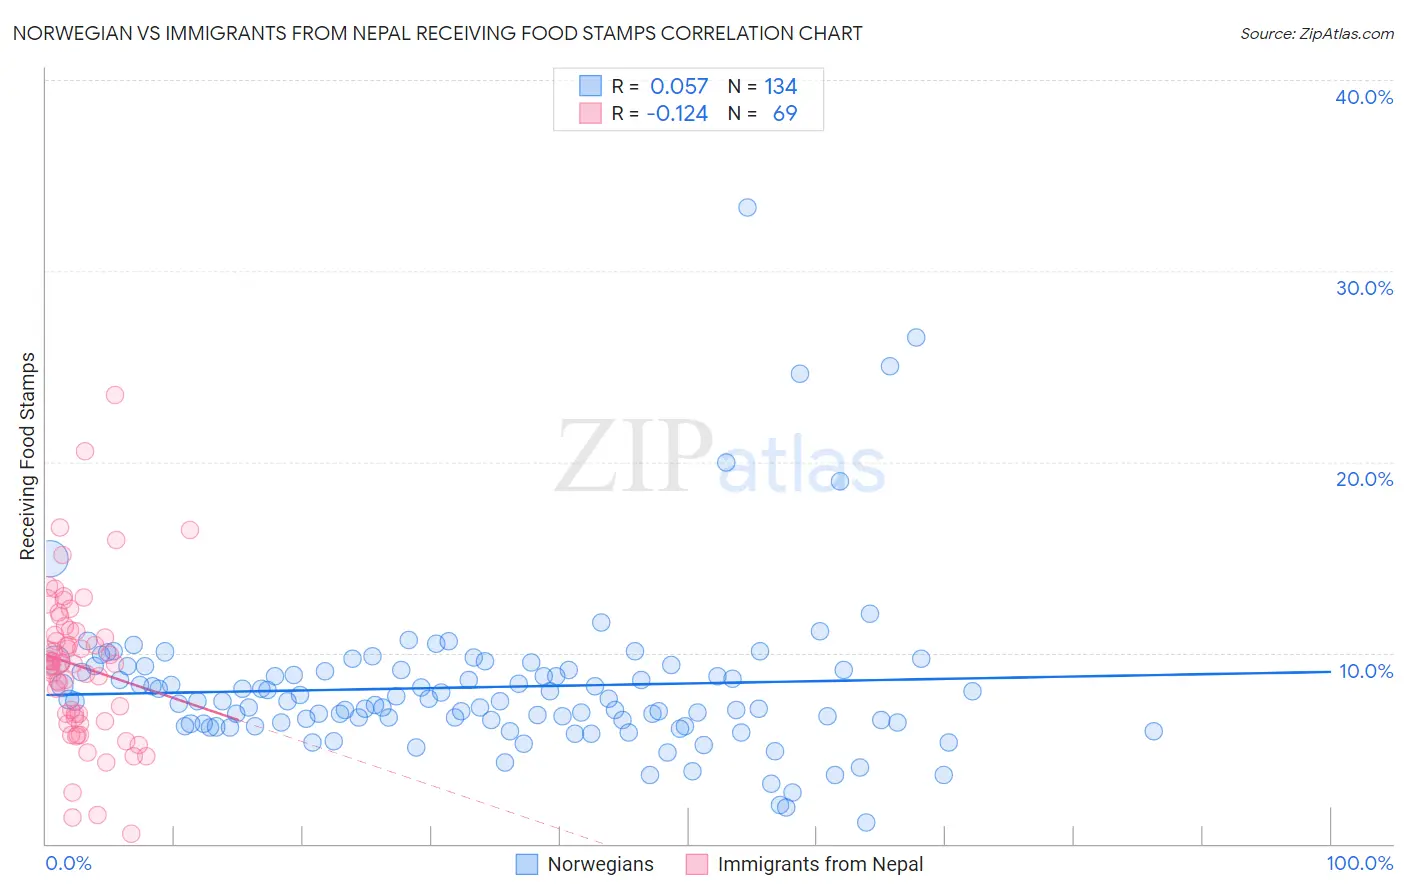
Norwegian vs Immigrants from Nepal Receiving Food Stamps Correlation Chart
The statistical analysis conducted on geographies consisting of 530,518,584 people shows a slight positive correlation between the proportion of Norwegians and percentage of population receiving government assistance and/or food stamps in the United States with a correlation coefficient (R) of 0.057 and weighted average of 9.0%. Similarly, the statistical analysis conducted on geographies consisting of 186,476,550 people shows a poor negative correlation between the proportion of Immigrants from Nepal and percentage of population receiving government assistance and/or food stamps in the United States with a correlation coefficient (R) of -0.124 and weighted average of 10.6%, a difference of 17.9%.
Receiving Food Stamps Correlation Summary
| Measurement | Norwegian | Immigrants from Nepal |
| Minimum | 1.1% | 0.50% |
| Maximum | 33.3% | 23.5% |
| Range | 32.2% | 23.0% |
| Mean | 8.2% | 9.3% |
| Median | 7.5% | 9.4% |
| Interquartile 25% (IQ1) | 6.3% | 6.5% |
| Interquartile 75% (IQ3) | 9.1% | 11.2% |
| Interquartile Range (IQR) | 2.8% | 4.7% |
| Standard Deviation (Sample) | 4.3% | 4.1% |
| Standard Deviation (Population) | 4.3% | 4.0% |
Similar Demographics by Receiving Food Stamps
Demographics Similar to Norwegians by Receiving Food Stamps
In terms of receiving food stamps, the demographic groups most similar to Norwegians are Immigrants from Japan (9.0%, a difference of 0.27%), Immigrants from Scotland (9.0%, a difference of 0.43%), Maltese (8.9%, a difference of 0.66%), Bulgarian (8.9%, a difference of 0.79%), and Danish (9.0%, a difference of 0.88%).
| Demographics | Rating | Rank | Receiving Food Stamps |
| Burmese | 99.9 /100 | #8 | Exceptional 8.6% |
| Immigrants | Korea | 99.9 /100 | #9 | Exceptional 8.7% |
| Immigrants | South Central Asia | 99.9 /100 | #10 | Exceptional 8.8% |
| Okinawans | 99.9 /100 | #11 | Exceptional 8.9% |
| Cypriots | 99.9 /100 | #12 | Exceptional 8.9% |
| Bulgarians | 99.9 /100 | #13 | Exceptional 8.9% |
| Maltese | 99.9 /100 | #14 | Exceptional 8.9% |
| Norwegians | 99.9 /100 | #15 | Exceptional 9.0% |
| Immigrants | Japan | 99.9 /100 | #16 | Exceptional 9.0% |
| Immigrants | Scotland | 99.9 /100 | #17 | Exceptional 9.0% |
| Danes | 99.9 /100 | #18 | Exceptional 9.0% |
| Immigrants | Hong Kong | 99.8 /100 | #19 | Exceptional 9.1% |
| Latvians | 99.8 /100 | #20 | Exceptional 9.1% |
| Luxembourgers | 99.8 /100 | #21 | Exceptional 9.1% |
| Immigrants | Australia | 99.8 /100 | #22 | Exceptional 9.2% |
Demographics Similar to Immigrants from Nepal by Receiving Food Stamps
In terms of receiving food stamps, the demographic groups most similar to Immigrants from Nepal are Canadian (10.5%, a difference of 0.16%), Immigrants from Saudi Arabia (10.5%, a difference of 0.21%), Assyrian/Chaldean/Syriac (10.6%, a difference of 0.34%), Scotch-Irish (10.5%, a difference of 0.39%), and Immigrants from Poland (10.6%, a difference of 0.50%).
| Demographics | Rating | Rank | Receiving Food Stamps |
| Pakistanis | 95.9 /100 | #110 | Exceptional 10.4% |
| Romanians | 95.8 /100 | #111 | Exceptional 10.4% |
| Mongolians | 95.8 /100 | #112 | Exceptional 10.5% |
| Icelanders | 95.4 /100 | #113 | Exceptional 10.5% |
| Scotch-Irish | 95.1 /100 | #114 | Exceptional 10.5% |
| Immigrants | Saudi Arabia | 94.9 /100 | #115 | Exceptional 10.5% |
| Canadians | 94.8 /100 | #116 | Exceptional 10.5% |
| Immigrants | Nepal | 94.6 /100 | #117 | Exceptional 10.6% |
| Assyrians/Chaldeans/Syriacs | 94.1 /100 | #118 | Exceptional 10.6% |
| Immigrants | Poland | 93.9 /100 | #119 | Exceptional 10.6% |
| Ethiopians | 93.9 /100 | #120 | Exceptional 10.6% |
| Slavs | 93.8 /100 | #121 | Exceptional 10.6% |
| Sri Lankans | 93.7 /100 | #122 | Exceptional 10.6% |
| Immigrants | Philippines | 93.3 /100 | #123 | Exceptional 10.7% |
| Paraguayans | 93.0 /100 | #124 | Exceptional 10.7% |