British West Indian vs Yugoslavian Married-Couple Family Poverty
COMPARE
British West Indian
Yugoslavian
Married-Couple Family Poverty
Married-Couple Family Poverty Comparison
British West Indians
Yugoslavians
7.1%
MARRIED-COUPLE FAMILY POVERTY
0.0/ 100
METRIC RATING
314th/ 347
METRIC RANK
4.6%
MARRIED-COUPLE FAMILY POVERTY
97.8/ 100
METRIC RATING
101st/ 347
METRIC RANK
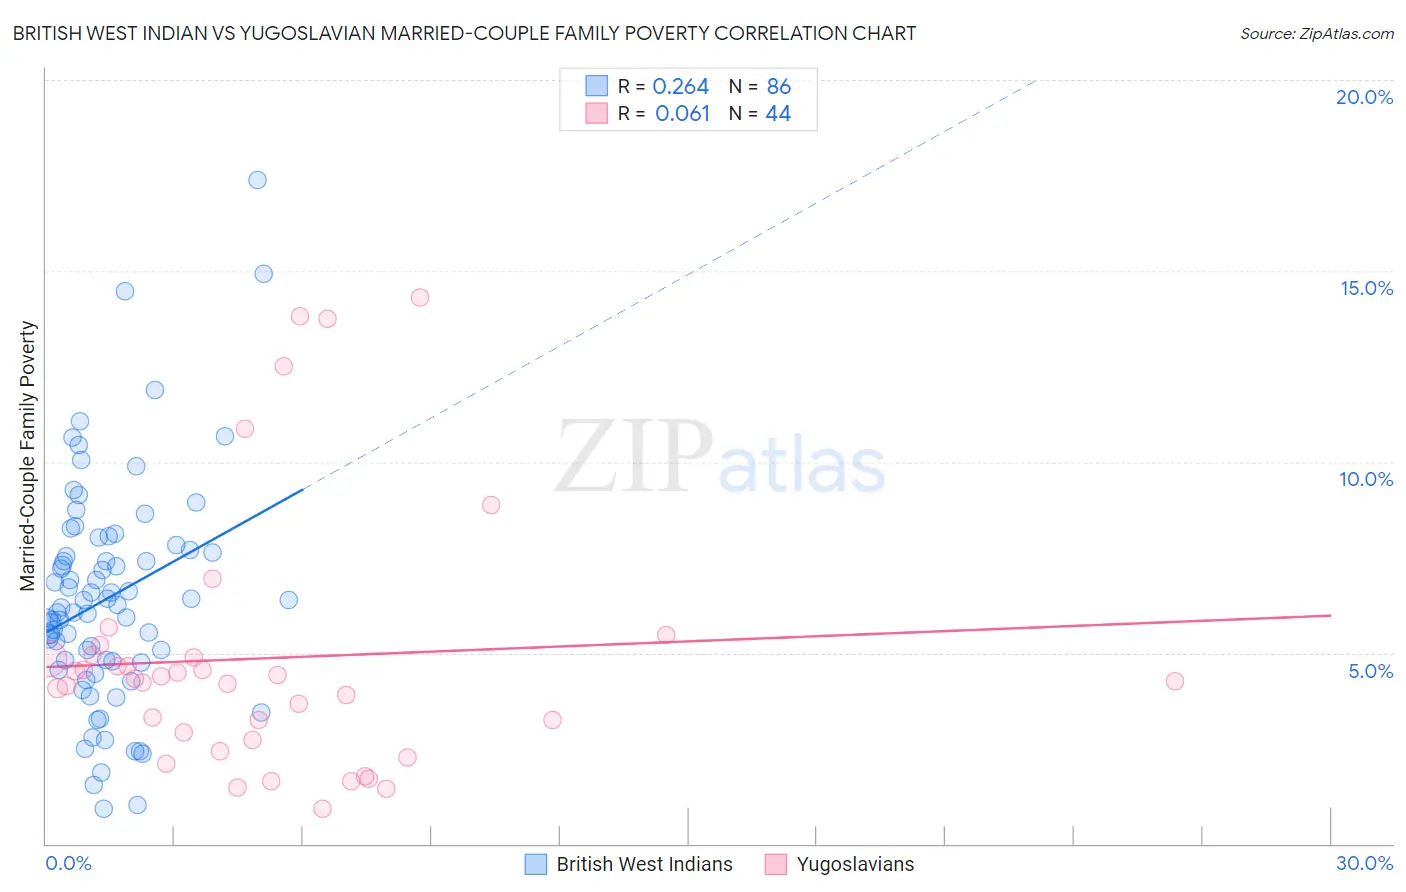
British West Indian vs Yugoslavian Married-Couple Family Poverty Correlation Chart
The statistical analysis conducted on geographies consisting of 152,203,560 people shows a weak positive correlation between the proportion of British West Indians and poverty level among married-couple families in the United States with a correlation coefficient (R) of 0.264 and weighted average of 7.1%. Similarly, the statistical analysis conducted on geographies consisting of 284,040,939 people shows a slight positive correlation between the proportion of Yugoslavians and poverty level among married-couple families in the United States with a correlation coefficient (R) of 0.061 and weighted average of 4.6%, a difference of 53.6%.
Married-Couple Family Poverty Correlation Summary
| Measurement | British West Indian | Yugoslavian |
| Minimum | 0.91% | 0.92% |
| Maximum | 17.4% | 14.3% |
| Range | 16.5% | 13.4% |
| Mean | 6.4% | 4.9% |
| Median | 6.2% | 4.3% |
| Interquartile 25% (IQ1) | 4.8% | 2.8% |
| Interquartile 75% (IQ3) | 7.7% | 4.9% |
| Interquartile Range (IQR) | 2.9% | 2.1% |
| Standard Deviation (Sample) | 2.9% | 3.4% |
| Standard Deviation (Population) | 2.9% | 3.3% |
Similar Demographics by Married-Couple Family Poverty
Demographics Similar to British West Indians by Married-Couple Family Poverty
In terms of married-couple family poverty, the demographic groups most similar to British West Indians are Inupiat (7.1%, a difference of 0.24%), Immigrants from St. Vincent and the Grenadines (7.1%, a difference of 0.30%), Honduran (7.2%, a difference of 0.39%), Immigrants from Dominica (7.1%, a difference of 0.41%), and Immigrants from Armenia (7.1%, a difference of 0.41%).
| Demographics | Rating | Rank | Married-Couple Family Poverty |
| Guatemalans | 0.0 /100 | #307 | Tragic 7.0% |
| Spanish American Indians | 0.0 /100 | #308 | Tragic 7.1% |
| Hopi | 0.0 /100 | #309 | Tragic 7.1% |
| Immigrants | Nicaragua | 0.0 /100 | #310 | Tragic 7.1% |
| Immigrants | Dominica | 0.0 /100 | #311 | Tragic 7.1% |
| Immigrants | Armenia | 0.0 /100 | #312 | Tragic 7.1% |
| Immigrants | St. Vincent and the Grenadines | 0.0 /100 | #313 | Tragic 7.1% |
| British West Indians | 0.0 /100 | #314 | Tragic 7.1% |
| Inupiat | 0.0 /100 | #315 | Tragic 7.1% |
| Hondurans | 0.0 /100 | #316 | Tragic 7.2% |
| Mexicans | 0.0 /100 | #317 | Tragic 7.2% |
| Immigrants | Guatemala | 0.0 /100 | #318 | Tragic 7.2% |
| Immigrants | Latin America | 0.0 /100 | #319 | Tragic 7.2% |
| Immigrants | Grenada | 0.0 /100 | #320 | Tragic 7.3% |
| Immigrants | Caribbean | 0.0 /100 | #321 | Tragic 7.3% |
Demographics Similar to Yugoslavians by Married-Couple Family Poverty
In terms of married-couple family poverty, the demographic groups most similar to Yugoslavians are Immigrants from Western Europe (4.6%, a difference of 0.020%), Immigrants from Europe (4.6%, a difference of 0.13%), Native Hawaiian (4.6%, a difference of 0.24%), Asian (4.7%, a difference of 0.40%), and Immigrants from Belgium (4.6%, a difference of 0.67%).
| Demographics | Rating | Rank | Married-Couple Family Poverty |
| Immigrants | Italy | 98.3 /100 | #94 | Exceptional 4.6% |
| Portuguese | 98.3 /100 | #95 | Exceptional 4.6% |
| Immigrants | Poland | 98.3 /100 | #96 | Exceptional 4.6% |
| Immigrants | Belgium | 98.2 /100 | #97 | Exceptional 4.6% |
| Native Hawaiians | 98.0 /100 | #98 | Exceptional 4.6% |
| Immigrants | Europe | 97.9 /100 | #99 | Exceptional 4.6% |
| Immigrants | Western Europe | 97.9 /100 | #100 | Exceptional 4.6% |
| Yugoslavians | 97.8 /100 | #101 | Exceptional 4.6% |
| Asians | 97.6 /100 | #102 | Exceptional 4.7% |
| Immigrants | Romania | 97.3 /100 | #103 | Exceptional 4.7% |
| Immigrants | Moldova | 97.1 /100 | #104 | Exceptional 4.7% |
| Aleuts | 97.0 /100 | #105 | Exceptional 4.7% |
| Immigrants | France | 96.9 /100 | #106 | Exceptional 4.7% |
| Immigrants | Germany | 96.8 /100 | #107 | Exceptional 4.7% |
| Laotians | 96.6 /100 | #108 | Exceptional 4.7% |