Greek vs Sudanese Receiving Food Stamps
COMPARE
Greek
Sudanese
Receiving Food Stamps
Receiving Food Stamps Comparison
Greeks
Sudanese
9.7%
RECEIVING FOOD STAMPS
99.3/ 100
METRIC RATING
57th/ 347
METRIC RANK
12.0%
RECEIVING FOOD STAMPS
33.4/ 100
METRIC RATING
188th/ 347
METRIC RANK
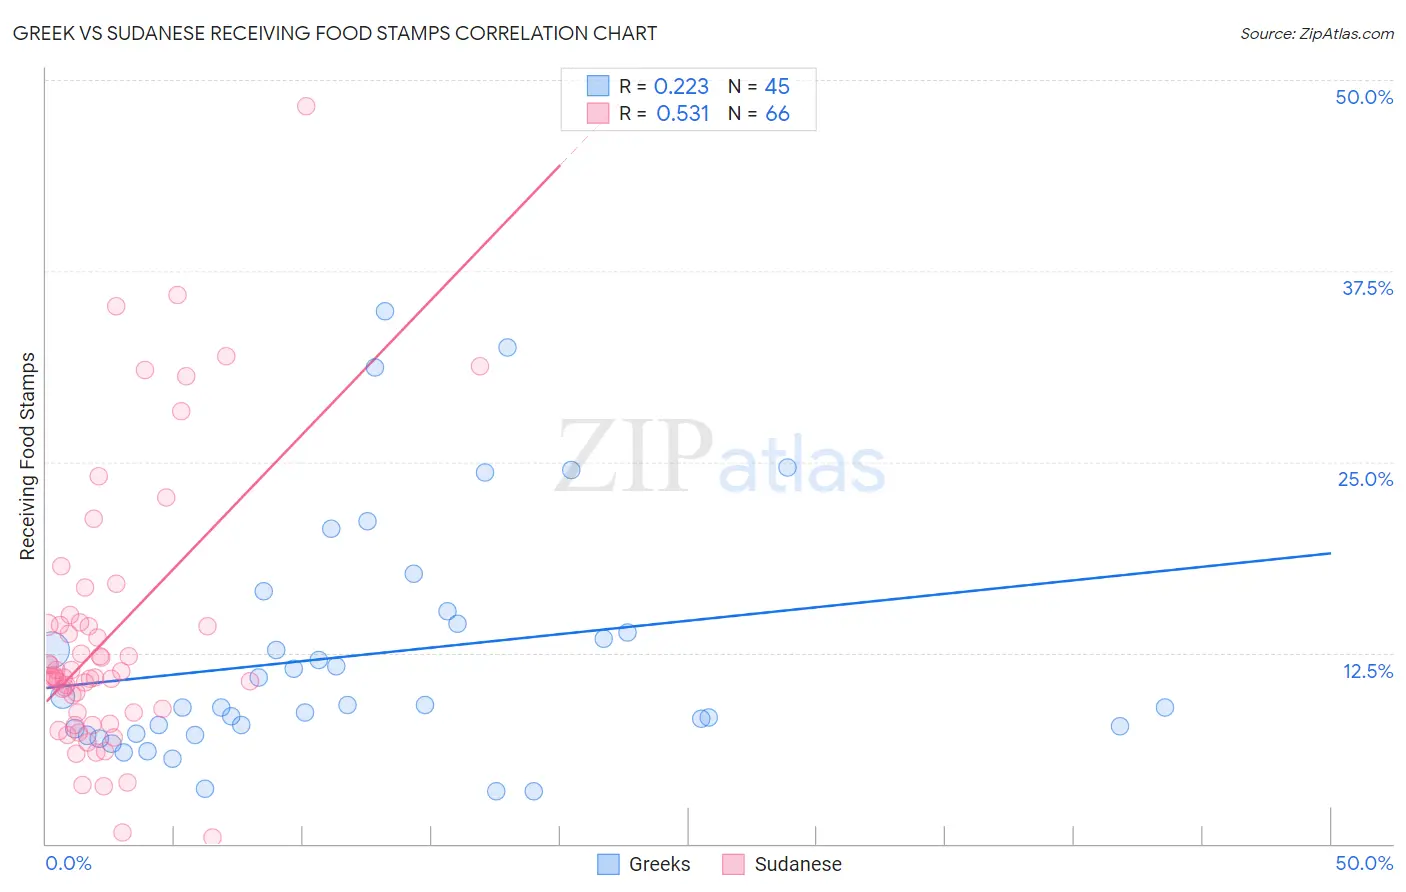
Greek vs Sudanese Receiving Food Stamps Correlation Chart
The statistical analysis conducted on geographies consisting of 480,606,207 people shows a weak positive correlation between the proportion of Greeks and percentage of population receiving government assistance and/or food stamps in the United States with a correlation coefficient (R) of 0.223 and weighted average of 9.7%. Similarly, the statistical analysis conducted on geographies consisting of 110,066,934 people shows a substantial positive correlation between the proportion of Sudanese and percentage of population receiving government assistance and/or food stamps in the United States with a correlation coefficient (R) of 0.531 and weighted average of 12.0%, a difference of 23.6%.
Receiving Food Stamps Correlation Summary
| Measurement | Greek | Sudanese |
| Minimum | 3.4% | 0.40% |
| Maximum | 34.9% | 48.3% |
| Range | 31.5% | 47.9% |
| Mean | 12.4% | 13.6% |
| Median | 9.0% | 10.9% |
| Interquartile 25% (IQ1) | 7.4% | 8.6% |
| Interquartile 75% (IQ3) | 14.8% | 14.3% |
| Interquartile Range (IQR) | 7.4% | 5.8% |
| Standard Deviation (Sample) | 7.7% | 9.0% |
| Standard Deviation (Population) | 7.7% | 8.9% |
Similar Demographics by Receiving Food Stamps
Demographics Similar to Greeks by Receiving Food Stamps
In terms of receiving food stamps, the demographic groups most similar to Greeks are Scandinavian (9.7%, a difference of 0.060%), British (9.7%, a difference of 0.090%), Immigrants from Canada (9.7%, a difference of 0.11%), German (9.7%, a difference of 0.19%), and Immigrants from Switzerland (9.7%, a difference of 0.29%).
| Demographics | Rating | Rank | Receiving Food Stamps |
| Lithuanians | 99.4 /100 | #50 | Exceptional 9.7% |
| Asians | 99.3 /100 | #51 | Exceptional 9.7% |
| Immigrants | South Africa | 99.3 /100 | #52 | Exceptional 9.7% |
| Tongans | 99.3 /100 | #53 | Exceptional 9.7% |
| Swiss | 99.3 /100 | #54 | Exceptional 9.7% |
| Immigrants | Switzerland | 99.3 /100 | #55 | Exceptional 9.7% |
| Immigrants | Canada | 99.3 /100 | #56 | Exceptional 9.7% |
| Greeks | 99.3 /100 | #57 | Exceptional 9.7% |
| Scandinavians | 99.2 /100 | #58 | Exceptional 9.7% |
| British | 99.2 /100 | #59 | Exceptional 9.7% |
| Germans | 99.2 /100 | #60 | Exceptional 9.7% |
| English | 99.2 /100 | #61 | Exceptional 9.8% |
| Immigrants | Bulgaria | 99.2 /100 | #62 | Exceptional 9.8% |
| Chinese | 99.2 /100 | #63 | Exceptional 9.8% |
| Immigrants | North America | 99.2 /100 | #64 | Exceptional 9.8% |
Demographics Similar to Sudanese by Receiving Food Stamps
In terms of receiving food stamps, the demographic groups most similar to Sudanese are Immigrants from Cameroon (12.0%, a difference of 0.14%), Immigrants from Peru (12.0%, a difference of 0.20%), Venezuelan (12.0%, a difference of 0.20%), Albanian (12.0%, a difference of 0.31%), and Samoan (12.1%, a difference of 0.38%).
| Demographics | Rating | Rank | Receiving Food Stamps |
| South American Indians | 41.7 /100 | #181 | Average 11.9% |
| Immigrants | Morocco | 40.7 /100 | #182 | Average 11.9% |
| Immigrants | Uganda | 40.3 /100 | #183 | Average 11.9% |
| Spaniards | 39.8 /100 | #184 | Fair 11.9% |
| Immigrants | Iraq | 37.1 /100 | #185 | Fair 12.0% |
| Spanish | 36.9 /100 | #186 | Fair 12.0% |
| Albanians | 35.4 /100 | #187 | Fair 12.0% |
| Sudanese | 33.4 /100 | #188 | Fair 12.0% |
| Immigrants | Cameroon | 32.5 /100 | #189 | Fair 12.0% |
| Immigrants | Peru | 32.2 /100 | #190 | Fair 12.0% |
| Venezuelans | 32.1 /100 | #191 | Fair 12.0% |
| Samoans | 31.0 /100 | #192 | Fair 12.1% |
| Immigrants | Fiji | 27.8 /100 | #193 | Fair 12.1% |
| Immigrants | Sudan | 27.1 /100 | #194 | Fair 12.1% |
| Americans | 26.7 /100 | #195 | Fair 12.2% |