Assyrian/Chaldean/Syriac vs Immigrants from Norway Married-Couple Family Poverty
COMPARE
Assyrian/Chaldean/Syriac
Immigrants from Norway
Married-Couple Family Poverty
Married-Couple Family Poverty Comparison
Assyrians/Chaldeans/Syriacs
Immigrants from Norway
4.9%
MARRIED-COUPLE FAMILY POVERTY
89.4/ 100
METRIC RATING
135th/ 347
METRIC RANK
4.6%
MARRIED-COUPLE FAMILY POVERTY
98.4/ 100
METRIC RATING
92nd/ 347
METRIC RANK
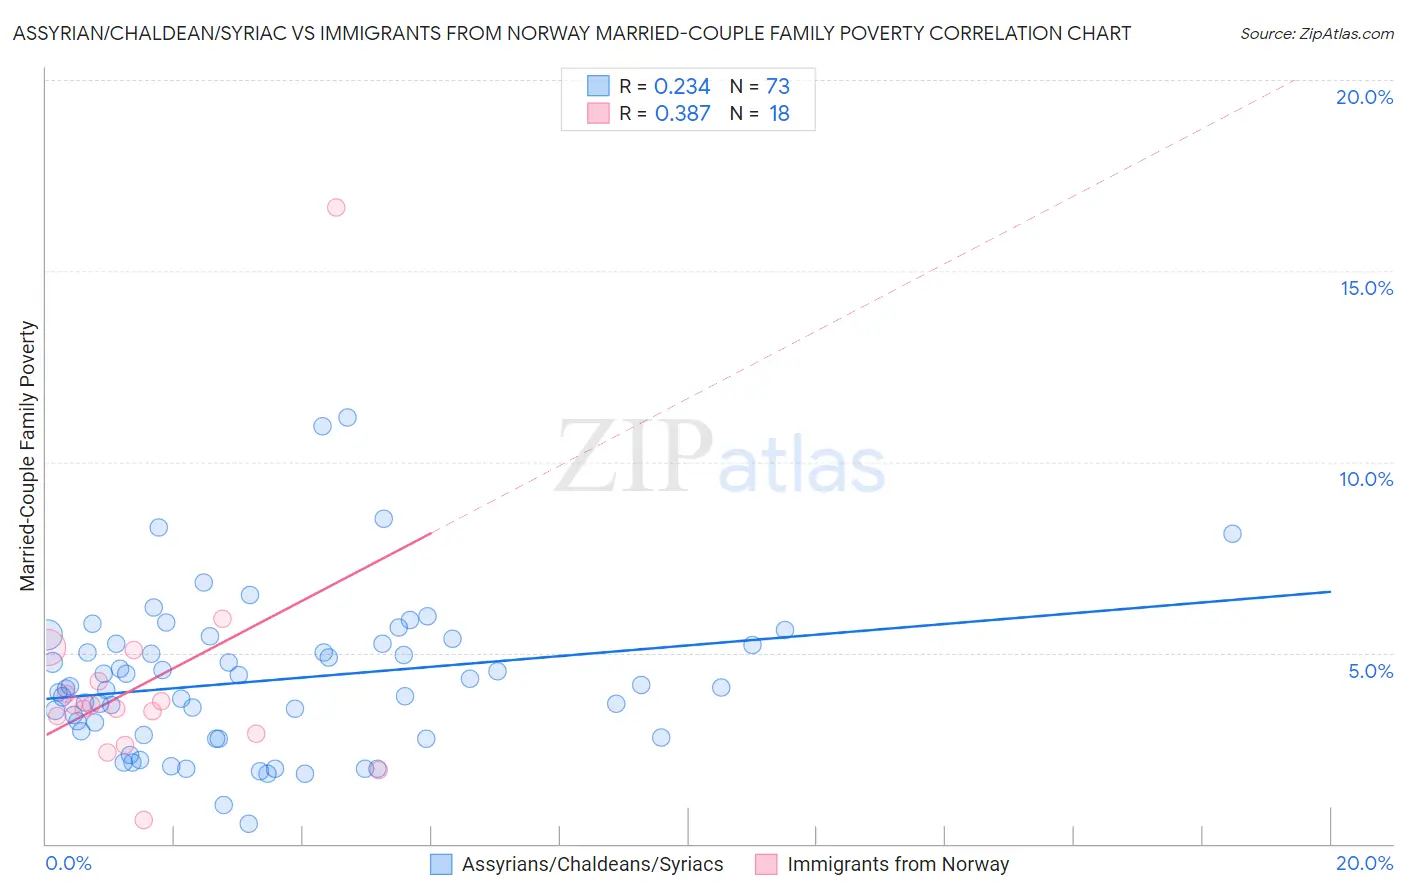
Assyrian/Chaldean/Syriac vs Immigrants from Norway Married-Couple Family Poverty Correlation Chart
The statistical analysis conducted on geographies consisting of 109,936,047 people shows a weak positive correlation between the proportion of Assyrians/Chaldeans/Syriacs and poverty level among married-couple families in the United States with a correlation coefficient (R) of 0.234 and weighted average of 4.9%. Similarly, the statistical analysis conducted on geographies consisting of 116,278,414 people shows a mild positive correlation between the proportion of Immigrants from Norway and poverty level among married-couple families in the United States with a correlation coefficient (R) of 0.387 and weighted average of 4.6%, a difference of 6.6%.
Married-Couple Family Poverty Correlation Summary
| Measurement | Assyrian/Chaldean/Syriac | Immigrants from Norway |
| Minimum | 0.54% | 0.62% |
| Maximum | 11.2% | 16.7% |
| Range | 10.6% | 16.1% |
| Mean | 4.3% | 4.2% |
| Median | 4.1% | 3.6% |
| Interquartile 25% (IQ1) | 2.8% | 2.9% |
| Interquartile 75% (IQ3) | 5.2% | 4.2% |
| Interquartile Range (IQR) | 2.4% | 1.4% |
| Standard Deviation (Sample) | 2.0% | 3.3% |
| Standard Deviation (Population) | 2.0% | 3.2% |
Similar Demographics by Married-Couple Family Poverty
Demographics Similar to Assyrians/Chaldeans/Syriacs by Married-Couple Family Poverty
In terms of married-couple family poverty, the demographic groups most similar to Assyrians/Chaldeans/Syriacs are Immigrants from Hungary (4.9%, a difference of 0.22%), Samoan (4.9%, a difference of 0.28%), Immigrants from Kenya (4.9%, a difference of 0.29%), Puget Sound Salish (4.9%, a difference of 0.36%), and Immigrants from Eastern Europe (4.9%, a difference of 0.37%).
| Demographics | Rating | Rank | Married-Couple Family Poverty |
| Palestinians | 91.2 /100 | #128 | Exceptional 4.9% |
| Immigrants | Pakistan | 90.7 /100 | #129 | Exceptional 4.9% |
| Soviet Union | 90.7 /100 | #130 | Exceptional 4.9% |
| Immigrants | Eastern Europe | 90.5 /100 | #131 | Exceptional 4.9% |
| Puget Sound Salish | 90.4 /100 | #132 | Exceptional 4.9% |
| Immigrants | Kenya | 90.2 /100 | #133 | Exceptional 4.9% |
| Samoans | 90.2 /100 | #134 | Exceptional 4.9% |
| Assyrians/Chaldeans/Syriacs | 89.4 /100 | #135 | Excellent 4.9% |
| Immigrants | Hungary | 88.7 /100 | #136 | Excellent 4.9% |
| Guamanians/Chamorros | 86.5 /100 | #137 | Excellent 4.9% |
| Chileans | 86.0 /100 | #138 | Excellent 4.9% |
| German Russians | 85.1 /100 | #139 | Excellent 5.0% |
| Immigrants | Portugal | 84.8 /100 | #140 | Excellent 5.0% |
| Immigrants | Brazil | 84.6 /100 | #141 | Excellent 5.0% |
| Immigrants | China | 84.6 /100 | #142 | Excellent 5.0% |
Demographics Similar to Immigrants from Norway by Married-Couple Family Poverty
In terms of married-couple family poverty, the demographic groups most similar to Immigrants from Norway are Basque (4.6%, a difference of 0.080%), Immigrants from Switzerland (4.6%, a difference of 0.11%), Immigrants from Czechoslovakia (4.6%, a difference of 0.18%), Korean (4.6%, a difference of 0.18%), and Immigrants from Italy (4.6%, a difference of 0.23%).
| Demographics | Rating | Rank | Married-Couple Family Poverty |
| South Africans | 98.7 /100 | #85 | Exceptional 4.6% |
| Immigrants | Turkey | 98.6 /100 | #86 | Exceptional 4.6% |
| Immigrants | North Macedonia | 98.6 /100 | #87 | Exceptional 4.6% |
| Bolivians | 98.6 /100 | #88 | Exceptional 4.6% |
| Immigrants | Czechoslovakia | 98.5 /100 | #89 | Exceptional 4.6% |
| Immigrants | Switzerland | 98.5 /100 | #90 | Exceptional 4.6% |
| Basques | 98.5 /100 | #91 | Exceptional 4.6% |
| Immigrants | Norway | 98.4 /100 | #92 | Exceptional 4.6% |
| Koreans | 98.3 /100 | #93 | Exceptional 4.6% |
| Immigrants | Italy | 98.3 /100 | #94 | Exceptional 4.6% |
| Portuguese | 98.3 /100 | #95 | Exceptional 4.6% |
| Immigrants | Poland | 98.3 /100 | #96 | Exceptional 4.6% |
| Immigrants | Belgium | 98.2 /100 | #97 | Exceptional 4.6% |
| Native Hawaiians | 98.0 /100 | #98 | Exceptional 4.6% |
| Immigrants | Europe | 97.9 /100 | #99 | Exceptional 4.6% |