Zip Codes with the Highest Percentage of Population Employed in Architecture & Engineering in Beaverton, OR
RELATED REPORTS & OPTIONS
Architecture & Engineering
Beaverton
Compare Zip Codes
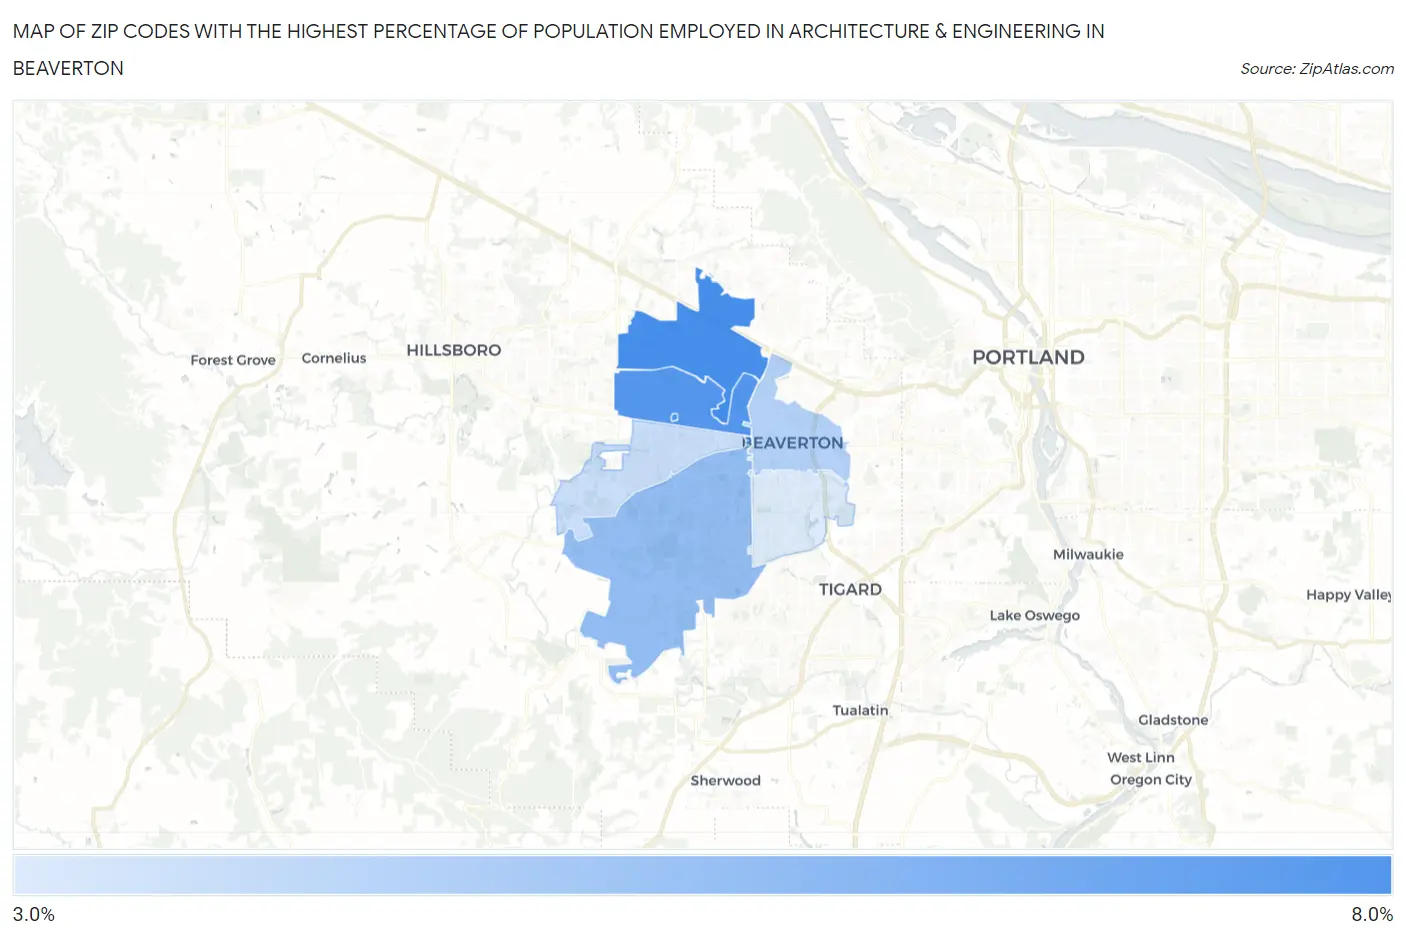
Map of Zip Codes with the Highest Percentage of Population Employed in Architecture & Engineering in Beaverton
3.3%
7.5%
Zip Codes with the Highest Percentage of Population Employed in Architecture & Engineering in Beaverton, OR
| Zip Code | % Employed | vs State | vs National | |
| 1. | 97006 | 7.5% | 2.8%(+4.73)#17 | 2.1%(+5.40)#648 |
| 2. | 97003 | 7.1% | 2.8%(+4.31)#18 | 2.1%(+4.97)#723 |
| 3. | 97007 | 5.4% | 2.8%(+2.57)#27 | 2.1%(+3.23)#1,402 |
| 4. | 97005 | 4.5% | 2.8%(+1.64)#39 | 2.1%(+2.31)#2,186 |
| 5. | 97078 | 3.9% | 2.8%(+1.05)#48 | 2.1%(+1.72)#2,988 |
| 6. | 97008 | 3.3% | 2.8%(+0.501)#65 | 2.1%(+1.17)#4,163 |
1
Common Questions
What are the Top 5 Zip Codes with the Highest Percentage of Population Employed in Architecture & Engineering in Beaverton, OR?
Top 5 Zip Codes with the Highest Percentage of Population Employed in Architecture & Engineering in Beaverton, OR are:
What zip code has the Highest Percentage of Population Employed in Architecture & Engineering in Beaverton, OR?
97006 has the Highest Percentage of Population Employed in Architecture & Engineering in Beaverton, OR with 7.5%.
What is the Percentage of Population Employed in Architecture & Engineering in Beaverton, OR?
Percentage of Population Employed in Architecture & Engineering in Beaverton is 4.5%.
What is the Percentage of Population Employed in Architecture & Engineering in Oregon?
Percentage of Population Employed in Architecture & Engineering in Oregon is 2.8%.
What is the Percentage of Population Employed in Architecture & Engineering in the United States?
Percentage of Population Employed in Architecture & Engineering in the United States is 2.1%.