Zip Codes with the Highest Percentage of Population Employed in Architecture & Engineering in Hillsboro, OR
RELATED REPORTS & OPTIONS
Architecture & Engineering
Hillsboro
Compare Zip Codes
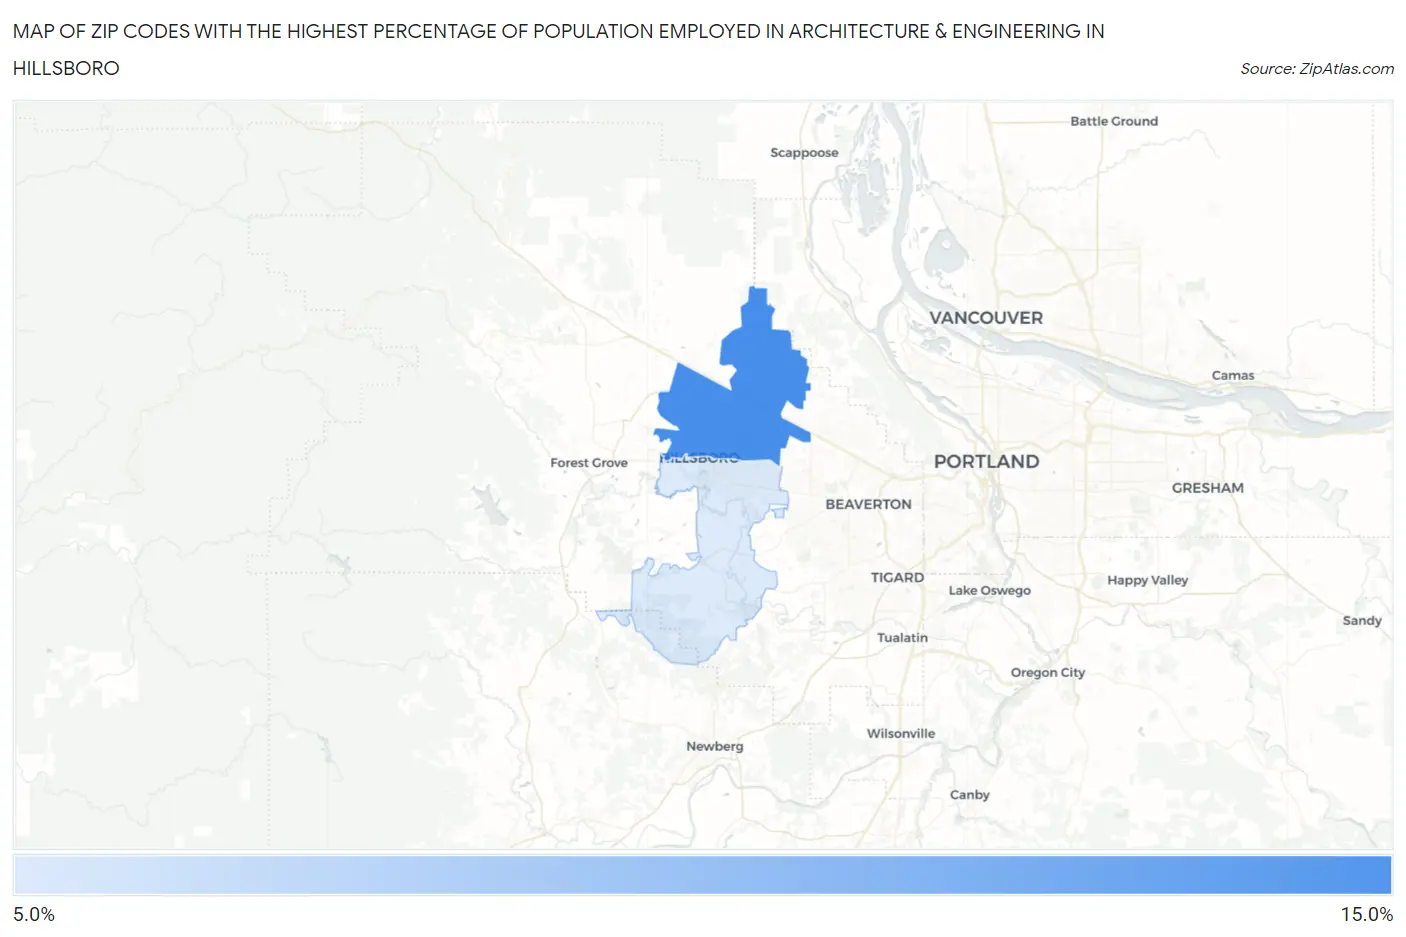
Map of Zip Codes with the Highest Percentage of Population Employed in Architecture & Engineering in Hillsboro
8.2%
12.7%
Zip Codes with the Highest Percentage of Population Employed in Architecture & Engineering in Hillsboro, OR
| Zip Code | % Employed | vs State | vs National | |
| 1. | 97124 | 12.7% | 2.8%(+9.92)#3 | 2.1%(+10.6)#210 |
| 2. | 97123 | 8.2% | 2.8%(+5.40)#14 | 2.1%(+6.06)#536 |
1
Common Questions
What are the Top Zip Codes with the Highest Percentage of Population Employed in Architecture & Engineering in Hillsboro, OR?
Top Zip Codes with the Highest Percentage of Population Employed in Architecture & Engineering in Hillsboro, OR are:
What zip code has the Highest Percentage of Population Employed in Architecture & Engineering in Hillsboro, OR?
97124 has the Highest Percentage of Population Employed in Architecture & Engineering in Hillsboro, OR with 12.7%.
What is the Percentage of Population Employed in Architecture & Engineering in Hillsboro, OR?
Percentage of Population Employed in Architecture & Engineering in Hillsboro is 11.2%.
What is the Percentage of Population Employed in Architecture & Engineering in Oregon?
Percentage of Population Employed in Architecture & Engineering in Oregon is 2.8%.
What is the Percentage of Population Employed in Architecture & Engineering in the United States?
Percentage of Population Employed in Architecture & Engineering in the United States is 2.1%.