Woodville, OH Map & Demographics
Woodville Map
Woodville Overview
$40,160
PER CAPITA INCOME
$108,750
AVG FAMILY INCOME
$78,438
AVG HOUSEHOLD INCOME
28.4%
WAGE / INCOME GAP [ % ]
71.6¢/ $1
WAGE / INCOME GAP [ $ ]
0.40
INEQUALITY / GINI INDEX
1,912
TOTAL POPULATION
887
MALE POPULATION
1,025
FEMALE POPULATION
86.54
MALES / 100 FEMALES
115.56
FEMALES / 100 MALES
39.9
MEDIAN AGE
3.0
AVG FAMILY SIZE
2.3
AVG HOUSEHOLD SIZE
1,058
LABOR FORCE [ PEOPLE ]
70.6%
PERCENT IN LABOR FORCE
5.5%
UNEMPLOYMENT RATE
Woodville Zip Codes
Income in Woodville
Income Overview in Woodville
Per Capita Income in Woodville is $40,160, while median incomes of families and households are $108,750 and $78,438 respectively.
| Characteristic | Number | Measure |
| Per Capita Income | 1,912 | $40,160 |
| Median Family Income | 475 | $108,750 |
| Mean Family Income | 475 | $117,256 |
| Median Household Income | 841 | $78,438 |
| Mean Household Income | 841 | $89,889 |
| Income Deficit | 475 | $0 |
| Wage / Income Gap (%) | 1,912 | 28.44% |
| Wage / Income Gap ($) | 1,912 | 71.56¢ per $1 |
| Gini / Inequality Index | 1,912 | 0.40 |
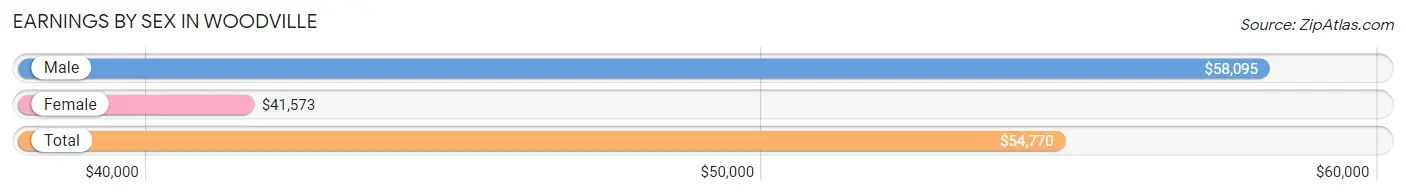
Earnings by Sex in Woodville
Average Earnings in Woodville are $54,770, $58,095 for men and $41,573 for women, a difference of 28.4%.
| Sex | Number | Average Earnings |
| Male | 514 (46.6%) | $58,095 |
| Female | 589 (53.4%) | $41,573 |
| Total | 1,103 (100.0%) | $54,770 |
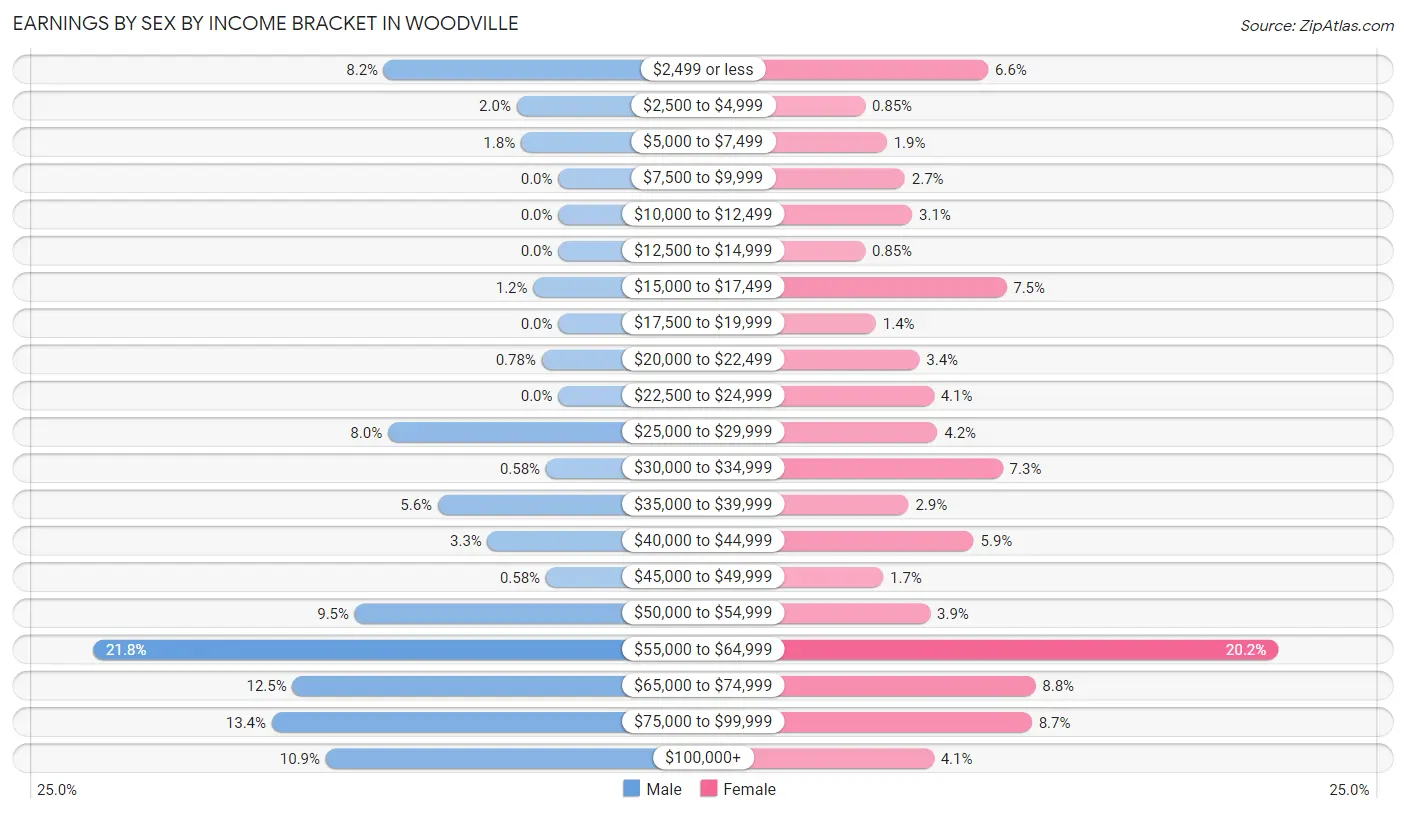
Earnings by Sex by Income Bracket in Woodville
The most common earnings brackets in Woodville are $55,000 to $64,999 for men (112 | 21.8%) and $55,000 to $64,999 for women (119 | 20.2%).
| Income | Male | Female |
| $2,499 or less | 42 (8.2%) | 39 (6.6%) |
| $2,500 to $4,999 | 10 (1.9%) | 5 (0.9%) |
| $5,000 to $7,499 | 9 (1.8%) | 11 (1.9%) |
| $7,500 to $9,999 | 0 (0.0%) | 16 (2.7%) |
| $10,000 to $12,499 | 0 (0.0%) | 18 (3.1%) |
| $12,500 to $14,999 | 0 (0.0%) | 5 (0.9%) |
| $15,000 to $17,499 | 6 (1.2%) | 44 (7.5%) |
| $17,500 to $19,999 | 0 (0.0%) | 8 (1.4%) |
| $20,000 to $22,499 | 4 (0.8%) | 20 (3.4%) |
| $22,500 to $24,999 | 0 (0.0%) | 24 (4.1%) |
| $25,000 to $29,999 | 41 (8.0%) | 25 (4.2%) |
| $30,000 to $34,999 | 3 (0.6%) | 43 (7.3%) |
| $35,000 to $39,999 | 29 (5.6%) | 17 (2.9%) |
| $40,000 to $44,999 | 17 (3.3%) | 35 (5.9%) |
| $45,000 to $49,999 | 3 (0.6%) | 10 (1.7%) |
| $50,000 to $54,999 | 49 (9.5%) | 23 (3.9%) |
| $55,000 to $64,999 | 112 (21.8%) | 119 (20.2%) |
| $65,000 to $74,999 | 64 (12.4%) | 52 (8.8%) |
| $75,000 to $99,999 | 69 (13.4%) | 51 (8.7%) |
| $100,000+ | 56 (10.9%) | 24 (4.1%) |
| Total | 514 (100.0%) | 589 (100.0%) |
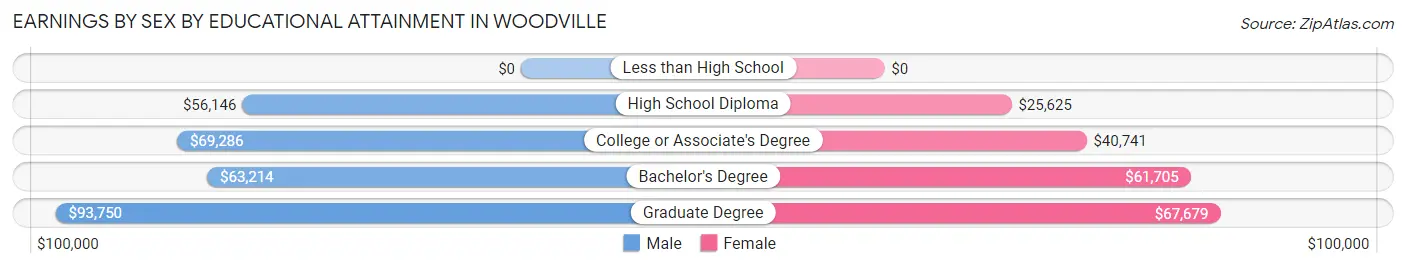
Earnings by Sex by Educational Attainment in Woodville
Average earnings in Woodville are $59,306 for men and $42,379 for women, a difference of 28.5%. Men with an educational attainment of graduate degree enjoy the highest average annual earnings of $93,750, while those with high school diploma education earn the least with $56,146. Women with an educational attainment of graduate degree earn the most with the average annual earnings of $67,679, while those with high school diploma education have the smallest earnings of $25,625.
| Educational Attainment | Male Income | Female Income |
| Less than High School | - | - |
| High School Diploma | $56,146 | $25,625 |
| College or Associate's Degree | $69,286 | $40,741 |
| Bachelor's Degree | $63,214 | $61,705 |
| Graduate Degree | $93,750 | $67,679 |
| Total | $59,306 | $42,379 |
Family Income in Woodville
Family Income Brackets in Woodville
According to the Woodville family income data, there are 144 families falling into the $100,000 to $149,999 income range, which is the most common income bracket and makes up 30.3% of all families.
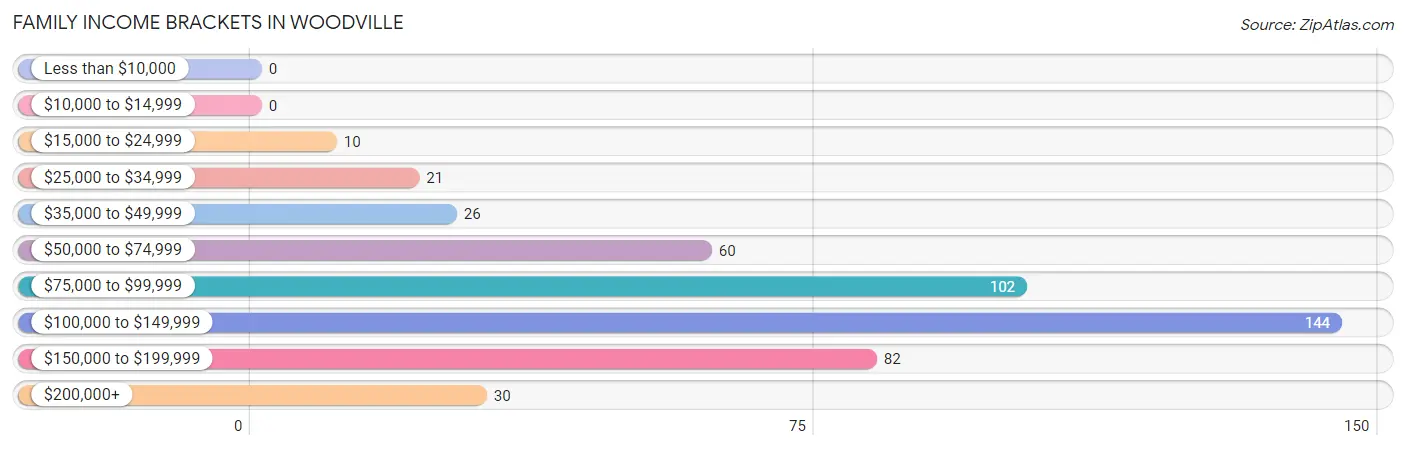
| Income Bracket | # Families | % Families |
| Less than $10,000 | 0 | 0.0% |
| $10,000 to $14,999 | 0 | 0.0% |
| $15,000 to $24,999 | 10 | 2.1% |
| $25,000 to $34,999 | 21 | 4.4% |
| $35,000 to $49,999 | 26 | 5.5% |
| $50,000 to $74,999 | 60 | 12.6% |
| $75,000 to $99,999 | 102 | 21.5% |
| $100,000 to $149,999 | 144 | 30.3% |
| $150,000 to $199,999 | 82 | 17.3% |
| $200,000+ | 30 | 6.3% |
Family Income by Famaliy Size in Woodville
4-person families (96 | 20.2%) account for the highest median family income in Woodville with $120,833 per family, while 2-person families (258 | 54.3%) have the highest median income of $55,302 per family member.
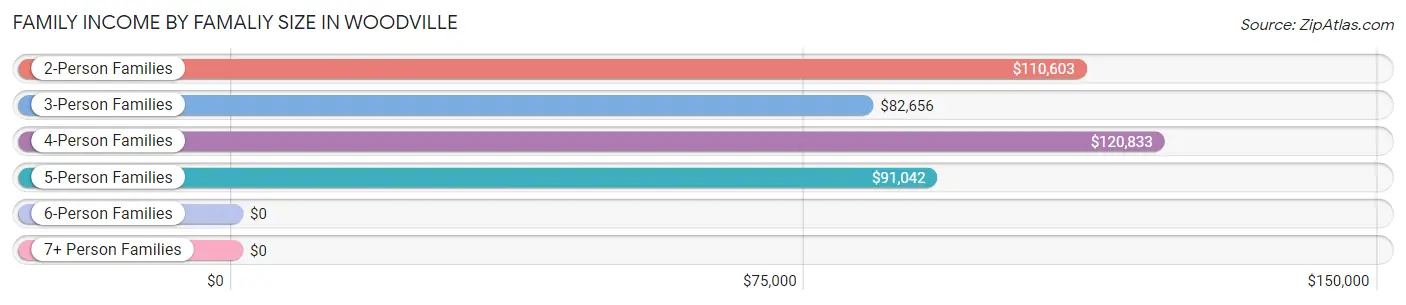
| Income Bracket | # Families | Median Income |
| 2-Person Families | 258 (54.3%) | $110,603 |
| 3-Person Families | 75 (15.8%) | $82,656 |
| 4-Person Families | 96 (20.2%) | $120,833 |
| 5-Person Families | 29 (6.1%) | $91,042 |
| 6-Person Families | 17 (3.6%) | $0 |
| 7+ Person Families | 0 (0.0%) | $0 |
| Total | 475 (100.0%) | $108,750 |
Family Income by Number of Earners in Woodville
The median family income in Woodville is $108,750, with families comprising 3+ earners (39) having the highest median family income of $195,368, while families with no earners (46) have the lowest median family income of $61,667, accounting for 8.2% and 9.7% of families, respectively.
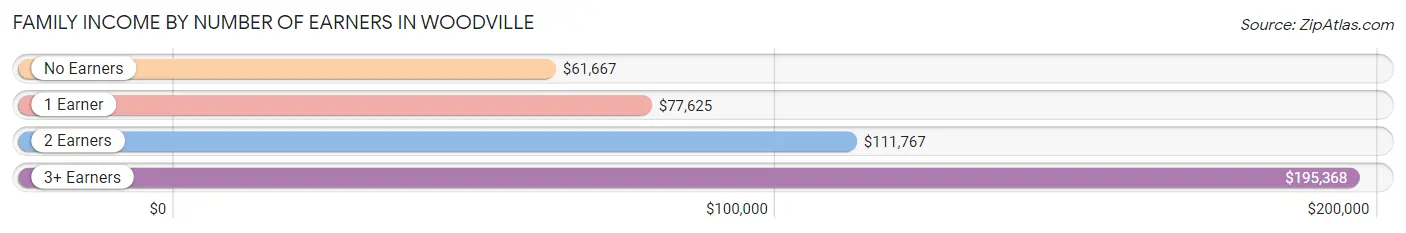
| Number of Earners | # Families | Median Income |
| No Earners | 46 (9.7%) | $61,667 |
| 1 Earner | 111 (23.4%) | $77,625 |
| 2 Earners | 279 (58.7%) | $111,767 |
| 3+ Earners | 39 (8.2%) | $195,368 |
| Total | 475 (100.0%) | $108,750 |
Household Income in Woodville
Household Income Brackets in Woodville
With 176 households falling in the category, the $100,000 to $149,999 income range is the most frequent in Woodville, accounting for 20.9% of all households. In contrast, only 17 households (2.0%) fall into the $10,000 to $14,999 income bracket, making it the least populous group.
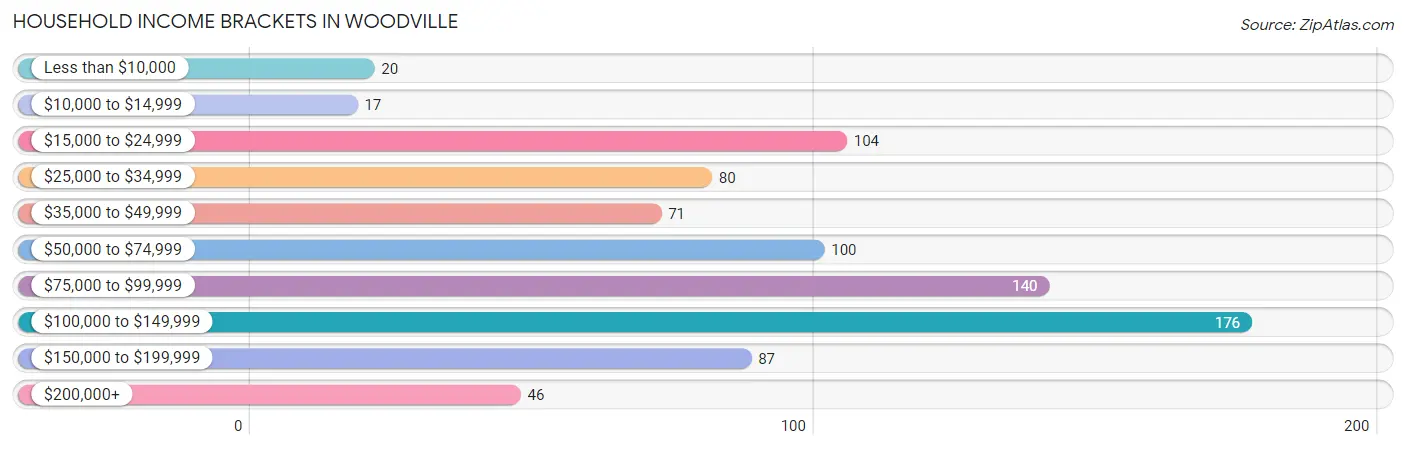
| Income Bracket | # Households | % Households |
| Less than $10,000 | 20 | 2.4% |
| $10,000 to $14,999 | 17 | 2.0% |
| $15,000 to $24,999 | 104 | 12.4% |
| $25,000 to $34,999 | 80 | 9.5% |
| $35,000 to $49,999 | 71 | 8.4% |
| $50,000 to $74,999 | 100 | 11.9% |
| $75,000 to $99,999 | 140 | 16.6% |
| $100,000 to $149,999 | 176 | 20.9% |
| $150,000 to $199,999 | 87 | 10.3% |
| $200,000+ | 46 | 5.5% |
Household Income by Householder Age in Woodville
The median household income in Woodville is $78,438, with the highest median household income of $104,231 found in the 25 to 44 years age bracket for the primary householder. A total of 266 households (31.6%) fall into this category. Meanwhile, the 15 to 24 years age bracket for the primary householder has the lowest median household income of $0, with 6 households (0.7%) in this group.
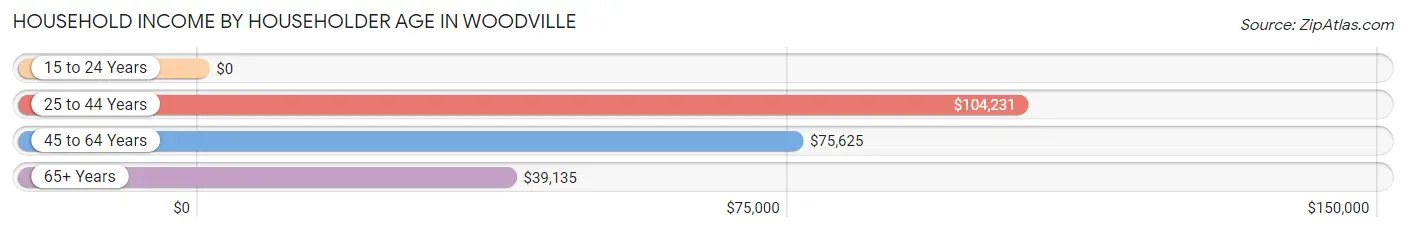
| Income Bracket | # Households | Median Income |
| 15 to 24 Years | 6 (0.7%) | $0 |
| 25 to 44 Years | 266 (31.6%) | $104,231 |
| 45 to 64 Years | 330 (39.2%) | $75,625 |
| 65+ Years | 239 (28.4%) | $39,135 |
| Total | 841 (100.0%) | $78,438 |
Poverty in Woodville
Income Below Poverty by Sex and Age in Woodville
With 1.2% poverty level for males and 2.8% for females among the residents of Woodville, 75 year old and over males and 65 to 74 year old females are the most vulnerable to poverty, with 11 males (19.6%) and 12 females (8.2%) in their respective age groups living below the poverty level.
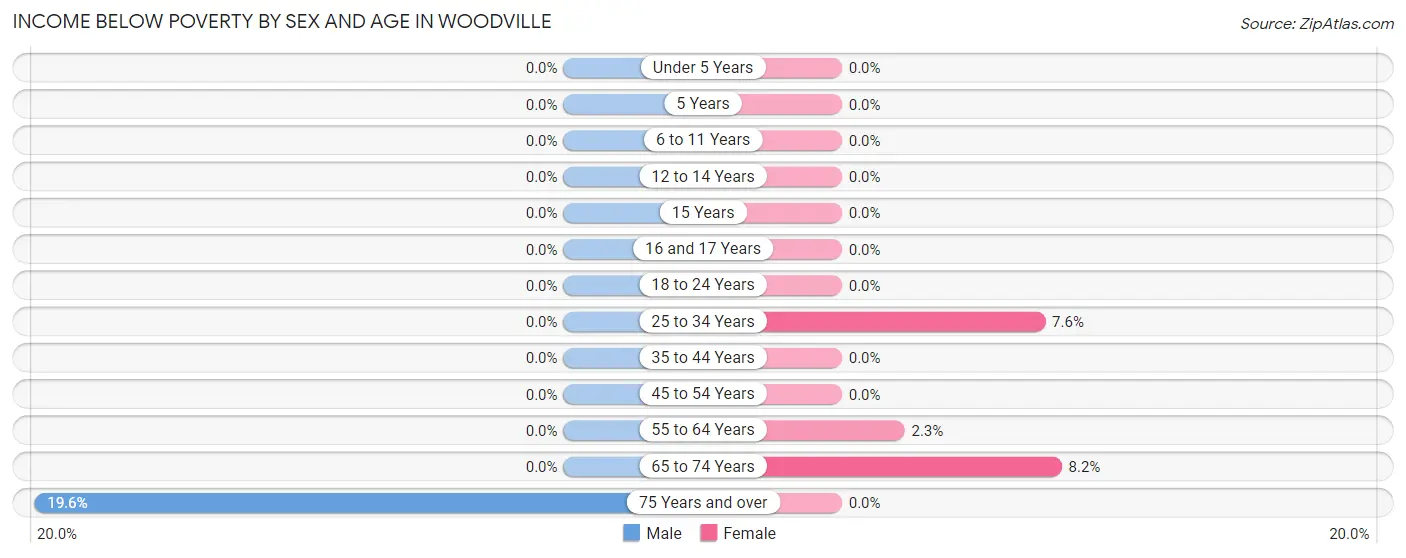
| Age Bracket | Male | Female |
| Under 5 Years | 0 (0.0%) | 0 (0.0%) |
| 5 Years | 0 (0.0%) | 0 (0.0%) |
| 6 to 11 Years | 0 (0.0%) | 0 (0.0%) |
| 12 to 14 Years | 0 (0.0%) | 0 (0.0%) |
| 15 Years | 0 (0.0%) | 0 (0.0%) |
| 16 and 17 Years | 0 (0.0%) | 0 (0.0%) |
| 18 to 24 Years | 0 (0.0%) | 0 (0.0%) |
| 25 to 34 Years | 0 (0.0%) | 12 (7.5%) |
| 35 to 44 Years | 0 (0.0%) | 0 (0.0%) |
| 45 to 54 Years | 0 (0.0%) | 0 (0.0%) |
| 55 to 64 Years | 0 (0.0%) | 4 (2.3%) |
| 65 to 74 Years | 0 (0.0%) | 12 (8.2%) |
| 75 Years and over | 11 (19.6%) | 0 (0.0%) |
| Total | 11 (1.2%) | 28 (2.8%) |
Income Above Poverty by Sex and Age in Woodville
According to the poverty statistics in Woodville, males aged under 5 years and females aged under 5 years are the age groups that are most secure financially, with 100.0% of males and 100.0% of females in these age groups living above the poverty line.
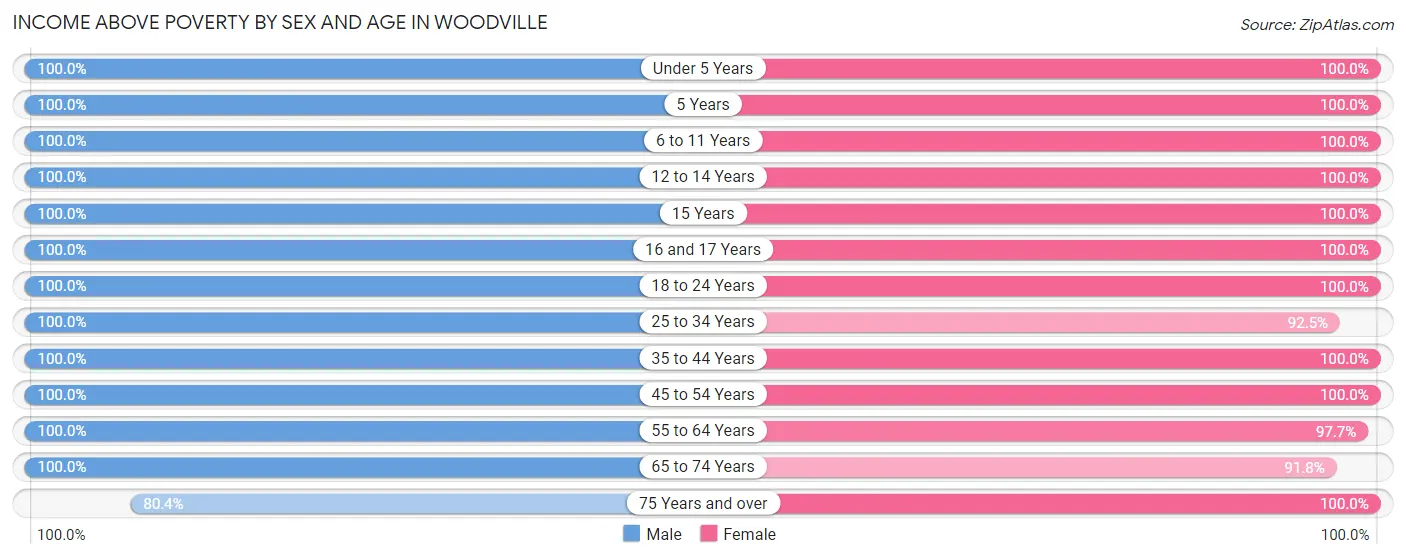
| Age Bracket | Male | Female |
| Under 5 Years | 78 (100.0%) | 101 (100.0%) |
| 5 Years | 3 (100.0%) | 27 (100.0%) |
| 6 to 11 Years | 71 (100.0%) | 28 (100.0%) |
| 12 to 14 Years | 3 (100.0%) | 56 (100.0%) |
| 15 Years | 22 (100.0%) | 13 (100.0%) |
| 16 and 17 Years | 21 (100.0%) | 19 (100.0%) |
| 18 to 24 Years | 60 (100.0%) | 19 (100.0%) |
| 25 to 34 Years | 96 (100.0%) | 147 (92.4%) |
| 35 to 44 Years | 158 (100.0%) | 131 (100.0%) |
| 45 to 54 Years | 82 (100.0%) | 82 (100.0%) |
| 55 to 64 Years | 176 (100.0%) | 168 (97.7%) |
| 65 to 74 Years | 61 (100.0%) | 135 (91.8%) |
| 75 Years and over | 45 (80.4%) | 60 (100.0%) |
| Total | 876 (98.8%) | 986 (97.2%) |
Income Below Poverty Among Married-Couple Families in Woodville
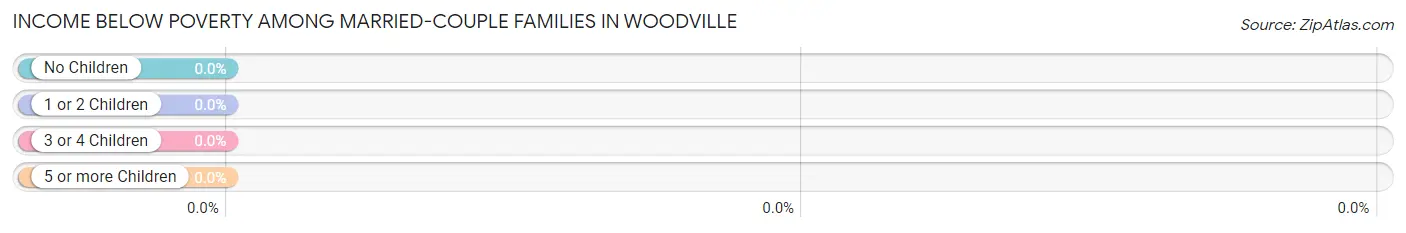
| Children | Above Poverty | Below Poverty |
| No Children | 219 (100.0%) | 0 (0.0%) |
| 1 or 2 Children | 147 (100.0%) | 0 (0.0%) |
| 3 or 4 Children | 29 (100.0%) | 0 (0.0%) |
| 5 or more Children | 0 (0.0%) | 0 (0.0%) |
| Total | 395 (100.0%) | 0 (0.0%) |
Income Below Poverty Among Single-Parent Households in Woodville
| Children | Single Father | Single Mother |
| No Children | 0 (0.0%) | 0 (0.0%) |
| 1 or 2 Children | 0 (0.0%) | 0 (0.0%) |
| 3 or 4 Children | 0 (0.0%) | 0 (0.0%) |
| 5 or more Children | 0 (0.0%) | 0 (0.0%) |
| Total | 0 (0.0%) | 0 (0.0%) |
Income Below Poverty Among Married-Couple vs Single-Parent Households in Woodville
| Children | Married-Couple Families | Single-Parent Households |
| No Children | 0 (0.0%) | 0 (0.0%) |
| 1 or 2 Children | 0 (0.0%) | 0 (0.0%) |
| 3 or 4 Children | 0 (0.0%) | 0 (0.0%) |
| 5 or more Children | 0 (0.0%) | 0 (0.0%) |
| Total | 0 (0.0%) | 0 (0.0%) |
Race in Woodville
The most populous races in Woodville are White / Caucasian (1,835 | 96.0%), Hispanic or Latino (181 | 9.5%), and Two or more Races (70 | 3.7%).
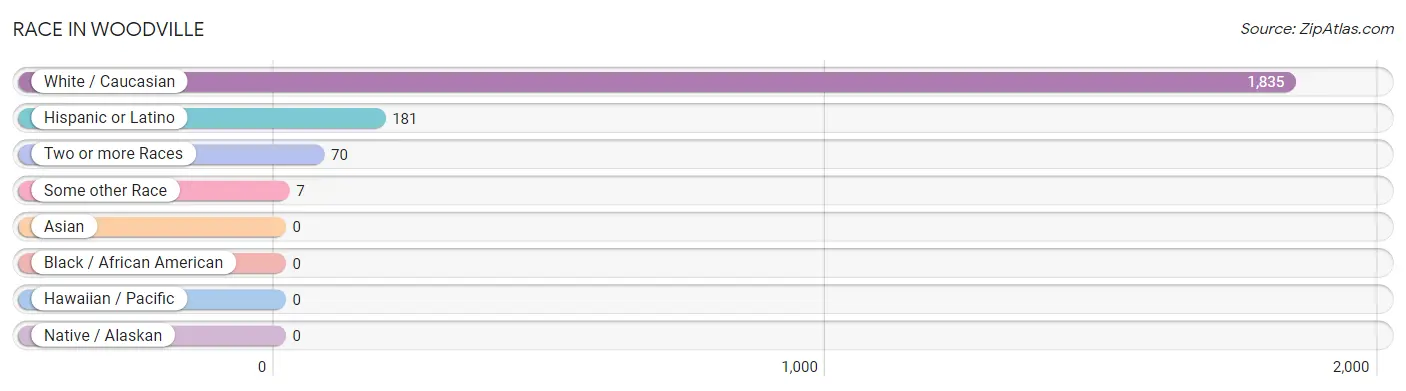
| Race | # Population | % Population |
| Asian | 0 | 0.0% |
| Black / African American | 0 | 0.0% |
| Hawaiian / Pacific | 0 | 0.0% |
| Hispanic or Latino | 181 | 9.5% |
| Native / Alaskan | 0 | 0.0% |
| White / Caucasian | 1,835 | 96.0% |
| Two or more Races | 70 | 3.7% |
| Some other Race | 7 | 0.4% |
| Total | 1,912 | 100.0% |
Ancestry in Woodville
The most populous ancestries reported in Woodville are German (876 | 45.8%), Irish (268 | 14.0%), English (239 | 12.5%), Italian (211 | 11.0%), and Mexican (181 | 9.5%), together accounting for 92.9% of all Woodville residents.
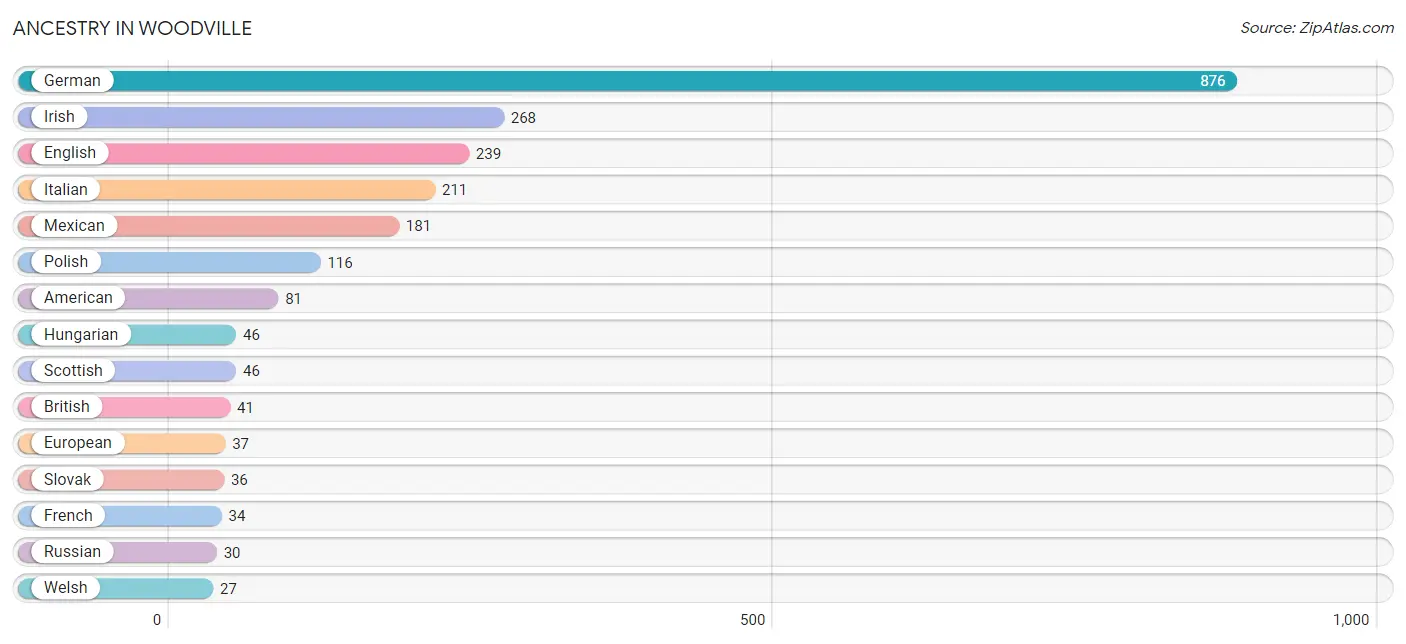
| Ancestry | # Population | % Population |
| American | 81 | 4.2% |
| British | 41 | 2.1% |
| Cherokee | 11 | 0.6% |
| Czechoslovakian | 4 | 0.2% |
| Dutch | 10 | 0.5% |
| Eastern European | 6 | 0.3% |
| English | 239 | 12.5% |
| European | 37 | 1.9% |
| French | 34 | 1.8% |
| French Canadian | 3 | 0.2% |
| German | 876 | 45.8% |
| Greek | 5 | 0.3% |
| Hungarian | 46 | 2.4% |
| Irish | 268 | 14.0% |
| Italian | 211 | 11.0% |
| Mexican | 181 | 9.5% |
| Polish | 116 | 6.1% |
| Russian | 30 | 1.6% |
| Scotch-Irish | 12 | 0.6% |
| Scottish | 46 | 2.4% |
| Slovak | 36 | 1.9% |
| Welsh | 27 | 1.4% | View All 22 Rows |
Immigrants in Woodville
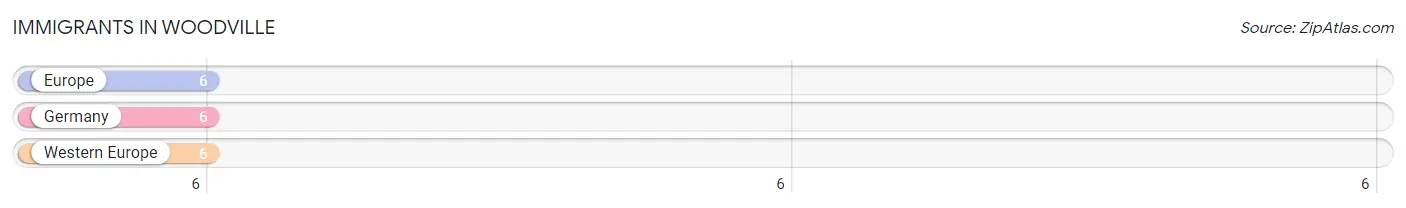
The most numerous immigrant groups reported in Woodville came from Europe (6 | 0.3%), Germany (6 | 0.3%), and Western Europe (6 | 0.3%), together accounting for 0.9% of all Woodville residents.
| Immigration Origin | # Population | % Population |
| Europe | 6 | 0.3% |
| Germany | 6 | 0.3% |
| Western Europe | 6 | 0.3% | View All 3 Rows |
Sex and Age in Woodville
Sex and Age in Woodville
The most populous age groups in Woodville are 60 to 64 Years (114 | 12.9%) for men and 55 to 59 Years (112 | 10.9%) for women.
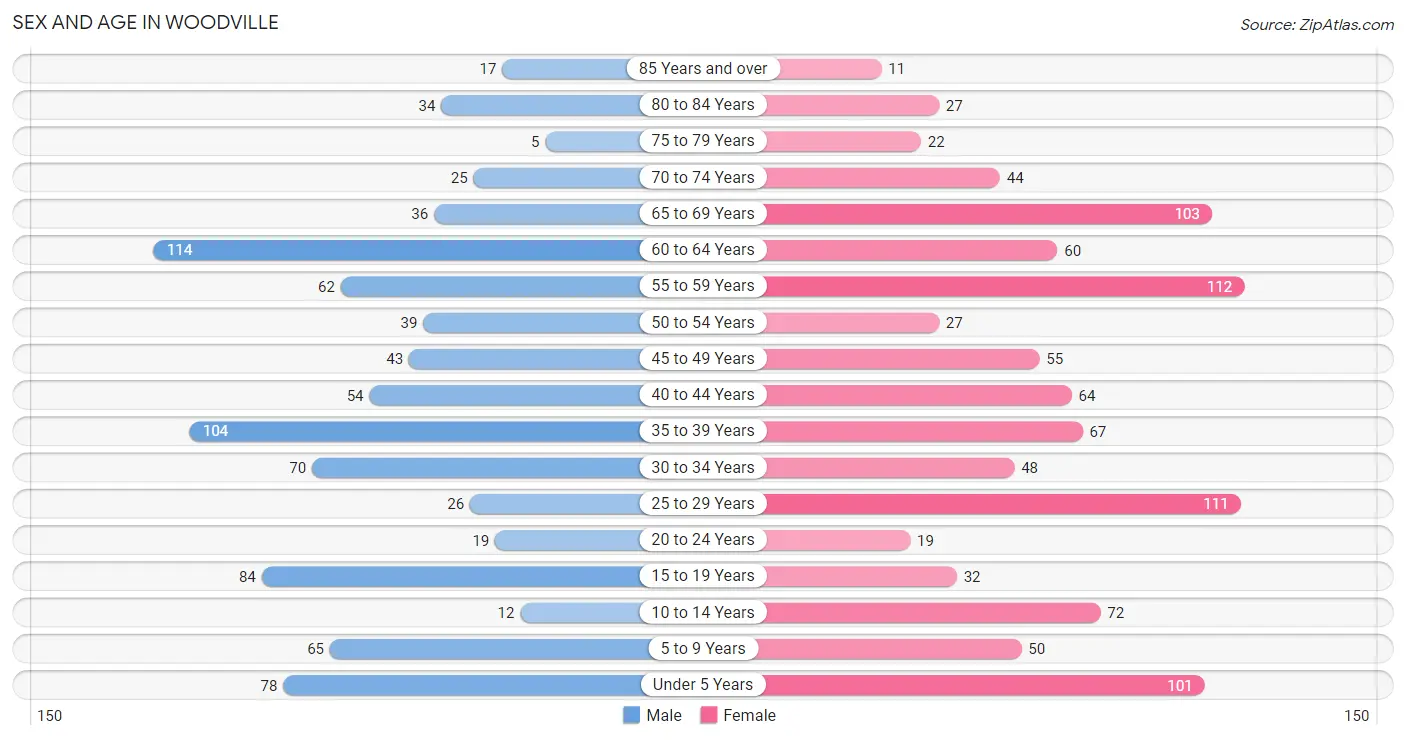
| Age Bracket | Male | Female |
| Under 5 Years | 78 (8.8%) | 101 (9.9%) |
| 5 to 9 Years | 65 (7.3%) | 50 (4.9%) |
| 10 to 14 Years | 12 (1.3%) | 72 (7.0%) |
| 15 to 19 Years | 84 (9.5%) | 32 (3.1%) |
| 20 to 24 Years | 19 (2.1%) | 19 (1.8%) |
| 25 to 29 Years | 26 (2.9%) | 111 (10.8%) |
| 30 to 34 Years | 70 (7.9%) | 48 (4.7%) |
| 35 to 39 Years | 104 (11.7%) | 67 (6.5%) |
| 40 to 44 Years | 54 (6.1%) | 64 (6.2%) |
| 45 to 49 Years | 43 (4.9%) | 55 (5.4%) |
| 50 to 54 Years | 39 (4.4%) | 27 (2.6%) |
| 55 to 59 Years | 62 (7.0%) | 112 (10.9%) |
| 60 to 64 Years | 114 (12.9%) | 60 (5.9%) |
| 65 to 69 Years | 36 (4.1%) | 103 (10.1%) |
| 70 to 74 Years | 25 (2.8%) | 44 (4.3%) |
| 75 to 79 Years | 5 (0.6%) | 22 (2.1%) |
| 80 to 84 Years | 34 (3.8%) | 27 (2.6%) |
| 85 Years and over | 17 (1.9%) | 11 (1.1%) |
| Total | 887 (100.0%) | 1,025 (100.0%) |
Families and Households in Woodville
Median Family Size in Woodville
The median family size in Woodville is 3.03 persons per family, with married-couple families (395 | 83.2%) accounting for the largest median family size of 3.11 persons per family. On the other hand, single male/father families (17 | 3.6%) represent the smallest median family size with 2.41 persons per family.
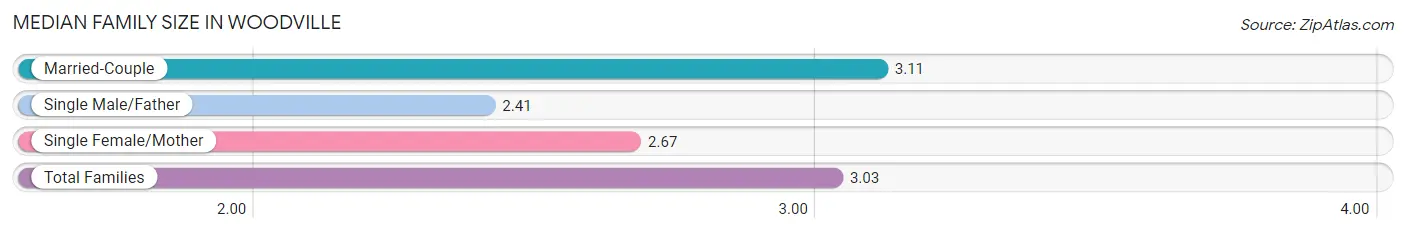
| Family Type | # Families | Family Size |
| Married-Couple | 395 (83.2%) | 3.11 |
| Single Male/Father | 17 (3.6%) | 2.41 |
| Single Female/Mother | 63 (13.3%) | 2.67 |
| Total Families | 475 (100.0%) | 3.03 |
Median Household Size in Woodville
The median household size in Woodville is 2.27 persons per household, with single male/father households (17 | 2.0%) accounting for the largest median household size of 3.88 persons per household. non-family households (366 | 43.5%) represent the smallest median household size with 1.19 persons per household.
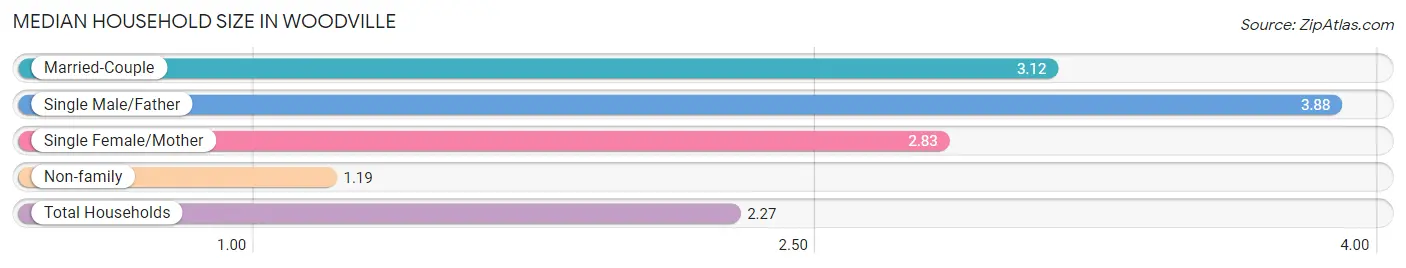
| Household Type | # Households | Household Size |
| Married-Couple | 395 (47.0%) | 3.12 |
| Single Male/Father | 17 (2.0%) | 3.88 |
| Single Female/Mother | 63 (7.5%) | 2.83 |
| Non-family | 366 (43.5%) | 1.19 |
| Total Households | 841 (100.0%) | 2.27 |
Household Size by Marriage Status in Woodville
Out of a total of 841 households in Woodville, 475 (56.5%) are family households, while 366 (43.5%) are nonfamily households. The most numerous type of family households are 2-person households, comprising 247, and the most common type of nonfamily households are 1-person households, comprising 300.
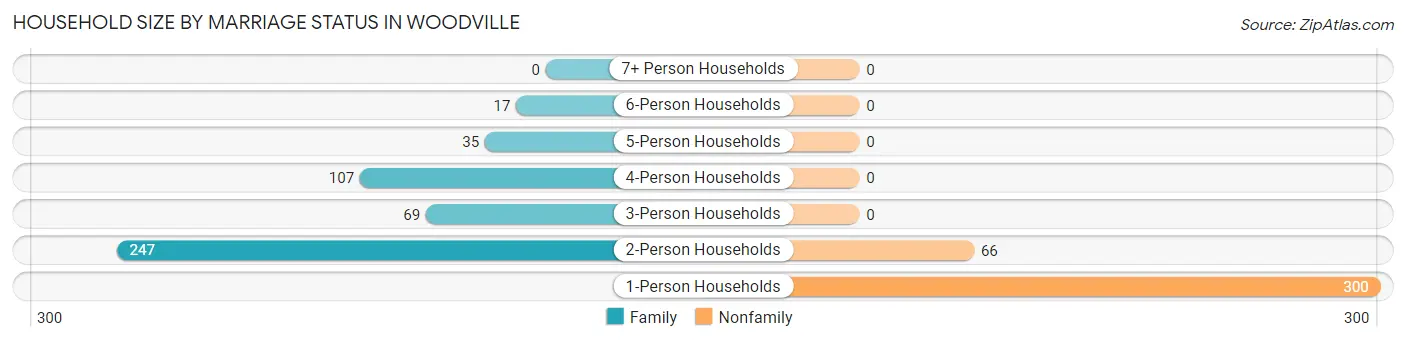
| Household Size | Family Households | Nonfamily Households |
| 1-Person Households | - | 300 (35.7%) |
| 2-Person Households | 247 (29.4%) | 66 (7.9%) |
| 3-Person Households | 69 (8.2%) | 0 (0.0%) |
| 4-Person Households | 107 (12.7%) | 0 (0.0%) |
| 5-Person Households | 35 (4.2%) | 0 (0.0%) |
| 6-Person Households | 17 (2.0%) | 0 (0.0%) |
| 7+ Person Households | 0 (0.0%) | 0 (0.0%) |
| Total | 475 (56.5%) | 366 (43.5%) |
Female Fertility in Woodville
Fertility by Age in Woodville
Average fertility rate in Woodville is 27.0 births per 1,000 women. Women in the age bracket of 20 to 34 years have the highest fertility rate with 62.0 births per 1,000 women. Women in the age bracket of 20 to 34 years acount for 100.0% of all women with births.
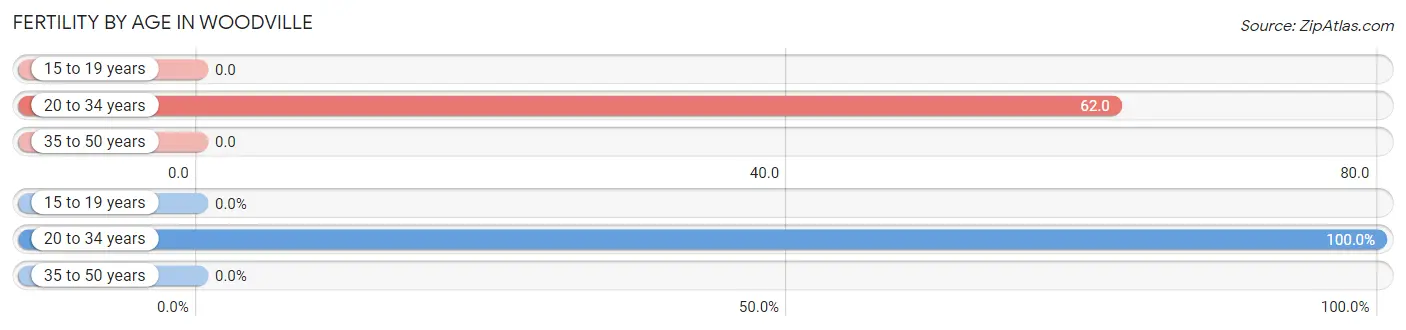
| Age Bracket | Women with Births | Births / 1,000 Women |
| 15 to 19 years | 0 (0.0%) | 0.0 |
| 20 to 34 years | 11 (100.0%) | 62.0 |
| 35 to 50 years | 0 (0.0%) | 0.0 |
| Total | 11 (100.0%) | 27.0 |
Fertility by Age by Marriage Status in Woodville
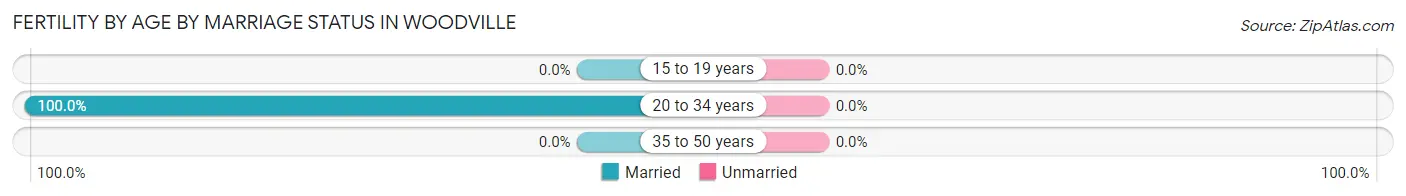
| Age Bracket | Married | Unmarried |
| 15 to 19 years | 0 (0.0%) | 0 (0.0%) |
| 20 to 34 years | 11 (100.0%) | 0 (0.0%) |
| 35 to 50 years | 0 (0.0%) | 0 (0.0%) |
| Total | 11 (100.0%) | 0 (0.0%) |
Fertility by Education in Woodville
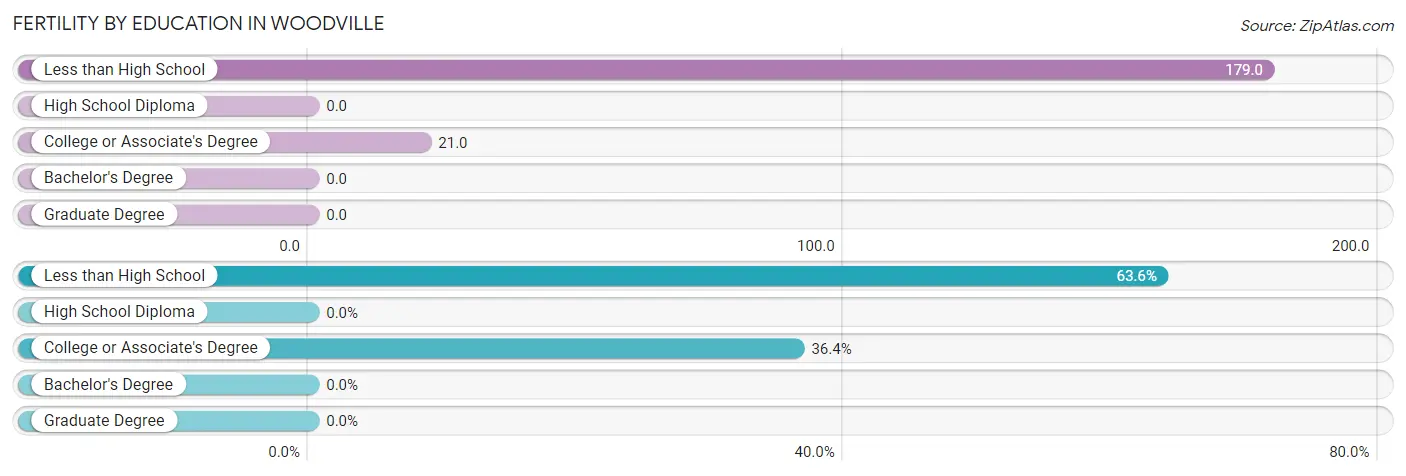
| Educational Attainment | Women with Births | Births / 1,000 Women |
| Less than High School | 7 (63.6%) | 179.0 |
| High School Diploma | 0 (0.0%) | 0.0 |
| College or Associate's Degree | 4 (36.4%) | 21.0 |
| Bachelor's Degree | 0 (0.0%) | 0.0 |
| Graduate Degree | 0 (0.0%) | 0.0 |
| Total | 11 (100.0%) | 27.0 |
Fertility by Education by Marriage Status in Woodville
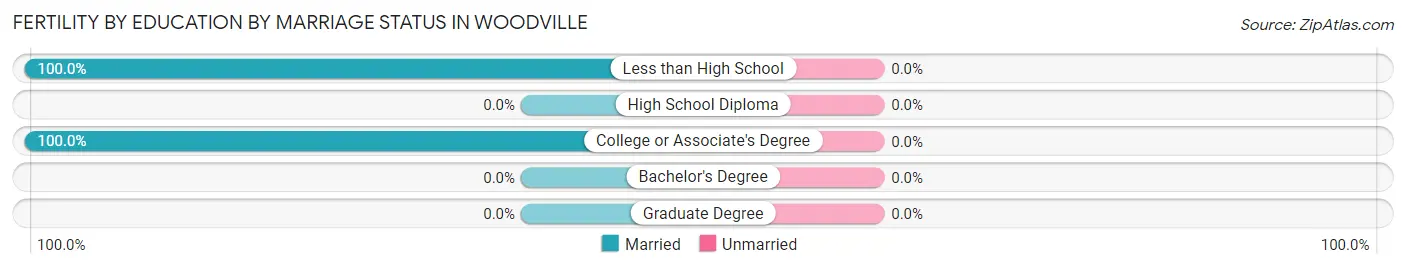
| Educational Attainment | Married | Unmarried |
| Less than High School | 7 (100.0%) | 0 (0.0%) |
| High School Diploma | 0 (0.0%) | 0 (0.0%) |
| College or Associate's Degree | 4 (100.0%) | 0 (0.0%) |
| Bachelor's Degree | 0 (0.0%) | 0 (0.0%) |
| Graduate Degree | 0 (0.0%) | 0 (0.0%) |
| Total | 11 (100.0%) | 0 (0.0%) |
Employment Characteristics in Woodville
Employment by Class of Employer in Woodville
Among the 1,001 employed individuals in Woodville, private company employees (714 | 71.3%), local government employees (118 | 11.8%), and not-for-profit organizations (94 | 9.4%) make up the most common classes of employment.
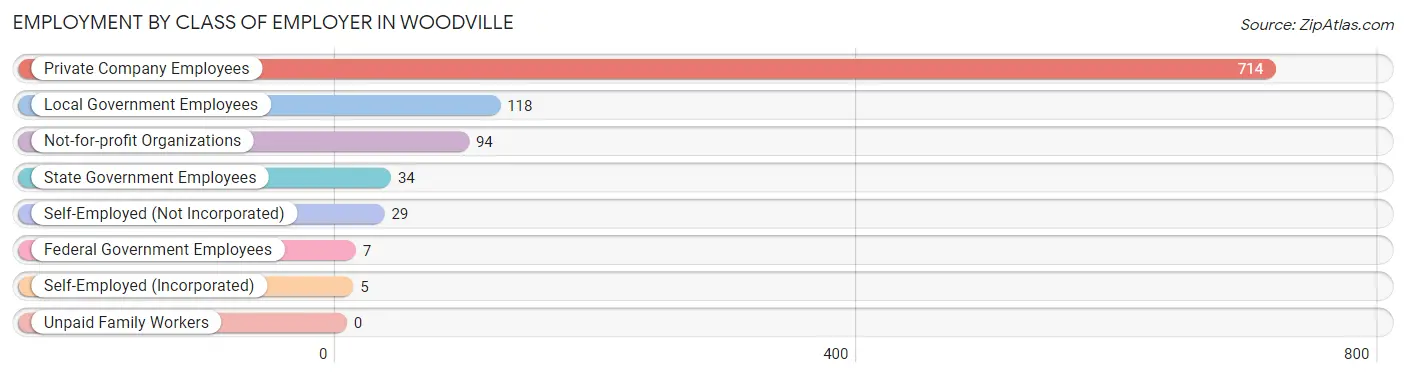
| Employer Class | # Employees | % Employees |
| Private Company Employees | 714 | 71.3% |
| Self-Employed (Incorporated) | 5 | 0.5% |
| Self-Employed (Not Incorporated) | 29 | 2.9% |
| Not-for-profit Organizations | 94 | 9.4% |
| Local Government Employees | 118 | 11.8% |
| State Government Employees | 34 | 3.4% |
| Federal Government Employees | 7 | 0.7% |
| Unpaid Family Workers | 0 | 0.0% |
| Total | 1,001 | 100.0% |
Employment Status by Age in Woodville
According to the labor force statistics for Woodville, out of the total population over 16 years of age (1,499), 70.6% or 1,058 individuals are in the labor force, with 5.5% or 58 of them unemployed. The age group with the highest labor force participation rate is 25 to 29 years, with 100.0% or 137 individuals in the labor force. Within the labor force, the 20 to 24 years age range has the highest percentage of unemployed individuals, with 26.5% or 9 of them being unemployed.
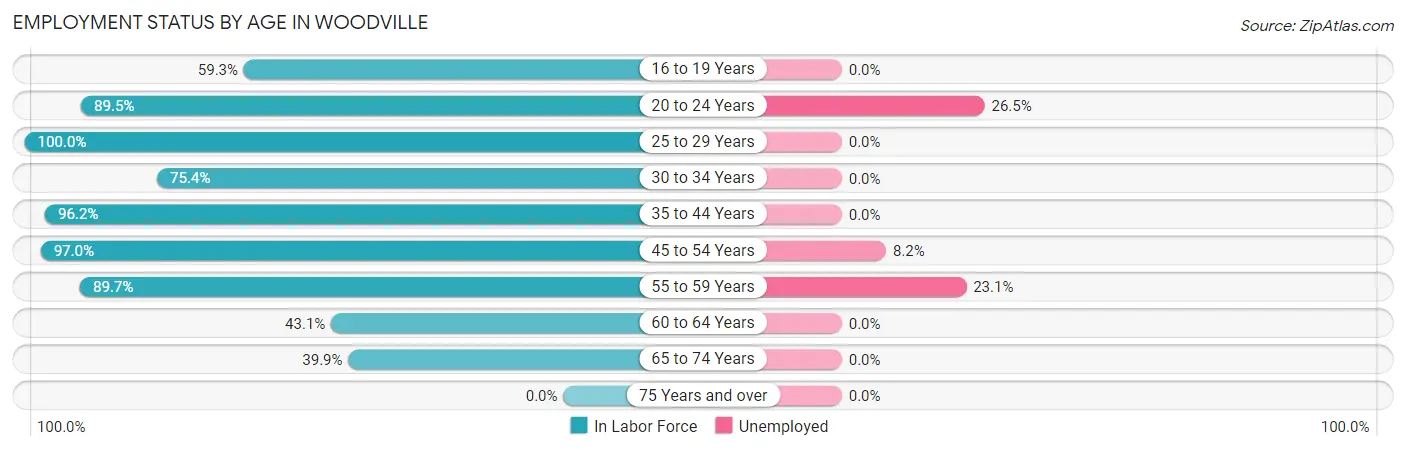
| Age Bracket | In Labor Force | Unemployed |
| 16 to 19 Years | 48 (59.3%) | 0 (0.0%) |
| 20 to 24 Years | 34 (89.5%) | 9 (26.5%) |
| 25 to 29 Years | 137 (100.0%) | 0 (0.0%) |
| 30 to 34 Years | 89 (75.4%) | 0 (0.0%) |
| 35 to 44 Years | 278 (96.2%) | 0 (0.0%) |
| 45 to 54 Years | 159 (97.0%) | 13 (8.2%) |
| 55 to 59 Years | 156 (89.7%) | 36 (23.1%) |
| 60 to 64 Years | 75 (43.1%) | 0 (0.0%) |
| 65 to 74 Years | 83 (39.9%) | 0 (0.0%) |
| 75 Years and over | 0 (0.0%) | 0 (0.0%) |
| Total | 1,058 (70.6%) | 58 (5.5%) |
Employment Status by Educational Attainment in Woodville
According to labor force statistics for Woodville, 84.7% of individuals (894) out of the total population between 25 and 64 years of age (1,056) are in the labor force, with 5.5% or 49 of them being unemployed. The group with the highest labor force participation rate are those with the educational attainment of college / associate degree, with 94.8% or 366 individuals in the labor force. Within the labor force, individuals with high school diploma education have the highest percentage of unemployment, with 12.8% or 36 of them being unemployed.
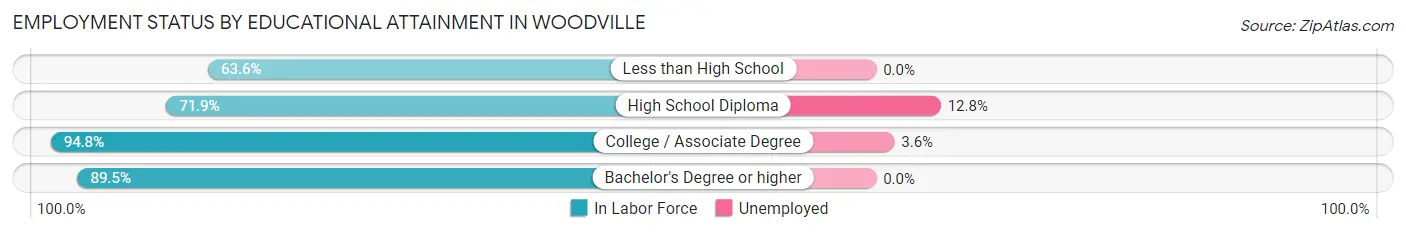
| Educational Attainment | In Labor Force | Unemployed |
| Less than High School | 7 (63.6%) | 0 (0.0%) |
| High School Diploma | 282 (71.9%) | 50 (12.8%) |
| College / Associate Degree | 366 (94.8%) | 14 (3.6%) |
| Bachelor's Degree or higher | 239 (89.5%) | 0 (0.0%) |
| Total | 894 (84.7%) | 58 (5.5%) |
Employment Occupations by Sex in Woodville
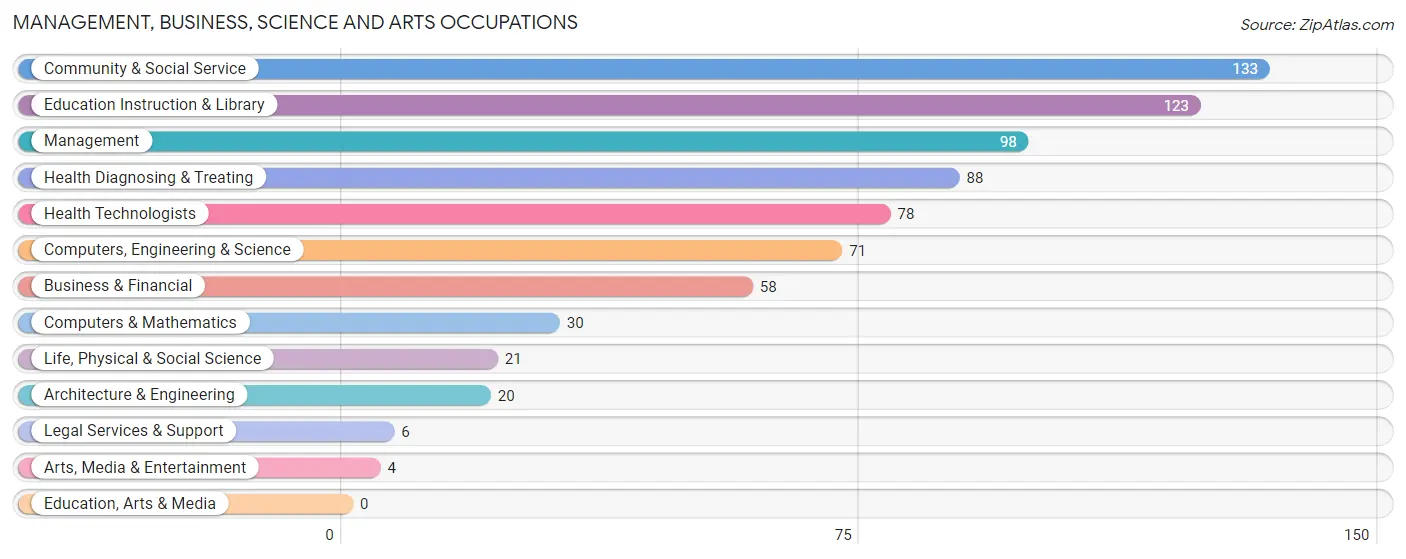
Management, Business, Science and Arts Occupations
The most common Management, Business, Science and Arts occupations in Woodville are Community & Social Service (133 | 13.3%), Education Instruction & Library (123 | 12.3%), Management (98 | 9.8%), Health Diagnosing & Treating (88 | 8.8%), and Health Technologists (78 | 7.8%).
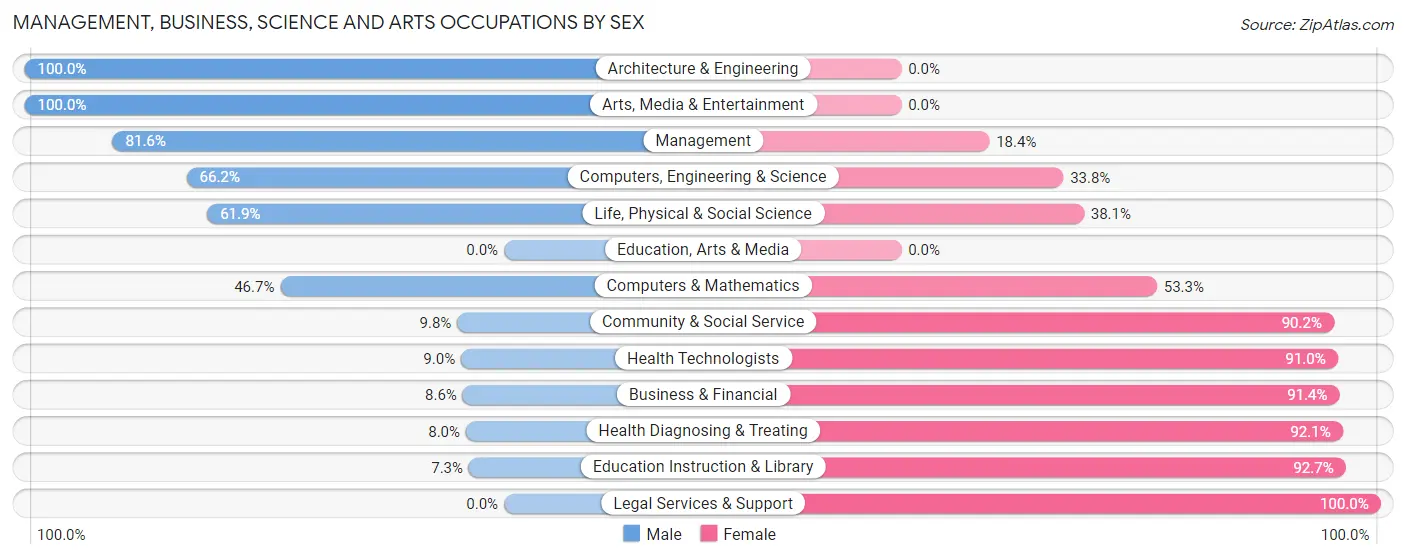
Management, Business, Science and Arts Occupations by Sex
Within the Management, Business, Science and Arts occupations in Woodville, the most male-oriented occupations are Architecture & Engineering (100.0%), Arts, Media & Entertainment (100.0%), and Management (81.6%), while the most female-oriented occupations are Legal Services & Support (100.0%), Education Instruction & Library (92.7%), and Health Diagnosing & Treating (92.0%).
| Occupation | Male | Female |
| Management | 80 (81.6%) | 18 (18.4%) |
| Business & Financial | 5 (8.6%) | 53 (91.4%) |
| Computers, Engineering & Science | 47 (66.2%) | 24 (33.8%) |
| Computers & Mathematics | 14 (46.7%) | 16 (53.3%) |
| Architecture & Engineering | 20 (100.0%) | 0 (0.0%) |
| Life, Physical & Social Science | 13 (61.9%) | 8 (38.1%) |
| Community & Social Service | 13 (9.8%) | 120 (90.2%) |
| Education, Arts & Media | 0 (0.0%) | 0 (0.0%) |
| Legal Services & Support | 0 (0.0%) | 6 (100.0%) |
| Education Instruction & Library | 9 (7.3%) | 114 (92.7%) |
| Arts, Media & Entertainment | 4 (100.0%) | 0 (0.0%) |
| Health Diagnosing & Treating | 7 (8.0%) | 81 (92.0%) |
| Health Technologists | 7 (9.0%) | 71 (91.0%) |
| Total (Category) | 152 (33.9%) | 296 (66.1%) |
| Total (Overall) | 447 (44.7%) | 554 (55.3%) |
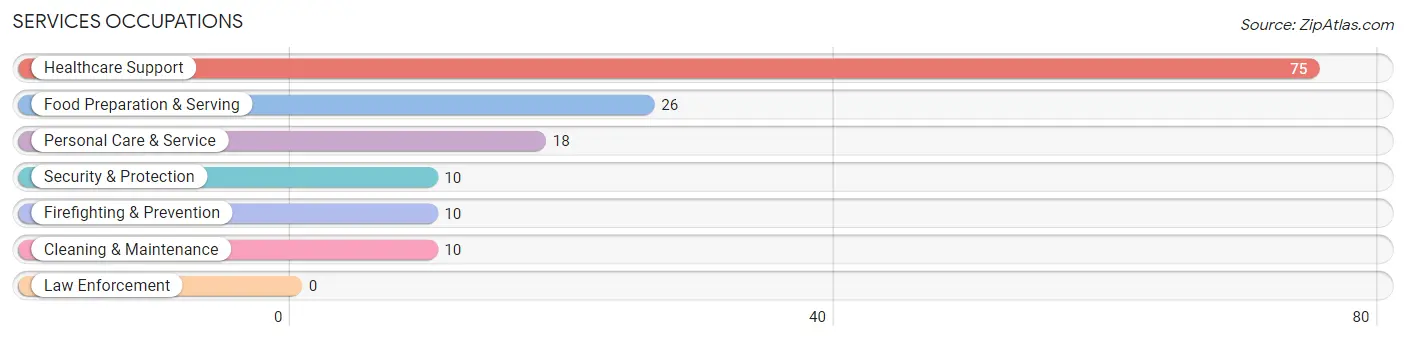
Services Occupations
The most common Services occupations in Woodville are Healthcare Support (75 | 7.5%), Food Preparation & Serving (26 | 2.6%), Personal Care & Service (18 | 1.8%), Security & Protection (10 | 1.0%), and Firefighting & Prevention (10 | 1.0%).
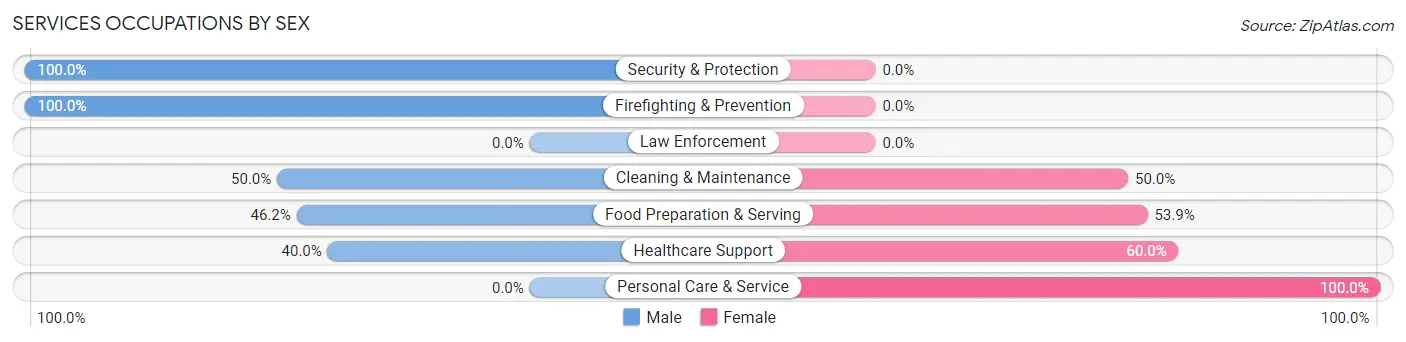
Services Occupations by Sex
Within the Services occupations in Woodville, the most male-oriented occupations are Security & Protection (100.0%), Firefighting & Prevention (100.0%), and Cleaning & Maintenance (50.0%), while the most female-oriented occupations are Personal Care & Service (100.0%), Healthcare Support (60.0%), and Food Preparation & Serving (53.8%).
| Occupation | Male | Female |
| Healthcare Support | 30 (40.0%) | 45 (60.0%) |
| Security & Protection | 10 (100.0%) | 0 (0.0%) |
| Firefighting & Prevention | 10 (100.0%) | 0 (0.0%) |
| Law Enforcement | 0 (0.0%) | 0 (0.0%) |
| Food Preparation & Serving | 12 (46.2%) | 14 (53.8%) |
| Cleaning & Maintenance | 5 (50.0%) | 5 (50.0%) |
| Personal Care & Service | 0 (0.0%) | 18 (100.0%) |
| Total (Category) | 57 (41.0%) | 82 (59.0%) |
| Total (Overall) | 447 (44.7%) | 554 (55.3%) |
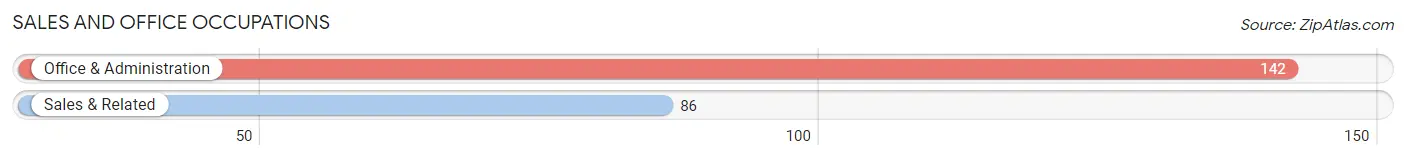
Sales and Office Occupations
The most common Sales and Office occupations in Woodville are Office & Administration (142 | 14.2%), and Sales & Related (86 | 8.6%).
Sales and Office Occupations by Sex
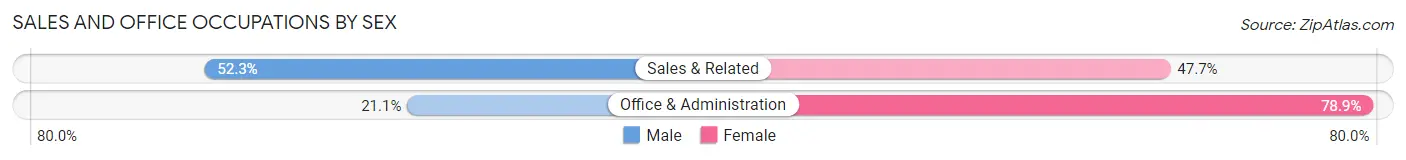
| Occupation | Male | Female |
| Sales & Related | 45 (52.3%) | 41 (47.7%) |
| Office & Administration | 30 (21.1%) | 112 (78.9%) |
| Total (Category) | 75 (32.9%) | 153 (67.1%) |
| Total (Overall) | 447 (44.7%) | 554 (55.3%) |
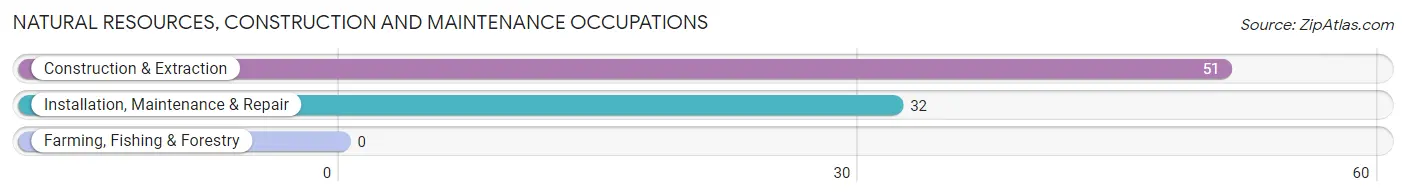
Natural Resources, Construction and Maintenance Occupations
The most common Natural Resources, Construction and Maintenance occupations in Woodville are Construction & Extraction (51 | 5.1%), and Installation, Maintenance & Repair (32 | 3.2%).
Natural Resources, Construction and Maintenance Occupations by Sex
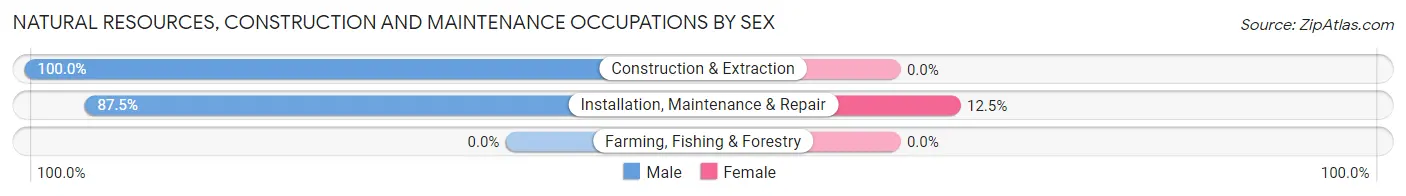
| Occupation | Male | Female |
| Farming, Fishing & Forestry | 0 (0.0%) | 0 (0.0%) |
| Construction & Extraction | 51 (100.0%) | 0 (0.0%) |
| Installation, Maintenance & Repair | 28 (87.5%) | 4 (12.5%) |
| Total (Category) | 79 (95.2%) | 4 (4.8%) |
| Total (Overall) | 447 (44.7%) | 554 (55.3%) |
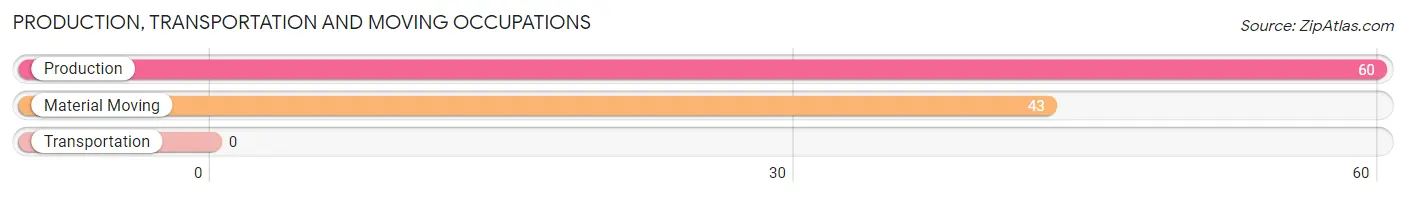
Production, Transportation and Moving Occupations
The most common Production, Transportation and Moving occupations in Woodville are Production (60 | 6.0%), and Material Moving (43 | 4.3%).
Production, Transportation and Moving Occupations by Sex
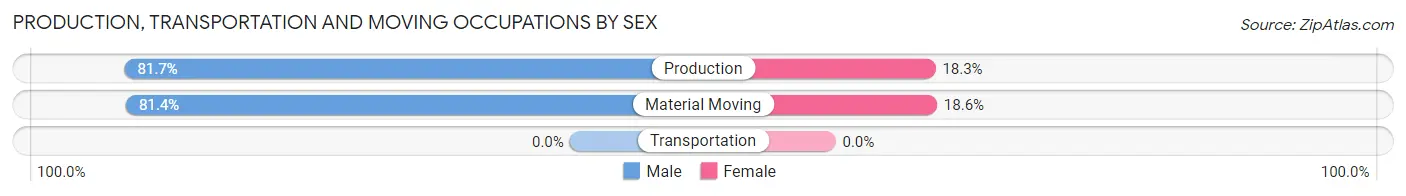
| Occupation | Male | Female |
| Production | 49 (81.7%) | 11 (18.3%) |
| Transportation | 0 (0.0%) | 0 (0.0%) |
| Material Moving | 35 (81.4%) | 8 (18.6%) |
| Total (Category) | 84 (81.6%) | 19 (18.4%) |
| Total (Overall) | 447 (44.7%) | 554 (55.3%) |
Employment Industries by Sex in Woodville
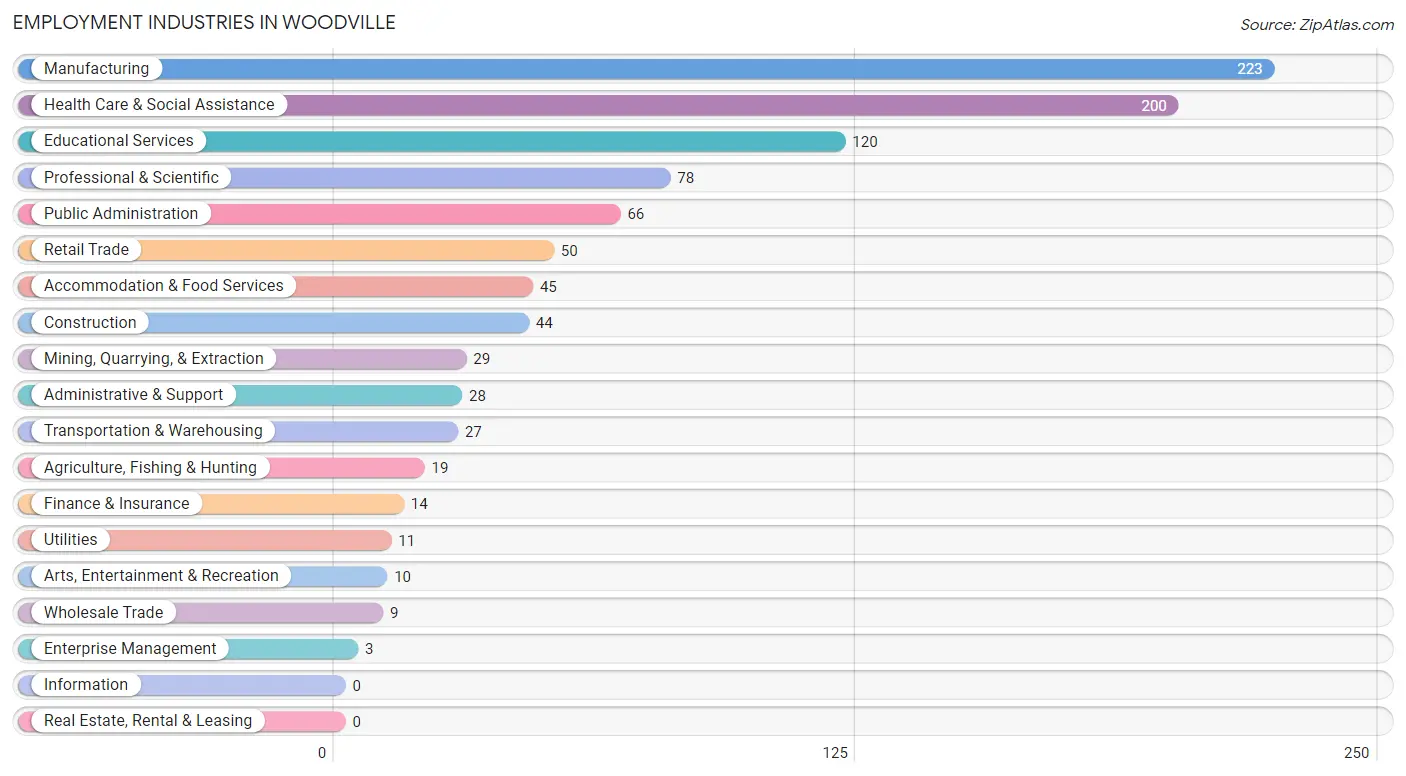
Employment Industries in Woodville
The major employment industries in Woodville include Manufacturing (223 | 22.3%), Health Care & Social Assistance (200 | 20.0%), Educational Services (120 | 12.0%), Professional & Scientific (78 | 7.8%), and Public Administration (66 | 6.6%).
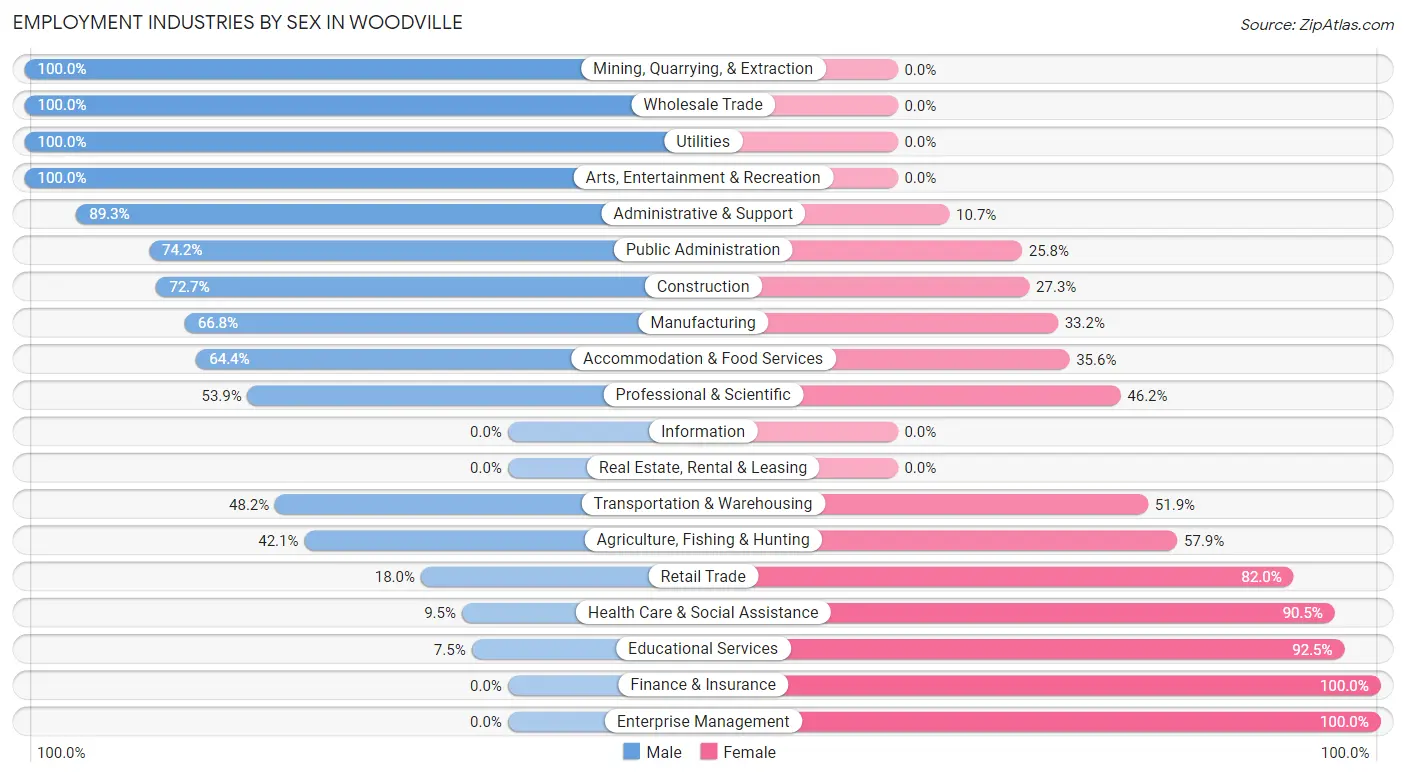
Employment Industries by Sex in Woodville
The Woodville industries that see more men than women are Mining, Quarrying, & Extraction (100.0%), Wholesale Trade (100.0%), and Utilities (100.0%), whereas the industries that tend to have a higher number of women are Finance & Insurance (100.0%), Enterprise Management (100.0%), and Educational Services (92.5%).
| Industry | Male | Female |
| Agriculture, Fishing & Hunting | 8 (42.1%) | 11 (57.9%) |
| Mining, Quarrying, & Extraction | 29 (100.0%) | 0 (0.0%) |
| Construction | 32 (72.7%) | 12 (27.3%) |
| Manufacturing | 149 (66.8%) | 74 (33.2%) |
| Wholesale Trade | 9 (100.0%) | 0 (0.0%) |
| Retail Trade | 9 (18.0%) | 41 (82.0%) |
| Transportation & Warehousing | 13 (48.1%) | 14 (51.8%) |
| Utilities | 11 (100.0%) | 0 (0.0%) |
| Information | 0 (0.0%) | 0 (0.0%) |
| Finance & Insurance | 0 (0.0%) | 14 (100.0%) |
| Real Estate, Rental & Leasing | 0 (0.0%) | 0 (0.0%) |
| Professional & Scientific | 42 (53.8%) | 36 (46.2%) |
| Enterprise Management | 0 (0.0%) | 3 (100.0%) |
| Administrative & Support | 25 (89.3%) | 3 (10.7%) |
| Educational Services | 9 (7.5%) | 111 (92.5%) |
| Health Care & Social Assistance | 19 (9.5%) | 181 (90.5%) |
| Arts, Entertainment & Recreation | 10 (100.0%) | 0 (0.0%) |
| Accommodation & Food Services | 29 (64.4%) | 16 (35.6%) |
| Public Administration | 49 (74.2%) | 17 (25.8%) |
| Total | 447 (44.7%) | 554 (55.3%) |
Education in Woodville
School Enrollment in Woodville
The most common levels of schooling among the 391 students in Woodville are high school (119 | 30.4%), middle school (86 | 22.0%), and elementary school (82 | 21.0%).
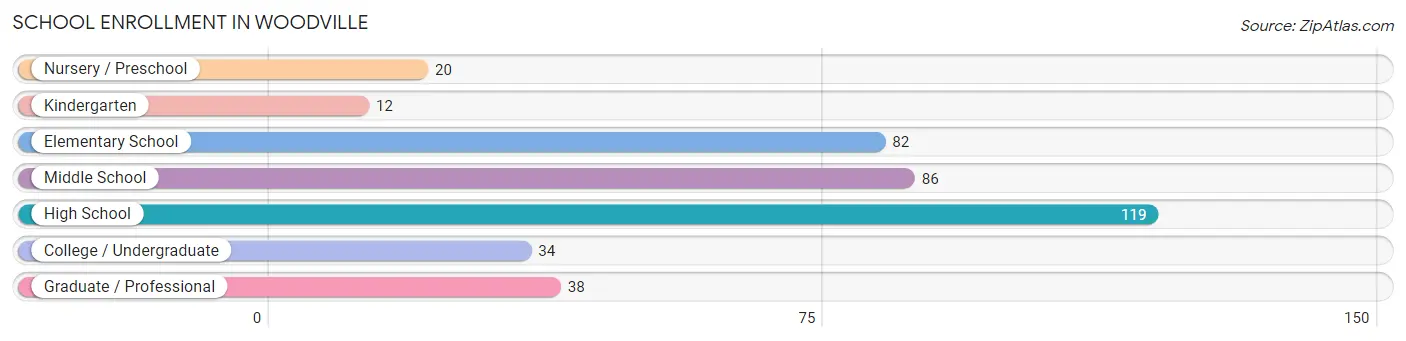
| School Level | # Students | % Students |
| Nursery / Preschool | 20 | 5.1% |
| Kindergarten | 12 | 3.1% |
| Elementary School | 82 | 21.0% |
| Middle School | 86 | 22.0% |
| High School | 119 | 30.4% |
| College / Undergraduate | 34 | 8.7% |
| Graduate / Professional | 38 | 9.7% |
| Total | 391 | 100.0% |
School Enrollment by Age by Funding Source in Woodville
Out of a total of 391 students who are enrolled in schools in Woodville, 118 (30.2%) attend a private institution, while the remaining 273 (69.8%) are enrolled in public schools. The age group of 18 to 19 year olds has the highest likelihood of being enrolled in private schools, with 30 (83.3% in the age bracket) enrolled. Conversely, the age group of 3 to 4 year olds has the lowest likelihood of being enrolled in a private school, with 13 (100.0% in the age bracket) attending a public institution.
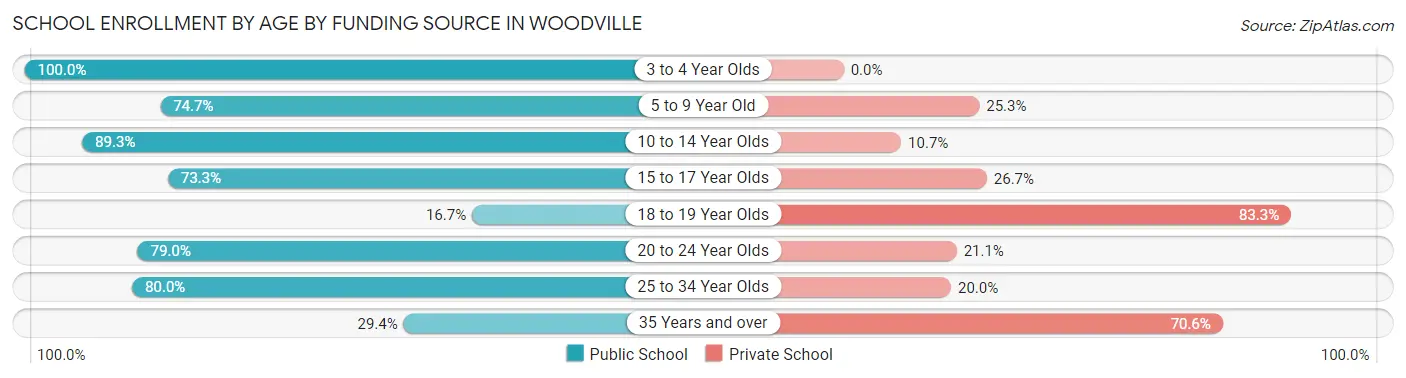
| Age Bracket | Public School | Private School |
| 3 to 4 Year Olds | 13 (100.0%) | 0 (0.0%) |
| 5 to 9 Year Old | 71 (74.7%) | 24 (25.3%) |
| 10 to 14 Year Olds | 75 (89.3%) | 9 (10.7%) |
| 15 to 17 Year Olds | 55 (73.3%) | 20 (26.7%) |
| 18 to 19 Year Olds | 6 (16.7%) | 30 (83.3%) |
| 20 to 24 Year Olds | 15 (78.9%) | 4 (21.0%) |
| 25 to 34 Year Olds | 28 (80.0%) | 7 (20.0%) |
| 35 Years and over | 10 (29.4%) | 24 (70.6%) |
| Total | 273 (69.8%) | 118 (30.2%) |
Educational Attainment by Field of Study in Woodville
Business (107 | 25.9%), education (99 | 24.0%), science & technology (54 | 13.1%), social sciences (31 | 7.5%), and bio, nature & agricultural (25 | 6.0%) are the most common fields of study among 413 individuals in Woodville who have obtained a bachelor's degree or higher.
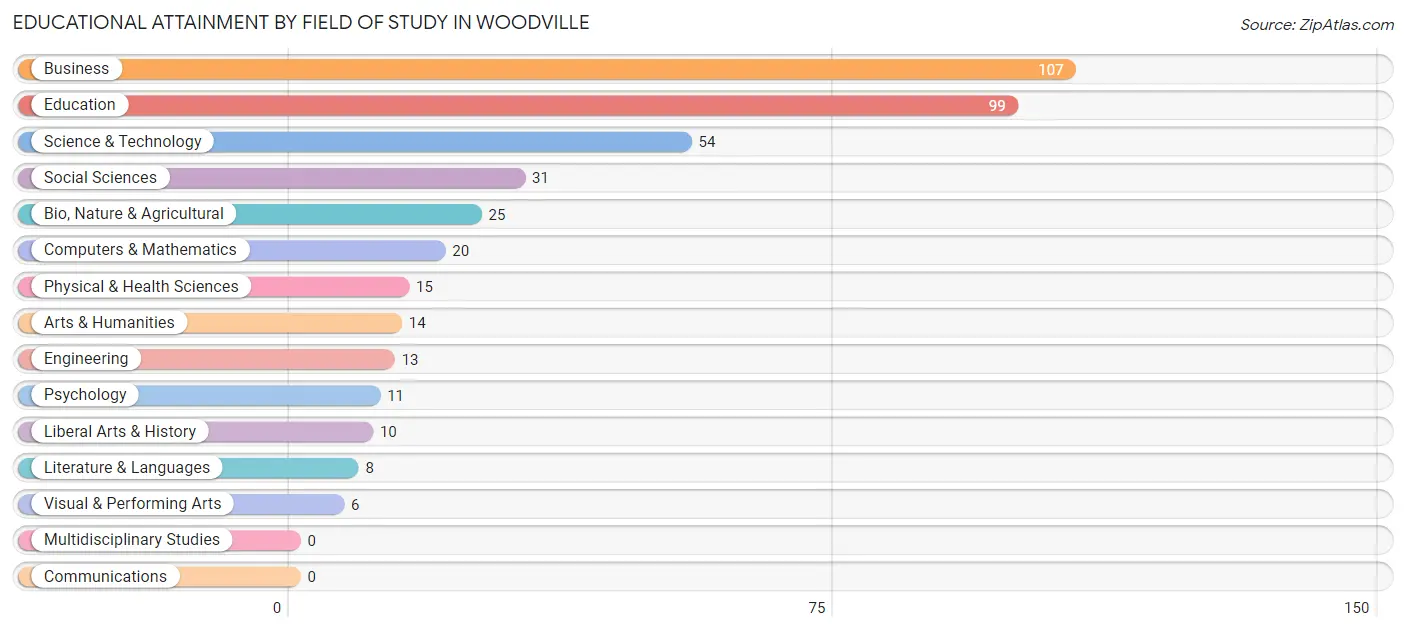
| Field of Study | # Graduates | % Graduates |
| Computers & Mathematics | 20 | 4.8% |
| Bio, Nature & Agricultural | 25 | 6.0% |
| Physical & Health Sciences | 15 | 3.6% |
| Psychology | 11 | 2.7% |
| Social Sciences | 31 | 7.5% |
| Engineering | 13 | 3.2% |
| Multidisciplinary Studies | 0 | 0.0% |
| Science & Technology | 54 | 13.1% |
| Business | 107 | 25.9% |
| Education | 99 | 24.0% |
| Literature & Languages | 8 | 1.9% |
| Liberal Arts & History | 10 | 2.4% |
| Visual & Performing Arts | 6 | 1.5% |
| Communications | 0 | 0.0% |
| Arts & Humanities | 14 | 3.4% |
| Total | 413 | 100.0% |
Transportation & Commute in Woodville
Vehicle Availability by Sex in Woodville
The most prevalent vehicle ownership categories in Woodville are males with 2 vehicles (221, accounting for 49.4%) and females with 2 vehicles (309, making up 39.9%).
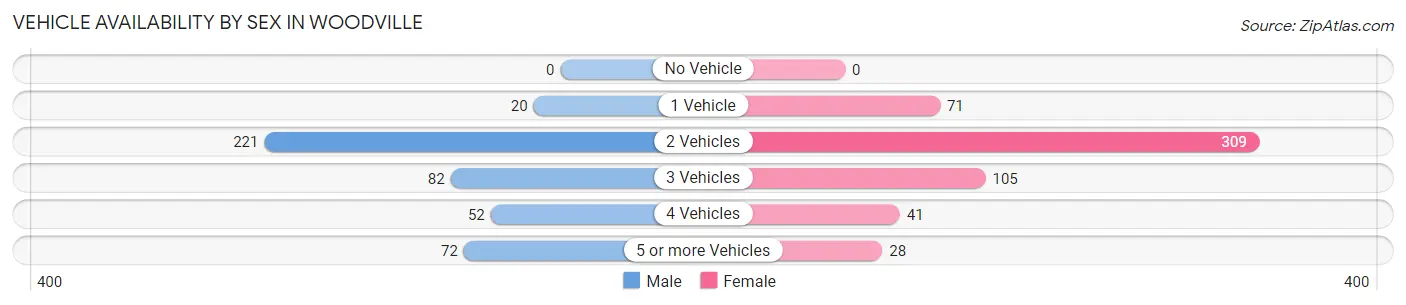
| Vehicles Available | Male | Female |
| No Vehicle | 0 (0.0%) | 0 (0.0%) |
| 1 Vehicle | 20 (4.5%) | 71 (12.8%) |
| 2 Vehicles | 221 (49.4%) | 309 (55.8%) |
| 3 Vehicles | 82 (18.3%) | 105 (19.0%) |
| 4 Vehicles | 52 (11.6%) | 41 (7.4%) |
| 5 or more Vehicles | 72 (16.1%) | 28 (5.1%) |
| Total | 447 (100.0%) | 554 (100.0%) |
Commute Time in Woodville
The most frequently occuring commute durations in Woodville are 25 to 29 minutes (178 commuters, 19.4%), 15 to 19 minutes (149 commuters, 16.3%), and 30 to 34 minutes (136 commuters, 14.8%).
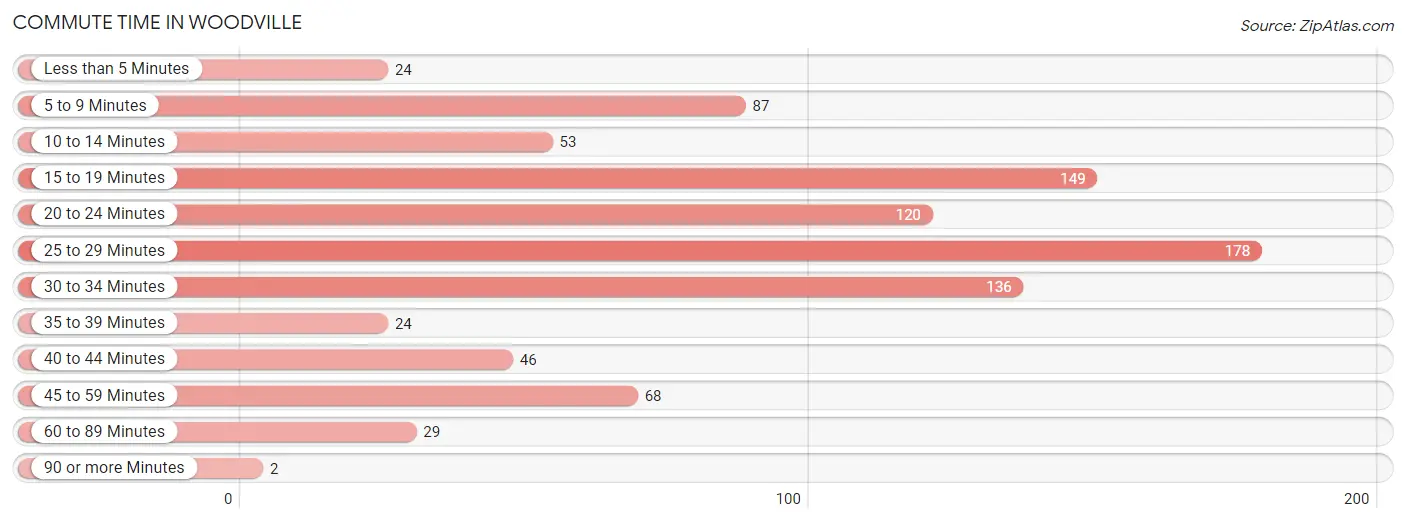
| Commute Time | # Commuters | % Commuters |
| Less than 5 Minutes | 24 | 2.6% |
| 5 to 9 Minutes | 87 | 9.5% |
| 10 to 14 Minutes | 53 | 5.8% |
| 15 to 19 Minutes | 149 | 16.3% |
| 20 to 24 Minutes | 120 | 13.1% |
| 25 to 29 Minutes | 178 | 19.4% |
| 30 to 34 Minutes | 136 | 14.8% |
| 35 to 39 Minutes | 24 | 2.6% |
| 40 to 44 Minutes | 46 | 5.0% |
| 45 to 59 Minutes | 68 | 7.4% |
| 60 to 89 Minutes | 29 | 3.2% |
| 90 or more Minutes | 2 | 0.2% |
Commute Time by Sex in Woodville
The most common commute times in Woodville are 20 to 24 minutes (78 commuters, 18.4%) for males and 25 to 29 minutes (107 commuters, 21.7%) for females.
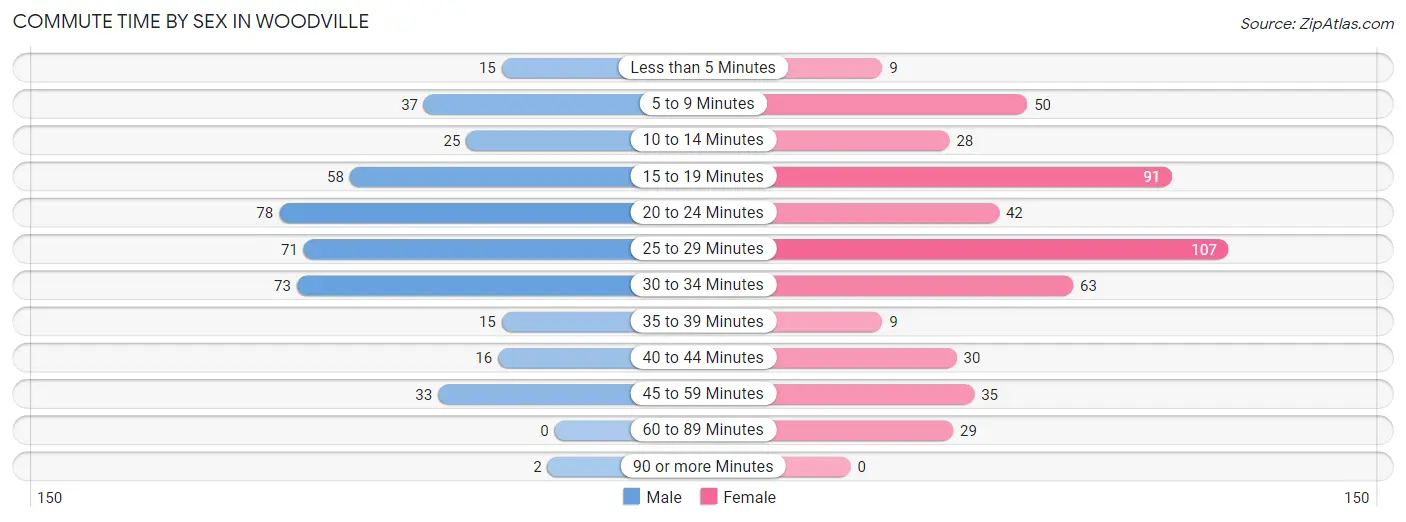
| Commute Time | Male | Female |
| Less than 5 Minutes | 15 (3.5%) | 9 (1.8%) |
| 5 to 9 Minutes | 37 (8.7%) | 50 (10.1%) |
| 10 to 14 Minutes | 25 (5.9%) | 28 (5.7%) |
| 15 to 19 Minutes | 58 (13.7%) | 91 (18.5%) |
| 20 to 24 Minutes | 78 (18.4%) | 42 (8.5%) |
| 25 to 29 Minutes | 71 (16.8%) | 107 (21.7%) |
| 30 to 34 Minutes | 73 (17.3%) | 63 (12.8%) |
| 35 to 39 Minutes | 15 (3.5%) | 9 (1.8%) |
| 40 to 44 Minutes | 16 (3.8%) | 30 (6.1%) |
| 45 to 59 Minutes | 33 (7.8%) | 35 (7.1%) |
| 60 to 89 Minutes | 0 (0.0%) | 29 (5.9%) |
| 90 or more Minutes | 2 (0.5%) | 0 (0.0%) |
Time of Departure to Work by Sex in Woodville
The most frequent times of departure to work in Woodville are 6:00 AM to 6:29 AM (85, 20.1%) for males and 7:00 AM to 7:29 AM (89, 18.0%) for females.
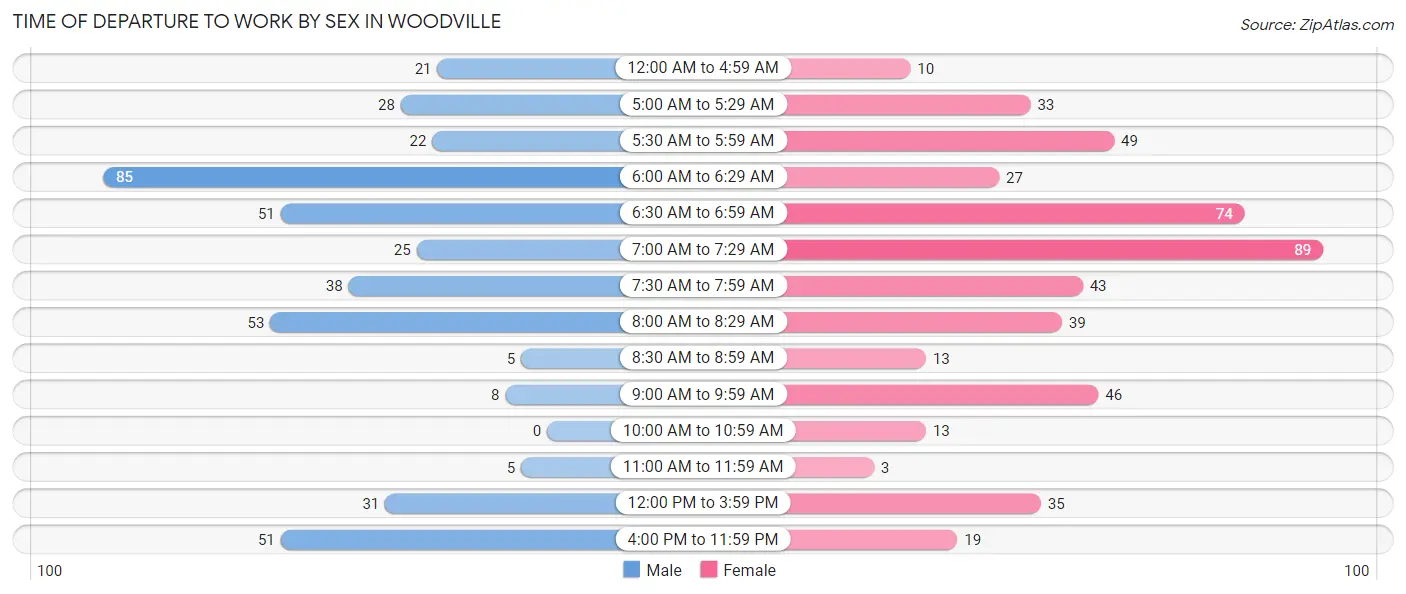
| Time of Departure | Male | Female |
| 12:00 AM to 4:59 AM | 21 (5.0%) | 10 (2.0%) |
| 5:00 AM to 5:29 AM | 28 (6.6%) | 33 (6.7%) |
| 5:30 AM to 5:59 AM | 22 (5.2%) | 49 (9.9%) |
| 6:00 AM to 6:29 AM | 85 (20.1%) | 27 (5.5%) |
| 6:30 AM to 6:59 AM | 51 (12.1%) | 74 (15.0%) |
| 7:00 AM to 7:29 AM | 25 (5.9%) | 89 (18.0%) |
| 7:30 AM to 7:59 AM | 38 (9.0%) | 43 (8.7%) |
| 8:00 AM to 8:29 AM | 53 (12.5%) | 39 (7.9%) |
| 8:30 AM to 8:59 AM | 5 (1.2%) | 13 (2.6%) |
| 9:00 AM to 9:59 AM | 8 (1.9%) | 46 (9.3%) |
| 10:00 AM to 10:59 AM | 0 (0.0%) | 13 (2.6%) |
| 11:00 AM to 11:59 AM | 5 (1.2%) | 3 (0.6%) |
| 12:00 PM to 3:59 PM | 31 (7.3%) | 35 (7.1%) |
| 4:00 PM to 11:59 PM | 51 (12.1%) | 19 (3.8%) |
| Total | 423 (100.0%) | 493 (100.0%) |
Housing Occupancy in Woodville
Occupancy by Ownership in Woodville
Of the total 841 dwellings in Woodville, owner-occupied units account for 638 (75.9%), while renter-occupied units make up 203 (24.1%).
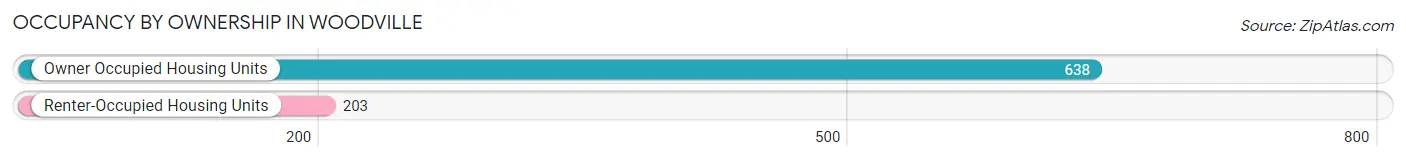
| Occupancy | # Housing Units | % Housing Units |
| Owner Occupied Housing Units | 638 | 75.9% |
| Renter-Occupied Housing Units | 203 | 24.1% |
| Total Occupied Housing Units | 841 | 100.0% |
Occupancy by Household Size in Woodville
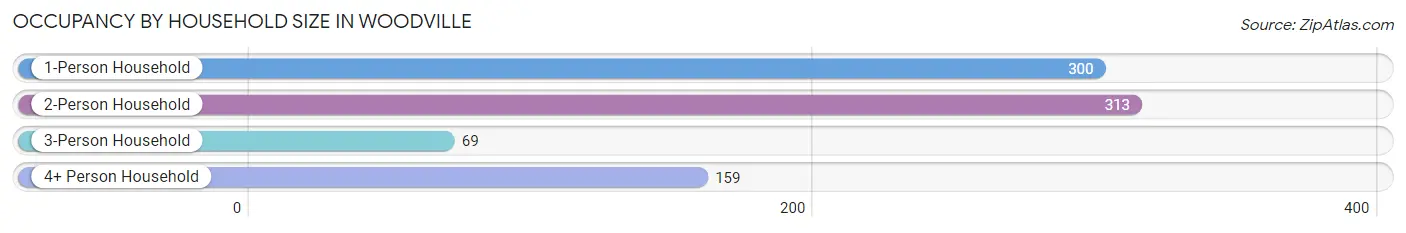
| Household Size | # Housing Units | % Housing Units |
| 1-Person Household | 300 | 35.7% |
| 2-Person Household | 313 | 37.2% |
| 3-Person Household | 69 | 8.2% |
| 4+ Person Household | 159 | 18.9% |
| Total Housing Units | 841 | 100.0% |
Occupancy by Ownership by Household Size in Woodville
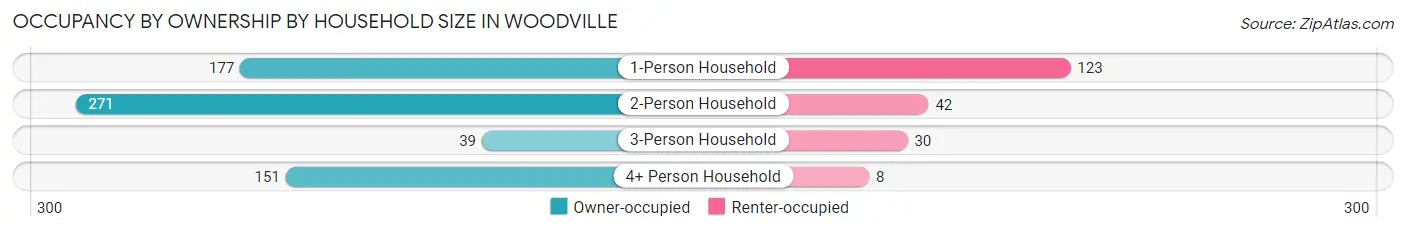
| Household Size | Owner-occupied | Renter-occupied |
| 1-Person Household | 177 (59.0%) | 123 (41.0%) |
| 2-Person Household | 271 (86.6%) | 42 (13.4%) |
| 3-Person Household | 39 (56.5%) | 30 (43.5%) |
| 4+ Person Household | 151 (95.0%) | 8 (5.0%) |
| Total Housing Units | 638 (75.9%) | 203 (24.1%) |
Occupancy by Educational Attainment in Woodville
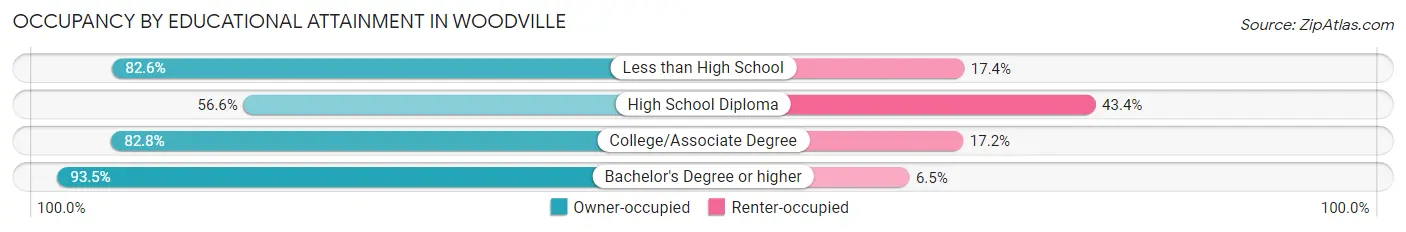
| Household Size | Owner-occupied | Renter-occupied |
| Less than High School | 19 (82.6%) | 4 (17.4%) |
| High School Diploma | 172 (56.6%) | 132 (43.4%) |
| College/Associate Degree | 260 (82.8%) | 54 (17.2%) |
| Bachelor's Degree or higher | 187 (93.5%) | 13 (6.5%) |
Occupancy by Age of Householder in Woodville
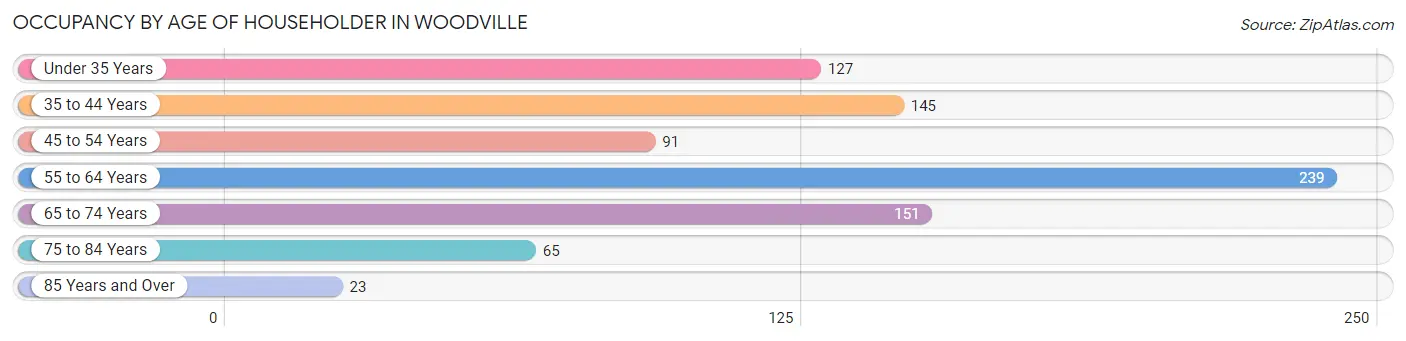
| Age Bracket | # Households | % Households |
| Under 35 Years | 127 | 15.1% |
| 35 to 44 Years | 145 | 17.2% |
| 45 to 54 Years | 91 | 10.8% |
| 55 to 64 Years | 239 | 28.4% |
| 65 to 74 Years | 151 | 17.9% |
| 75 to 84 Years | 65 | 7.7% |
| 85 Years and Over | 23 | 2.7% |
| Total | 841 | 100.0% |
Housing Finances in Woodville
Median Income by Occupancy in Woodville
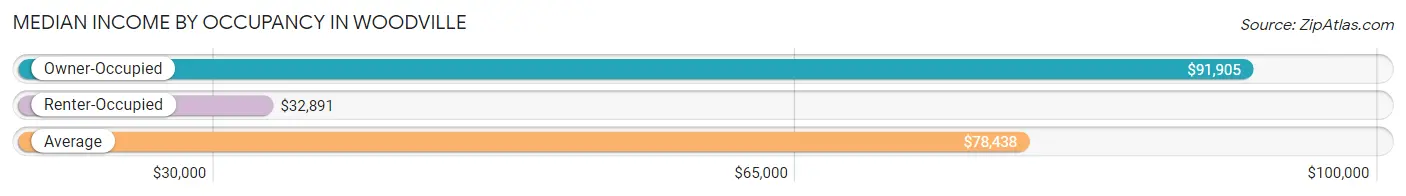
| Occupancy Type | # Households | Median Income |
| Owner-Occupied | 638 (75.9%) | $91,905 |
| Renter-Occupied | 203 (24.1%) | $32,891 |
| Average | 841 (100.0%) | $78,438 |
Occupancy by Householder Income Bracket in Woodville
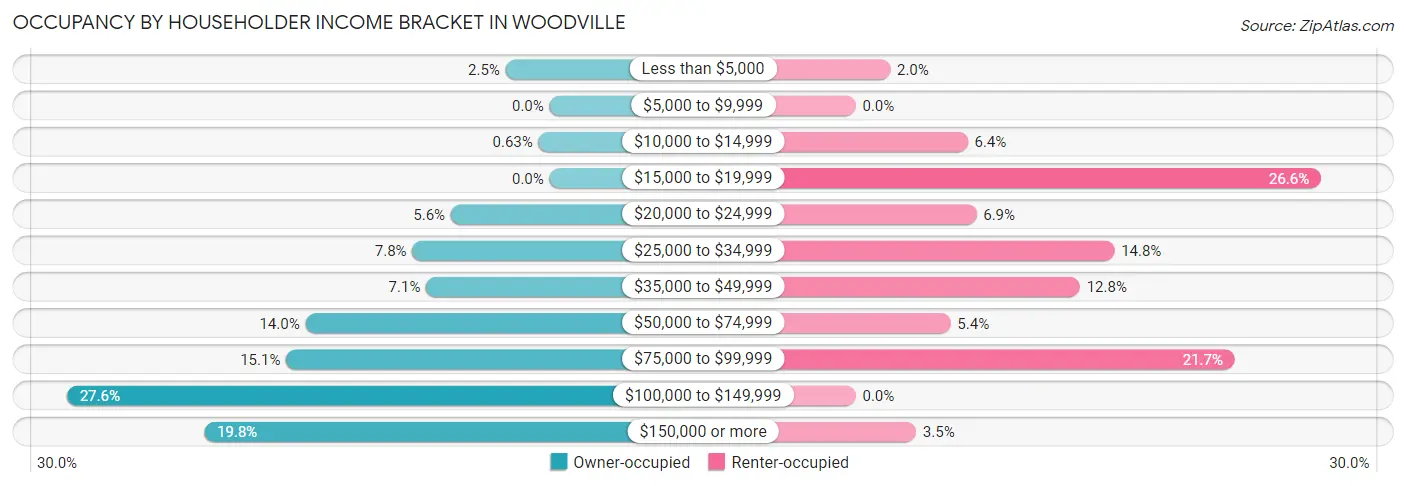
| Income Bracket | Owner-occupied | Renter-occupied |
| Less than $5,000 | 16 (2.5%) | 4 (2.0%) |
| $5,000 to $9,999 | 0 (0.0%) | 0 (0.0%) |
| $10,000 to $14,999 | 4 (0.6%) | 13 (6.4%) |
| $15,000 to $19,999 | 0 (0.0%) | 54 (26.6%) |
| $20,000 to $24,999 | 36 (5.6%) | 14 (6.9%) |
| $25,000 to $34,999 | 50 (7.8%) | 30 (14.8%) |
| $35,000 to $49,999 | 45 (7.0%) | 26 (12.8%) |
| $50,000 to $74,999 | 89 (14.0%) | 11 (5.4%) |
| $75,000 to $99,999 | 96 (15.0%) | 44 (21.7%) |
| $100,000 to $149,999 | 176 (27.6%) | 0 (0.0%) |
| $150,000 or more | 126 (19.8%) | 7 (3.5%) |
| Total | 638 (100.0%) | 203 (100.0%) |
Monthly Housing Cost Tiers in Woodville
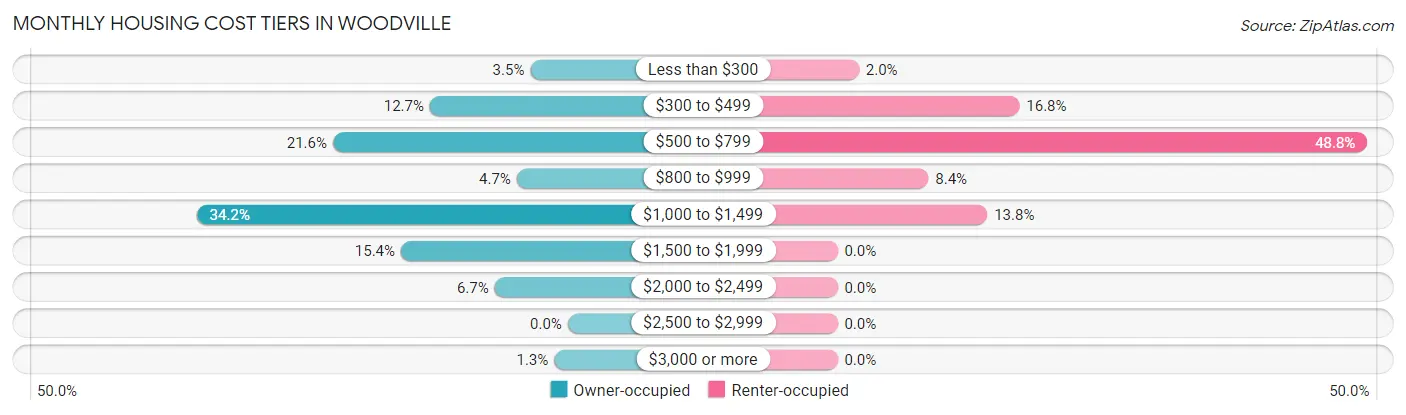
| Monthly Cost | Owner-occupied | Renter-occupied |
| Less than $300 | 22 (3.5%) | 4 (2.0%) |
| $300 to $499 | 81 (12.7%) | 34 (16.8%) |
| $500 to $799 | 138 (21.6%) | 99 (48.8%) |
| $800 to $999 | 30 (4.7%) | 17 (8.4%) |
| $1,000 to $1,499 | 218 (34.2%) | 28 (13.8%) |
| $1,500 to $1,999 | 98 (15.4%) | 0 (0.0%) |
| $2,000 to $2,499 | 43 (6.7%) | 0 (0.0%) |
| $2,500 to $2,999 | 0 (0.0%) | 0 (0.0%) |
| $3,000 or more | 8 (1.3%) | 0 (0.0%) |
| Total | 638 (100.0%) | 203 (100.0%) |
Physical Housing Characteristics in Woodville
Housing Structures in Woodville
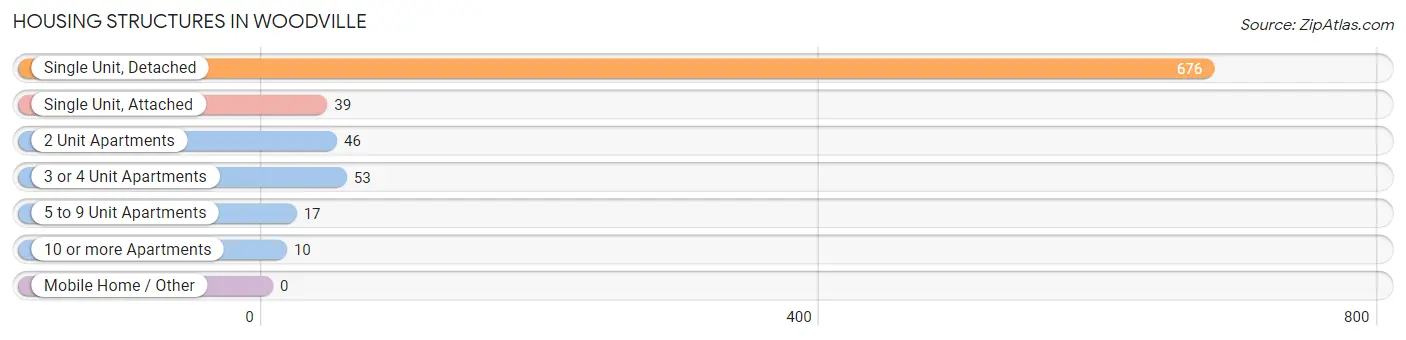
| Structure Type | # Housing Units | % Housing Units |
| Single Unit, Detached | 676 | 80.4% |
| Single Unit, Attached | 39 | 4.6% |
| 2 Unit Apartments | 46 | 5.5% |
| 3 or 4 Unit Apartments | 53 | 6.3% |
| 5 to 9 Unit Apartments | 17 | 2.0% |
| 10 or more Apartments | 10 | 1.2% |
| Mobile Home / Other | 0 | 0.0% |
| Total | 841 | 100.0% |
Housing Structures by Occupancy in Woodville
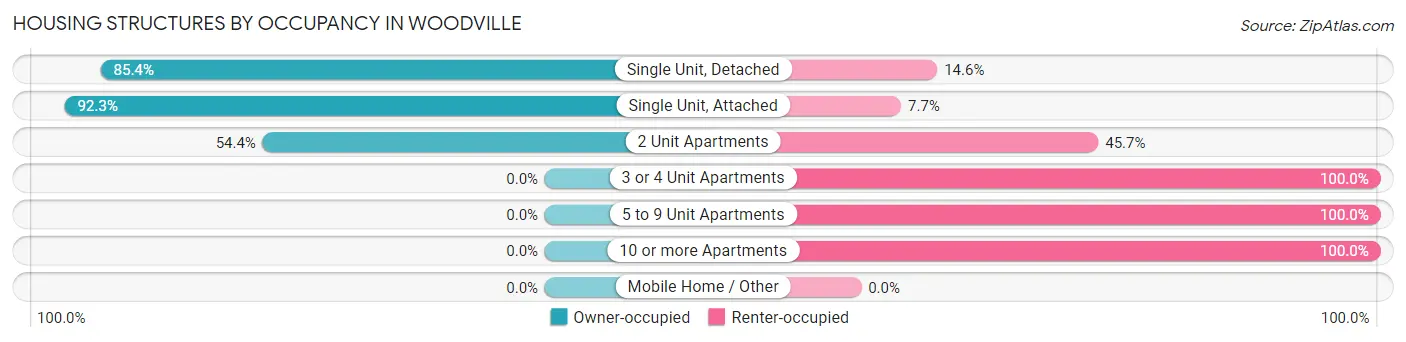
| Structure Type | Owner-occupied | Renter-occupied |
| Single Unit, Detached | 577 (85.4%) | 99 (14.6%) |
| Single Unit, Attached | 36 (92.3%) | 3 (7.7%) |
| 2 Unit Apartments | 25 (54.3%) | 21 (45.7%) |
| 3 or 4 Unit Apartments | 0 (0.0%) | 53 (100.0%) |
| 5 to 9 Unit Apartments | 0 (0.0%) | 17 (100.0%) |
| 10 or more Apartments | 0 (0.0%) | 10 (100.0%) |
| Mobile Home / Other | 0 (0.0%) | 0 (0.0%) |
| Total | 638 (75.9%) | 203 (24.1%) |
Housing Structures by Number of Rooms in Woodville
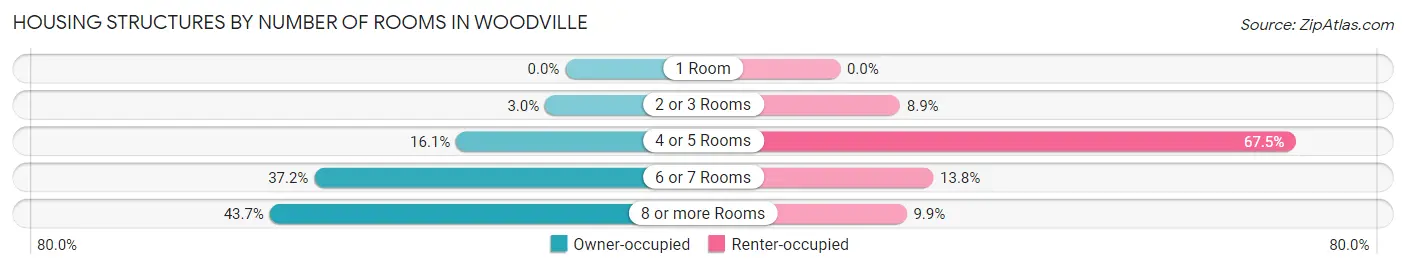
| Number of Rooms | Owner-occupied | Renter-occupied |
| 1 Room | 0 (0.0%) | 0 (0.0%) |
| 2 or 3 Rooms | 19 (3.0%) | 18 (8.9%) |
| 4 or 5 Rooms | 103 (16.1%) | 137 (67.5%) |
| 6 or 7 Rooms | 237 (37.1%) | 28 (13.8%) |
| 8 or more Rooms | 279 (43.7%) | 20 (9.9%) |
| Total | 638 (100.0%) | 203 (100.0%) |
Housing Structure by Heating Type in Woodville
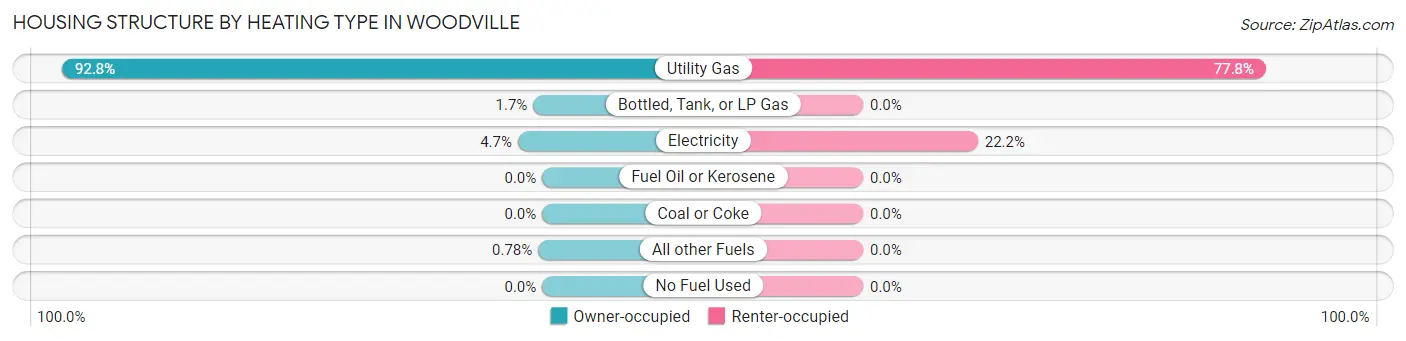
| Heating Type | Owner-occupied | Renter-occupied |
| Utility Gas | 592 (92.8%) | 158 (77.8%) |
| Bottled, Tank, or LP Gas | 11 (1.7%) | 0 (0.0%) |
| Electricity | 30 (4.7%) | 45 (22.2%) |
| Fuel Oil or Kerosene | 0 (0.0%) | 0 (0.0%) |
| Coal or Coke | 0 (0.0%) | 0 (0.0%) |
| All other Fuels | 5 (0.8%) | 0 (0.0%) |
| No Fuel Used | 0 (0.0%) | 0 (0.0%) |
| Total | 638 (100.0%) | 203 (100.0%) |
Household Vehicle Usage in Woodville
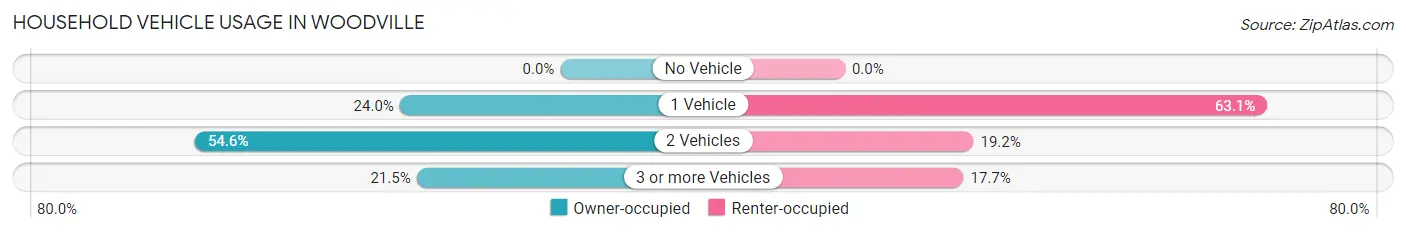
| Vehicles per Household | Owner-occupied | Renter-occupied |
| No Vehicle | 0 (0.0%) | 0 (0.0%) |
| 1 Vehicle | 153 (24.0%) | 128 (63.0%) |
| 2 Vehicles | 348 (54.5%) | 39 (19.2%) |
| 3 or more Vehicles | 137 (21.5%) | 36 (17.7%) |
| Total | 638 (100.0%) | 203 (100.0%) |
Real Estate & Mortgages in Woodville
Real Estate and Mortgage Overview in Woodville
| Characteristic | Without Mortgage | With Mortgage |
| Housing Units | 210 | 428 |
| Median Property Value | $172,700 | $163,700 |
| Median Household Income | $61,250 | $98 |
| Monthly Housing Costs | $550 | $8 |
| Real Estate Taxes | $2,551 | $15 |
Property Value by Mortgage Status in Woodville
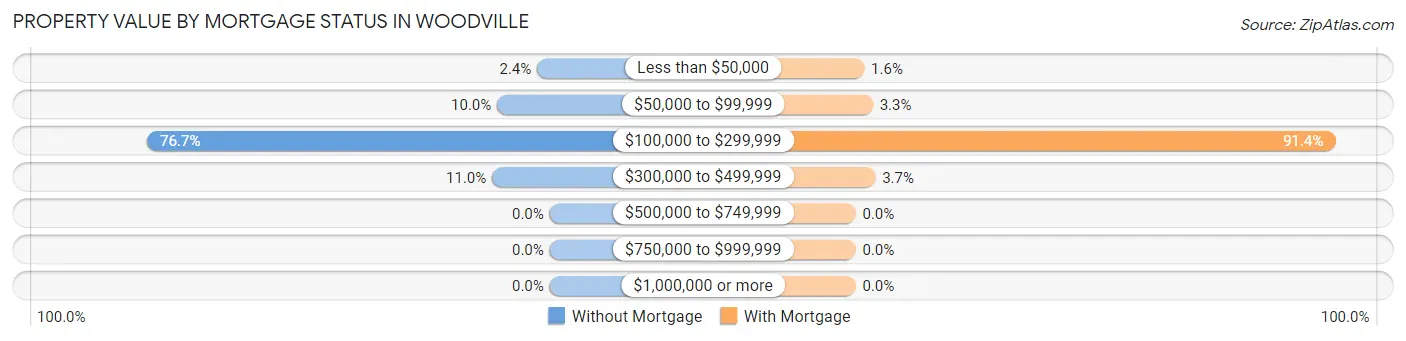
| Property Value | Without Mortgage | With Mortgage |
| Less than $50,000 | 5 (2.4%) | 7 (1.6%) |
| $50,000 to $99,999 | 21 (10.0%) | 14 (3.3%) |
| $100,000 to $299,999 | 161 (76.7%) | 391 (91.4%) |
| $300,000 to $499,999 | 23 (11.0%) | 16 (3.7%) |
| $500,000 to $749,999 | 0 (0.0%) | 0 (0.0%) |
| $750,000 to $999,999 | 0 (0.0%) | 0 (0.0%) |
| $1,000,000 or more | 0 (0.0%) | 0 (0.0%) |
| Total | 210 (100.0%) | 428 (100.0%) |
Household Income by Mortgage Status in Woodville
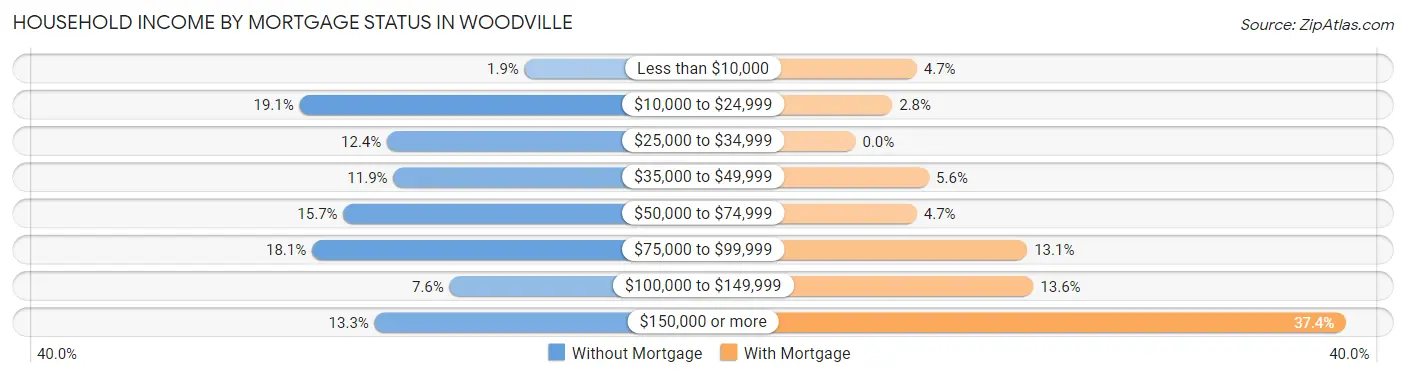
| Household Income | Without Mortgage | With Mortgage |
| Less than $10,000 | 4 (1.9%) | 20 (4.7%) |
| $10,000 to $24,999 | 40 (19.1%) | 12 (2.8%) |
| $25,000 to $34,999 | 26 (12.4%) | 0 (0.0%) |
| $35,000 to $49,999 | 25 (11.9%) | 24 (5.6%) |
| $50,000 to $74,999 | 33 (15.7%) | 20 (4.7%) |
| $75,000 to $99,999 | 38 (18.1%) | 56 (13.1%) |
| $100,000 to $149,999 | 16 (7.6%) | 58 (13.6%) |
| $150,000 or more | 28 (13.3%) | 160 (37.4%) |
| Total | 210 (100.0%) | 428 (100.0%) |
Property Value to Household Income Ratio in Woodville
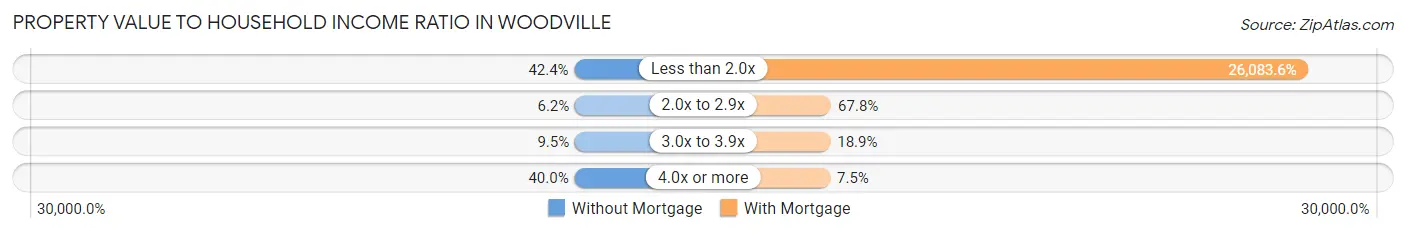
| Value-to-Income Ratio | Without Mortgage | With Mortgage |
| Less than 2.0x | 89 (42.4%) | 111,638 (26,083.6%) |
| 2.0x to 2.9x | 13 (6.2%) | 290 (67.8%) |
| 3.0x to 3.9x | 20 (9.5%) | 81 (18.9%) |
| 4.0x or more | 84 (40.0%) | 32 (7.5%) |
| Total | 210 (100.0%) | 428 (100.0%) |
Real Estate Taxes by Mortgage Status in Woodville
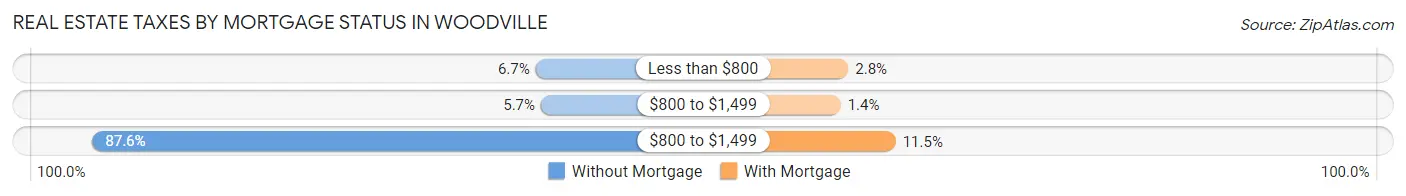
| Property Taxes | Without Mortgage | With Mortgage |
| Less than $800 | 14 (6.7%) | 12 (2.8%) |
| $800 to $1,499 | 12 (5.7%) | 6 (1.4%) |
| $800 to $1,499 | 184 (87.6%) | 49 (11.5%) |
| Total | 210 (100.0%) | 428 (100.0%) |
Health & Disability in Woodville
Health Insurance Coverage by Age in Woodville
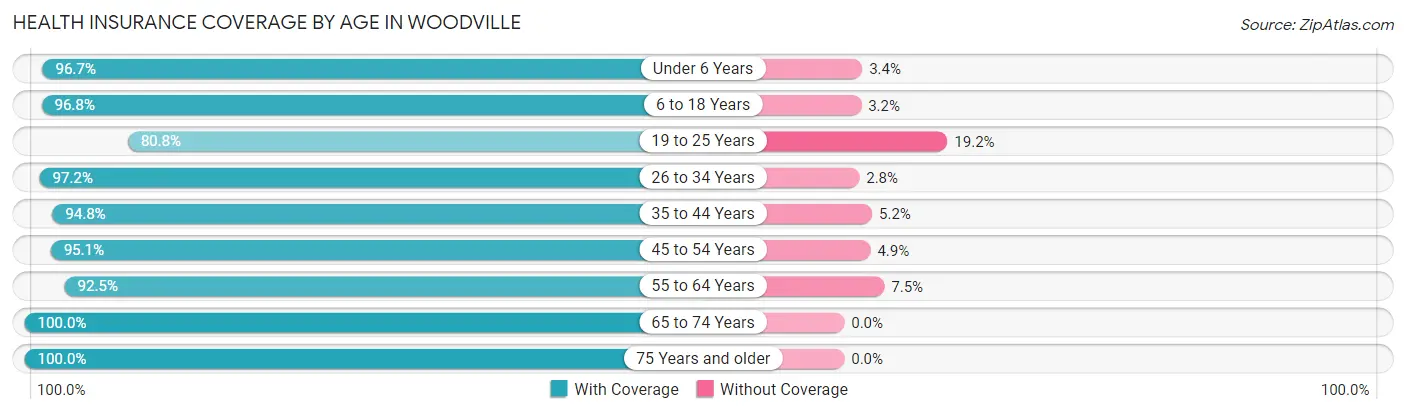
| Age Bracket | With Coverage | Without Coverage |
| Under 6 Years | 202 (96.7%) | 7 (3.4%) |
| 6 to 18 Years | 276 (96.8%) | 9 (3.2%) |
| 19 to 25 Years | 63 (80.8%) | 15 (19.2%) |
| 26 to 34 Years | 209 (97.2%) | 6 (2.8%) |
| 35 to 44 Years | 274 (94.8%) | 15 (5.2%) |
| 45 to 54 Years | 156 (95.1%) | 8 (4.9%) |
| 55 to 64 Years | 322 (92.5%) | 26 (7.5%) |
| 65 to 74 Years | 208 (100.0%) | 0 (0.0%) |
| 75 Years and older | 116 (100.0%) | 0 (0.0%) |
| Total | 1,826 (95.5%) | 86 (4.5%) |
Health Insurance Coverage by Citizenship Status in Woodville
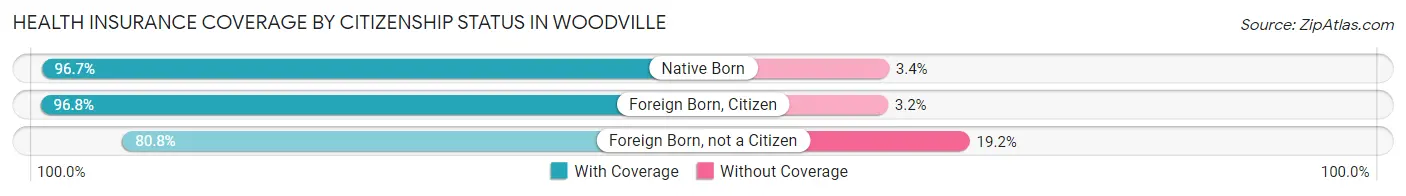
| Citizenship Status | With Coverage | Without Coverage |
| Native Born | 202 (96.7%) | 7 (3.4%) |
| Foreign Born, Citizen | 276 (96.8%) | 9 (3.2%) |
| Foreign Born, not a Citizen | 63 (80.8%) | 15 (19.2%) |
Health Insurance Coverage by Household Income in Woodville
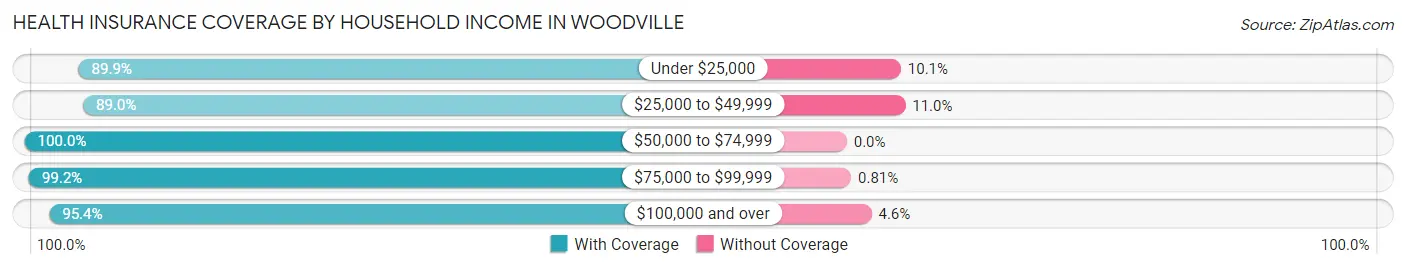
| Household Income | With Coverage | Without Coverage |
| Under $25,000 | 142 (89.9%) | 16 (10.1%) |
| $25,000 to $49,999 | 195 (89.0%) | 24 (11.0%) |
| $50,000 to $74,999 | 235 (100.0%) | 0 (0.0%) |
| $75,000 to $99,999 | 368 (99.2%) | 3 (0.8%) |
| $100,000 and over | 886 (95.4%) | 43 (4.6%) |
Public vs Private Health Insurance Coverage by Age in Woodville
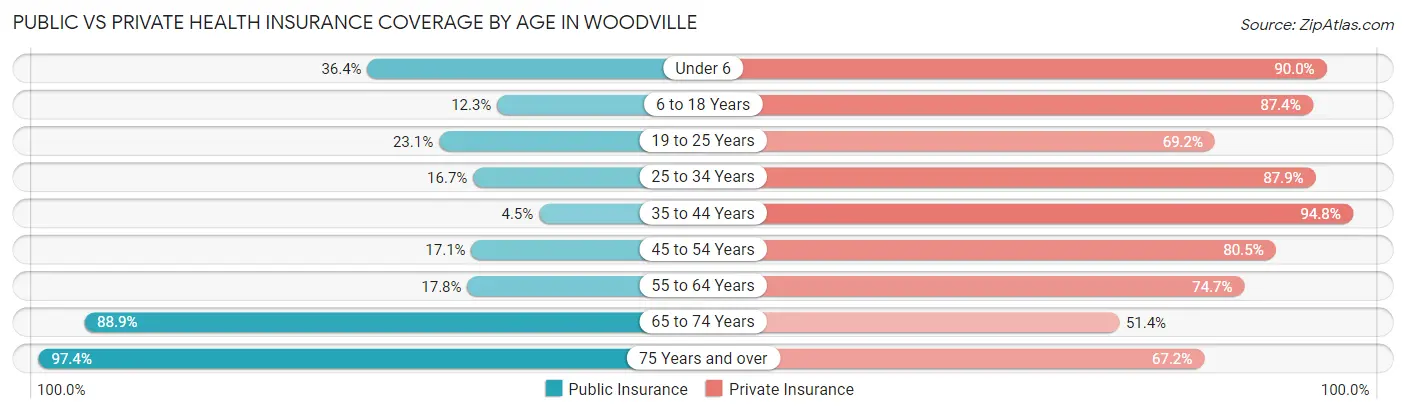
| Age Bracket | Public Insurance | Private Insurance |
| Under 6 | 76 (36.4%) | 188 (89.9%) |
| 6 to 18 Years | 35 (12.3%) | 249 (87.4%) |
| 19 to 25 Years | 18 (23.1%) | 54 (69.2%) |
| 25 to 34 Years | 36 (16.7%) | 189 (87.9%) |
| 35 to 44 Years | 13 (4.5%) | 274 (94.8%) |
| 45 to 54 Years | 28 (17.1%) | 132 (80.5%) |
| 55 to 64 Years | 62 (17.8%) | 260 (74.7%) |
| 65 to 74 Years | 185 (88.9%) | 107 (51.4%) |
| 75 Years and over | 113 (97.4%) | 78 (67.2%) |
| Total | 566 (29.6%) | 1,531 (80.1%) |
Disability Status by Sex by Age in Woodville
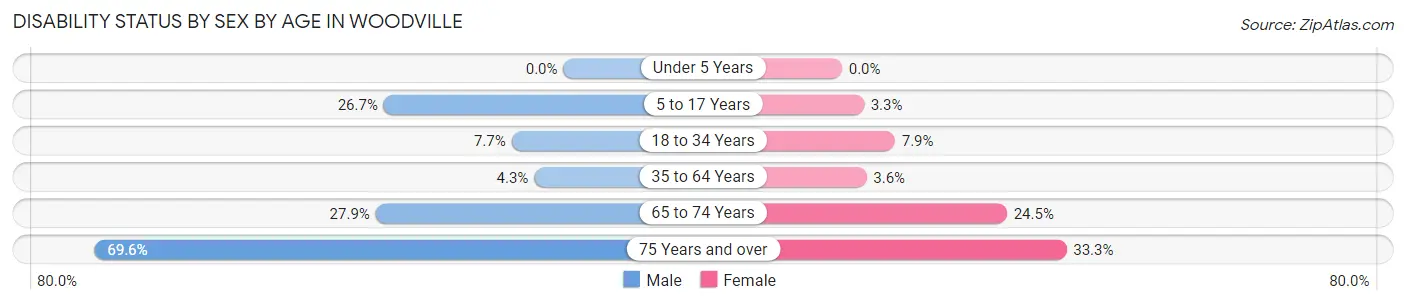
| Age Bracket | Male | Female |
| Under 5 Years | 0 (0.0%) | 0 (0.0%) |
| 5 to 17 Years | 32 (26.7%) | 5 (3.3%) |
| 18 to 34 Years | 12 (7.7%) | 14 (7.9%) |
| 35 to 64 Years | 18 (4.3%) | 14 (3.6%) |
| 65 to 74 Years | 17 (27.9%) | 36 (24.5%) |
| 75 Years and over | 39 (69.6%) | 20 (33.3%) |
Disability Class by Sex by Age in Woodville
Disability Class: Hearing Difficulty
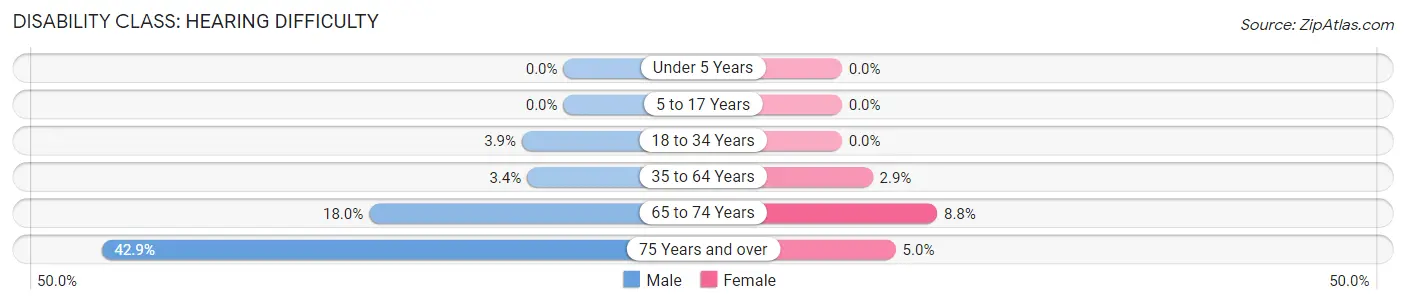
| Age Bracket | Male | Female |
| Under 5 Years | 0 (0.0%) | 0 (0.0%) |
| 5 to 17 Years | 0 (0.0%) | 0 (0.0%) |
| 18 to 34 Years | 6 (3.8%) | 0 (0.0%) |
| 35 to 64 Years | 14 (3.4%) | 11 (2.9%) |
| 65 to 74 Years | 11 (18.0%) | 13 (8.8%) |
| 75 Years and over | 24 (42.9%) | 3 (5.0%) |
Disability Class: Vision Difficulty
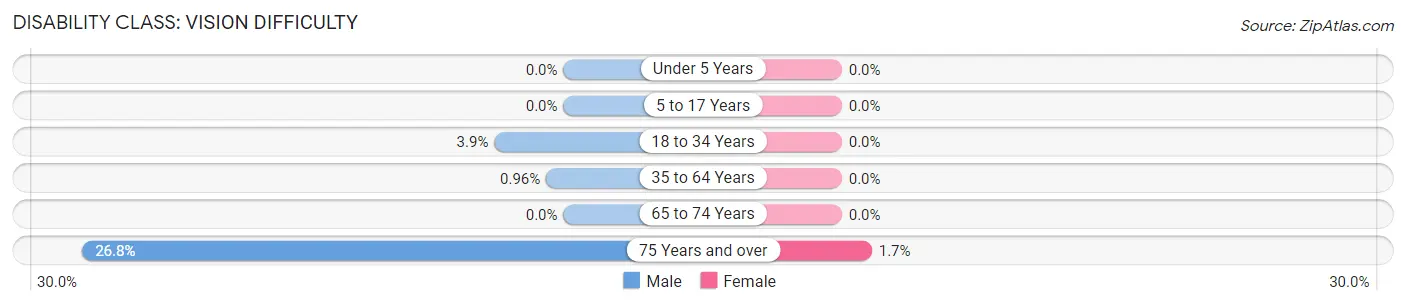
| Age Bracket | Male | Female |
| Under 5 Years | 0 (0.0%) | 0 (0.0%) |
| 5 to 17 Years | 0 (0.0%) | 0 (0.0%) |
| 18 to 34 Years | 6 (3.8%) | 0 (0.0%) |
| 35 to 64 Years | 4 (1.0%) | 0 (0.0%) |
| 65 to 74 Years | 0 (0.0%) | 0 (0.0%) |
| 75 Years and over | 15 (26.8%) | 1 (1.7%) |
Disability Class: Cognitive Difficulty
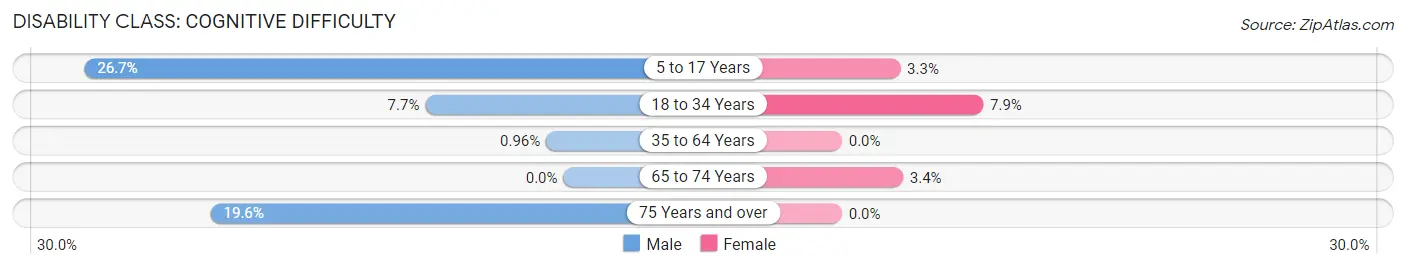
| Age Bracket | Male | Female |
| 5 to 17 Years | 32 (26.7%) | 5 (3.3%) |
| 18 to 34 Years | 12 (7.7%) | 14 (7.9%) |
| 35 to 64 Years | 4 (1.0%) | 0 (0.0%) |
| 65 to 74 Years | 0 (0.0%) | 5 (3.4%) |
| 75 Years and over | 11 (19.6%) | 0 (0.0%) |
Disability Class: Ambulatory Difficulty
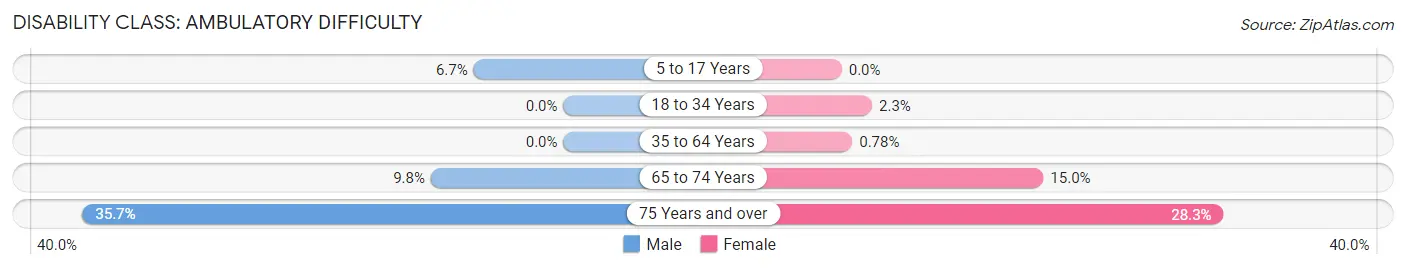
| Age Bracket | Male | Female |
| 5 to 17 Years | 8 (6.7%) | 0 (0.0%) |
| 18 to 34 Years | 0 (0.0%) | 4 (2.2%) |
| 35 to 64 Years | 0 (0.0%) | 3 (0.8%) |
| 65 to 74 Years | 6 (9.8%) | 22 (15.0%) |
| 75 Years and over | 20 (35.7%) | 17 (28.3%) |
Disability Class: Self-Care Difficulty
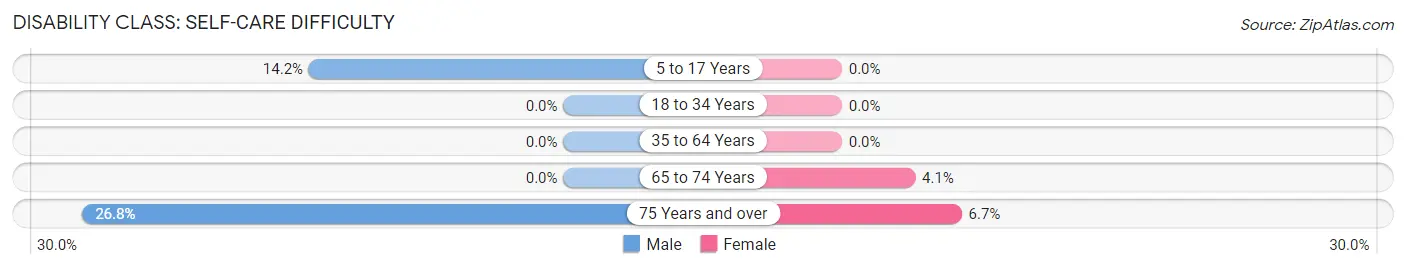
| Age Bracket | Male | Female |
| 5 to 17 Years | 17 (14.2%) | 0 (0.0%) |
| 18 to 34 Years | 0 (0.0%) | 0 (0.0%) |
| 35 to 64 Years | 0 (0.0%) | 0 (0.0%) |
| 65 to 74 Years | 0 (0.0%) | 6 (4.1%) |
| 75 Years and over | 15 (26.8%) | 4 (6.7%) |
Technology Access in Woodville
Computing Device Access in Woodville
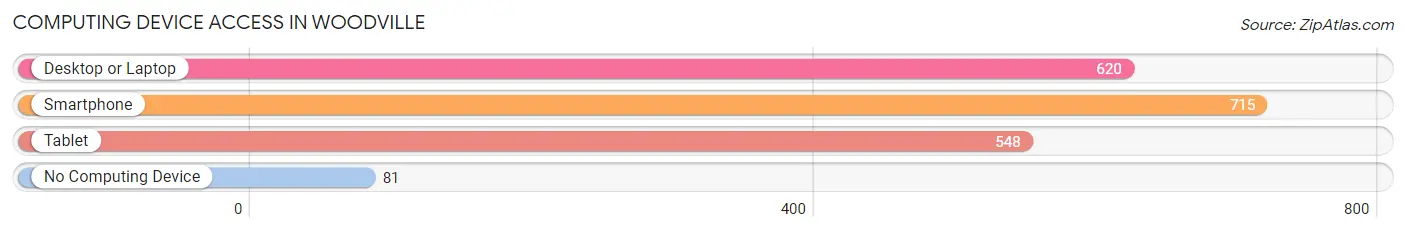
| Device Type | # Households | % Households |
| Desktop or Laptop | 620 | 73.7% |
| Smartphone | 715 | 85.0% |
| Tablet | 548 | 65.2% |
| No Computing Device | 81 | 9.6% |
| Total | 841 | 100.0% |
Internet Access in Woodville
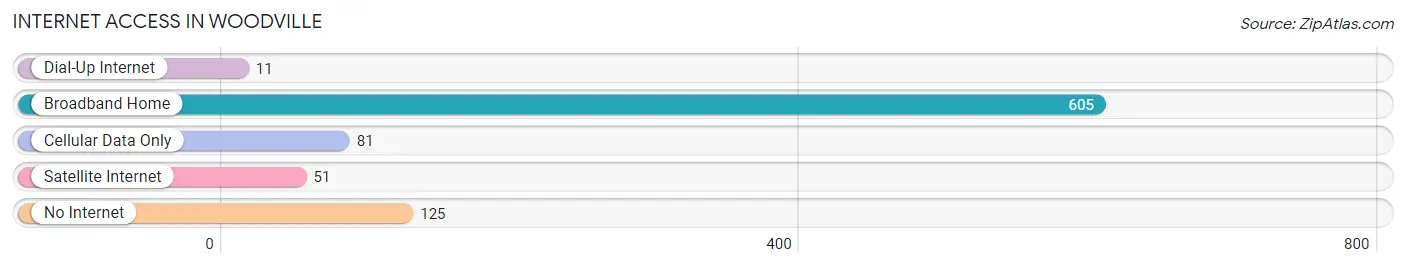
| Internet Type | # Households | % Households |
| Dial-Up Internet | 11 | 1.3% |
| Broadband Home | 605 | 71.9% |
| Cellular Data Only | 81 | 9.6% |
| Satellite Internet | 51 | 6.1% |
| No Internet | 125 | 14.9% |
| Total | 841 | 100.0% |
Woodville Summary
Woodville, Ohio is a small village located in Sandusky County, Ohio. It is situated on the banks of the Portage River, approximately 25 miles east of Toledo. The village has a population of 1,717 people, according to the 2010 census.
History
Woodville was founded in 1820 by a group of settlers from Connecticut. The village was named after the nearby wooded area, which was a popular spot for hunting and fishing. The first post office was established in 1821, and the village was incorporated in 1837.
In the early days, the village was a major hub for the lumber industry. The Portage River provided an easy way to transport logs to the sawmills in the area. The lumber industry was the main source of income for the village until the late 19th century, when the railroad came to town.
The railroad brought new industry to the area, including a brickyard, a flour mill, and a furniture factory. The village also became a popular tourist destination, with several hotels and resorts opening up along the river.
Geography
Woodville is located in the northwest corner of Sandusky County, Ohio. It is situated on the banks of the Portage River, approximately 25 miles east of Toledo. The village is surrounded by farmland and wooded areas.
The climate in Woodville is typical of the Midwest, with hot summers and cold winters. The average temperature in July is 78 degrees Fahrenheit, and the average temperature in January is 24 degrees Fahrenheit.
Economy
The economy of Woodville is largely based on agriculture and tourism. The village is home to several farms, which produce a variety of crops, including corn, soybeans, and wheat. The village also has several restaurants, hotels, and resorts, which attract tourists from all over the region.
The village is also home to several small businesses, including a hardware store, a grocery store, and a pharmacy. The village also has a post office, a bank, and a library.
Demographics
According to the 2010 census, the population of Woodville is 1,717 people. The median age is 41.7 years, and the median household income is $45,945. The village is predominantly white (97.2%), with a small percentage of African Americans (1.2%) and Hispanics (1.6%).
Conclusion
Woodville, Ohio is a small village located in Sandusky County, Ohio. It is situated on the banks of the Portage River, approximately 25 miles east of Toledo. The village has a population of 1,717 people, according to the 2010 census. The economy of Woodville is largely based on agriculture and tourism, and the village is predominantly white. Woodville is a great place to live, work, and visit, and it is a great example of small-town life in the Midwest.
Common Questions
What is Per Capita Income in Woodville?
Per Capita income in Woodville is $40,160.
What is the Median Family Income in Woodville?
Median Family Income in Woodville is $108,750.
What is the Median Household income in Woodville?
Median Household Income in Woodville is $78,438.
What is Income or Wage Gap in Woodville?
Income or Wage Gap in Woodville is 28.4%.
Women in Woodville earn 71.6 cents for every dollar earned by a man.
What is Inequality or Gini Index in Woodville?
Inequality or Gini Index in Woodville is 0.40.
What is the Total Population of Woodville?
Total Population of Woodville is 1,912.
What is the Total Male Population of Woodville?
Total Male Population of Woodville is 887.
What is the Total Female Population of Woodville?
Total Female Population of Woodville is 1,025.
What is the Ratio of Males per 100 Females in Woodville?
There are 86.54 Males per 100 Females in Woodville.
What is the Ratio of Females per 100 Males in Woodville?
There are 115.56 Females per 100 Males in Woodville.
What is the Median Population Age in Woodville?
Median Population Age in Woodville is 39.9 Years.
What is the Average Family Size in Woodville
Average Family Size in Woodville is 3.0 People.
What is the Average Household Size in Woodville
Average Household Size in Woodville is 2.3 People.
How Large is the Labor Force in Woodville?
There are 1,058 People in the Labor Forcein in Woodville.
What is the Percentage of People in the Labor Force in Woodville?
70.6% of People are in the Labor Force in Woodville.
What is the Unemployment Rate in Woodville?
Unemployment Rate in Woodville is 5.5%.