Wheelersburg, OH Map & Demographics
Wheelersburg Map
Wheelersburg Overview
$33,841
PER CAPITA INCOME
$90,109
AVG FAMILY INCOME
$66,683
AVG HOUSEHOLD INCOME
46.8%
WAGE / INCOME GAP [ % ]
53.2¢/ $1
WAGE / INCOME GAP [ $ ]
0.43
INEQUALITY / GINI INDEX
6,215
TOTAL POPULATION
2,754
MALE POPULATION
3,461
FEMALE POPULATION
79.57
MALES / 100 FEMALES
125.67
FEMALES / 100 MALES
42.3
MEDIAN AGE
2.9
AVG FAMILY SIZE
2.4
AVG HOUSEHOLD SIZE
2,825
LABOR FORCE [ PEOPLE ]
55.8%
PERCENT IN LABOR FORCE
7.3%
UNEMPLOYMENT RATE
Wheelersburg Zip Codes
Wheelersburg Area Codes
Income in Wheelersburg
Income Overview in Wheelersburg
Per Capita Income in Wheelersburg is $33,841, while median incomes of families and households are $90,109 and $66,683 respectively.
| Characteristic | Number | Measure |
| Per Capita Income | 6,215 | $33,841 |
| Median Family Income | 1,724 | $90,109 |
| Mean Family Income | 1,724 | $97,864 |
| Median Household Income | 2,477 | $66,683 |
| Mean Household Income | 2,477 | $83,963 |
| Income Deficit | 1,724 | $0 |
| Wage / Income Gap (%) | 6,215 | 46.84% |
| Wage / Income Gap ($) | 6,215 | 53.16¢ per $1 |
| Gini / Inequality Index | 6,215 | 0.43 |
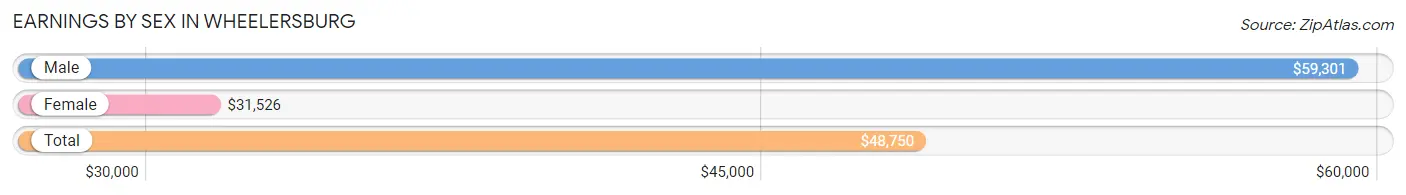
Earnings by Sex in Wheelersburg
Average Earnings in Wheelersburg are $48,750, $59,301 for men and $31,526 for women, a difference of 46.8%.
| Sex | Number | Average Earnings |
| Male | 1,239 (45.5%) | $59,301 |
| Female | 1,484 (54.5%) | $31,526 |
| Total | 2,723 (100.0%) | $48,750 |
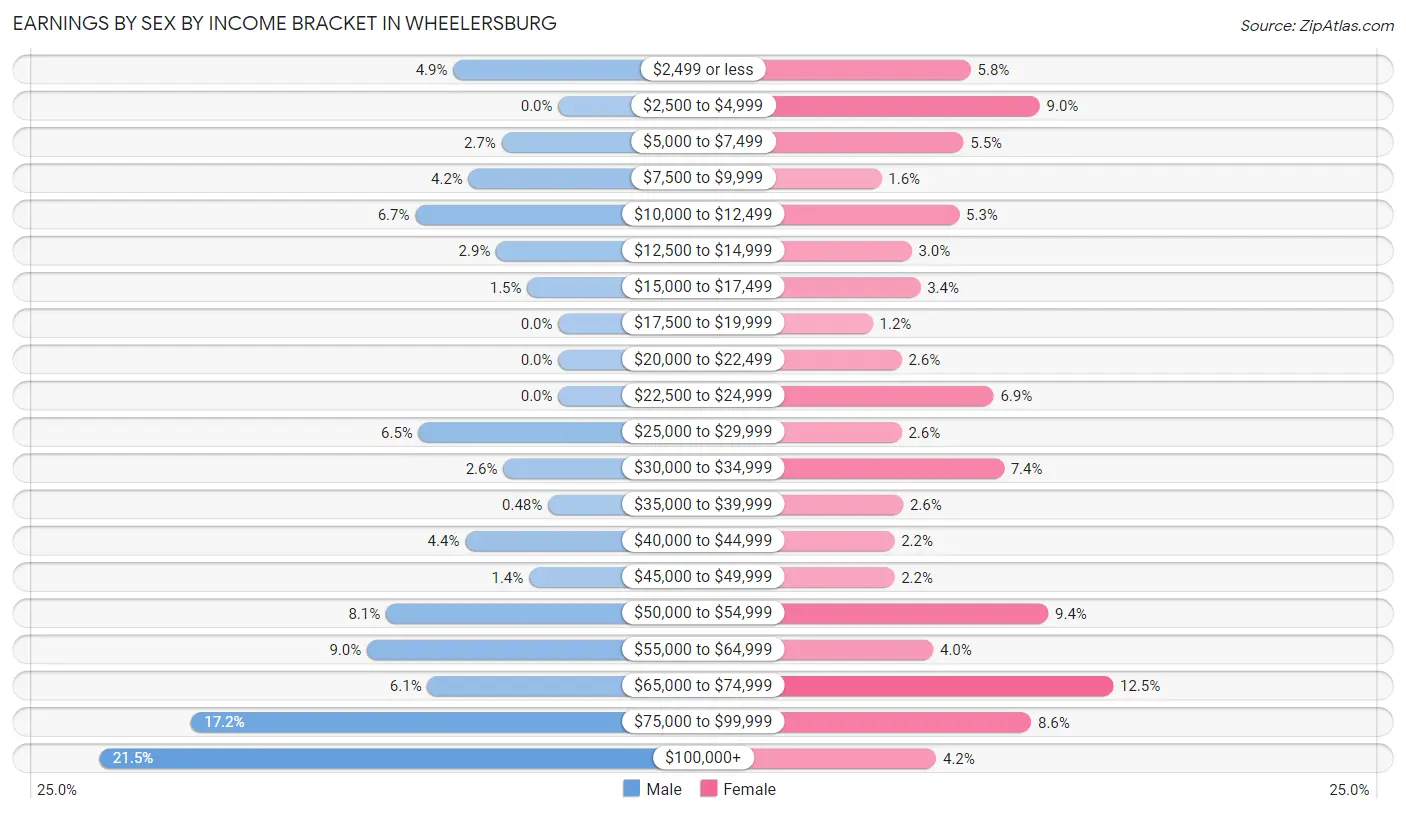
Earnings by Sex by Income Bracket in Wheelersburg
The most common earnings brackets in Wheelersburg are $100,000+ for men (266 | 21.5%) and $65,000 to $74,999 for women (185 | 12.5%).
| Income | Male | Female |
| $2,499 or less | 61 (4.9%) | 86 (5.8%) |
| $2,500 to $4,999 | 0 (0.0%) | 134 (9.0%) |
| $5,000 to $7,499 | 33 (2.7%) | 81 (5.5%) |
| $7,500 to $9,999 | 52 (4.2%) | 24 (1.6%) |
| $10,000 to $12,499 | 83 (6.7%) | 78 (5.3%) |
| $12,500 to $14,999 | 36 (2.9%) | 45 (3.0%) |
| $15,000 to $17,499 | 18 (1.5%) | 51 (3.4%) |
| $17,500 to $19,999 | 0 (0.0%) | 18 (1.2%) |
| $20,000 to $22,499 | 0 (0.0%) | 38 (2.6%) |
| $22,500 to $24,999 | 0 (0.0%) | 102 (6.9%) |
| $25,000 to $29,999 | 81 (6.5%) | 38 (2.6%) |
| $30,000 to $34,999 | 32 (2.6%) | 109 (7.3%) |
| $35,000 to $39,999 | 6 (0.5%) | 39 (2.6%) |
| $40,000 to $44,999 | 54 (4.4%) | 33 (2.2%) |
| $45,000 to $49,999 | 17 (1.4%) | 33 (2.2%) |
| $50,000 to $54,999 | 100 (8.1%) | 140 (9.4%) |
| $55,000 to $64,999 | 111 (9.0%) | 60 (4.0%) |
| $65,000 to $74,999 | 76 (6.1%) | 185 (12.5%) |
| $75,000 to $99,999 | 213 (17.2%) | 128 (8.6%) |
| $100,000+ | 266 (21.5%) | 62 (4.2%) |
| Total | 1,239 (100.0%) | 1,484 (100.0%) |
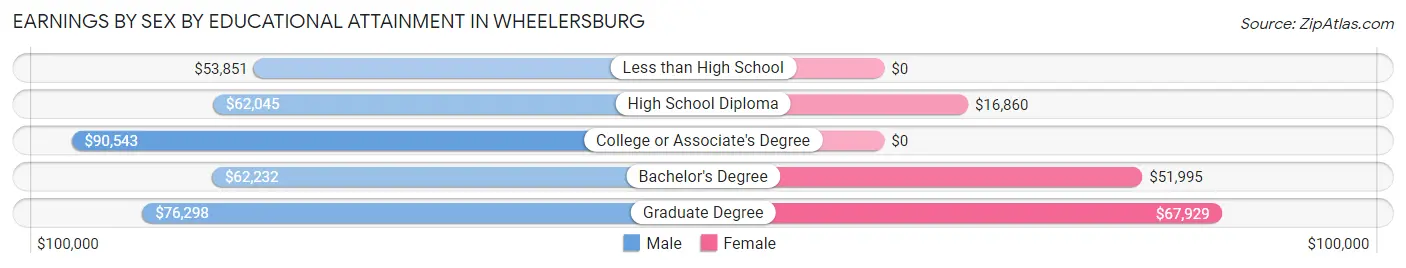
Earnings by Sex by Educational Attainment in Wheelersburg
Average earnings in Wheelersburg are $71,861 for men and $36,442 for women, a difference of 49.3%. Men with an educational attainment of college or associate's degree enjoy the highest average annual earnings of $90,543, while those with less than high school education earn the least with $53,851. Women with an educational attainment of graduate degree earn the most with the average annual earnings of $67,929, while those with high school diploma education have the smallest earnings of $16,860.
| Educational Attainment | Male Income | Female Income |
| Less than High School | $53,851 | $0 |
| High School Diploma | $62,045 | $16,860 |
| College or Associate's Degree | $90,543 | $0 |
| Bachelor's Degree | $62,232 | $51,995 |
| Graduate Degree | $76,298 | $67,929 |
| Total | $71,861 | $36,442 |
Family Income in Wheelersburg
Family Income Brackets in Wheelersburg
According to the Wheelersburg family income data, there are 353 families falling into the $100,000 to $149,999 income range, which is the most common income bracket and makes up 20.5% of all families.
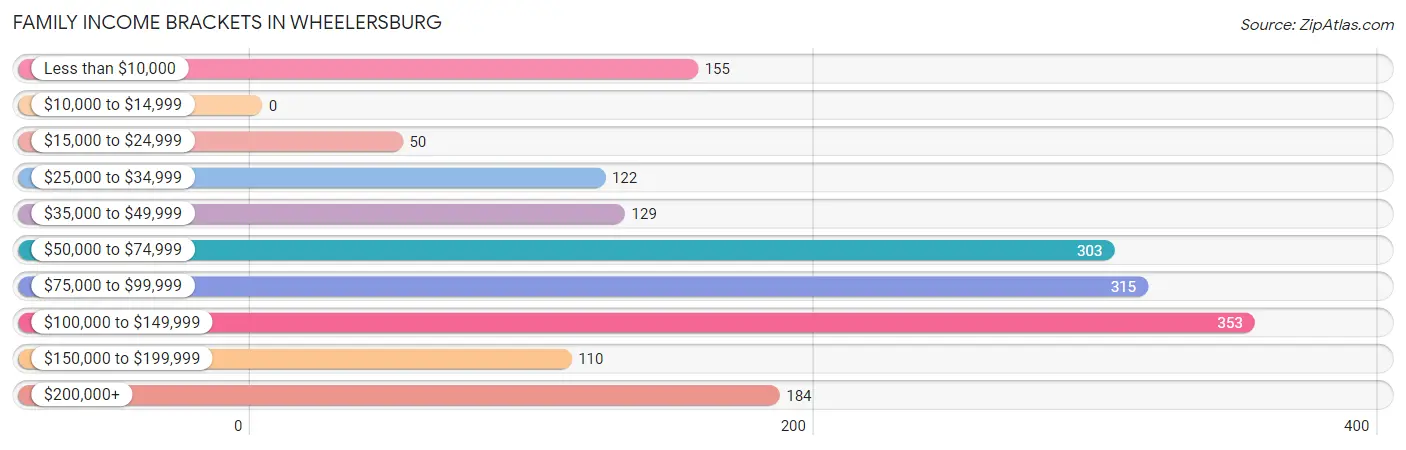
| Income Bracket | # Families | % Families |
| Less than $10,000 | 155 | 9.0% |
| $10,000 to $14,999 | 0 | 0.0% |
| $15,000 to $24,999 | 50 | 2.9% |
| $25,000 to $34,999 | 122 | 7.1% |
| $35,000 to $49,999 | 129 | 7.5% |
| $50,000 to $74,999 | 303 | 17.6% |
| $75,000 to $99,999 | 315 | 18.3% |
| $100,000 to $149,999 | 353 | 20.5% |
| $150,000 to $199,999 | 110 | 6.4% |
| $200,000+ | 184 | 10.7% |
Family Income by Famaliy Size in Wheelersburg
3-person families (365 | 21.2%) account for the highest median family income in Wheelersburg with $112,664 per family, while 3-person families (365 | 21.2%) have the highest median income of $37,555 per family member.
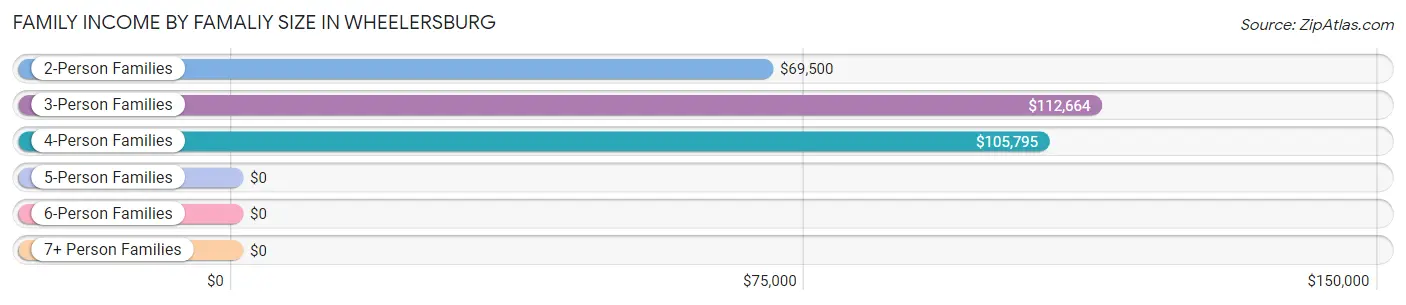
| Income Bracket | # Families | Median Income |
| 2-Person Families | 916 (53.1%) | $69,500 |
| 3-Person Families | 365 (21.2%) | $112,664 |
| 4-Person Families | 224 (13.0%) | $105,795 |
| 5-Person Families | 161 (9.3%) | $0 |
| 6-Person Families | 52 (3.0%) | $0 |
| 7+ Person Families | 6 (0.4%) | $0 |
| Total | 1,724 (100.0%) | $90,109 |
Family Income by Number of Earners in Wheelersburg
The median family income in Wheelersburg is $90,109, with families comprising 3+ earners (159) having the highest median family income of $168,185, while families with no earners (497) have the lowest median family income of $44,960, accounting for 9.2% and 28.8% of families, respectively.
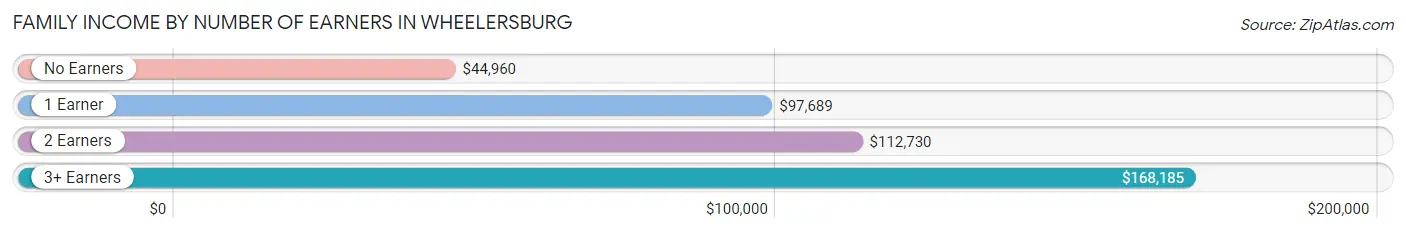
| Number of Earners | # Families | Median Income |
| No Earners | 497 (28.8%) | $44,960 |
| 1 Earner | 497 (28.8%) | $97,689 |
| 2 Earners | 571 (33.1%) | $112,730 |
| 3+ Earners | 159 (9.2%) | $168,185 |
| Total | 1,724 (100.0%) | $90,109 |
Household Income in Wheelersburg
Household Income Brackets in Wheelersburg
With 431 households falling in the category, the $50,000 to $74,999 income range is the most frequent in Wheelersburg, accounting for 17.4% of all households. In contrast, only 15 households (0.6%) fall into the $10,000 to $14,999 income bracket, making it the least populous group.
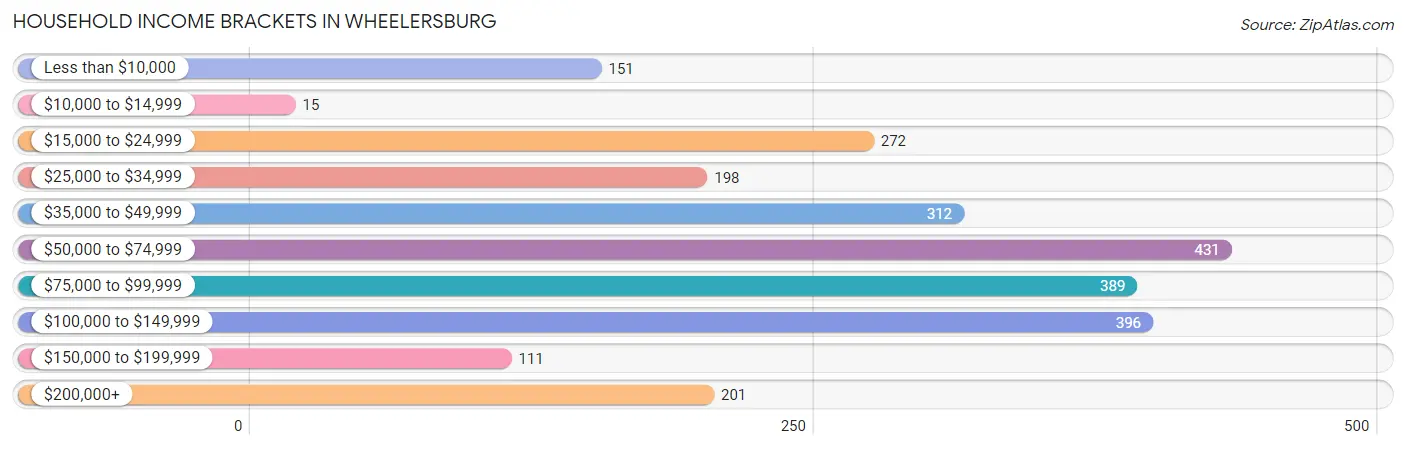
| Income Bracket | # Households | % Households |
| Less than $10,000 | 151 | 6.1% |
| $10,000 to $14,999 | 15 | 0.6% |
| $15,000 to $24,999 | 272 | 11.0% |
| $25,000 to $34,999 | 198 | 8.0% |
| $35,000 to $49,999 | 312 | 12.6% |
| $50,000 to $74,999 | 431 | 17.4% |
| $75,000 to $99,999 | 389 | 15.7% |
| $100,000 to $149,999 | 396 | 16.0% |
| $150,000 to $199,999 | 111 | 4.5% |
| $200,000+ | 201 | 8.1% |
Household Income by Householder Age in Wheelersburg
The median household income in Wheelersburg is $66,683, with the highest median household income of $98,169 found in the 45 to 64 years age bracket for the primary householder. A total of 865 households (34.9%) fall into this category. Meanwhile, the 15 to 24 years age bracket for the primary householder has the lowest median household income of $0, with 62 households (2.5%) in this group.
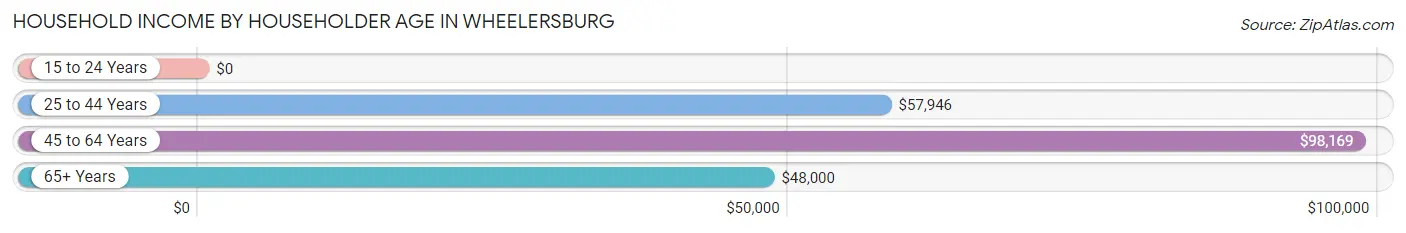
| Income Bracket | # Households | Median Income |
| 15 to 24 Years | 62 (2.5%) | $0 |
| 25 to 44 Years | 874 (35.3%) | $57,946 |
| 45 to 64 Years | 865 (34.9%) | $98,169 |
| 65+ Years | 676 (27.3%) | $48,000 |
| Total | 2,477 (100.0%) | $66,683 |
Poverty in Wheelersburg
Income Below Poverty by Sex and Age in Wheelersburg
With 13.6% poverty level for males and 17.8% for females among the residents of Wheelersburg, 12 to 14 year old males and 5 year old females are the most vulnerable to poverty, with 26 males (100.0%) and 58 females (55.8%) in their respective age groups living below the poverty level.
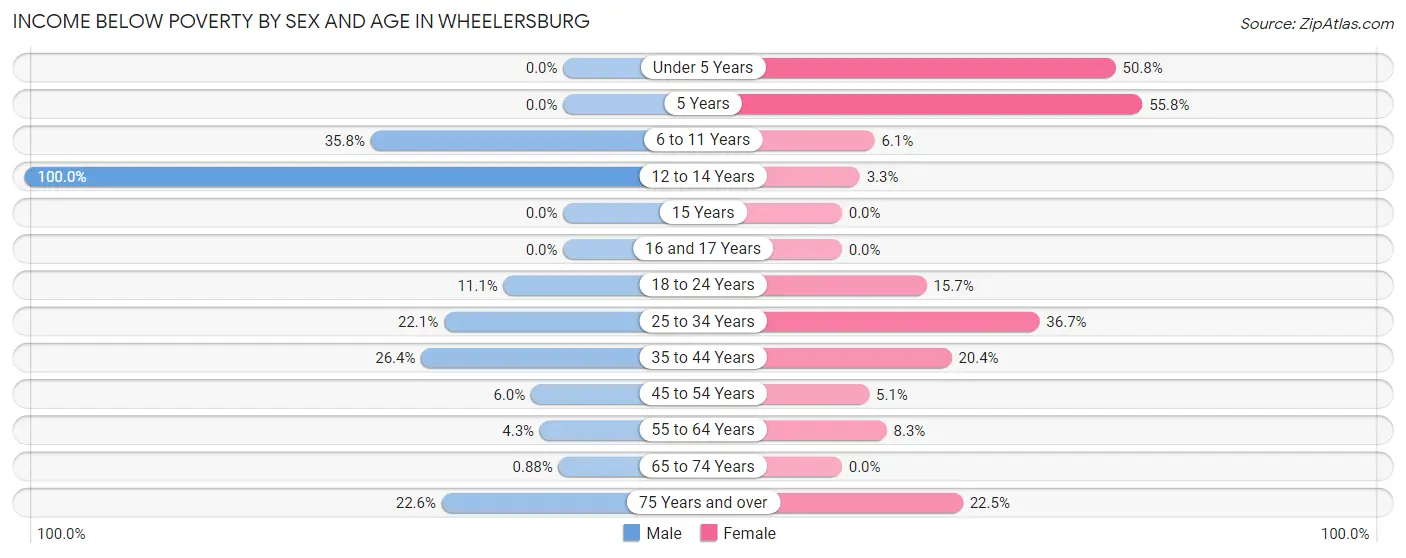
| Age Bracket | Male | Female |
| Under 5 Years | 0 (0.0%) | 124 (50.8%) |
| 5 Years | 0 (0.0%) | 58 (55.8%) |
| 6 to 11 Years | 69 (35.7%) | 16 (6.1%) |
| 12 to 14 Years | 26 (100.0%) | 5 (3.3%) |
| 15 Years | 0 (0.0%) | 0 (0.0%) |
| 16 and 17 Years | 0 (0.0%) | 0 (0.0%) |
| 18 to 24 Years | 32 (11.1%) | 25 (15.7%) |
| 25 to 34 Years | 60 (22.1%) | 168 (36.7%) |
| 35 to 44 Years | 92 (26.4%) | 94 (20.3%) |
| 45 to 54 Years | 18 (6.0%) | 22 (5.1%) |
| 55 to 64 Years | 21 (4.3%) | 42 (8.3%) |
| 65 to 74 Years | 3 (0.9%) | 0 (0.0%) |
| 75 Years and over | 44 (22.6%) | 44 (22.5%) |
| Total | 365 (13.6%) | 598 (17.8%) |
Income Above Poverty by Sex and Age in Wheelersburg
According to the poverty statistics in Wheelersburg, males aged under 5 years and females aged 16 and 17 years are the age groups that are most secure financially, with 100.0% of males and 100.0% of females in these age groups living above the poverty line.
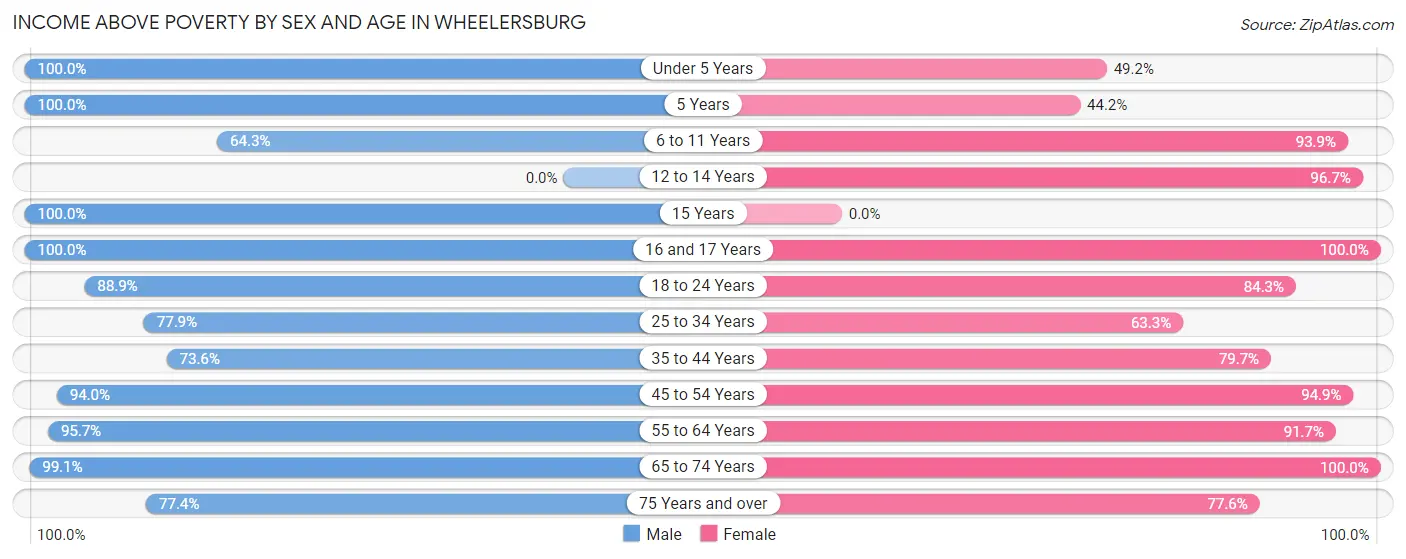
| Age Bracket | Male | Female |
| Under 5 Years | 97 (100.0%) | 120 (49.2%) |
| 5 Years | 29 (100.0%) | 46 (44.2%) |
| 6 to 11 Years | 124 (64.2%) | 247 (93.9%) |
| 12 to 14 Years | 0 (0.0%) | 145 (96.7%) |
| 15 Years | 37 (100.0%) | 0 (0.0%) |
| 16 and 17 Years | 68 (100.0%) | 99 (100.0%) |
| 18 to 24 Years | 256 (88.9%) | 134 (84.3%) |
| 25 to 34 Years | 211 (77.9%) | 290 (63.3%) |
| 35 to 44 Years | 257 (73.6%) | 368 (79.6%) |
| 45 to 54 Years | 283 (94.0%) | 413 (94.9%) |
| 55 to 64 Years | 463 (95.7%) | 463 (91.7%) |
| 65 to 74 Years | 339 (99.1%) | 284 (100.0%) |
| 75 Years and over | 151 (77.4%) | 152 (77.5%) |
| Total | 2,315 (86.4%) | 2,761 (82.2%) |
Income Below Poverty Among Married-Couple Families in Wheelersburg
The poverty statistics for married-couple families in Wheelersburg show that 3.0% or 42 of the total 1,413 families live below the poverty line. Families with no children have the highest poverty rate of 4.4%, comprising of 42 families. On the other hand, families with 1 or 2 children have the lowest poverty rate of 0.0%, which includes 0 families.
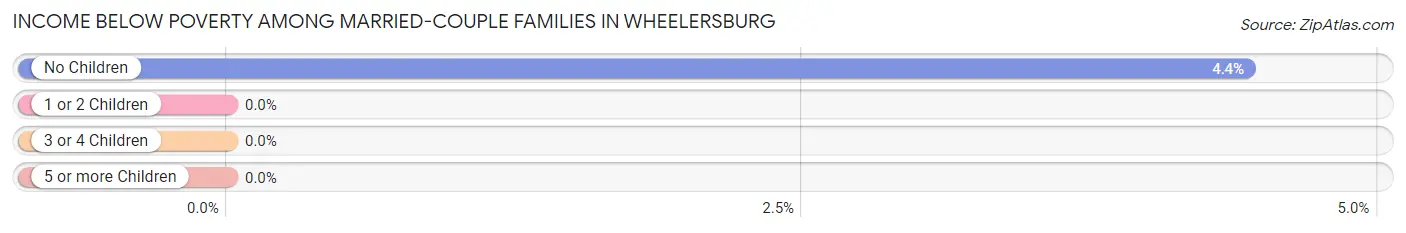
| Children | Above Poverty | Below Poverty |
| No Children | 907 (95.6%) | 42 (4.4%) |
| 1 or 2 Children | 358 (100.0%) | 0 (0.0%) |
| 3 or 4 Children | 100 (100.0%) | 0 (0.0%) |
| 5 or more Children | 6 (100.0%) | 0 (0.0%) |
| Total | 1,371 (97.0%) | 42 (3.0%) |
Income Below Poverty Among Single-Parent Households in Wheelersburg
According to the poverty data in Wheelersburg, 48.0% or 12 single-father households and 48.9% or 140 single-mother households are living below the poverty line. Among single-father households, those with no children have the highest poverty rate, with 10 households (100.0%) experiencing poverty. Likewise, among single-mother households, those with 3 or 4 children have the highest poverty rate, with 71 households (86.6%) falling below the poverty line.
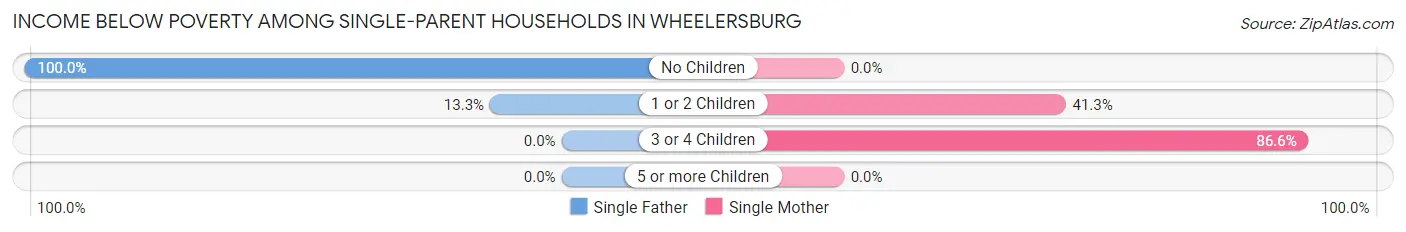
| Children | Single Father | Single Mother |
| No Children | 10 (100.0%) | 0 (0.0%) |
| 1 or 2 Children | 2 (13.3%) | 69 (41.3%) |
| 3 or 4 Children | 0 (0.0%) | 71 (86.6%) |
| 5 or more Children | 0 (0.0%) | 0 (0.0%) |
| Total | 12 (48.0%) | 140 (48.9%) |
Income Below Poverty Among Married-Couple vs Single-Parent Households in Wheelersburg
The poverty data for Wheelersburg shows that 42 of the married-couple family households (3.0%) and 152 of the single-parent households (48.9%) are living below the poverty level. Within the married-couple family households, those with no children have the highest poverty rate, with 42 households (4.4%) falling below the poverty line. Among the single-parent households, those with 3 or 4 children have the highest poverty rate, with 71 household (86.6%) living below poverty.
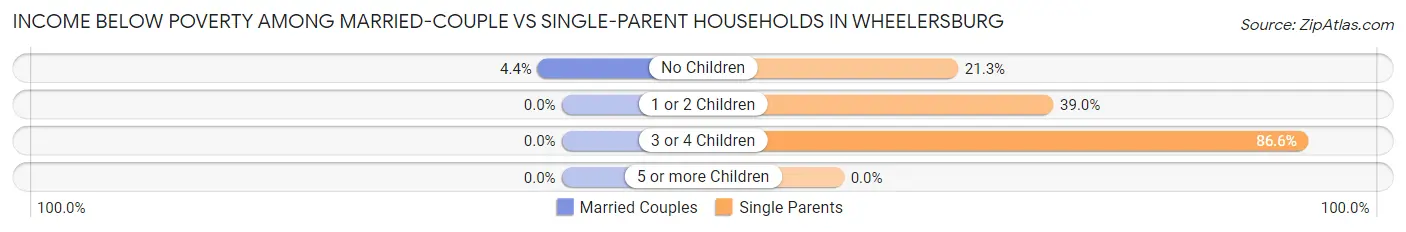
| Children | Married-Couple Families | Single-Parent Households |
| No Children | 42 (4.4%) | 10 (21.3%) |
| 1 or 2 Children | 0 (0.0%) | 71 (39.0%) |
| 3 or 4 Children | 0 (0.0%) | 71 (86.6%) |
| 5 or more Children | 0 (0.0%) | 0 (0.0%) |
| Total | 42 (3.0%) | 152 (48.9%) |
Race in Wheelersburg
The most populous races in Wheelersburg are White / Caucasian (6,066 | 97.6%), Two or more Races (101 | 1.6%), and Hispanic or Latino (48 | 0.8%).
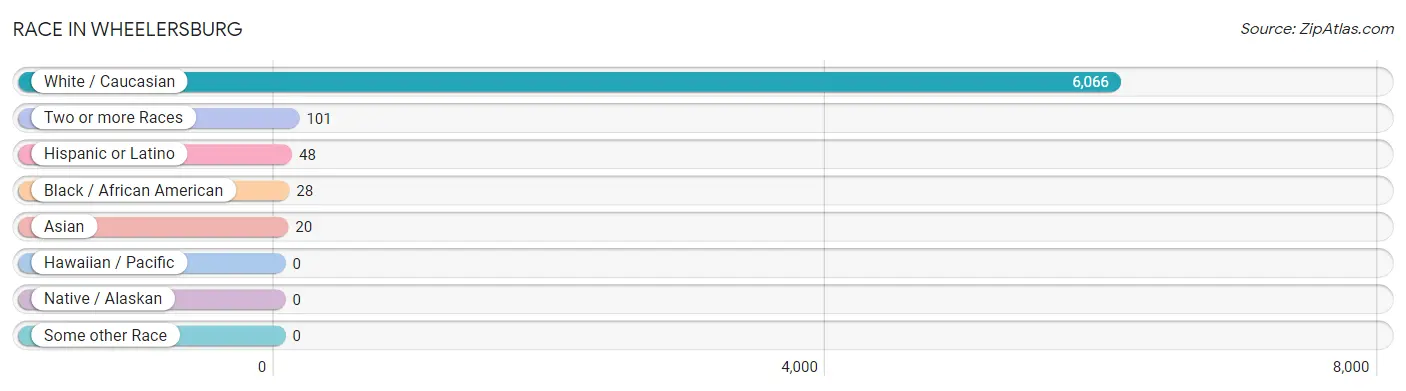
| Race | # Population | % Population |
| Asian | 20 | 0.3% |
| Black / African American | 28 | 0.4% |
| Hawaiian / Pacific | 0 | 0.0% |
| Hispanic or Latino | 48 | 0.8% |
| Native / Alaskan | 0 | 0.0% |
| White / Caucasian | 6,066 | 97.6% |
| Two or more Races | 101 | 1.6% |
| Some other Race | 0 | 0.0% |
| Total | 6,215 | 100.0% |
Ancestry in Wheelersburg
The most populous ancestries reported in Wheelersburg are German (744 | 12.0%), American (711 | 11.4%), Irish (678 | 10.9%), English (511 | 8.2%), and European (403 | 6.5%), together accounting for 49.0% of all Wheelersburg residents.
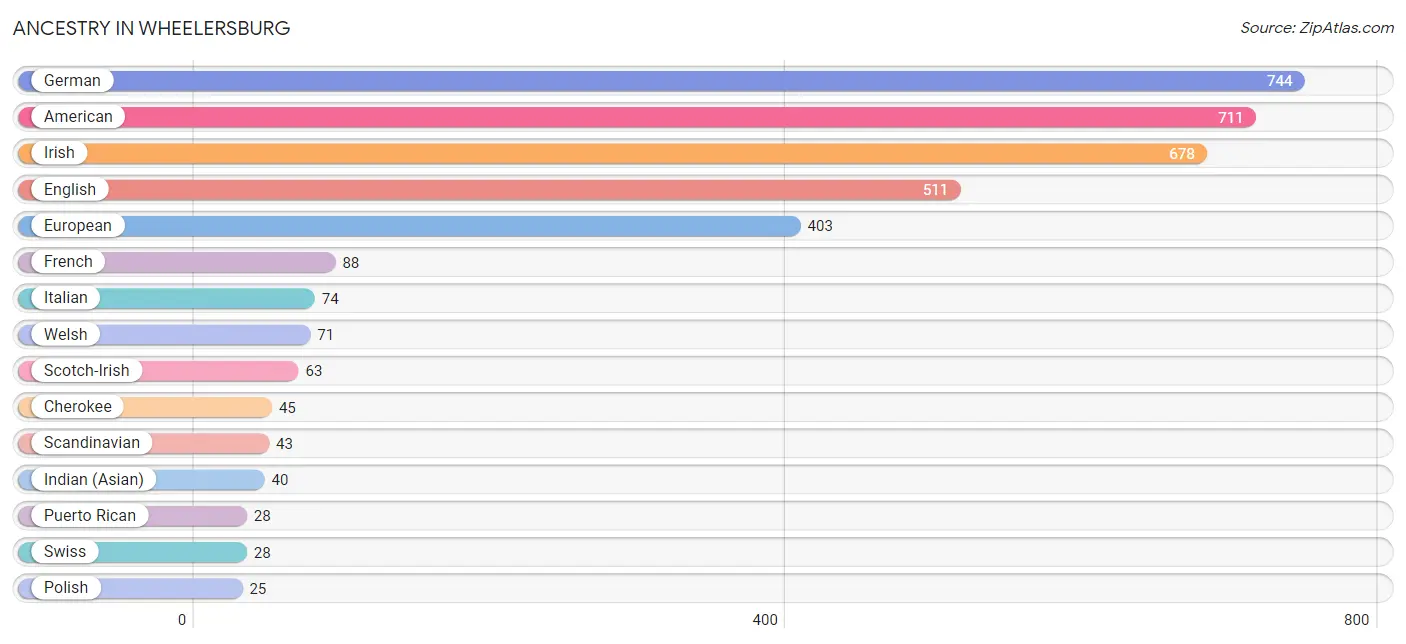
| Ancestry | # Population | % Population |
| American | 711 | 11.4% |
| Blackfeet | 16 | 0.3% |
| British | 15 | 0.2% |
| Cherokee | 45 | 0.7% |
| Dutch | 12 | 0.2% |
| English | 511 | 8.2% |
| European | 403 | 6.5% |
| French | 88 | 1.4% |
| German | 744 | 12.0% |
| Hungarian | 12 | 0.2% |
| Indian (Asian) | 40 | 0.6% |
| Irish | 678 | 10.9% |
| Italian | 74 | 1.2% |
| Mexican | 20 | 0.3% |
| Norwegian | 16 | 0.3% |
| Polish | 25 | 0.4% |
| Puerto Rican | 28 | 0.4% |
| Scandinavian | 43 | 0.7% |
| Scotch-Irish | 63 | 1.0% |
| Scottish | 23 | 0.4% |
| Slovak | 3 | 0.1% |
| Swiss | 28 | 0.4% |
| Welsh | 71 | 1.1% | View All 23 Rows |
Immigrants in Wheelersburg
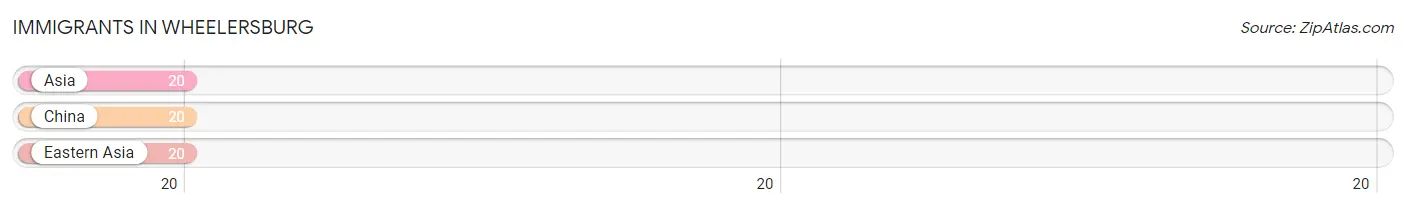
The most numerous immigrant groups reported in Wheelersburg came from Asia (20 | 0.3%), China (20 | 0.3%), and Eastern Asia (20 | 0.3%), together accounting for 1.0% of all Wheelersburg residents.
| Immigration Origin | # Population | % Population |
| Asia | 20 | 0.3% |
| China | 20 | 0.3% |
| Eastern Asia | 20 | 0.3% | View All 3 Rows |
Sex and Age in Wheelersburg
Sex and Age in Wheelersburg
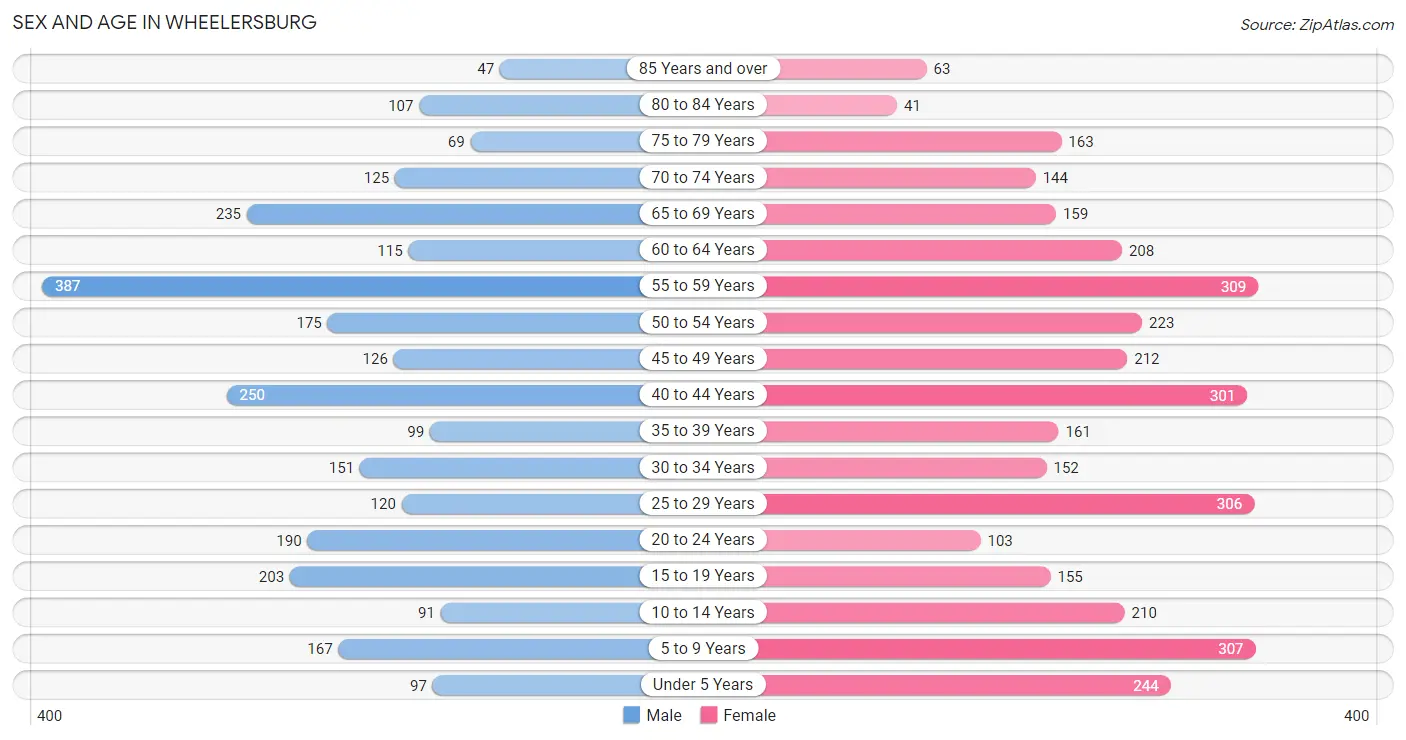
The most populous age groups in Wheelersburg are 55 to 59 Years (387 | 14.1%) for men and 55 to 59 Years (309 | 8.9%) for women.
| Age Bracket | Male | Female |
| Under 5 Years | 97 (3.5%) | 244 (7.0%) |
| 5 to 9 Years | 167 (6.1%) | 307 (8.9%) |
| 10 to 14 Years | 91 (3.3%) | 210 (6.1%) |
| 15 to 19 Years | 203 (7.4%) | 155 (4.5%) |
| 20 to 24 Years | 190 (6.9%) | 103 (3.0%) |
| 25 to 29 Years | 120 (4.4%) | 306 (8.8%) |
| 30 to 34 Years | 151 (5.5%) | 152 (4.4%) |
| 35 to 39 Years | 99 (3.6%) | 161 (4.6%) |
| 40 to 44 Years | 250 (9.1%) | 301 (8.7%) |
| 45 to 49 Years | 126 (4.6%) | 212 (6.1%) |
| 50 to 54 Years | 175 (6.4%) | 223 (6.4%) |
| 55 to 59 Years | 387 (14.1%) | 309 (8.9%) |
| 60 to 64 Years | 115 (4.2%) | 208 (6.0%) |
| 65 to 69 Years | 235 (8.5%) | 159 (4.6%) |
| 70 to 74 Years | 125 (4.5%) | 144 (4.2%) |
| 75 to 79 Years | 69 (2.5%) | 163 (4.7%) |
| 80 to 84 Years | 107 (3.9%) | 41 (1.2%) |
| 85 Years and over | 47 (1.7%) | 63 (1.8%) |
| Total | 2,754 (100.0%) | 3,461 (100.0%) |
Families and Households in Wheelersburg
Median Family Size in Wheelersburg
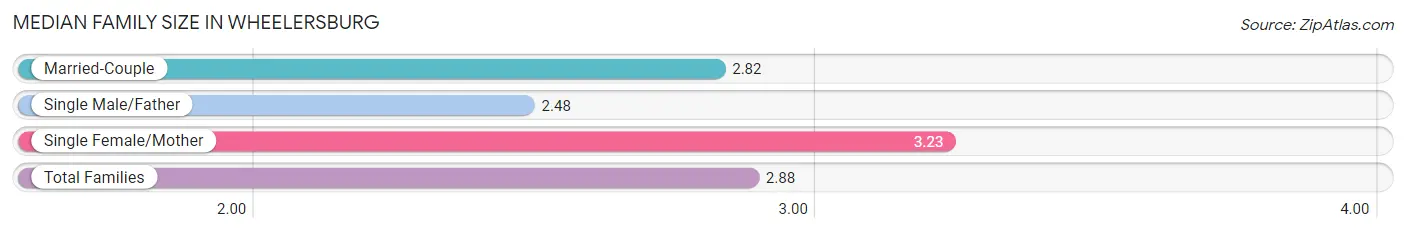
The median family size in Wheelersburg is 2.88 persons per family, with single female/mother families (286 | 16.6%) accounting for the largest median family size of 3.23 persons per family. On the other hand, single male/father families (25 | 1.5%) represent the smallest median family size with 2.48 persons per family.
| Family Type | # Families | Family Size |
| Married-Couple | 1,413 (82.0%) | 2.82 |
| Single Male/Father | 25 (1.5%) | 2.48 |
| Single Female/Mother | 286 (16.6%) | 3.23 |
| Total Families | 1,724 (100.0%) | 2.88 |
Median Household Size in Wheelersburg
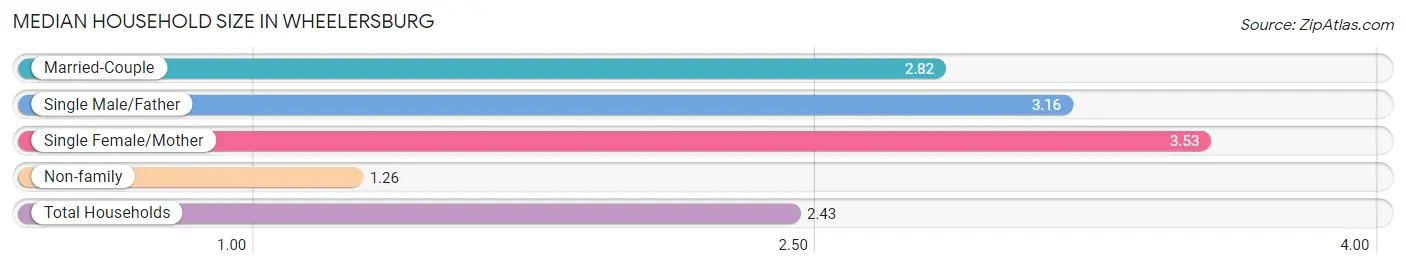
The median household size in Wheelersburg is 2.43 persons per household, with single female/mother households (286 | 11.6%) accounting for the largest median household size of 3.53 persons per household. non-family households (753 | 30.4%) represent the smallest median household size with 1.26 persons per household.
| Household Type | # Households | Household Size |
| Married-Couple | 1,413 (57.0%) | 2.82 |
| Single Male/Father | 25 (1.0%) | 3.16 |
| Single Female/Mother | 286 (11.6%) | 3.53 |
| Non-family | 753 (30.4%) | 1.26 |
| Total Households | 2,477 (100.0%) | 2.43 |
Household Size by Marriage Status in Wheelersburg
Out of a total of 2,477 households in Wheelersburg, 1,724 (69.6%) are family households, while 753 (30.4%) are nonfamily households. The most numerous type of family households are 2-person households, comprising 880, and the most common type of nonfamily households are 1-person households, comprising 621.
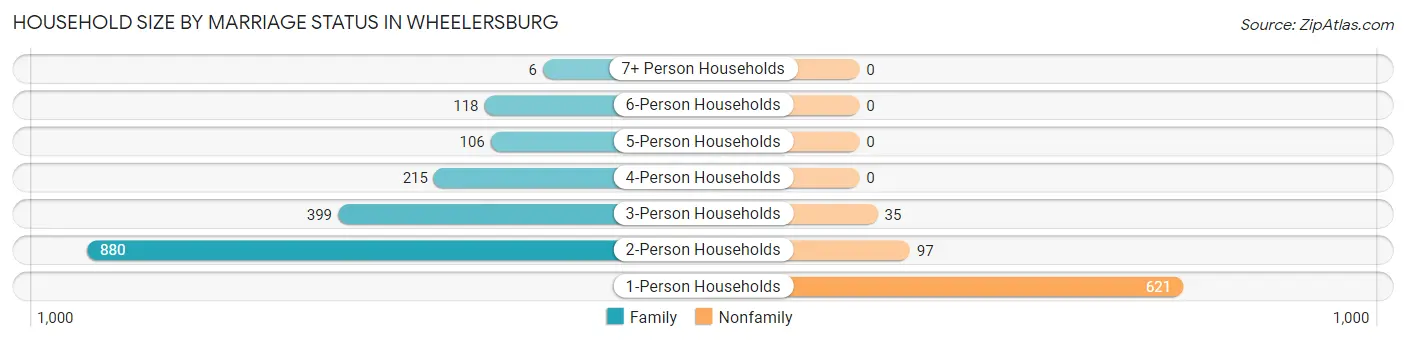
| Household Size | Family Households | Nonfamily Households |
| 1-Person Households | - | 621 (25.1%) |
| 2-Person Households | 880 (35.5%) | 97 (3.9%) |
| 3-Person Households | 399 (16.1%) | 35 (1.4%) |
| 4-Person Households | 215 (8.7%) | 0 (0.0%) |
| 5-Person Households | 106 (4.3%) | 0 (0.0%) |
| 6-Person Households | 118 (4.8%) | 0 (0.0%) |
| 7+ Person Households | 6 (0.2%) | 0 (0.0%) |
| Total | 1,724 (69.6%) | 753 (30.4%) |
Female Fertility in Wheelersburg
Fertility by Age in Wheelersburg
Average fertility rate in Wheelersburg is 86.0 births per 1,000 women. Women in the age bracket of 20 to 34 years have the highest fertility rate with 219.0 births per 1,000 women. Women in the age bracket of 20 to 34 years acount for 100.0% of all women with births.
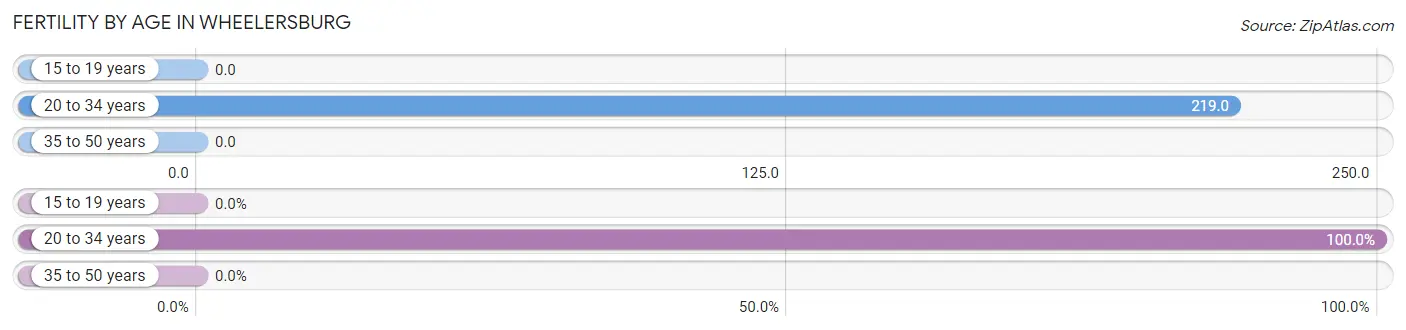
| Age Bracket | Women with Births | Births / 1,000 Women |
| 15 to 19 years | 0 (0.0%) | 0.0 |
| 20 to 34 years | 123 (100.0%) | 219.0 |
| 35 to 50 years | 0 (0.0%) | 0.0 |
| Total | 123 (100.0%) | 86.0 |
Fertility by Age by Marriage Status in Wheelersburg
35.8% of women with births (123) in Wheelersburg are married. The highest percentage of unmarried women with births falls into 20 to 34 years age bracket with 64.2% of them unmarried at the time of birth, while the lowest percentage of unmarried women with births belong to 20 to 34 years age bracket with 64.2% of them unmarried.
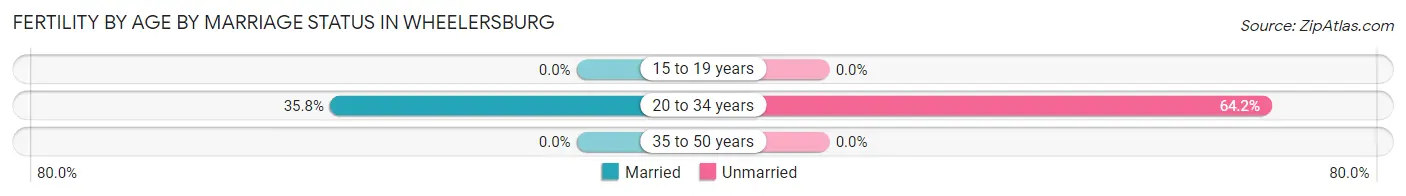
| Age Bracket | Married | Unmarried |
| 15 to 19 years | 0 (0.0%) | 0 (0.0%) |
| 20 to 34 years | 44 (35.8%) | 79 (64.2%) |
| 35 to 50 years | 0 (0.0%) | 0 (0.0%) |
| Total | 44 (35.8%) | 79 (64.2%) |
Fertility by Education in Wheelersburg
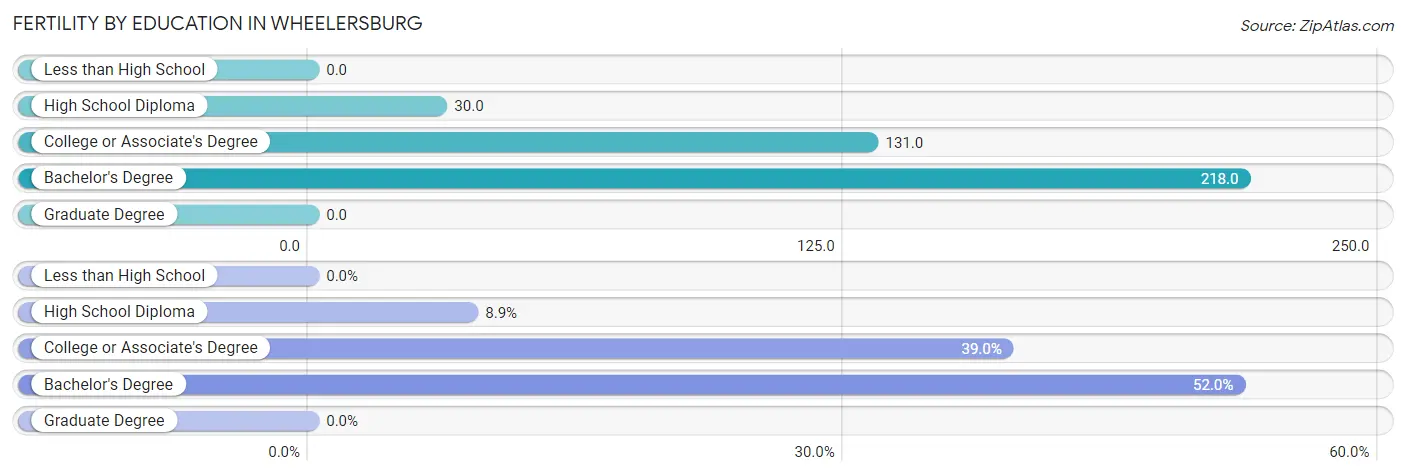
| Educational Attainment | Women with Births | Births / 1,000 Women |
| Less than High School | 0 (0.0%) | 0.0 |
| High School Diploma | 11 (8.9%) | 30.0 |
| College or Associate's Degree | 48 (39.0%) | 131.0 |
| Bachelor's Degree | 64 (52.0%) | 218.0 |
| Graduate Degree | 0 (0.0%) | 0.0 |
| Total | 123 (100.0%) | 86.0 |
Fertility by Education by Marriage Status in Wheelersburg
64.2% of women with births in Wheelersburg are unmarried. Women with the educational attainment of high school diploma are most likely to be married with 100.0% of them married at childbirth, while women with the educational attainment of college or associate's degree are least likely to be married with 97.9% of them unmarried at childbirth.
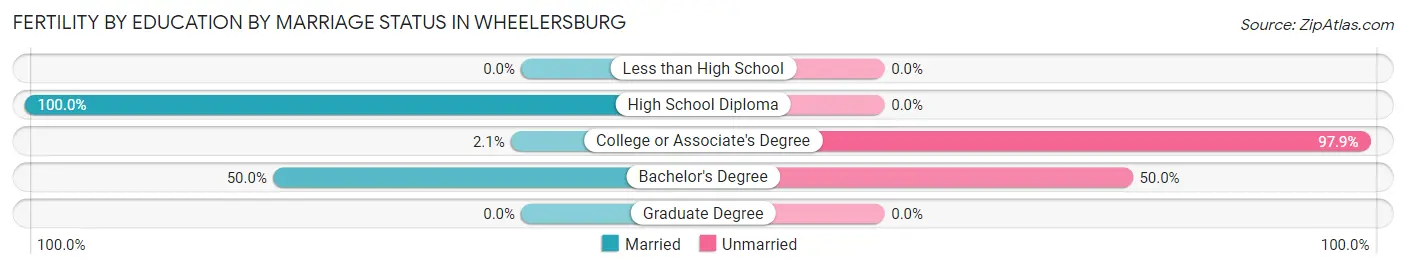
| Educational Attainment | Married | Unmarried |
| Less than High School | 0 (0.0%) | 0 (0.0%) |
| High School Diploma | 11 (100.0%) | 0 (0.0%) |
| College or Associate's Degree | 1 (2.1%) | 47 (97.9%) |
| Bachelor's Degree | 32 (50.0%) | 32 (50.0%) |
| Graduate Degree | 0 (0.0%) | 0 (0.0%) |
| Total | 44 (35.8%) | 79 (64.2%) |
Employment Characteristics in Wheelersburg
Employment by Class of Employer in Wheelersburg
Among the 2,619 employed individuals in Wheelersburg, private company employees (1,414 | 54.0%), state government employees (340 | 13.0%), and not-for-profit organizations (259 | 9.9%) make up the most common classes of employment.
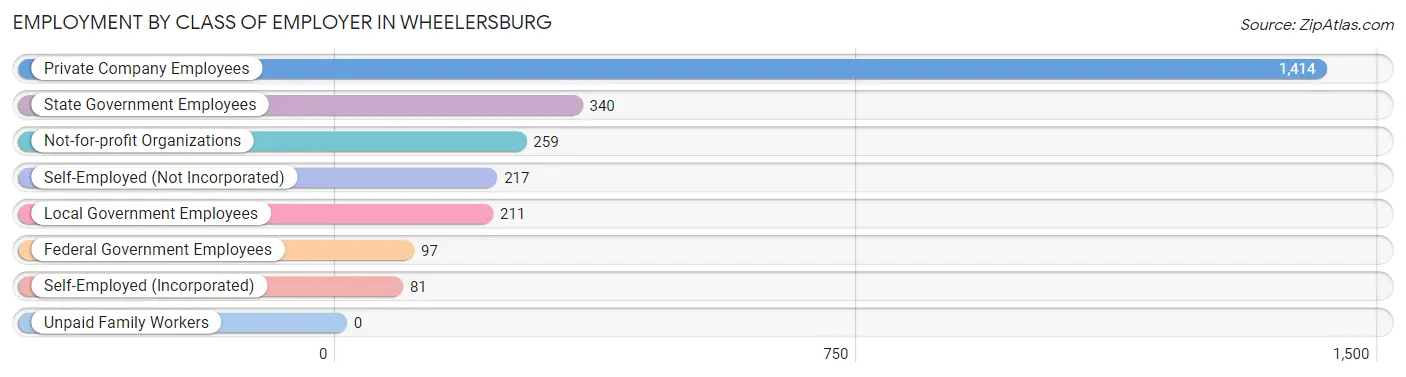
| Employer Class | # Employees | % Employees |
| Private Company Employees | 1,414 | 54.0% |
| Self-Employed (Incorporated) | 81 | 3.1% |
| Self-Employed (Not Incorporated) | 217 | 8.3% |
| Not-for-profit Organizations | 259 | 9.9% |
| Local Government Employees | 211 | 8.1% |
| State Government Employees | 340 | 13.0% |
| Federal Government Employees | 97 | 3.7% |
| Unpaid Family Workers | 0 | 0.0% |
| Total | 2,619 | 100.0% |
Employment Status by Age in Wheelersburg
According to the labor force statistics for Wheelersburg, out of the total population over 16 years of age (5,062), 55.8% or 2,825 individuals are in the labor force, with 7.3% or 206 of them unemployed. The age group with the highest labor force participation rate is 20 to 24 years, with 94.5% or 277 individuals in the labor force. Within the labor force, the 30 to 34 years age range has the highest percentage of unemployed individuals, with 27.1% or 57 of them being unemployed.
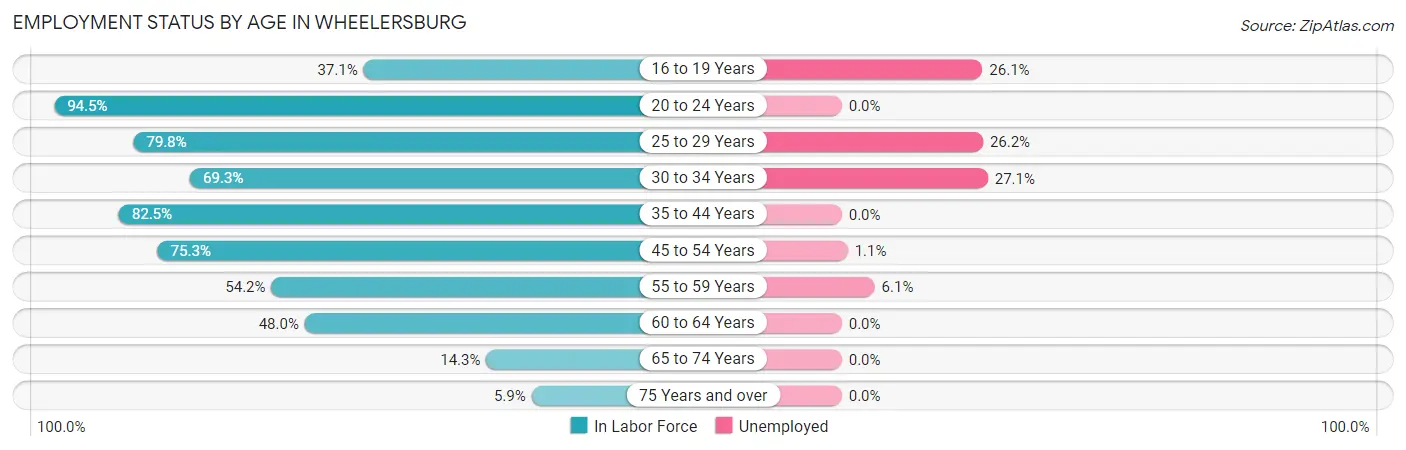
| Age Bracket | In Labor Force | Unemployed |
| 16 to 19 Years | 119 (37.1%) | 31 (26.1%) |
| 20 to 24 Years | 277 (94.5%) | 0 (0.0%) |
| 25 to 29 Years | 340 (79.8%) | 89 (26.2%) |
| 30 to 34 Years | 210 (69.3%) | 57 (27.1%) |
| 35 to 44 Years | 669 (82.5%) | 0 (0.0%) |
| 45 to 54 Years | 554 (75.3%) | 6 (1.1%) |
| 55 to 59 Years | 377 (54.2%) | 23 (6.1%) |
| 60 to 64 Years | 155 (48.0%) | 0 (0.0%) |
| 65 to 74 Years | 95 (14.3%) | 0 (0.0%) |
| 75 Years and over | 29 (5.9%) | 0 (0.0%) |
| Total | 2,825 (55.8%) | 206 (7.3%) |
Employment Status by Educational Attainment in Wheelersburg
According to labor force statistics for Wheelersburg, 70.0% of individuals (2,306) out of the total population between 25 and 64 years of age (3,295) are in the labor force, with 7.6% or 175 of them being unemployed. The group with the highest labor force participation rate are those with the educational attainment of bachelor's degree or higher, with 78.9% or 1,019 individuals in the labor force. Within the labor force, individuals with less than high school education have the highest percentage of unemployment, with 19.8% or 23 of them being unemployed.
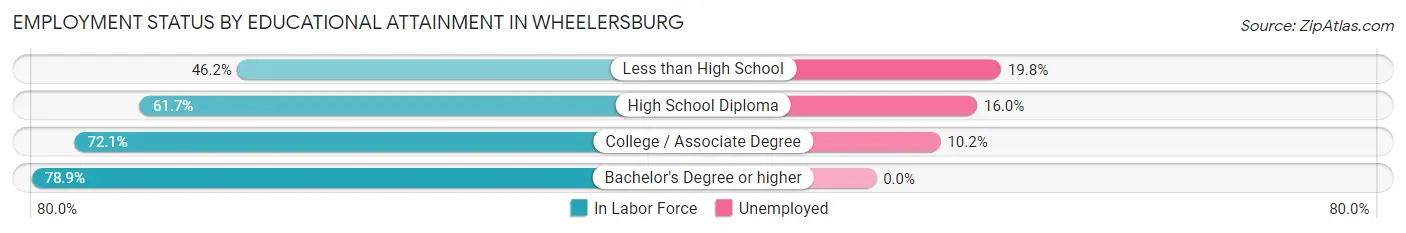
| Educational Attainment | In Labor Force | Unemployed |
| Less than High School | 116 (46.2%) | 50 (19.8%) |
| High School Diploma | 555 (61.7%) | 144 (16.0%) |
| College / Associate Degree | 615 (72.1%) | 87 (10.2%) |
| Bachelor's Degree or higher | 1,019 (78.9%) | 0 (0.0%) |
| Total | 2,306 (70.0%) | 250 (7.6%) |
Employment Occupations by Sex in Wheelersburg
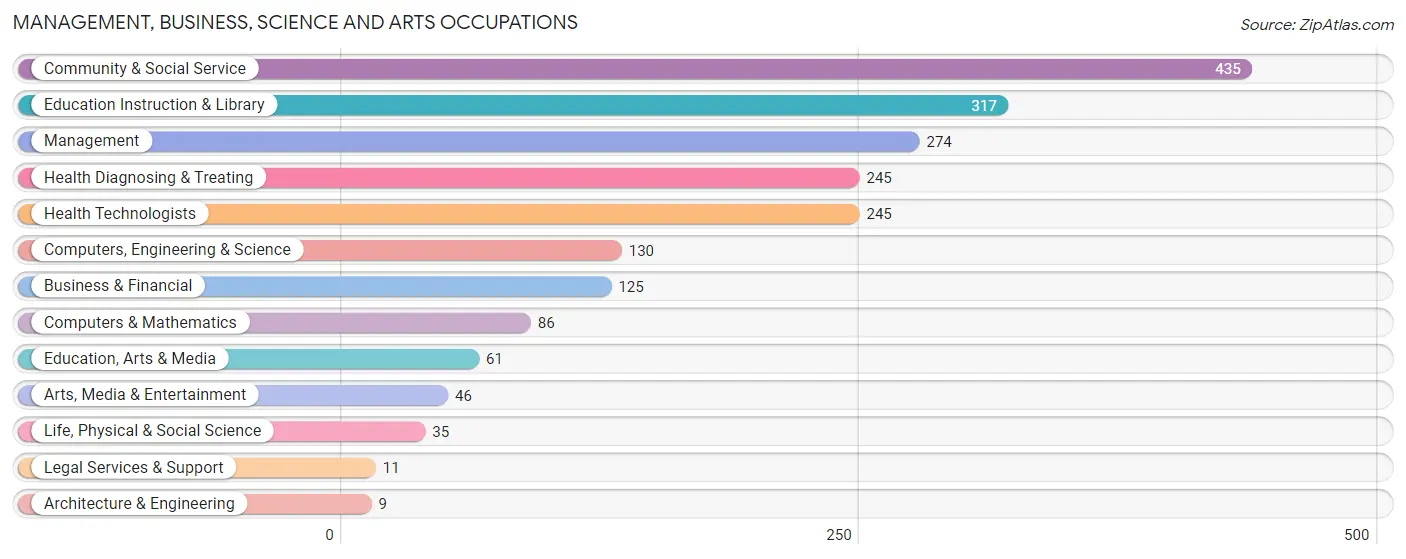
Management, Business, Science and Arts Occupations
The most common Management, Business, Science and Arts occupations in Wheelersburg are Community & Social Service (435 | 16.6%), Education Instruction & Library (317 | 12.1%), Management (274 | 10.5%), Health Diagnosing & Treating (245 | 9.3%), and Health Technologists (245 | 9.3%).
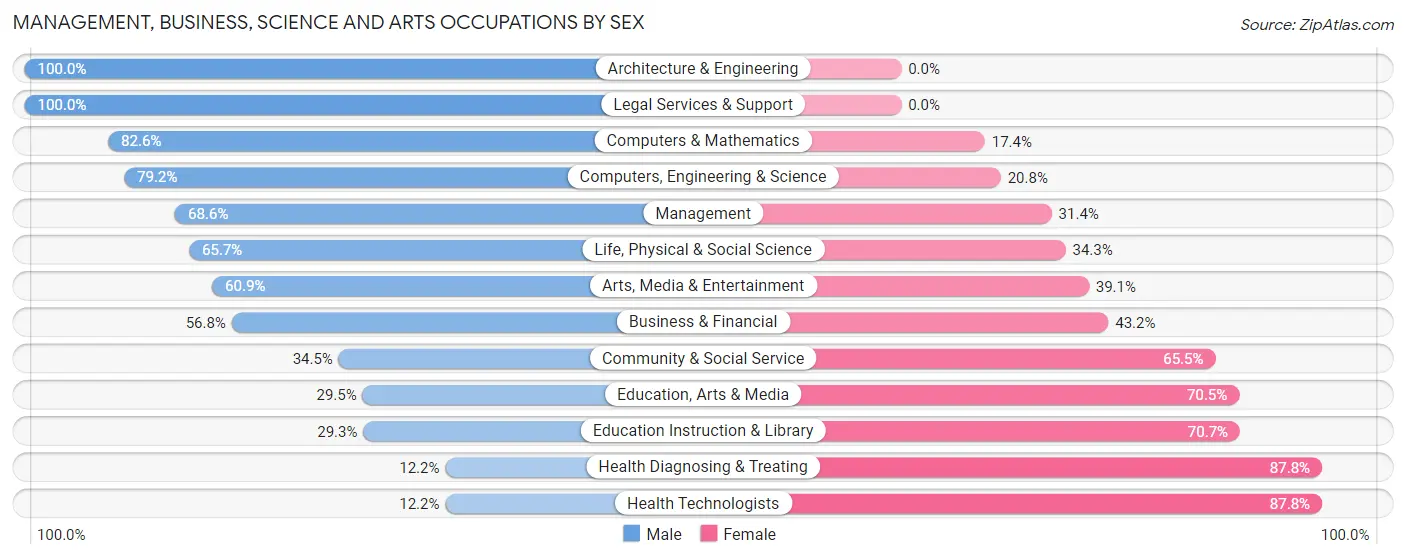
Management, Business, Science and Arts Occupations by Sex
Within the Management, Business, Science and Arts occupations in Wheelersburg, the most male-oriented occupations are Architecture & Engineering (100.0%), Legal Services & Support (100.0%), and Computers & Mathematics (82.6%), while the most female-oriented occupations are Health Diagnosing & Treating (87.8%), Health Technologists (87.8%), and Education Instruction & Library (70.7%).
| Occupation | Male | Female |
| Management | 188 (68.6%) | 86 (31.4%) |
| Business & Financial | 71 (56.8%) | 54 (43.2%) |
| Computers, Engineering & Science | 103 (79.2%) | 27 (20.8%) |
| Computers & Mathematics | 71 (82.6%) | 15 (17.4%) |
| Architecture & Engineering | 9 (100.0%) | 0 (0.0%) |
| Life, Physical & Social Science | 23 (65.7%) | 12 (34.3%) |
| Community & Social Service | 150 (34.5%) | 285 (65.5%) |
| Education, Arts & Media | 18 (29.5%) | 43 (70.5%) |
| Legal Services & Support | 11 (100.0%) | 0 (0.0%) |
| Education Instruction & Library | 93 (29.3%) | 224 (70.7%) |
| Arts, Media & Entertainment | 28 (60.9%) | 18 (39.1%) |
| Health Diagnosing & Treating | 30 (12.2%) | 215 (87.8%) |
| Health Technologists | 30 (12.2%) | 215 (87.8%) |
| Total (Category) | 542 (44.8%) | 667 (55.2%) |
| Total (Overall) | 1,238 (47.3%) | 1,381 (52.7%) |
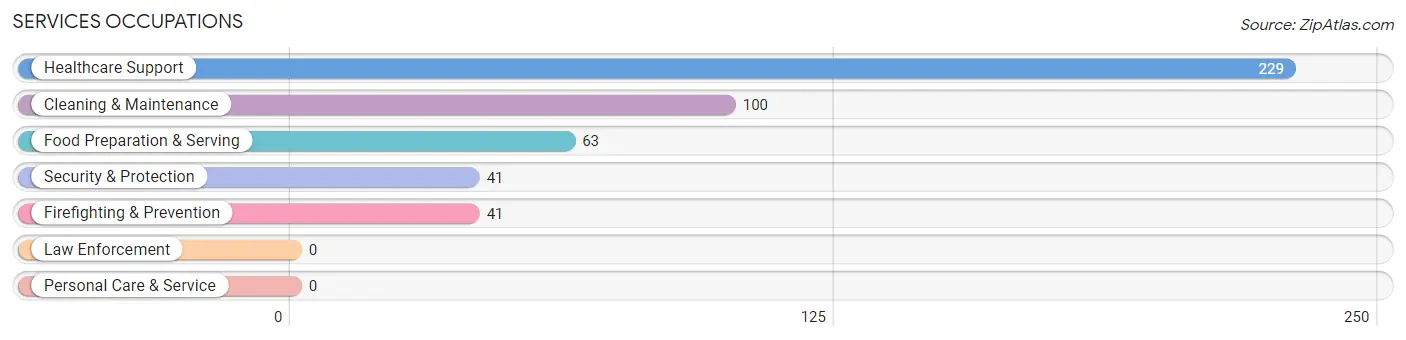
Services Occupations
The most common Services occupations in Wheelersburg are Healthcare Support (229 | 8.7%), Cleaning & Maintenance (100 | 3.8%), Food Preparation & Serving (63 | 2.4%), Security & Protection (41 | 1.6%), and Firefighting & Prevention (41 | 1.6%).
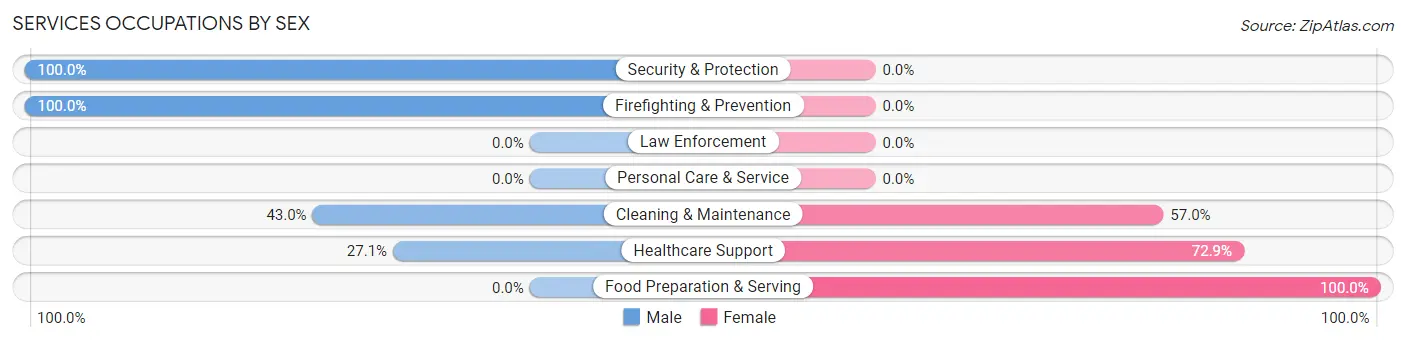
Services Occupations by Sex
Within the Services occupations in Wheelersburg, the most male-oriented occupations are Security & Protection (100.0%), Firefighting & Prevention (100.0%), and Cleaning & Maintenance (43.0%), while the most female-oriented occupations are Food Preparation & Serving (100.0%), Healthcare Support (72.9%), and Cleaning & Maintenance (57.0%).
| Occupation | Male | Female |
| Healthcare Support | 62 (27.1%) | 167 (72.9%) |
| Security & Protection | 41 (100.0%) | 0 (0.0%) |
| Firefighting & Prevention | 41 (100.0%) | 0 (0.0%) |
| Law Enforcement | 0 (0.0%) | 0 (0.0%) |
| Food Preparation & Serving | 0 (0.0%) | 63 (100.0%) |
| Cleaning & Maintenance | 43 (43.0%) | 57 (57.0%) |
| Personal Care & Service | 0 (0.0%) | 0 (0.0%) |
| Total (Category) | 146 (33.7%) | 287 (66.3%) |
| Total (Overall) | 1,238 (47.3%) | 1,381 (52.7%) |
Sales and Office Occupations
The most common Sales and Office occupations in Wheelersburg are Office & Administration (269 | 10.3%), and Sales & Related (178 | 6.8%).
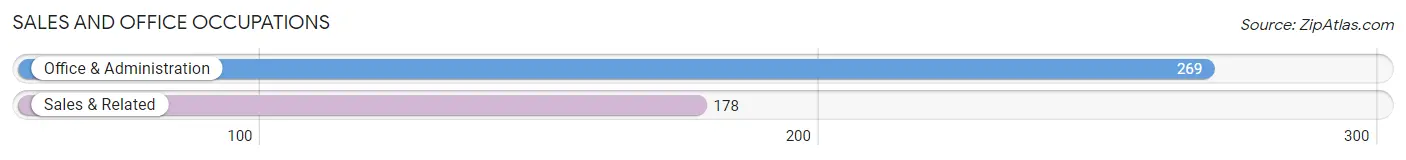
Sales and Office Occupations by Sex
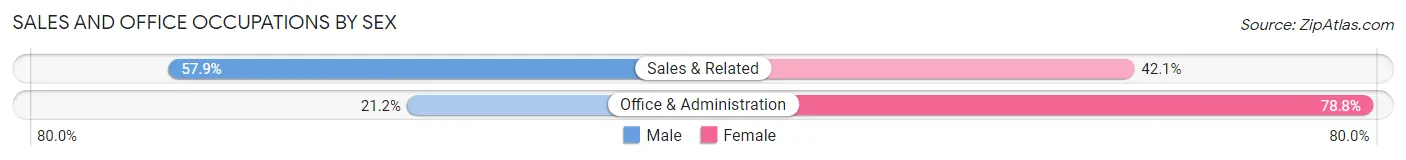
| Occupation | Male | Female |
| Sales & Related | 103 (57.9%) | 75 (42.1%) |
| Office & Administration | 57 (21.2%) | 212 (78.8%) |
| Total (Category) | 160 (35.8%) | 287 (64.2%) |
| Total (Overall) | 1,238 (47.3%) | 1,381 (52.7%) |
Natural Resources, Construction and Maintenance Occupations
The most common Natural Resources, Construction and Maintenance occupations in Wheelersburg are Construction & Extraction (81 | 3.1%), and Installation, Maintenance & Repair (26 | 1.0%).
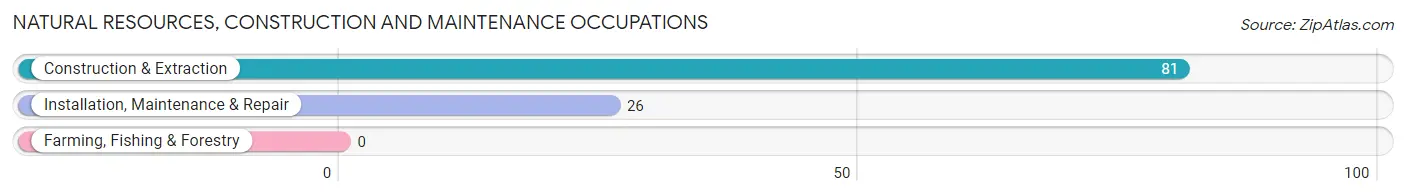
Natural Resources, Construction and Maintenance Occupations by Sex
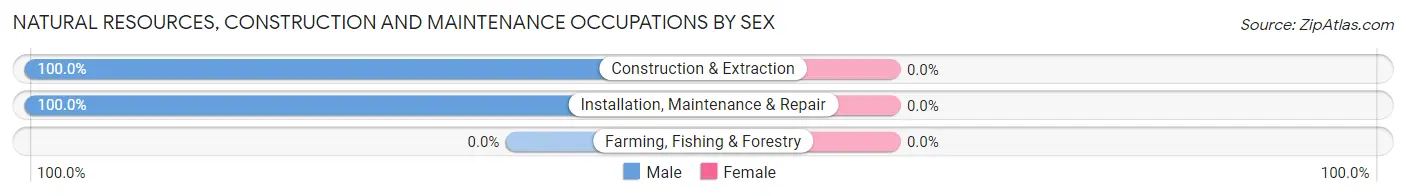
| Occupation | Male | Female |
| Farming, Fishing & Forestry | 0 (0.0%) | 0 (0.0%) |
| Construction & Extraction | 81 (100.0%) | 0 (0.0%) |
| Installation, Maintenance & Repair | 26 (100.0%) | 0 (0.0%) |
| Total (Category) | 107 (100.0%) | 0 (0.0%) |
| Total (Overall) | 1,238 (47.3%) | 1,381 (52.7%) |
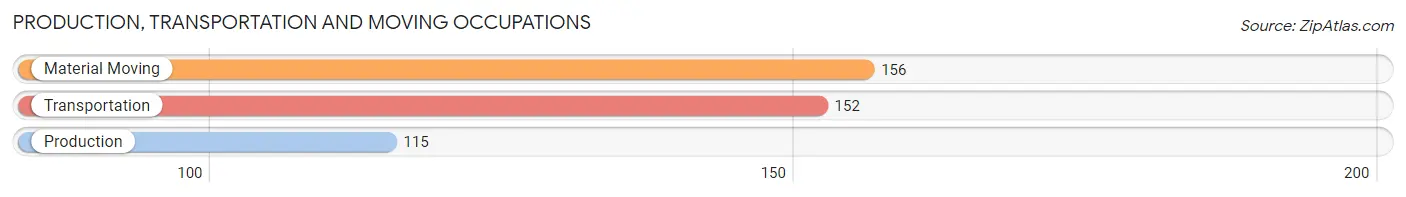
Production, Transportation and Moving Occupations
The most common Production, Transportation and Moving occupations in Wheelersburg are Material Moving (156 | 6.0%), Transportation (152 | 5.8%), and Production (115 | 4.4%).
Production, Transportation and Moving Occupations by Sex
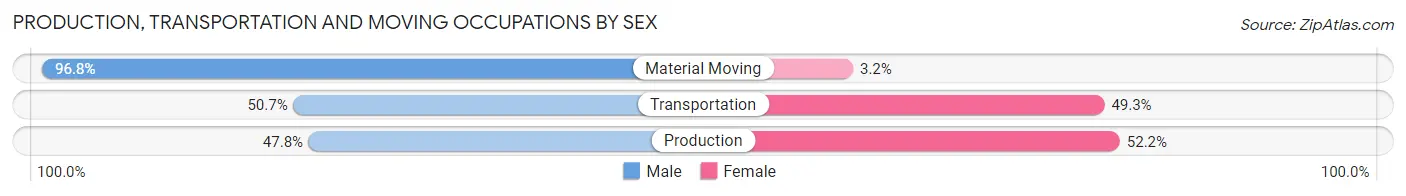
| Occupation | Male | Female |
| Production | 55 (47.8%) | 60 (52.2%) |
| Transportation | 77 (50.7%) | 75 (49.3%) |
| Material Moving | 151 (96.8%) | 5 (3.2%) |
| Total (Category) | 283 (66.9%) | 140 (33.1%) |
| Total (Overall) | 1,238 (47.3%) | 1,381 (52.7%) |
Employment Industries by Sex in Wheelersburg
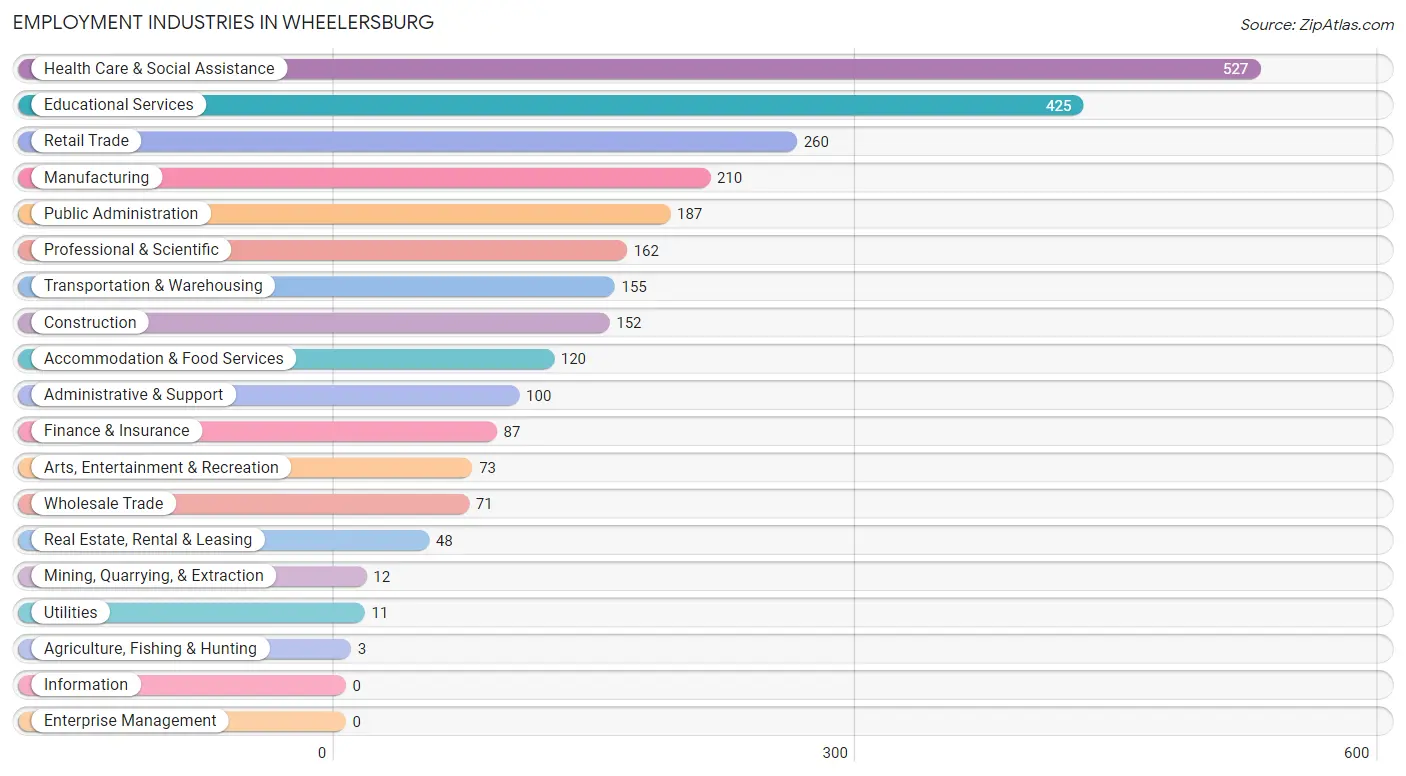
Employment Industries in Wheelersburg
The major employment industries in Wheelersburg include Health Care & Social Assistance (527 | 20.1%), Educational Services (425 | 16.2%), Retail Trade (260 | 9.9%), Manufacturing (210 | 8.0%), and Public Administration (187 | 7.1%).
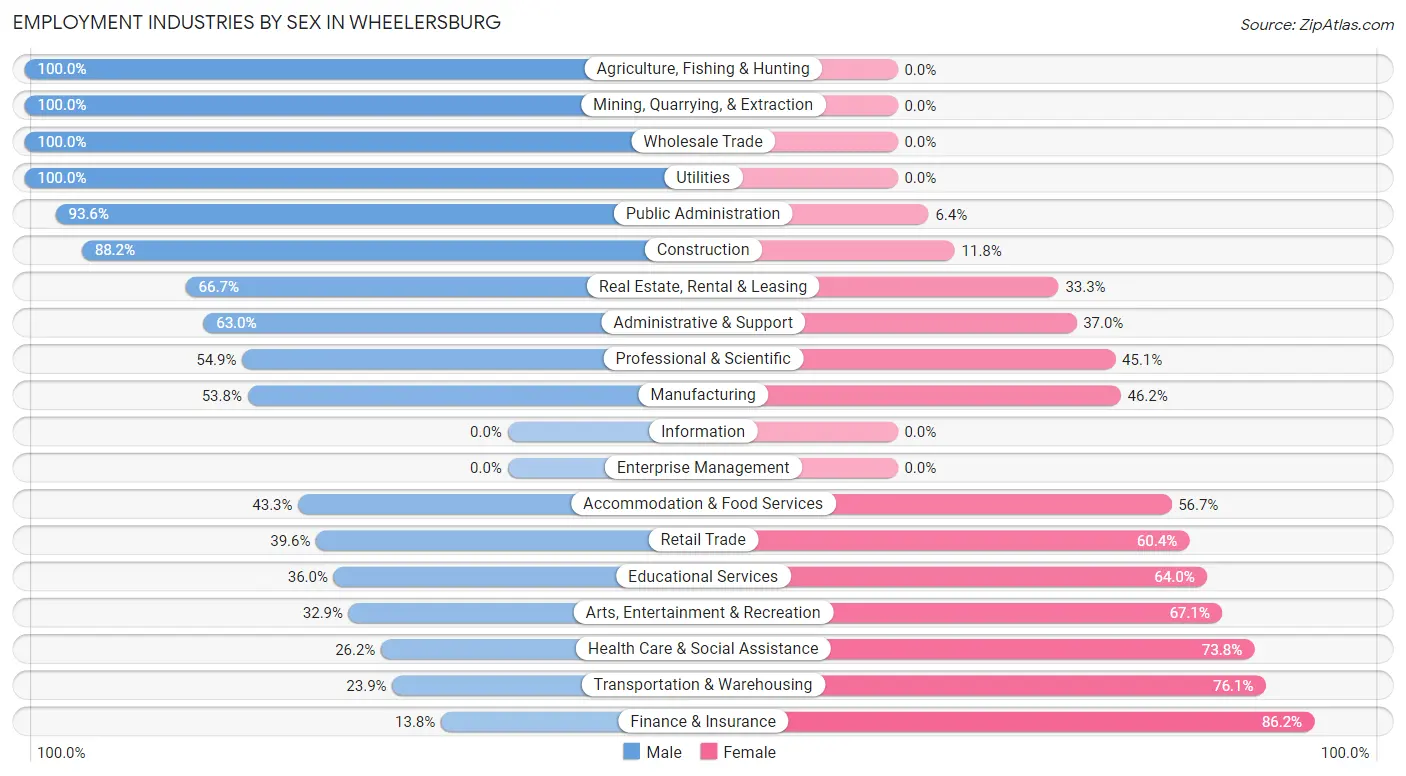
Employment Industries by Sex in Wheelersburg
The Wheelersburg industries that see more men than women are Agriculture, Fishing & Hunting (100.0%), Mining, Quarrying, & Extraction (100.0%), and Wholesale Trade (100.0%), whereas the industries that tend to have a higher number of women are Finance & Insurance (86.2%), Transportation & Warehousing (76.1%), and Health Care & Social Assistance (73.8%).
| Industry | Male | Female |
| Agriculture, Fishing & Hunting | 3 (100.0%) | 0 (0.0%) |
| Mining, Quarrying, & Extraction | 12 (100.0%) | 0 (0.0%) |
| Construction | 134 (88.2%) | 18 (11.8%) |
| Manufacturing | 113 (53.8%) | 97 (46.2%) |
| Wholesale Trade | 71 (100.0%) | 0 (0.0%) |
| Retail Trade | 103 (39.6%) | 157 (60.4%) |
| Transportation & Warehousing | 37 (23.9%) | 118 (76.1%) |
| Utilities | 11 (100.0%) | 0 (0.0%) |
| Information | 0 (0.0%) | 0 (0.0%) |
| Finance & Insurance | 12 (13.8%) | 75 (86.2%) |
| Real Estate, Rental & Leasing | 32 (66.7%) | 16 (33.3%) |
| Professional & Scientific | 89 (54.9%) | 73 (45.1%) |
| Enterprise Management | 0 (0.0%) | 0 (0.0%) |
| Administrative & Support | 63 (63.0%) | 37 (37.0%) |
| Educational Services | 153 (36.0%) | 272 (64.0%) |
| Health Care & Social Assistance | 138 (26.2%) | 389 (73.8%) |
| Arts, Entertainment & Recreation | 24 (32.9%) | 49 (67.1%) |
| Accommodation & Food Services | 52 (43.3%) | 68 (56.7%) |
| Public Administration | 175 (93.6%) | 12 (6.4%) |
| Total | 1,238 (47.3%) | 1,381 (52.7%) |
Education in Wheelersburg
School Enrollment in Wheelersburg
The most common levels of schooling among the 1,413 students in Wheelersburg are elementary school (352 | 24.9%), high school (292 | 20.7%), and middle school (238 | 16.8%).
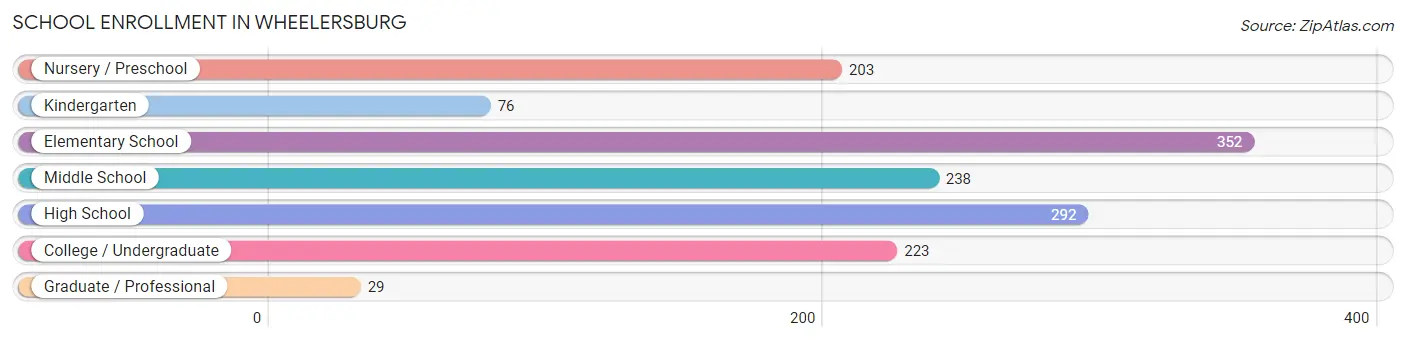
| School Level | # Students | % Students |
| Nursery / Preschool | 203 | 14.4% |
| Kindergarten | 76 | 5.4% |
| Elementary School | 352 | 24.9% |
| Middle School | 238 | 16.8% |
| High School | 292 | 20.7% |
| College / Undergraduate | 223 | 15.8% |
| Graduate / Professional | 29 | 2.1% |
| Total | 1,413 | 100.0% |
School Enrollment by Age by Funding Source in Wheelersburg
Out of a total of 1,413 students who are enrolled in schools in Wheelersburg, 188 (13.3%) attend a private institution, while the remaining 1,225 (86.7%) are enrolled in public schools. The age group of 3 to 4 year olds has the highest likelihood of being enrolled in private schools, with 92 (76.0% in the age bracket) enrolled. Conversely, the age group of 15 to 17 year olds has the lowest likelihood of being enrolled in a private school, with 204 (100.0% in the age bracket) attending a public institution.
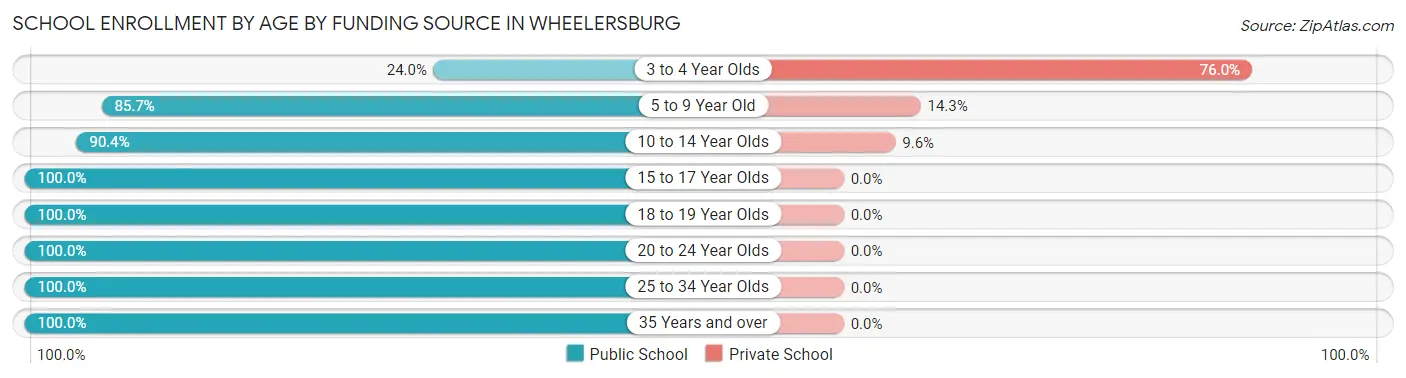
| Age Bracket | Public School | Private School |
| 3 to 4 Year Olds | 29 (24.0%) | 92 (76.0%) |
| 5 to 9 Year Old | 401 (85.7%) | 67 (14.3%) |
| 10 to 14 Year Olds | 272 (90.4%) | 29 (9.6%) |
| 15 to 17 Year Olds | 204 (100.0%) | 0 (0.0%) |
| 18 to 19 Year Olds | 123 (100.0%) | 0 (0.0%) |
| 20 to 24 Year Olds | 101 (100.0%) | 0 (0.0%) |
| 25 to 34 Year Olds | 44 (100.0%) | 0 (0.0%) |
| 35 Years and over | 51 (100.0%) | 0 (0.0%) |
| Total | 1,225 (86.7%) | 188 (13.3%) |
Educational Attainment by Field of Study in Wheelersburg
Education (438 | 26.5%), business (294 | 17.7%), science & technology (260 | 15.7%), communications (168 | 10.1%), and social sciences (93 | 5.6%) are the most common fields of study among 1,656 individuals in Wheelersburg who have obtained a bachelor's degree or higher.
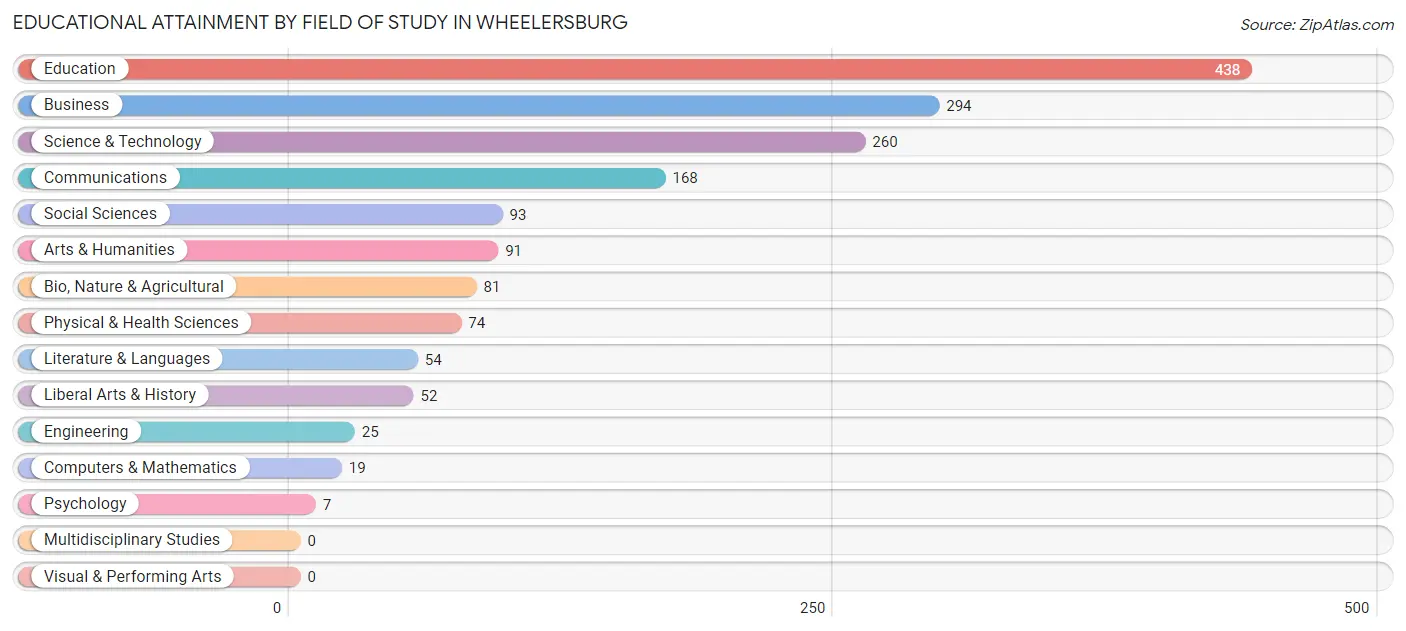
| Field of Study | # Graduates | % Graduates |
| Computers & Mathematics | 19 | 1.1% |
| Bio, Nature & Agricultural | 81 | 4.9% |
| Physical & Health Sciences | 74 | 4.5% |
| Psychology | 7 | 0.4% |
| Social Sciences | 93 | 5.6% |
| Engineering | 25 | 1.5% |
| Multidisciplinary Studies | 0 | 0.0% |
| Science & Technology | 260 | 15.7% |
| Business | 294 | 17.7% |
| Education | 438 | 26.5% |
| Literature & Languages | 54 | 3.3% |
| Liberal Arts & History | 52 | 3.1% |
| Visual & Performing Arts | 0 | 0.0% |
| Communications | 168 | 10.1% |
| Arts & Humanities | 91 | 5.5% |
| Total | 1,656 | 100.0% |
Transportation & Commute in Wheelersburg
Vehicle Availability by Sex in Wheelersburg
The most prevalent vehicle ownership categories in Wheelersburg are males with 2 vehicles (490, accounting for 39.7%) and females with 2 vehicles (453, making up 35.5%).
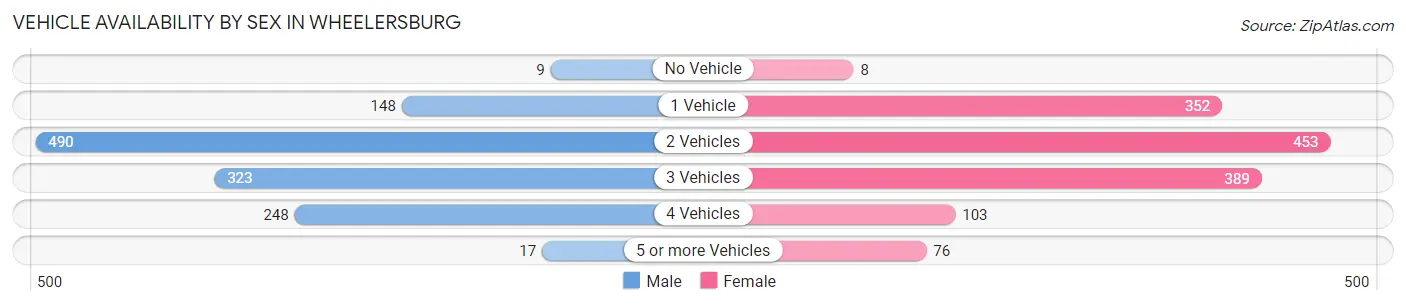
| Vehicles Available | Male | Female |
| No Vehicle | 9 (0.7%) | 8 (0.6%) |
| 1 Vehicle | 148 (12.0%) | 352 (25.5%) |
| 2 Vehicles | 490 (39.7%) | 453 (32.8%) |
| 3 Vehicles | 323 (26.2%) | 389 (28.2%) |
| 4 Vehicles | 248 (20.1%) | 103 (7.5%) |
| 5 or more Vehicles | 17 (1.4%) | 76 (5.5%) |
| Total | 1,235 (100.0%) | 1,381 (100.0%) |
Commute Time in Wheelersburg
The most frequently occuring commute durations in Wheelersburg are 20 to 24 minutes (559 commuters, 23.4%), 30 to 34 minutes (352 commuters, 14.8%), and 15 to 19 minutes (344 commuters, 14.4%).
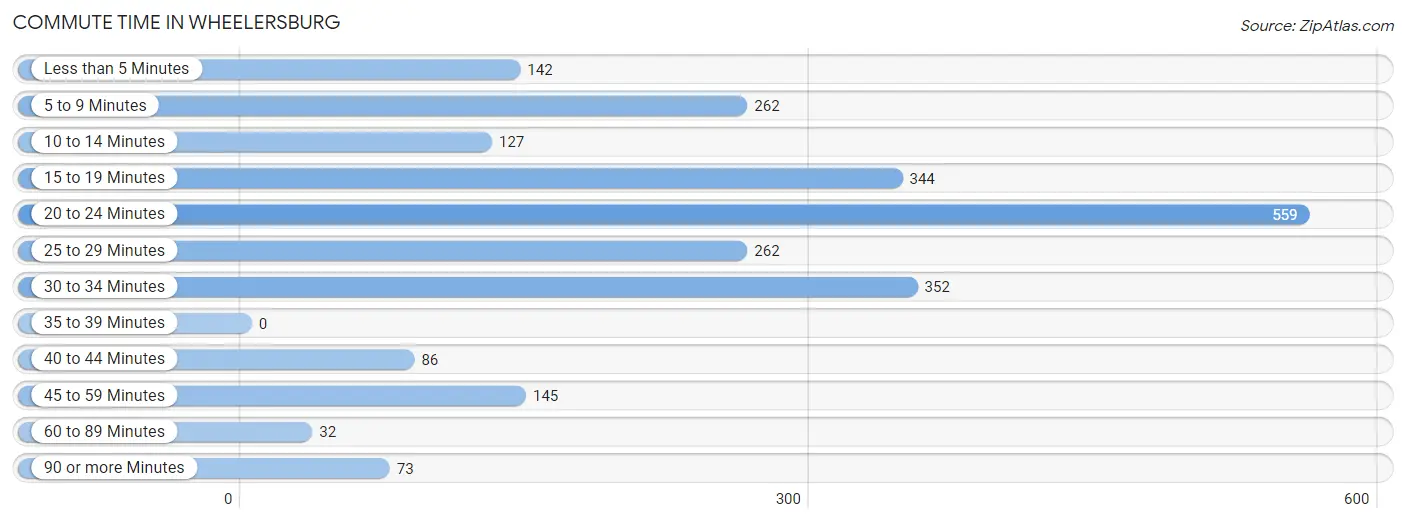
| Commute Time | # Commuters | % Commuters |
| Less than 5 Minutes | 142 | 6.0% |
| 5 to 9 Minutes | 262 | 11.0% |
| 10 to 14 Minutes | 127 | 5.3% |
| 15 to 19 Minutes | 344 | 14.4% |
| 20 to 24 Minutes | 559 | 23.4% |
| 25 to 29 Minutes | 262 | 11.0% |
| 30 to 34 Minutes | 352 | 14.8% |
| 35 to 39 Minutes | 0 | 0.0% |
| 40 to 44 Minutes | 86 | 3.6% |
| 45 to 59 Minutes | 145 | 6.1% |
| 60 to 89 Minutes | 32 | 1.3% |
| 90 or more Minutes | 73 | 3.1% |
Commute Time by Sex in Wheelersburg
The most common commute times in Wheelersburg are 20 to 24 minutes (252 commuters, 21.2%) for males and 20 to 24 minutes (307 commuters, 25.7%) for females.
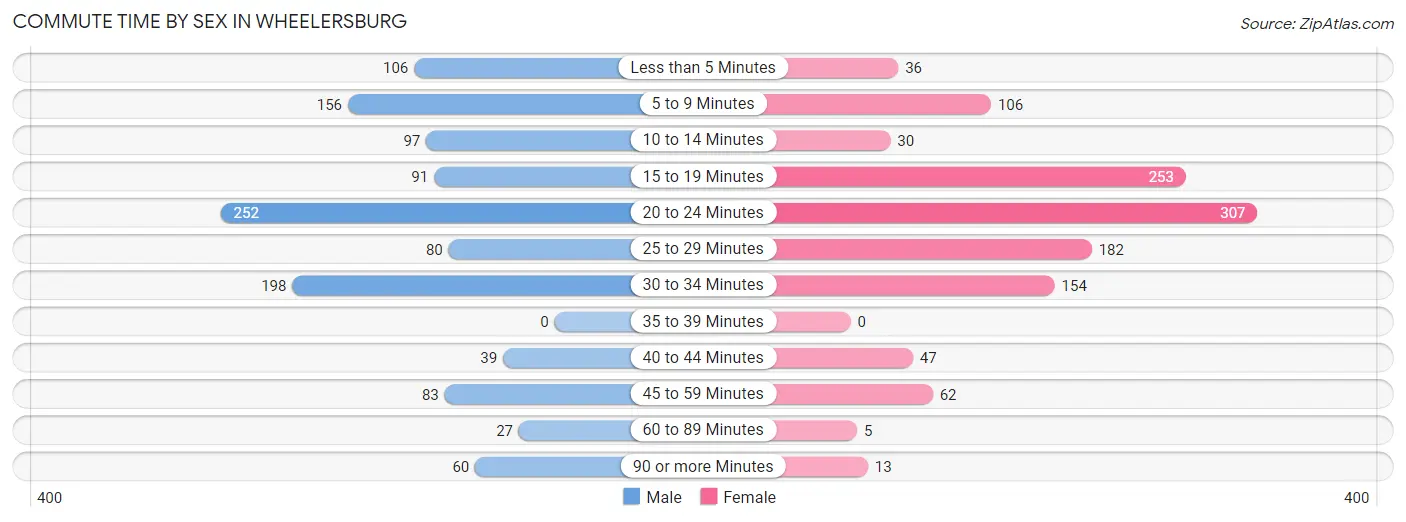
| Commute Time | Male | Female |
| Less than 5 Minutes | 106 (8.9%) | 36 (3.0%) |
| 5 to 9 Minutes | 156 (13.1%) | 106 (8.9%) |
| 10 to 14 Minutes | 97 (8.2%) | 30 (2.5%) |
| 15 to 19 Minutes | 91 (7.6%) | 253 (21.2%) |
| 20 to 24 Minutes | 252 (21.2%) | 307 (25.7%) |
| 25 to 29 Minutes | 80 (6.7%) | 182 (15.2%) |
| 30 to 34 Minutes | 198 (16.7%) | 154 (12.9%) |
| 35 to 39 Minutes | 0 (0.0%) | 0 (0.0%) |
| 40 to 44 Minutes | 39 (3.3%) | 47 (3.9%) |
| 45 to 59 Minutes | 83 (7.0%) | 62 (5.2%) |
| 60 to 89 Minutes | 27 (2.3%) | 5 (0.4%) |
| 90 or more Minutes | 60 (5.1%) | 13 (1.1%) |
Time of Departure to Work by Sex in Wheelersburg
The most frequent times of departure to work in Wheelersburg are 7:30 AM to 7:59 AM (312, 26.2%) for males and 7:30 AM to 7:59 AM (239, 20.0%) for females.
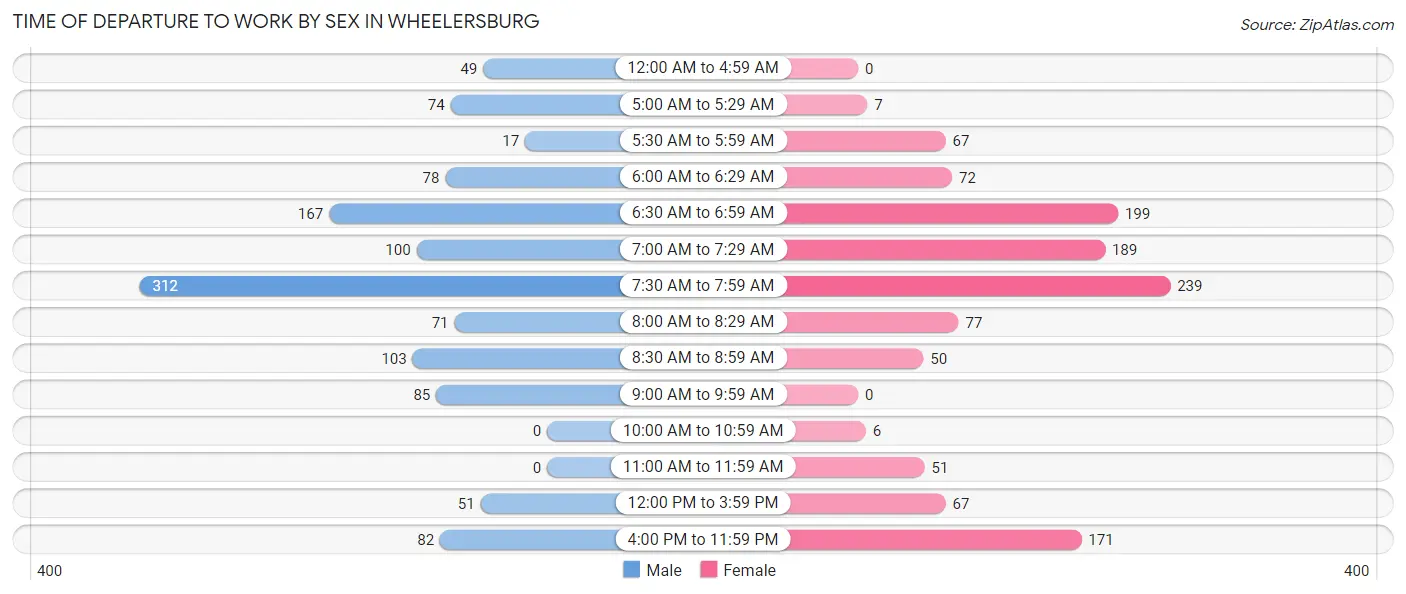
| Time of Departure | Male | Female |
| 12:00 AM to 4:59 AM | 49 (4.1%) | 0 (0.0%) |
| 5:00 AM to 5:29 AM | 74 (6.2%) | 7 (0.6%) |
| 5:30 AM to 5:59 AM | 17 (1.4%) | 67 (5.6%) |
| 6:00 AM to 6:29 AM | 78 (6.6%) | 72 (6.0%) |
| 6:30 AM to 6:59 AM | 167 (14.1%) | 199 (16.7%) |
| 7:00 AM to 7:29 AM | 100 (8.4%) | 189 (15.8%) |
| 7:30 AM to 7:59 AM | 312 (26.2%) | 239 (20.0%) |
| 8:00 AM to 8:29 AM | 71 (6.0%) | 77 (6.4%) |
| 8:30 AM to 8:59 AM | 103 (8.7%) | 50 (4.2%) |
| 9:00 AM to 9:59 AM | 85 (7.1%) | 0 (0.0%) |
| 10:00 AM to 10:59 AM | 0 (0.0%) | 6 (0.5%) |
| 11:00 AM to 11:59 AM | 0 (0.0%) | 51 (4.3%) |
| 12:00 PM to 3:59 PM | 51 (4.3%) | 67 (5.6%) |
| 4:00 PM to 11:59 PM | 82 (6.9%) | 171 (14.3%) |
| Total | 1,189 (100.0%) | 1,195 (100.0%) |
Housing Occupancy in Wheelersburg
Occupancy by Ownership in Wheelersburg
Of the total 2,477 dwellings in Wheelersburg, owner-occupied units account for 1,831 (73.9%), while renter-occupied units make up 646 (26.1%).
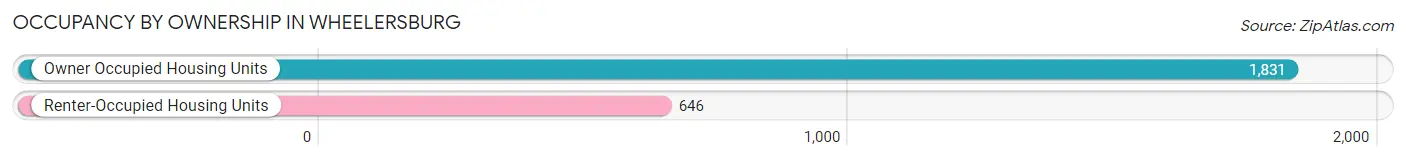
| Occupancy | # Housing Units | % Housing Units |
| Owner Occupied Housing Units | 1,831 | 73.9% |
| Renter-Occupied Housing Units | 646 | 26.1% |
| Total Occupied Housing Units | 2,477 | 100.0% |
Occupancy by Household Size in Wheelersburg
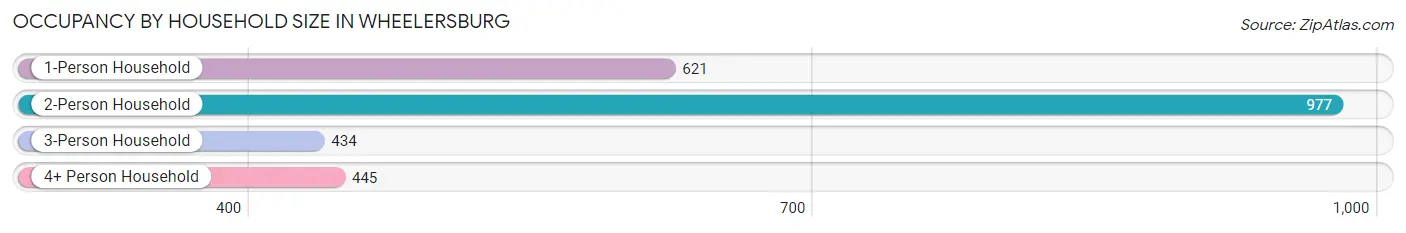
| Household Size | # Housing Units | % Housing Units |
| 1-Person Household | 621 | 25.1% |
| 2-Person Household | 977 | 39.4% |
| 3-Person Household | 434 | 17.5% |
| 4+ Person Household | 445 | 18.0% |
| Total Housing Units | 2,477 | 100.0% |
Occupancy by Ownership by Household Size in Wheelersburg
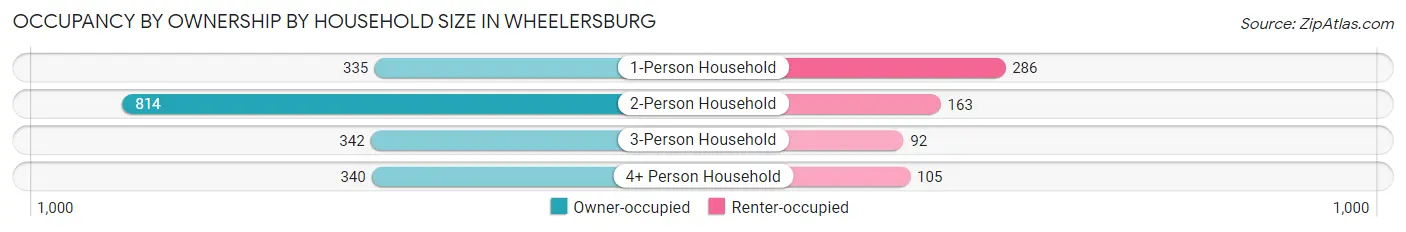
| Household Size | Owner-occupied | Renter-occupied |
| 1-Person Household | 335 (53.9%) | 286 (46.1%) |
| 2-Person Household | 814 (83.3%) | 163 (16.7%) |
| 3-Person Household | 342 (78.8%) | 92 (21.2%) |
| 4+ Person Household | 340 (76.4%) | 105 (23.6%) |
| Total Housing Units | 1,831 (73.9%) | 646 (26.1%) |
Occupancy by Educational Attainment in Wheelersburg
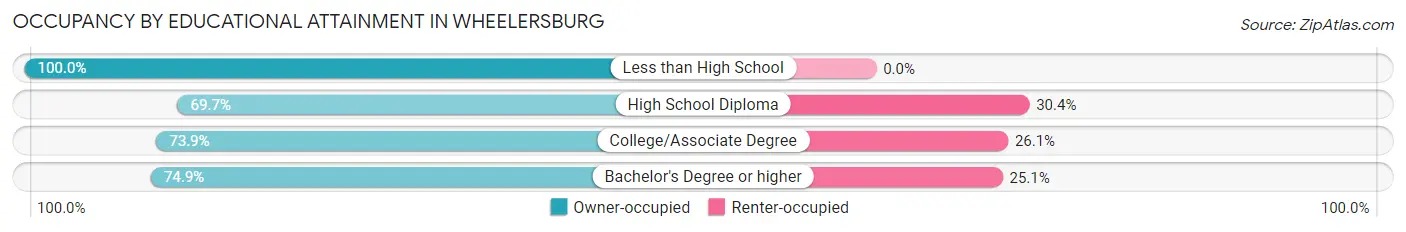
| Household Size | Owner-occupied | Renter-occupied |
| Less than High School | 107 (100.0%) | 0 (0.0%) |
| High School Diploma | 592 (69.7%) | 258 (30.3%) |
| College/Associate Degree | 492 (73.9%) | 174 (26.1%) |
| Bachelor's Degree or higher | 640 (74.9%) | 214 (25.1%) |
Occupancy by Age of Householder in Wheelersburg
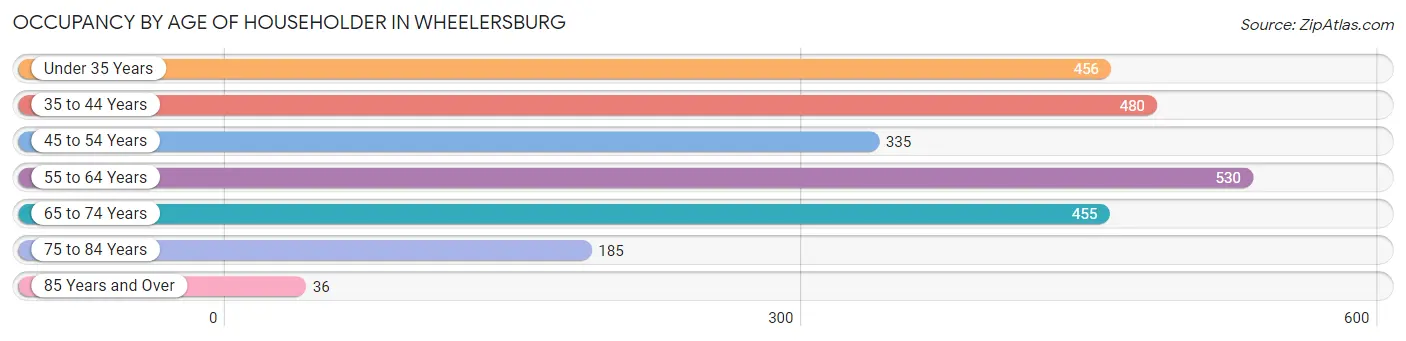
| Age Bracket | # Households | % Households |
| Under 35 Years | 456 | 18.4% |
| 35 to 44 Years | 480 | 19.4% |
| 45 to 54 Years | 335 | 13.5% |
| 55 to 64 Years | 530 | 21.4% |
| 65 to 74 Years | 455 | 18.4% |
| 75 to 84 Years | 185 | 7.5% |
| 85 Years and Over | 36 | 1.5% |
| Total | 2,477 | 100.0% |
Housing Finances in Wheelersburg
Median Income by Occupancy in Wheelersburg
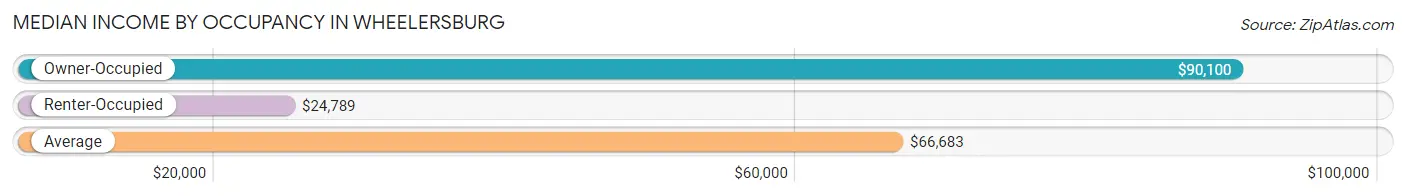
| Occupancy Type | # Households | Median Income |
| Owner-Occupied | 1,831 (73.9%) | $90,100 |
| Renter-Occupied | 646 (26.1%) | $24,789 |
| Average | 2,477 (100.0%) | $66,683 |
Occupancy by Householder Income Bracket in Wheelersburg
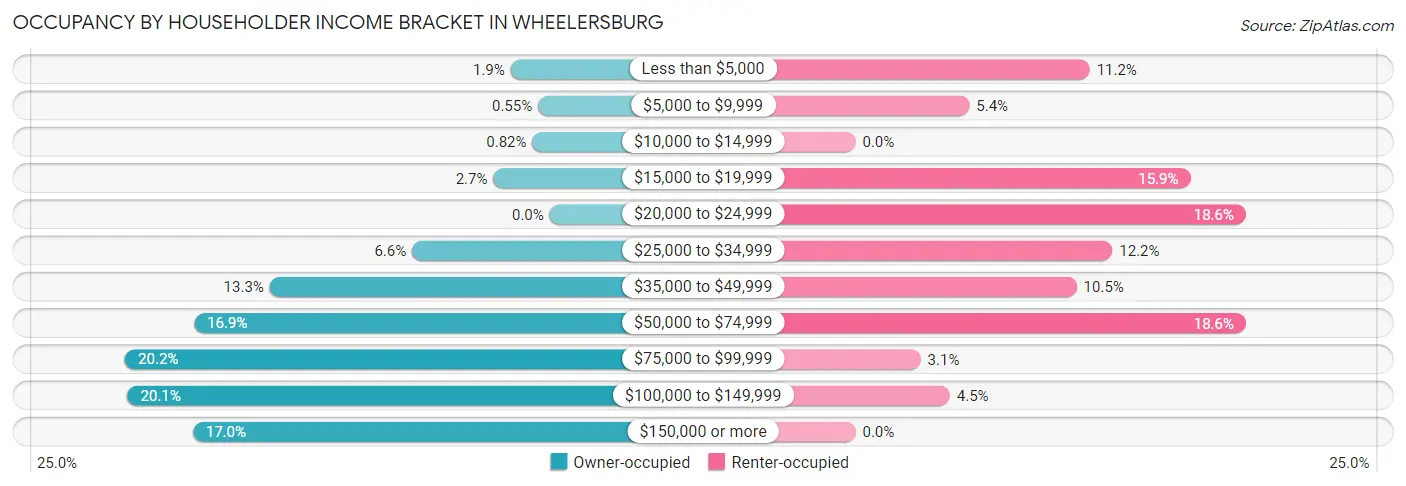
| Income Bracket | Owner-occupied | Renter-occupied |
| Less than $5,000 | 34 (1.9%) | 72 (11.2%) |
| $5,000 to $9,999 | 10 (0.5%) | 35 (5.4%) |
| $10,000 to $14,999 | 15 (0.8%) | 0 (0.0%) |
| $15,000 to $19,999 | 49 (2.7%) | 103 (15.9%) |
| $20,000 to $24,999 | 0 (0.0%) | 120 (18.6%) |
| $25,000 to $34,999 | 120 (6.6%) | 79 (12.2%) |
| $35,000 to $49,999 | 244 (13.3%) | 68 (10.5%) |
| $50,000 to $74,999 | 310 (16.9%) | 120 (18.6%) |
| $75,000 to $99,999 | 370 (20.2%) | 20 (3.1%) |
| $100,000 to $149,999 | 368 (20.1%) | 29 (4.5%) |
| $150,000 or more | 311 (17.0%) | 0 (0.0%) |
| Total | 1,831 (100.0%) | 646 (100.0%) |
Monthly Housing Cost Tiers in Wheelersburg
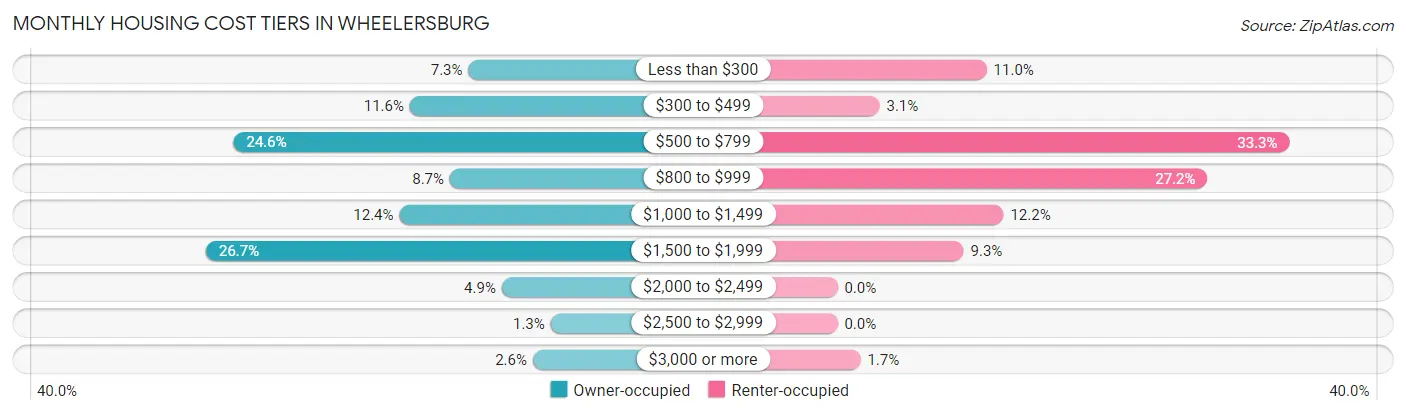
| Monthly Cost | Owner-occupied | Renter-occupied |
| Less than $300 | 134 (7.3%) | 71 (11.0%) |
| $300 to $499 | 213 (11.6%) | 20 (3.1%) |
| $500 to $799 | 451 (24.6%) | 215 (33.3%) |
| $800 to $999 | 159 (8.7%) | 176 (27.2%) |
| $1,000 to $1,499 | 227 (12.4%) | 79 (12.2%) |
| $1,500 to $1,999 | 488 (26.7%) | 60 (9.3%) |
| $2,000 to $2,499 | 89 (4.9%) | 0 (0.0%) |
| $2,500 to $2,999 | 23 (1.3%) | 0 (0.0%) |
| $3,000 or more | 47 (2.6%) | 11 (1.7%) |
| Total | 1,831 (100.0%) | 646 (100.0%) |
Physical Housing Characteristics in Wheelersburg
Housing Structures in Wheelersburg
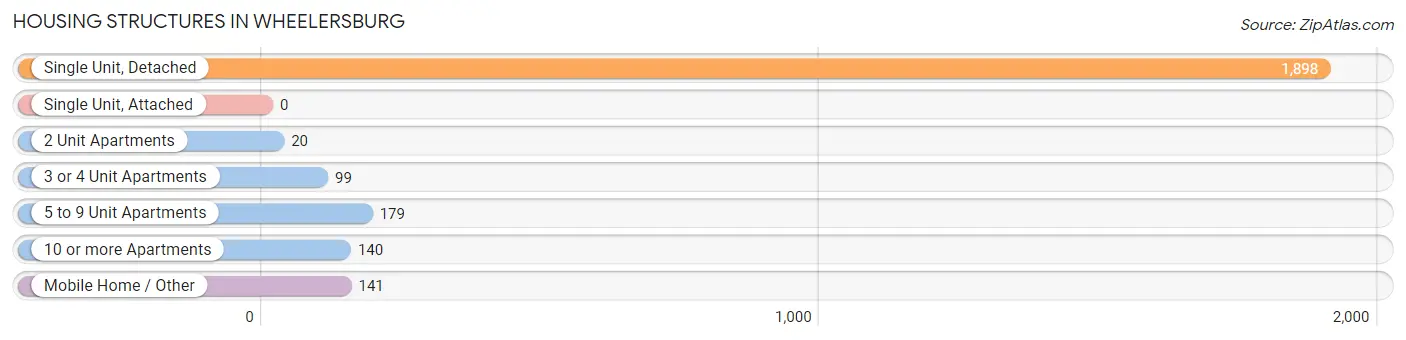
| Structure Type | # Housing Units | % Housing Units |
| Single Unit, Detached | 1,898 | 76.6% |
| Single Unit, Attached | 0 | 0.0% |
| 2 Unit Apartments | 20 | 0.8% |
| 3 or 4 Unit Apartments | 99 | 4.0% |
| 5 to 9 Unit Apartments | 179 | 7.2% |
| 10 or more Apartments | 140 | 5.7% |
| Mobile Home / Other | 141 | 5.7% |
| Total | 2,477 | 100.0% |
Housing Structures by Occupancy in Wheelersburg
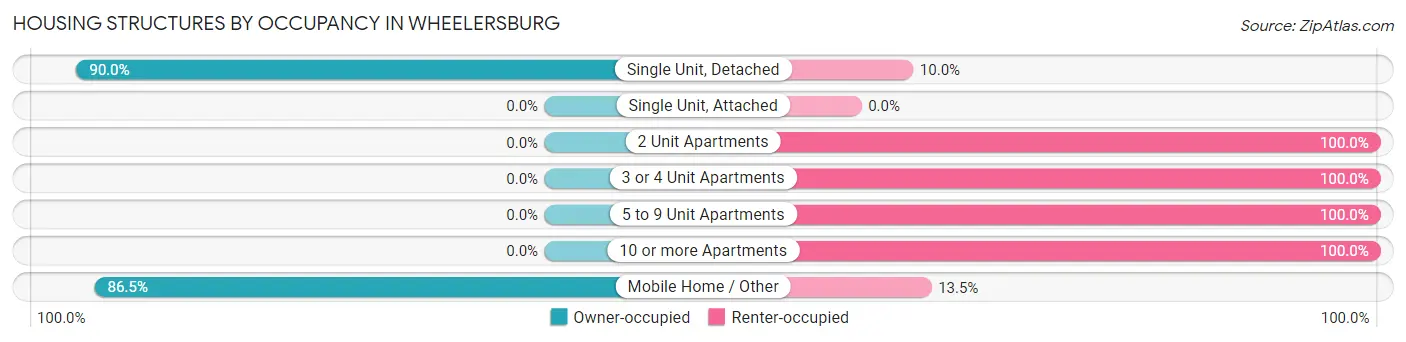
| Structure Type | Owner-occupied | Renter-occupied |
| Single Unit, Detached | 1,709 (90.0%) | 189 (10.0%) |
| Single Unit, Attached | 0 (0.0%) | 0 (0.0%) |
| 2 Unit Apartments | 0 (0.0%) | 20 (100.0%) |
| 3 or 4 Unit Apartments | 0 (0.0%) | 99 (100.0%) |
| 5 to 9 Unit Apartments | 0 (0.0%) | 179 (100.0%) |
| 10 or more Apartments | 0 (0.0%) | 140 (100.0%) |
| Mobile Home / Other | 122 (86.5%) | 19 (13.5%) |
| Total | 1,831 (73.9%) | 646 (26.1%) |
Housing Structures by Number of Rooms in Wheelersburg
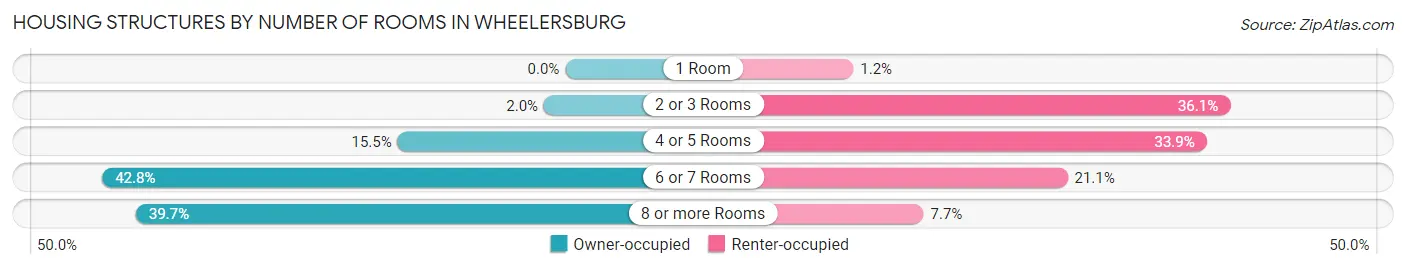
| Number of Rooms | Owner-occupied | Renter-occupied |
| 1 Room | 0 (0.0%) | 8 (1.2%) |
| 2 or 3 Rooms | 36 (2.0%) | 233 (36.1%) |
| 4 or 5 Rooms | 284 (15.5%) | 219 (33.9%) |
| 6 or 7 Rooms | 784 (42.8%) | 136 (21.0%) |
| 8 or more Rooms | 727 (39.7%) | 50 (7.7%) |
| Total | 1,831 (100.0%) | 646 (100.0%) |
Housing Structure by Heating Type in Wheelersburg
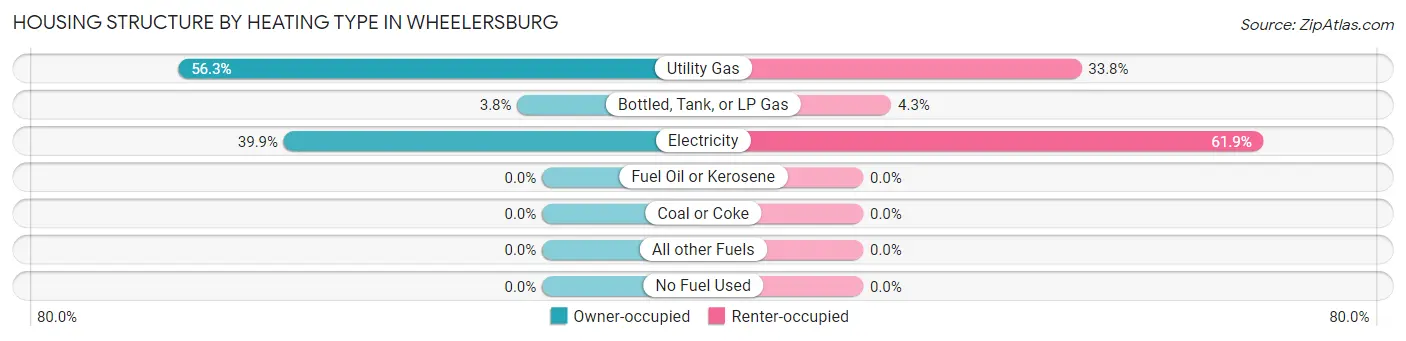
| Heating Type | Owner-occupied | Renter-occupied |
| Utility Gas | 1,030 (56.2%) | 218 (33.8%) |
| Bottled, Tank, or LP Gas | 70 (3.8%) | 28 (4.3%) |
| Electricity | 731 (39.9%) | 400 (61.9%) |
| Fuel Oil or Kerosene | 0 (0.0%) | 0 (0.0%) |
| Coal or Coke | 0 (0.0%) | 0 (0.0%) |
| All other Fuels | 0 (0.0%) | 0 (0.0%) |
| No Fuel Used | 0 (0.0%) | 0 (0.0%) |
| Total | 1,831 (100.0%) | 646 (100.0%) |
Household Vehicle Usage in Wheelersburg
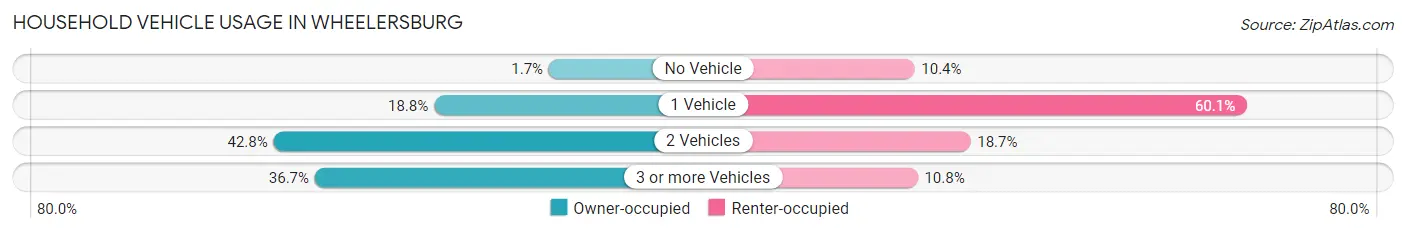
| Vehicles per Household | Owner-occupied | Renter-occupied |
| No Vehicle | 31 (1.7%) | 67 (10.4%) |
| 1 Vehicle | 345 (18.8%) | 388 (60.1%) |
| 2 Vehicles | 784 (42.8%) | 121 (18.7%) |
| 3 or more Vehicles | 671 (36.6%) | 70 (10.8%) |
| Total | 1,831 (100.0%) | 646 (100.0%) |
Real Estate & Mortgages in Wheelersburg
Real Estate and Mortgage Overview in Wheelersburg
| Characteristic | Without Mortgage | With Mortgage |
| Housing Units | 754 | 1,077 |
| Median Property Value | $209,800 | $212,000 |
| Median Household Income | $68,311 | $248 |
| Monthly Housing Costs | $534 | $47 |
| Real Estate Taxes | $2,283 | $28 |
Property Value by Mortgage Status in Wheelersburg
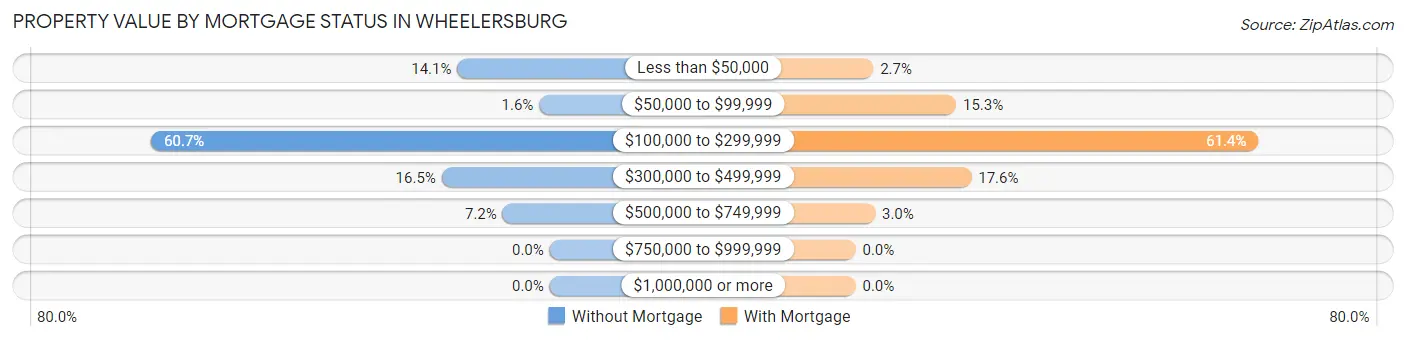
| Property Value | Without Mortgage | With Mortgage |
| Less than $50,000 | 106 (14.1%) | 29 (2.7%) |
| $50,000 to $99,999 | 12 (1.6%) | 165 (15.3%) |
| $100,000 to $299,999 | 458 (60.7%) | 661 (61.4%) |
| $300,000 to $499,999 | 124 (16.5%) | 190 (17.6%) |
| $500,000 to $749,999 | 54 (7.2%) | 32 (3.0%) |
| $750,000 to $999,999 | 0 (0.0%) | 0 (0.0%) |
| $1,000,000 or more | 0 (0.0%) | 0 (0.0%) |
| Total | 754 (100.0%) | 1,077 (100.0%) |
Household Income by Mortgage Status in Wheelersburg
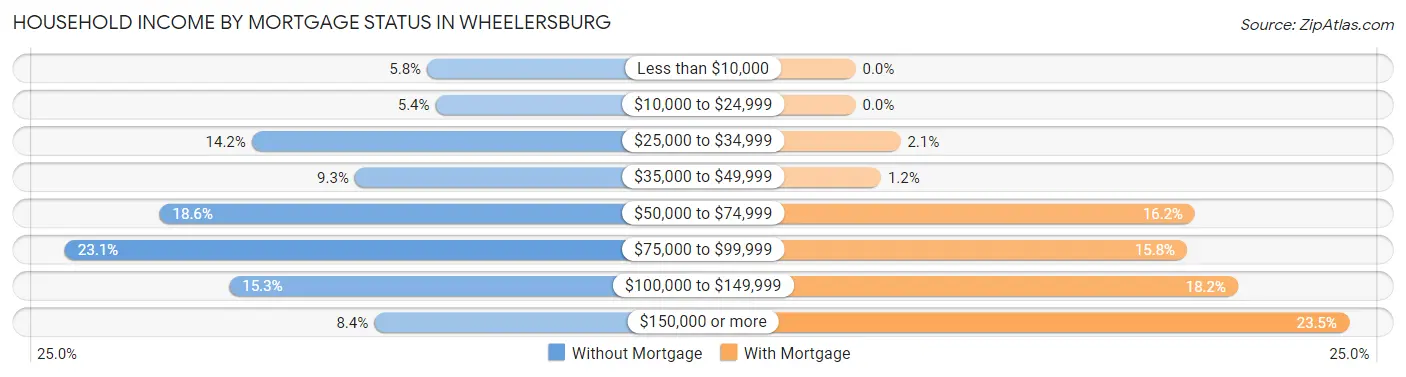
| Household Income | Without Mortgage | With Mortgage |
| Less than $10,000 | 44 (5.8%) | 0 (0.0%) |
| $10,000 to $24,999 | 41 (5.4%) | 0 (0.0%) |
| $25,000 to $34,999 | 107 (14.2%) | 23 (2.1%) |
| $35,000 to $49,999 | 70 (9.3%) | 13 (1.2%) |
| $50,000 to $74,999 | 140 (18.6%) | 174 (16.2%) |
| $75,000 to $99,999 | 174 (23.1%) | 170 (15.8%) |
| $100,000 to $149,999 | 115 (15.2%) | 196 (18.2%) |
| $150,000 or more | 63 (8.4%) | 253 (23.5%) |
| Total | 754 (100.0%) | 1,077 (100.0%) |
Property Value to Household Income Ratio in Wheelersburg
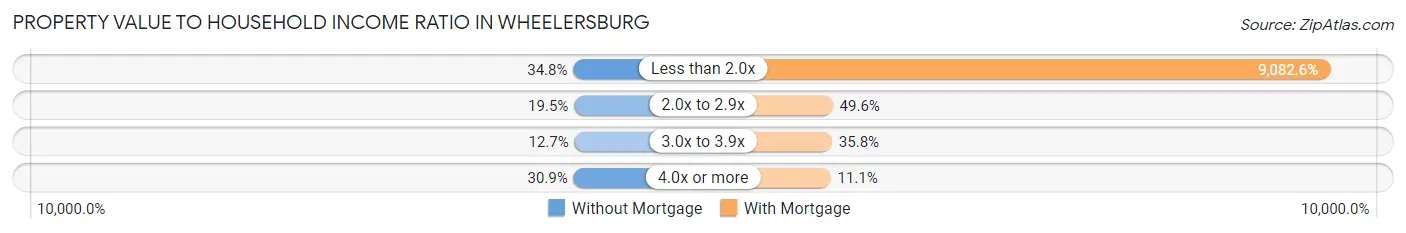
| Value-to-Income Ratio | Without Mortgage | With Mortgage |
| Less than 2.0x | 262 (34.7%) | 97,820 (9,082.6%) |
| 2.0x to 2.9x | 147 (19.5%) | 534 (49.6%) |
| 3.0x to 3.9x | 96 (12.7%) | 386 (35.8%) |
| 4.0x or more | 233 (30.9%) | 120 (11.1%) |
| Total | 754 (100.0%) | 1,077 (100.0%) |
Real Estate Taxes by Mortgage Status in Wheelersburg
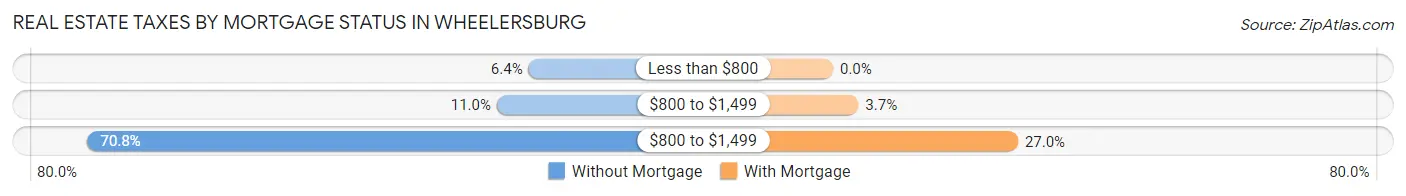
| Property Taxes | Without Mortgage | With Mortgage |
| Less than $800 | 48 (6.4%) | 0 (0.0%) |
| $800 to $1,499 | 83 (11.0%) | 40 (3.7%) |
| $800 to $1,499 | 534 (70.8%) | 291 (27.0%) |
| Total | 754 (100.0%) | 1,077 (100.0%) |
Health & Disability in Wheelersburg
Health Insurance Coverage by Age in Wheelersburg
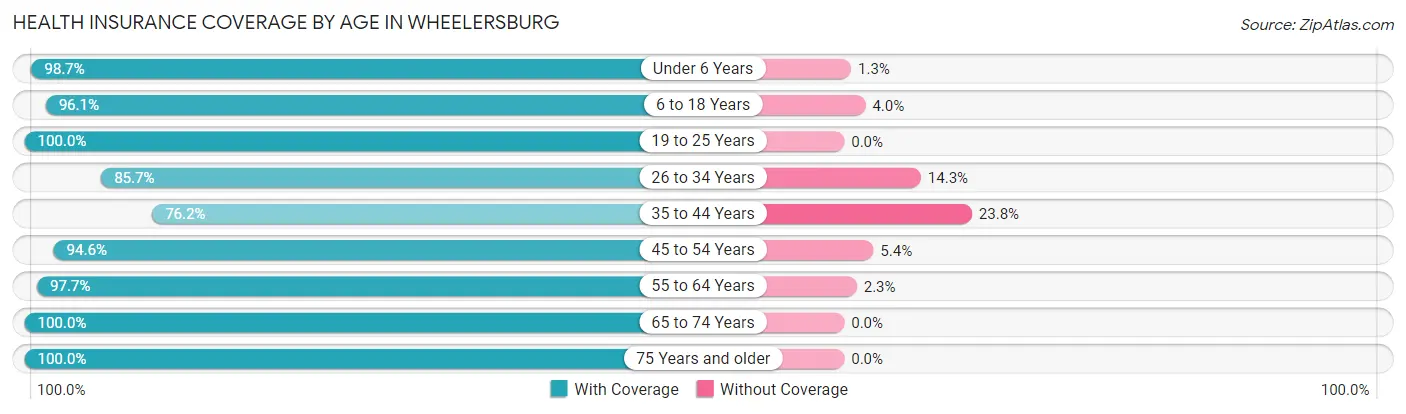
| Age Bracket | With Coverage | Without Coverage |
| Under 6 Years | 468 (98.7%) | 6 (1.3%) |
| 6 to 18 Years | 924 (96.1%) | 38 (4.0%) |
| 19 to 25 Years | 388 (100.0%) | 0 (0.0%) |
| 26 to 34 Years | 576 (85.7%) | 96 (14.3%) |
| 35 to 44 Years | 618 (76.2%) | 193 (23.8%) |
| 45 to 54 Years | 696 (94.6%) | 40 (5.4%) |
| 55 to 64 Years | 966 (97.7%) | 23 (2.3%) |
| 65 to 74 Years | 626 (100.0%) | 0 (0.0%) |
| 75 Years and older | 391 (100.0%) | 0 (0.0%) |
| Total | 5,653 (93.4%) | 396 (6.6%) |
Health Insurance Coverage by Citizenship Status in Wheelersburg
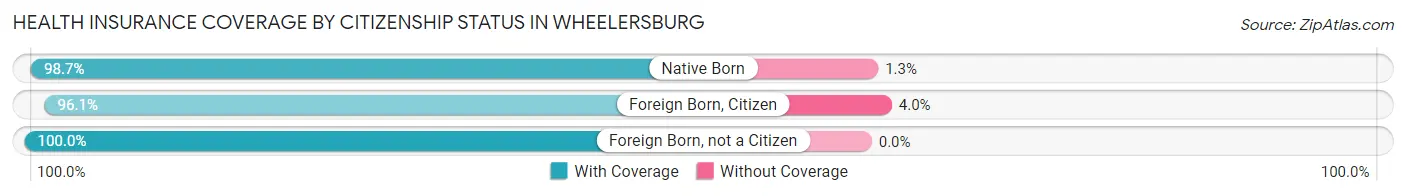
| Citizenship Status | With Coverage | Without Coverage |
| Native Born | 468 (98.7%) | 6 (1.3%) |
| Foreign Born, Citizen | 924 (96.1%) | 38 (4.0%) |
| Foreign Born, not a Citizen | 388 (100.0%) | 0 (0.0%) |
Health Insurance Coverage by Household Income in Wheelersburg
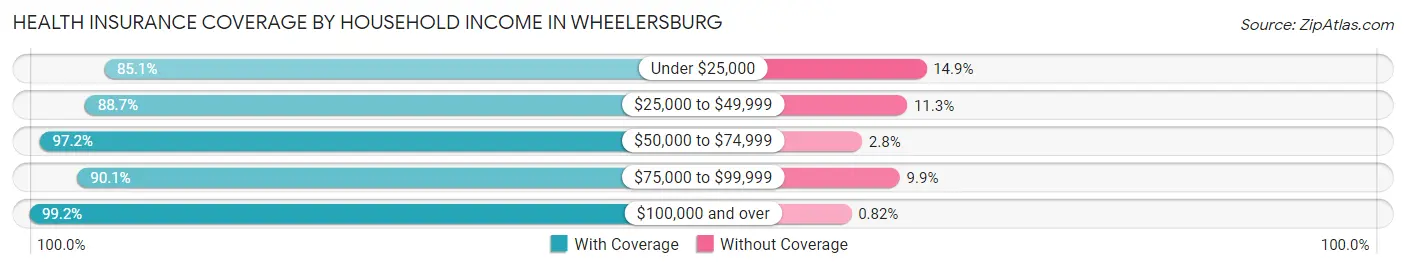
| Household Income | With Coverage | Without Coverage |
| Under $25,000 | 801 (85.1%) | 140 (14.9%) |
| $25,000 to $49,999 | 912 (88.7%) | 116 (11.3%) |
| $50,000 to $74,999 | 859 (97.2%) | 25 (2.8%) |
| $75,000 to $99,999 | 874 (90.1%) | 96 (9.9%) |
| $100,000 and over | 2,184 (99.2%) | 18 (0.8%) |
Public vs Private Health Insurance Coverage by Age in Wheelersburg
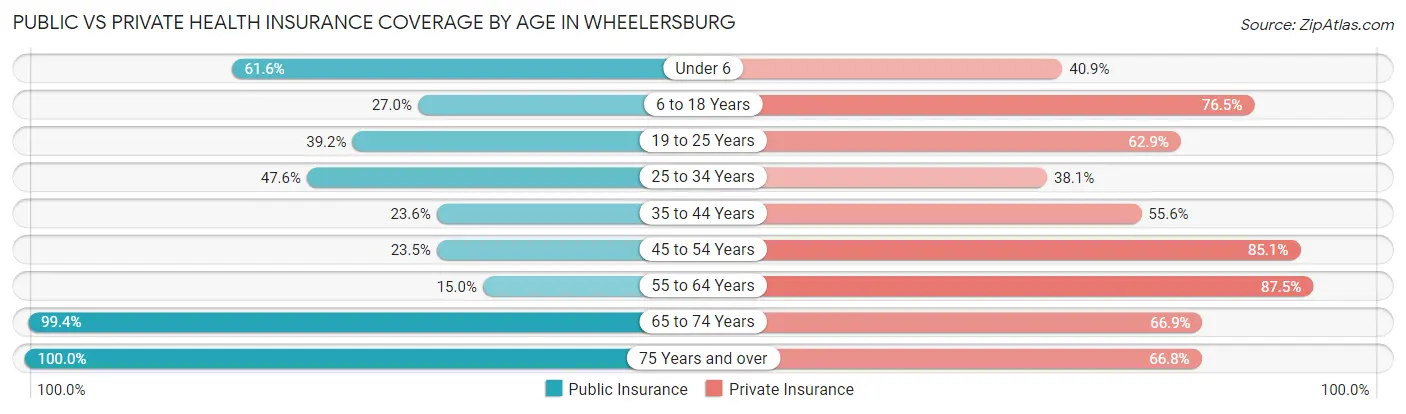
| Age Bracket | Public Insurance | Private Insurance |
| Under 6 | 292 (61.6%) | 194 (40.9%) |
| 6 to 18 Years | 260 (27.0%) | 736 (76.5%) |
| 19 to 25 Years | 152 (39.2%) | 244 (62.9%) |
| 25 to 34 Years | 320 (47.6%) | 256 (38.1%) |
| 35 to 44 Years | 191 (23.5%) | 451 (55.6%) |
| 45 to 54 Years | 173 (23.5%) | 626 (85.1%) |
| 55 to 64 Years | 148 (15.0%) | 865 (87.5%) |
| 65 to 74 Years | 622 (99.4%) | 419 (66.9%) |
| 75 Years and over | 391 (100.0%) | 261 (66.7%) |
| Total | 2,549 (42.1%) | 4,052 (67.0%) |
Disability Status by Sex by Age in Wheelersburg
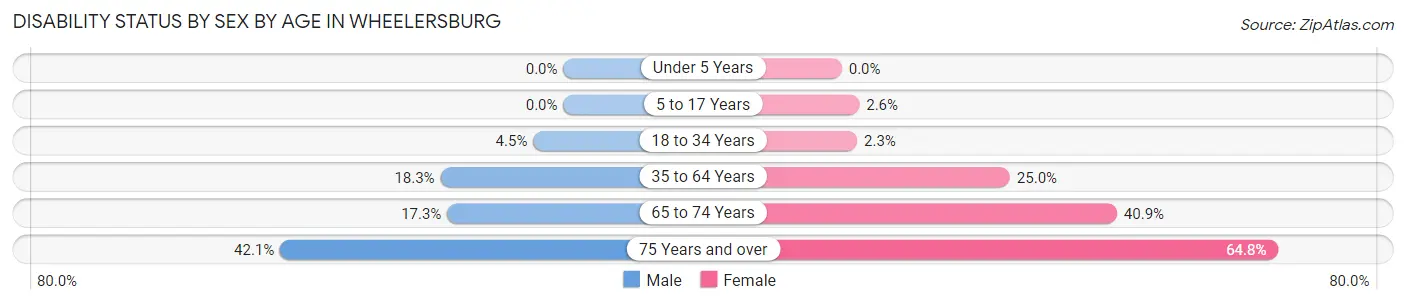
| Age Bracket | Male | Female |
| Under 5 Years | 0 (0.0%) | 0 (0.0%) |
| 5 to 17 Years | 0 (0.0%) | 16 (2.6%) |
| 18 to 34 Years | 25 (4.5%) | 14 (2.3%) |
| 35 to 64 Years | 207 (18.2%) | 350 (25.0%) |
| 65 to 74 Years | 59 (17.2%) | 116 (40.8%) |
| 75 Years and over | 82 (42.0%) | 127 (64.8%) |
Disability Class by Sex by Age in Wheelersburg
Disability Class: Hearing Difficulty
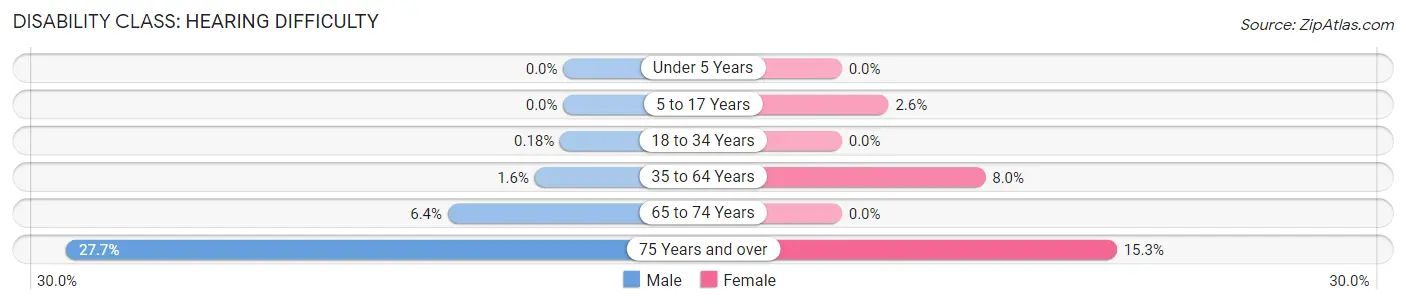
| Age Bracket | Male | Female |
| Under 5 Years | 0 (0.0%) | 0 (0.0%) |
| 5 to 17 Years | 0 (0.0%) | 16 (2.6%) |
| 18 to 34 Years | 1 (0.2%) | 0 (0.0%) |
| 35 to 64 Years | 18 (1.6%) | 112 (8.0%) |
| 65 to 74 Years | 22 (6.4%) | 0 (0.0%) |
| 75 Years and over | 54 (27.7%) | 30 (15.3%) |
Disability Class: Vision Difficulty
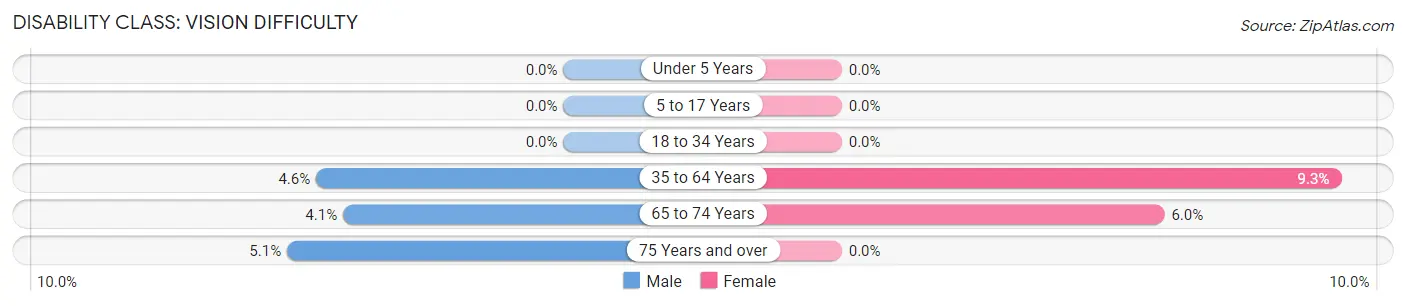
| Age Bracket | Male | Female |
| Under 5 Years | 0 (0.0%) | 0 (0.0%) |
| 5 to 17 Years | 0 (0.0%) | 0 (0.0%) |
| 18 to 34 Years | 0 (0.0%) | 0 (0.0%) |
| 35 to 64 Years | 52 (4.6%) | 130 (9.3%) |
| 65 to 74 Years | 14 (4.1%) | 17 (6.0%) |
| 75 Years and over | 10 (5.1%) | 0 (0.0%) |
Disability Class: Cognitive Difficulty
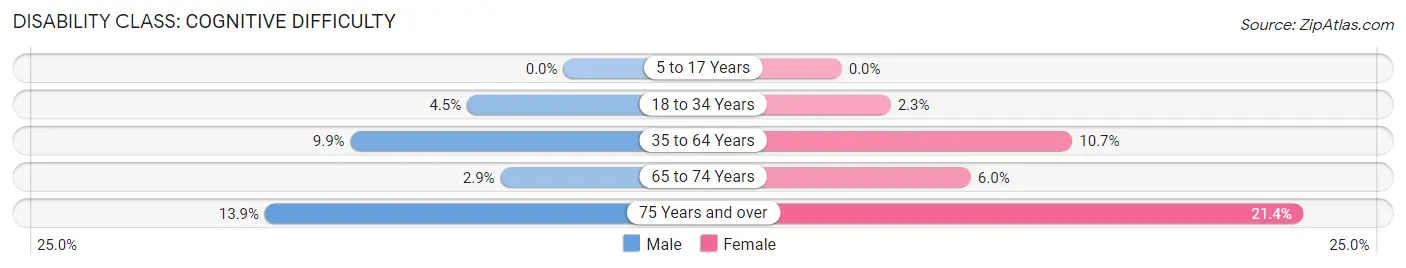
| Age Bracket | Male | Female |
| 5 to 17 Years | 0 (0.0%) | 0 (0.0%) |
| 18 to 34 Years | 25 (4.5%) | 14 (2.3%) |
| 35 to 64 Years | 112 (9.9%) | 150 (10.7%) |
| 65 to 74 Years | 10 (2.9%) | 17 (6.0%) |
| 75 Years and over | 27 (13.9%) | 42 (21.4%) |
Disability Class: Ambulatory Difficulty
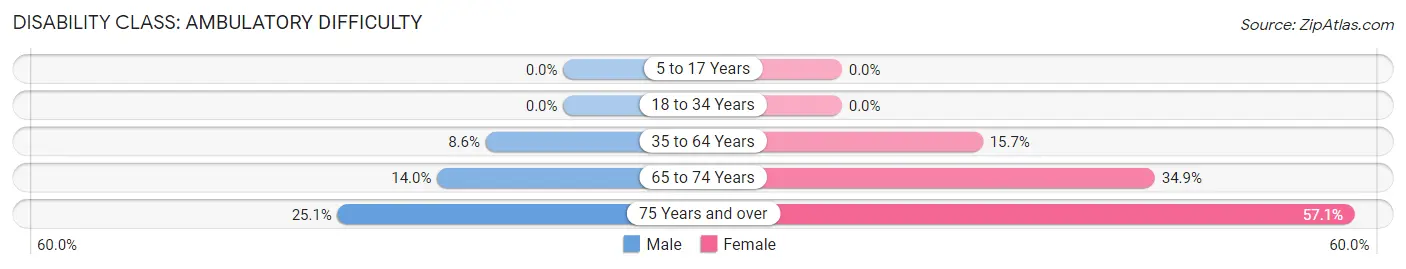
| Age Bracket | Male | Female |
| 5 to 17 Years | 0 (0.0%) | 0 (0.0%) |
| 18 to 34 Years | 0 (0.0%) | 0 (0.0%) |
| 35 to 64 Years | 98 (8.6%) | 220 (15.7%) |
| 65 to 74 Years | 48 (14.0%) | 99 (34.9%) |
| 75 Years and over | 49 (25.1%) | 112 (57.1%) |
Disability Class: Self-Care Difficulty
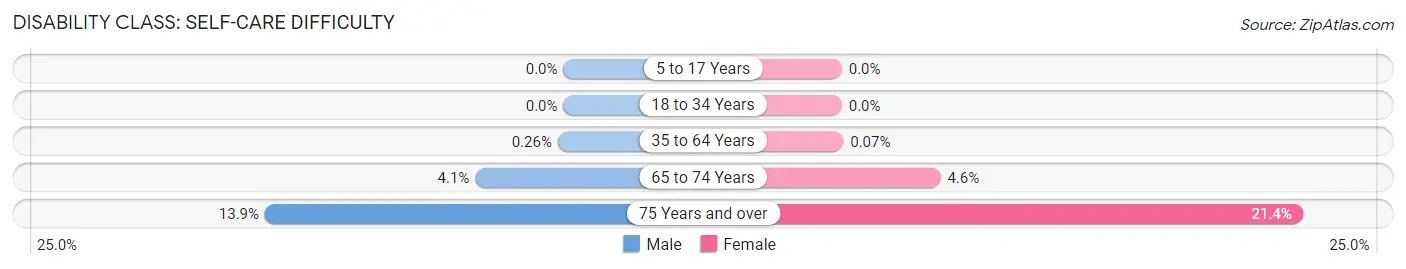
| Age Bracket | Male | Female |
| 5 to 17 Years | 0 (0.0%) | 0 (0.0%) |
| 18 to 34 Years | 0 (0.0%) | 0 (0.0%) |
| 35 to 64 Years | 3 (0.3%) | 1 (0.1%) |
| 65 to 74 Years | 14 (4.1%) | 13 (4.6%) |
| 75 Years and over | 27 (13.9%) | 42 (21.4%) |
Technology Access in Wheelersburg
Computing Device Access in Wheelersburg
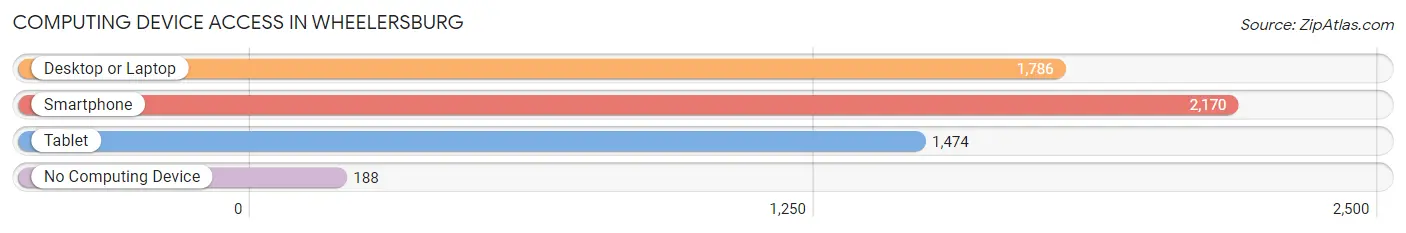
| Device Type | # Households | % Households |
| Desktop or Laptop | 1,786 | 72.1% |
| Smartphone | 2,170 | 87.6% |
| Tablet | 1,474 | 59.5% |
| No Computing Device | 188 | 7.6% |
| Total | 2,477 | 100.0% |
Internet Access in Wheelersburg
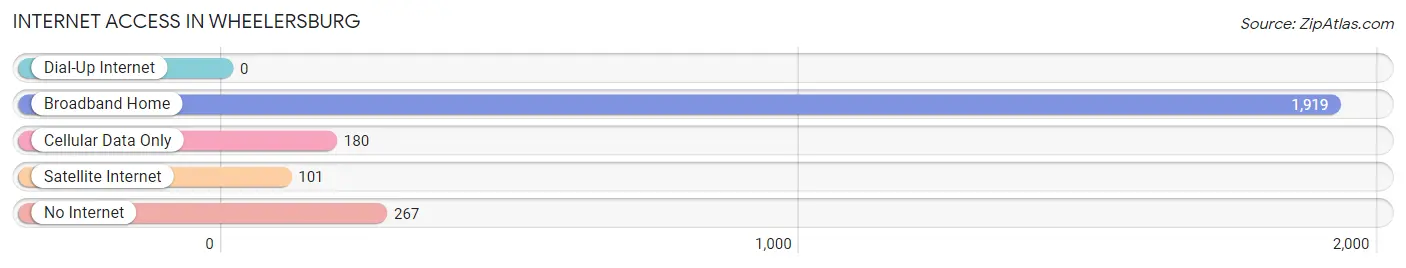
| Internet Type | # Households | % Households |
| Dial-Up Internet | 0 | 0.0% |
| Broadband Home | 1,919 | 77.5% |
| Cellular Data Only | 180 | 7.3% |
| Satellite Internet | 101 | 4.1% |
| No Internet | 267 | 10.8% |
| Total | 2,477 | 100.0% |
Wheelersburg Summary
Wheelersburg, Ohio is a small village located in Scioto County, Ohio. It is situated on the banks of the Ohio River, approximately 10 miles south of Portsmouth. The village has a population of approximately 3,000 people and is part of the Portsmouth Metropolitan Statistical Area.
History
Wheelersburg was founded in 1817 by William Wheeler, a Revolutionary War veteran. Wheeler purchased the land from the Scioto Land Company and named the village after himself. The village was incorporated in 1837 and has remained a small, rural community ever since.
The village was an important stop on the Underground Railroad, with many slaves escaping to freedom in Canada. The village was also home to a number of prominent abolitionists, including William Lloyd Garrison and Harriet Beecher Stowe.
Geography
Wheelersburg is located in Scioto County, Ohio, on the banks of the Ohio River. The village is situated approximately 10 miles south of Portsmouth and is part of the Portsmouth Metropolitan Statistical Area. The village is located in a rural area, with the nearest major city being Cincinnati, which is approximately 90 miles away.
The village is situated on a flat plain, with the Ohio River to the south and the Scioto River to the north. The village is surrounded by rolling hills and farmland.
Economy
The economy of Wheelersburg is largely based on agriculture and manufacturing. The village is home to a number of small businesses, including a number of family-owned farms. The village is also home to a number of manufacturing companies, including a paper mill and a furniture factory.
The village is also home to a number of retail stores, including a grocery store, a hardware store, and a number of restaurants. The village is also home to a number of small businesses, including a number of antique stores.
Demographics
As of the 2010 census, the population of Wheelersburg was 3,000. The racial makeup of the village was 97.3% White, 0.7% African American, 0.3% Native American, 0.3% Asian, and 1.3% from other races. The median household income was $37,500, and the median family income was $45,000.
The village is home to a number of churches, including the First United Methodist Church, the First Baptist Church, and the Church of the Nazarene. The village is also home to a number of schools, including Wheelersburg High School, Wheelersburg Middle School, and Wheelersburg Elementary School.
Conclusion
Wheelersburg, Ohio is a small village located in Scioto County, Ohio. It is situated on the banks of the Ohio River, approximately 10 miles south of Portsmouth. The village has a population of approximately 3,000 people and is part of the Portsmouth Metropolitan Statistical Area. The village was founded in 1817 by William Wheeler and has remained a small, rural community ever since. The economy of Wheelersburg is largely based on agriculture and manufacturing, and the village is home to a number of small businesses, churches, and schools. The racial makeup of the village is 97.3% White, 0.7% African American, 0.3% Native American, 0.3% Asian, and 1.3% from other races. The median household income was $37,500, and the median family income was $45,000.
Common Questions
What is Per Capita Income in Wheelersburg?
Per Capita income in Wheelersburg is $33,841.
What is the Median Family Income in Wheelersburg?
Median Family Income in Wheelersburg is $90,109.
What is the Median Household income in Wheelersburg?
Median Household Income in Wheelersburg is $66,683.
What is Income or Wage Gap in Wheelersburg?
Income or Wage Gap in Wheelersburg is 46.8%.
Women in Wheelersburg earn 53.2 cents for every dollar earned by a man.
What is Inequality or Gini Index in Wheelersburg?
Inequality or Gini Index in Wheelersburg is 0.43.
What is the Total Population of Wheelersburg?
Total Population of Wheelersburg is 6,215.
What is the Total Male Population of Wheelersburg?
Total Male Population of Wheelersburg is 2,754.
What is the Total Female Population of Wheelersburg?
Total Female Population of Wheelersburg is 3,461.
What is the Ratio of Males per 100 Females in Wheelersburg?
There are 79.57 Males per 100 Females in Wheelersburg.
What is the Ratio of Females per 100 Males in Wheelersburg?
There are 125.67 Females per 100 Males in Wheelersburg.
What is the Median Population Age in Wheelersburg?
Median Population Age in Wheelersburg is 42.3 Years.
What is the Average Family Size in Wheelersburg
Average Family Size in Wheelersburg is 2.9 People.
What is the Average Household Size in Wheelersburg
Average Household Size in Wheelersburg is 2.4 People.
How Large is the Labor Force in Wheelersburg?
There are 2,825 People in the Labor Forcein in Wheelersburg.
What is the Percentage of People in the Labor Force in Wheelersburg?
55.8% of People are in the Labor Force in Wheelersburg.
What is the Unemployment Rate in Wheelersburg?
Unemployment Rate in Wheelersburg is 7.3%.