West Portsmouth, OH Map & Demographics
West Portsmouth Map
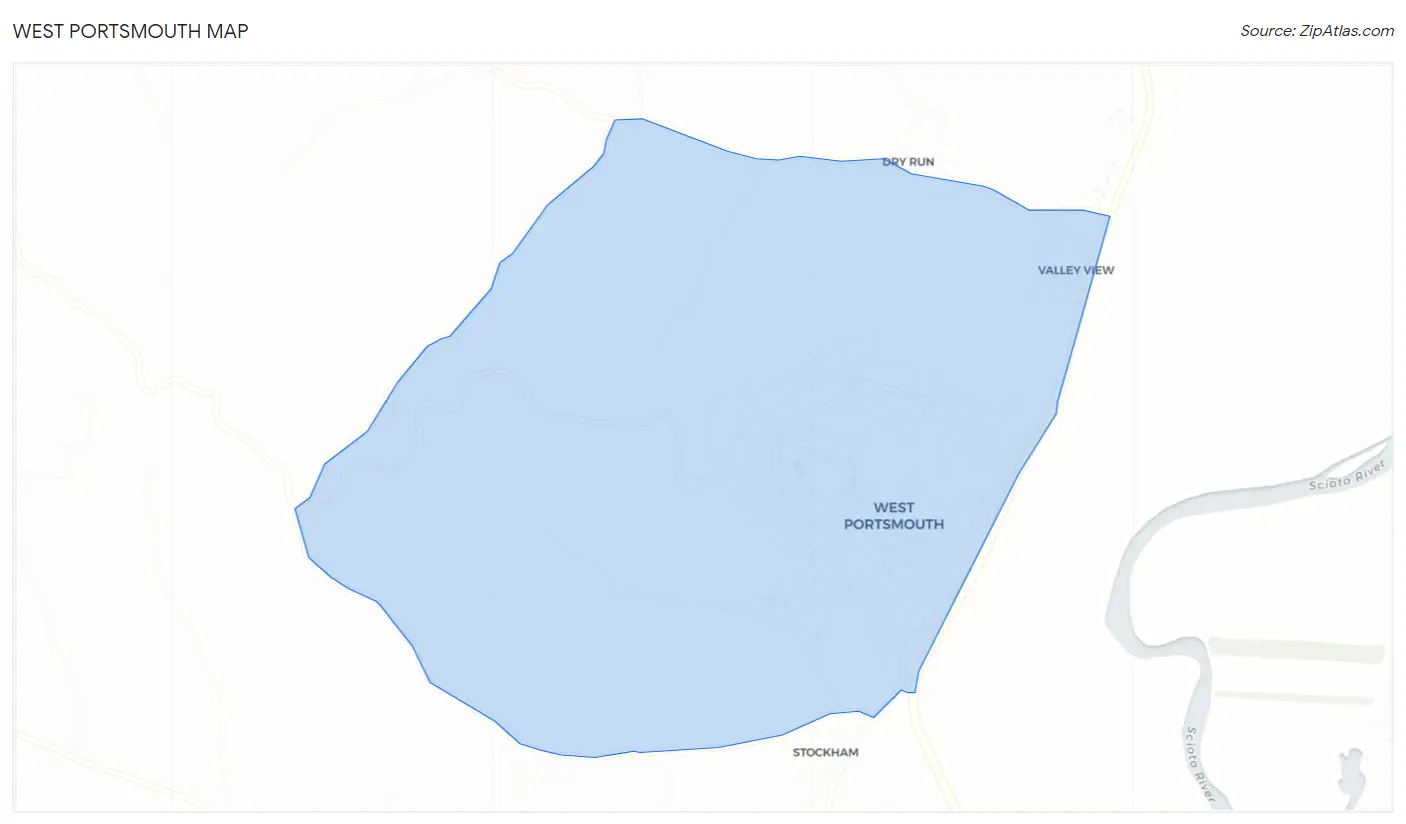
West Portsmouth Overview
$23,494
PER CAPITA INCOME
$60,577
AVG FAMILY INCOME
$38,356
AVG HOUSEHOLD INCOME
38.6%
WAGE / INCOME GAP [ % ]
61.4¢/ $1
WAGE / INCOME GAP [ $ ]
0.45
INEQUALITY / GINI INDEX
2,540
TOTAL POPULATION
1,259
MALE POPULATION
1,281
FEMALE POPULATION
98.28
MALES / 100 FEMALES
101.75
FEMALES / 100 MALES
47.2
MEDIAN AGE
3.2
AVG FAMILY SIZE
2.2
AVG HOUSEHOLD SIZE
905
LABOR FORCE [ PEOPLE ]
45.9%
PERCENT IN LABOR FORCE
West Portsmouth Zip Codes
West Portsmouth Area Codes
Income in West Portsmouth
Income Overview in West Portsmouth
Per Capita Income in West Portsmouth is $23,494, while median incomes of families and households are $60,577 and $38,356 respectively.
| Characteristic | Number | Measure |
| Per Capita Income | 2,540 | $23,494 |
| Median Family Income | 586 | $60,577 |
| Mean Family Income | 586 | $72,482 |
| Median Household Income | 1,164 | $38,356 |
| Mean Household Income | 1,164 | $49,747 |
| Income Deficit | 586 | $0 |
| Wage / Income Gap (%) | 2,540 | 38.61% |
| Wage / Income Gap ($) | 2,540 | 61.39¢ per $1 |
| Gini / Inequality Index | 2,540 | 0.45 |
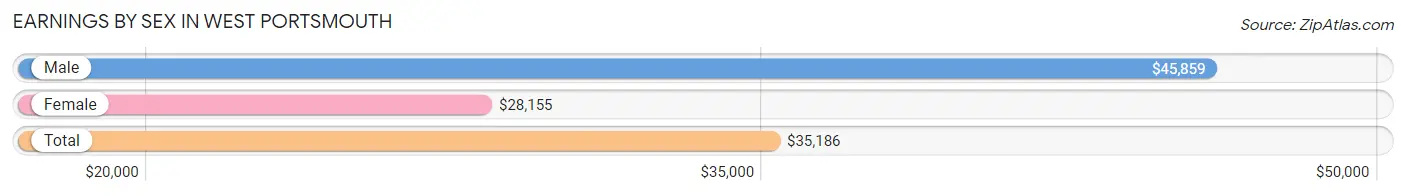
Earnings by Sex in West Portsmouth
Average Earnings in West Portsmouth are $35,186, $45,859 for men and $28,155 for women, a difference of 38.6%.
| Sex | Number | Average Earnings |
| Male | 414 (45.2%) | $45,859 |
| Female | 503 (54.8%) | $28,155 |
| Total | 917 (100.0%) | $35,186 |
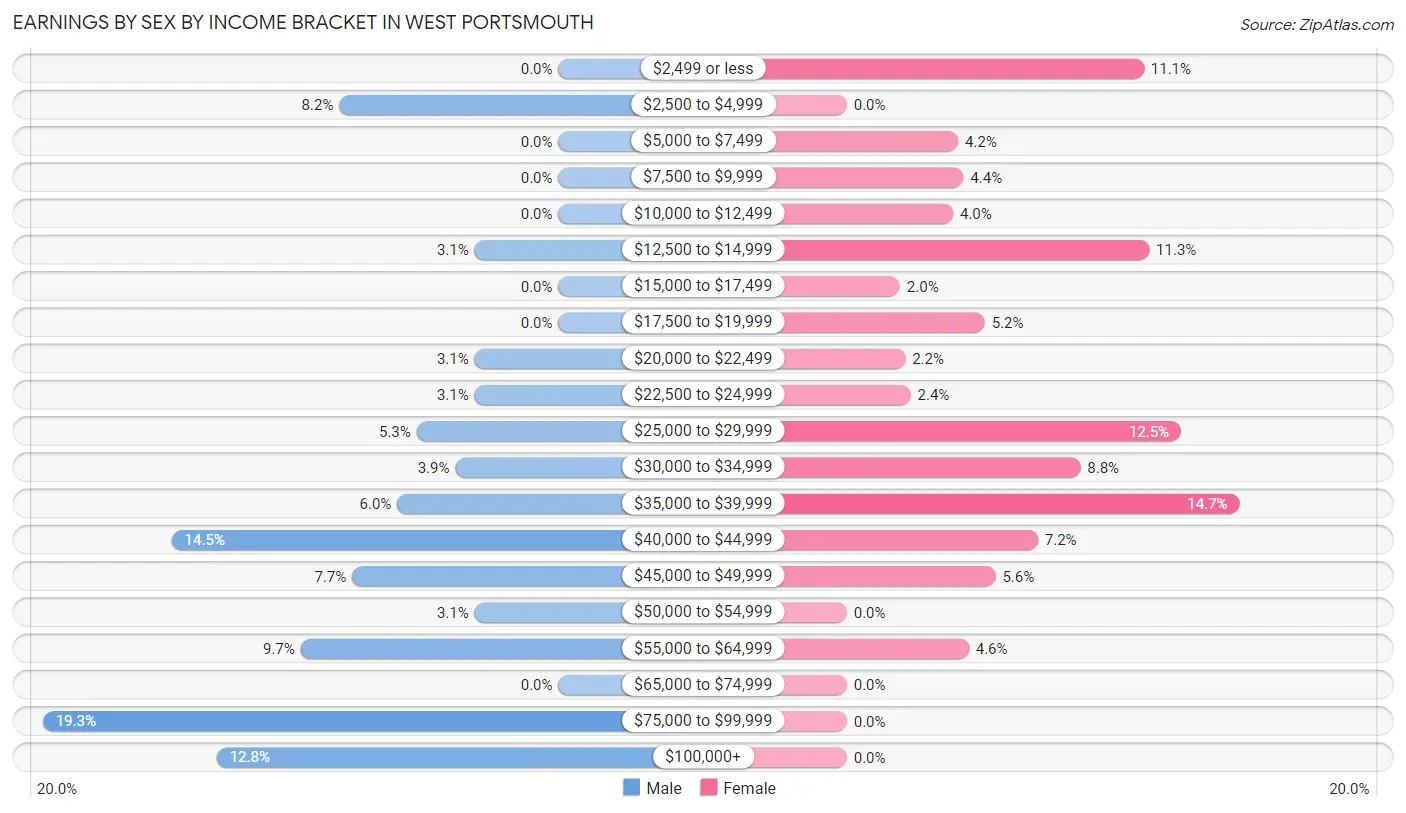
Earnings by Sex by Income Bracket in West Portsmouth
The most common earnings brackets in West Portsmouth are $75,000 to $99,999 for men (80 | 19.3%) and $35,000 to $39,999 for women (74 | 14.7%).
| Income | Male | Female |
| $2,499 or less | 0 (0.0%) | 56 (11.1%) |
| $2,500 to $4,999 | 34 (8.2%) | 0 (0.0%) |
| $5,000 to $7,499 | 0 (0.0%) | 21 (4.2%) |
| $7,500 to $9,999 | 0 (0.0%) | 22 (4.4%) |
| $10,000 to $12,499 | 0 (0.0%) | 20 (4.0%) |
| $12,500 to $14,999 | 13 (3.1%) | 57 (11.3%) |
| $15,000 to $17,499 | 0 (0.0%) | 10 (2.0%) |
| $17,500 to $19,999 | 0 (0.0%) | 26 (5.2%) |
| $20,000 to $22,499 | 13 (3.1%) | 11 (2.2%) |
| $22,500 to $24,999 | 13 (3.1%) | 12 (2.4%) |
| $25,000 to $29,999 | 22 (5.3%) | 63 (12.5%) |
| $30,000 to $34,999 | 16 (3.9%) | 44 (8.7%) |
| $35,000 to $39,999 | 25 (6.0%) | 74 (14.7%) |
| $40,000 to $44,999 | 60 (14.5%) | 36 (7.2%) |
| $45,000 to $49,999 | 32 (7.7%) | 28 (5.6%) |
| $50,000 to $54,999 | 13 (3.1%) | 0 (0.0%) |
| $55,000 to $64,999 | 40 (9.7%) | 23 (4.6%) |
| $65,000 to $74,999 | 0 (0.0%) | 0 (0.0%) |
| $75,000 to $99,999 | 80 (19.3%) | 0 (0.0%) |
| $100,000+ | 53 (12.8%) | 0 (0.0%) |
| Total | 414 (100.0%) | 503 (100.0%) |
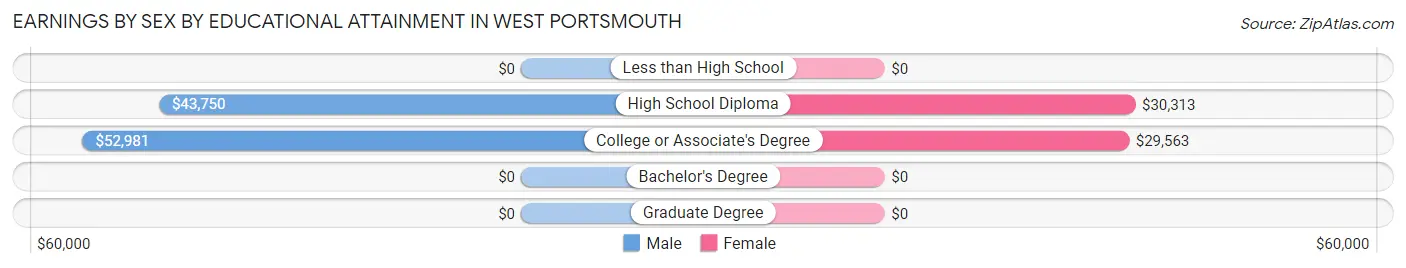
Earnings by Sex by Educational Attainment in West Portsmouth
Average earnings in West Portsmouth are $45,859 for men and $28,750 for women, a difference of 37.3%. Men with an educational attainment of college or associate's degree enjoy the highest average annual earnings of $52,981, while those with high school diploma education earn the least with $43,750. Women with an educational attainment of high school diploma earn the most with the average annual earnings of $30,313, while those with college or associate's degree education have the smallest earnings of $29,563.
| Educational Attainment | Male Income | Female Income |
| Less than High School | - | - |
| High School Diploma | $43,750 | $30,313 |
| College or Associate's Degree | $52,981 | $29,563 |
| Bachelor's Degree | - | - |
| Graduate Degree | - | - |
| Total | $45,859 | $28,750 |
Family Income in West Portsmouth
Family Income Brackets in West Portsmouth
According to the West Portsmouth family income data, there are 149 families falling into the $35,000 to $49,999 income range, which is the most common income bracket and makes up 25.4% of all families.
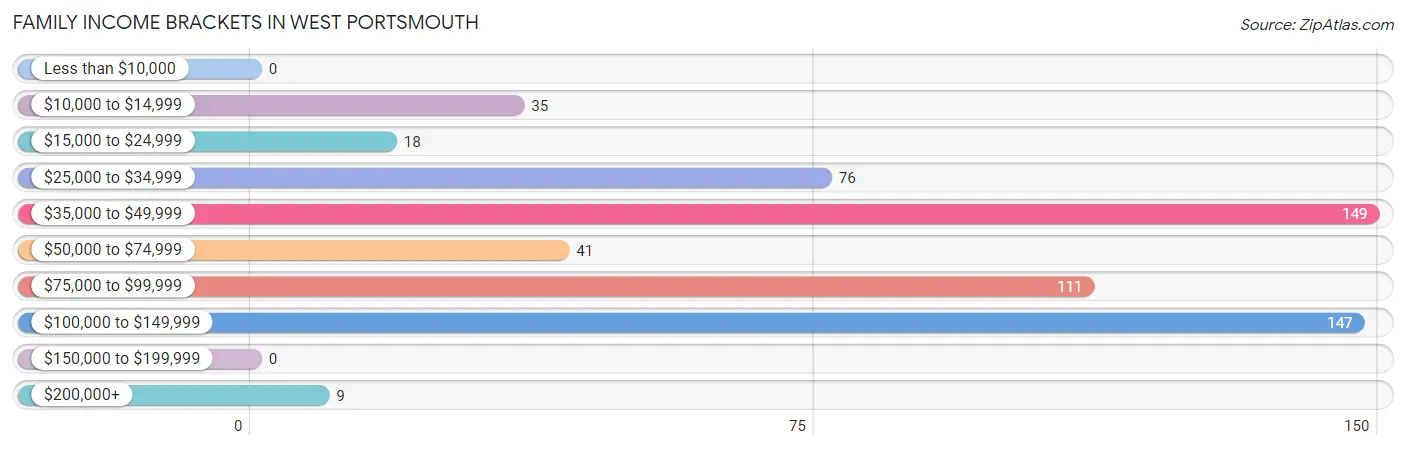
| Income Bracket | # Families | % Families |
| Less than $10,000 | 0 | 0.0% |
| $10,000 to $14,999 | 35 | 6.0% |
| $15,000 to $24,999 | 18 | 3.1% |
| $25,000 to $34,999 | 76 | 13.0% |
| $35,000 to $49,999 | 149 | 25.4% |
| $50,000 to $74,999 | 41 | 7.0% |
| $75,000 to $99,999 | 111 | 18.9% |
| $100,000 to $149,999 | 147 | 25.1% |
| $150,000 to $199,999 | 0 | 0.0% |
| $200,000+ | 9 | 1.5% |
Family Income by Famaliy Size in West Portsmouth
4-person families (74 | 12.6%) account for the highest median family income in West Portsmouth with $90,658 per family, while 4-person families (74 | 12.6%) have the highest median income of $22,664 per family member.
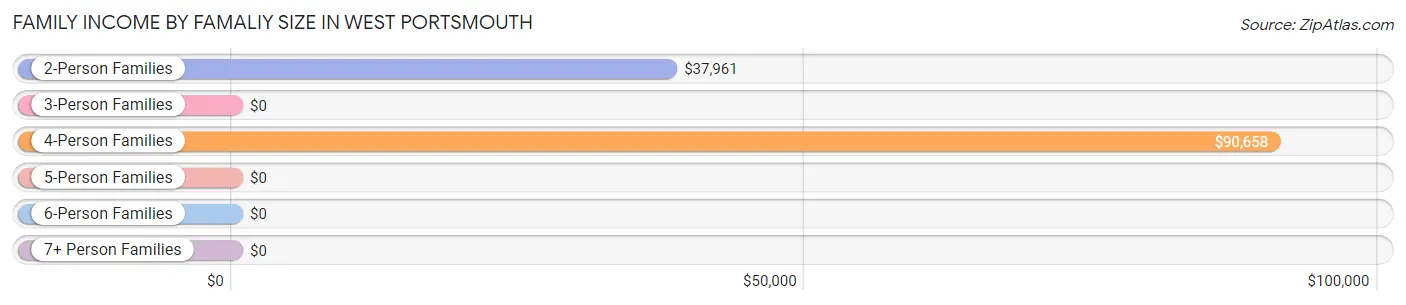
| Income Bracket | # Families | Median Income |
| 2-Person Families | 247 (42.1%) | $37,961 |
| 3-Person Families | 198 (33.8%) | $0 |
| 4-Person Families | 74 (12.6%) | $90,658 |
| 5-Person Families | 67 (11.4%) | $0 |
| 6-Person Families | 0 (0.0%) | $0 |
| 7+ Person Families | 0 (0.0%) | $0 |
| Total | 586 (100.0%) | $60,577 |
Family Income by Number of Earners in West Portsmouth
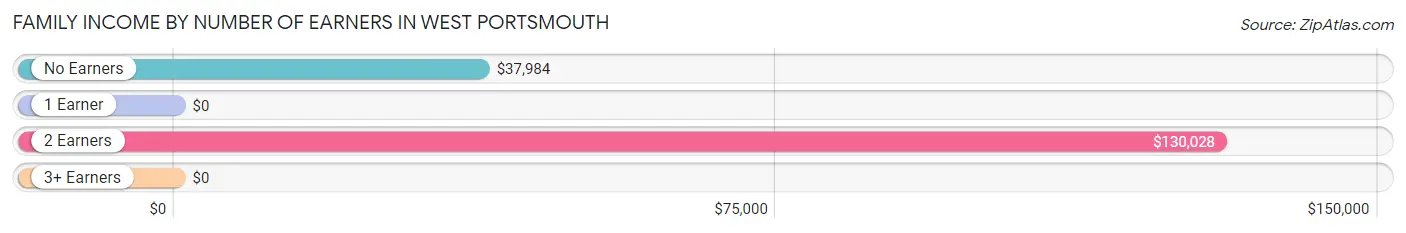
| Number of Earners | # Families | Median Income |
| No Earners | 179 (30.5%) | $37,984 |
| 1 Earner | 209 (35.7%) | $0 |
| 2 Earners | 181 (30.9%) | $130,028 |
| 3+ Earners | 17 (2.9%) | $0 |
| Total | 586 (100.0%) | $60,577 |
Household Income in West Portsmouth
Household Income Brackets in West Portsmouth
With 236 households falling in the category, the $35,000 to $49,999 income range is the most frequent in West Portsmouth, accounting for 20.3% of all households.
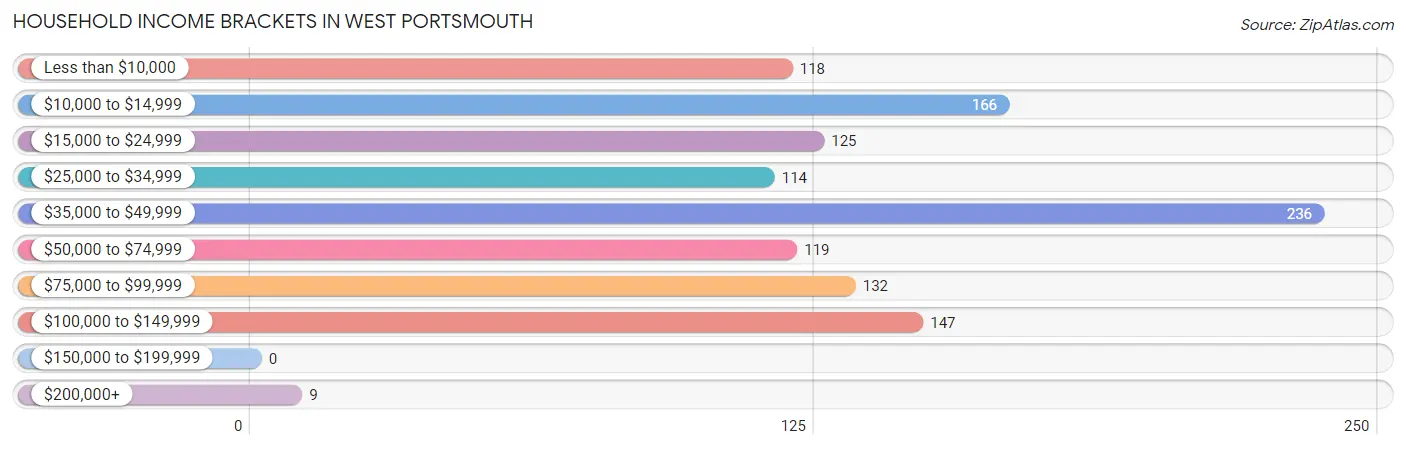
| Income Bracket | # Households | % Households |
| Less than $10,000 | 118 | 10.1% |
| $10,000 to $14,999 | 166 | 14.3% |
| $15,000 to $24,999 | 125 | 10.7% |
| $25,000 to $34,999 | 114 | 9.8% |
| $35,000 to $49,999 | 236 | 20.3% |
| $50,000 to $74,999 | 119 | 10.2% |
| $75,000 to $99,999 | 132 | 11.3% |
| $100,000 to $149,999 | 147 | 12.6% |
| $150,000 to $199,999 | 0 | 0.0% |
| $200,000+ | 9 | 0.8% |
Household Income by Householder Age in West Portsmouth
The median household income in West Portsmouth is $38,356, with the highest median household income of $52,969 found in the 25 to 44 years age bracket for the primary householder. A total of 311 households (26.7%) fall into this category. Meanwhile, the 15 to 24 years age bracket for the primary householder has the lowest median household income of $0, with 33 households (2.8%) in this group.
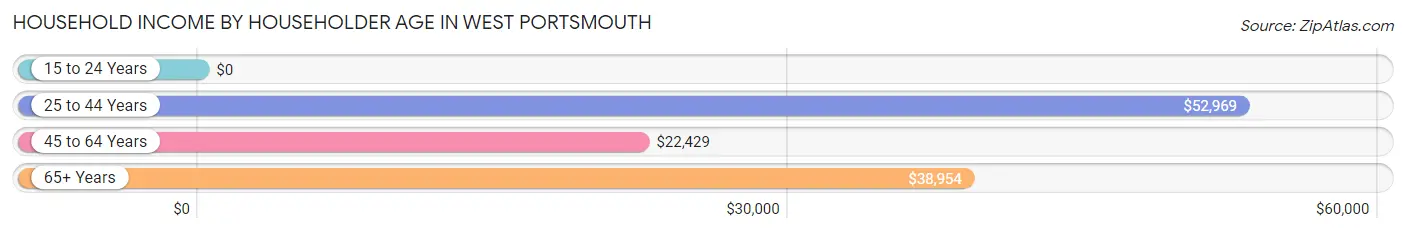
| Income Bracket | # Households | Median Income |
| 15 to 24 Years | 33 (2.8%) | $0 |
| 25 to 44 Years | 311 (26.7%) | $52,969 |
| 45 to 64 Years | 459 (39.4%) | $22,429 |
| 65+ Years | 361 (31.0%) | $38,954 |
| Total | 1,164 (100.0%) | $38,356 |
Poverty in West Portsmouth
Income Below Poverty by Sex and Age in West Portsmouth
With 18.2% poverty level for males and 20.9% for females among the residents of West Portsmouth, 45 to 54 year old males and 55 to 64 year old females are the most vulnerable to poverty, with 82 males (66.7%) and 151 females (65.4%) in their respective age groups living below the poverty level.
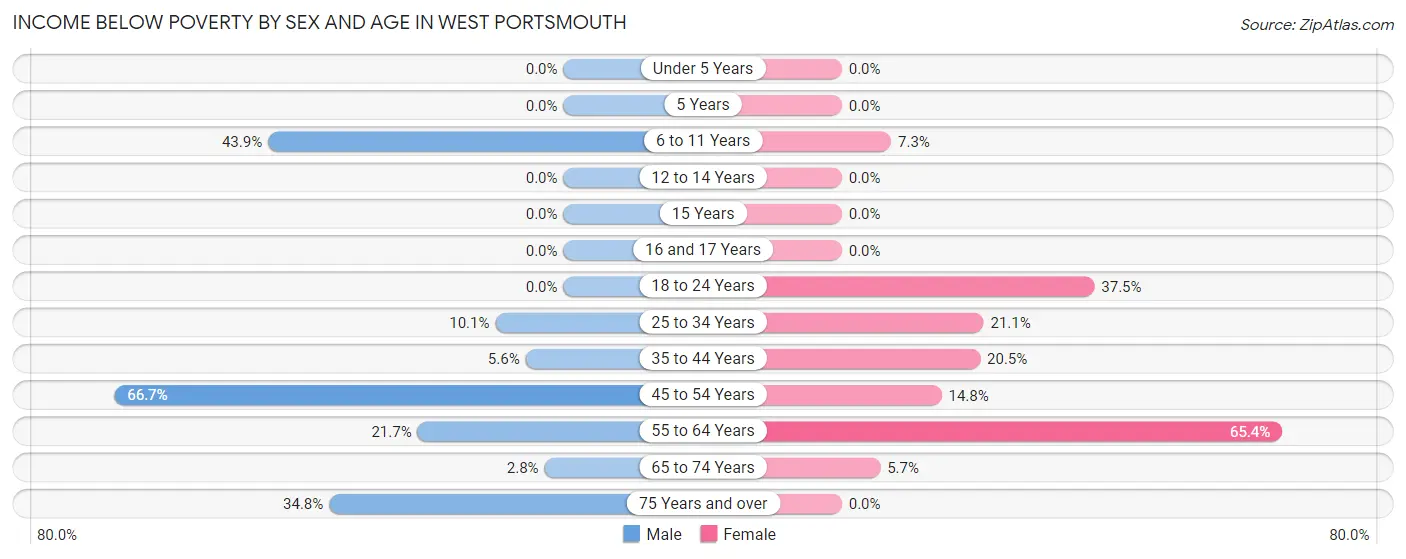
| Age Bracket | Male | Female |
| Under 5 Years | 0 (0.0%) | 0 (0.0%) |
| 5 Years | 0 (0.0%) | 0 (0.0%) |
| 6 to 11 Years | 50 (43.9%) | 9 (7.3%) |
| 12 to 14 Years | 0 (0.0%) | 0 (0.0%) |
| 15 Years | 0 (0.0%) | 0 (0.0%) |
| 16 and 17 Years | 0 (0.0%) | 0 (0.0%) |
| 18 to 24 Years | 0 (0.0%) | 21 (37.5%) |
| 25 to 34 Years | 9 (10.1%) | 24 (21.0%) |
| 35 to 44 Years | 10 (5.6%) | 38 (20.5%) |
| 45 to 54 Years | 82 (66.7%) | 12 (14.8%) |
| 55 to 64 Years | 47 (21.7%) | 151 (65.4%) |
| 65 to 74 Years | 7 (2.8%) | 13 (5.7%) |
| 75 Years and over | 24 (34.8%) | 0 (0.0%) |
| Total | 229 (18.2%) | 268 (20.9%) |
Income Above Poverty by Sex and Age in West Portsmouth
According to the poverty statistics in West Portsmouth, males aged under 5 years and females aged under 5 years are the age groups that are most secure financially, with 100.0% of males and 100.0% of females in these age groups living above the poverty line.
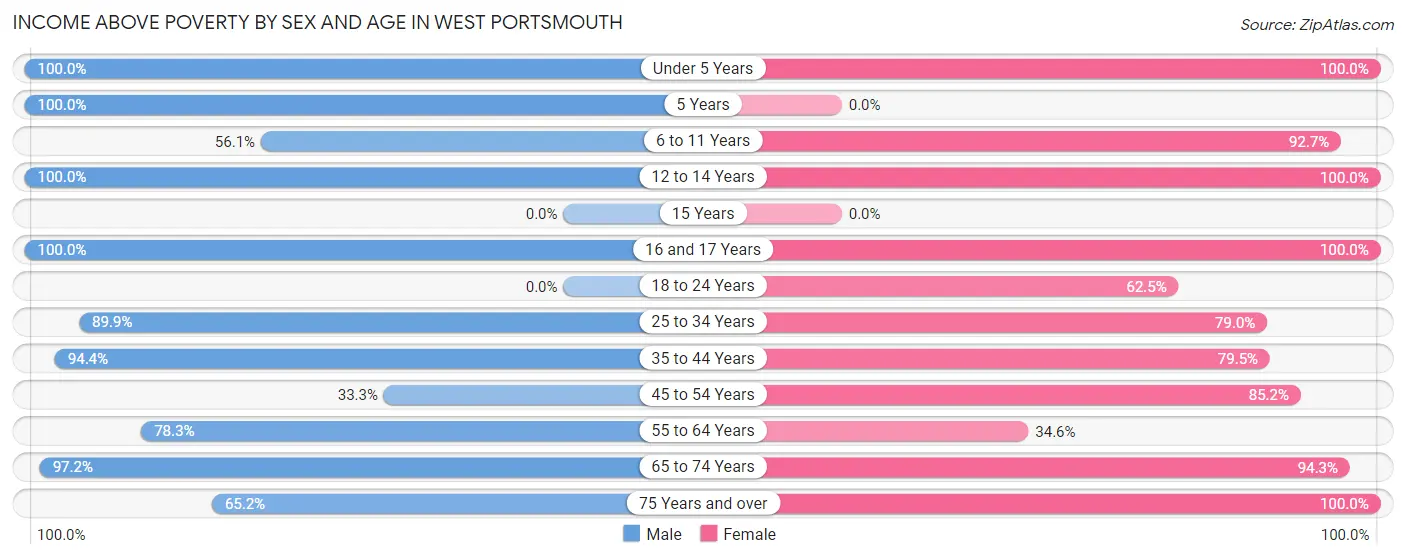
| Age Bracket | Male | Female |
| Under 5 Years | 72 (100.0%) | 79 (100.0%) |
| 5 Years | 119 (100.0%) | 0 (0.0%) |
| 6 to 11 Years | 64 (56.1%) | 114 (92.7%) |
| 12 to 14 Years | 17 (100.0%) | 45 (100.0%) |
| 15 Years | 0 (0.0%) | 0 (0.0%) |
| 16 and 17 Years | 12 (100.0%) | 40 (100.0%) |
| 18 to 24 Years | 0 (0.0%) | 35 (62.5%) |
| 25 to 34 Years | 80 (89.9%) | 90 (78.9%) |
| 35 to 44 Years | 168 (94.4%) | 147 (79.5%) |
| 45 to 54 Years | 41 (33.3%) | 69 (85.2%) |
| 55 to 64 Years | 170 (78.3%) | 80 (34.6%) |
| 65 to 74 Years | 242 (97.2%) | 215 (94.3%) |
| 75 Years and over | 45 (65.2%) | 99 (100.0%) |
| Total | 1,030 (81.8%) | 1,013 (79.1%) |
Income Below Poverty Among Married-Couple Families in West Portsmouth
The poverty statistics for married-couple families in West Portsmouth show that 3.1% or 16 of the total 516 families live below the poverty line. Families with 1 or 2 children have the highest poverty rate of 4.2%, comprising of 9 families. On the other hand, families with 3 or 4 children have the lowest poverty rate of 0.0%, which includes 0 families.
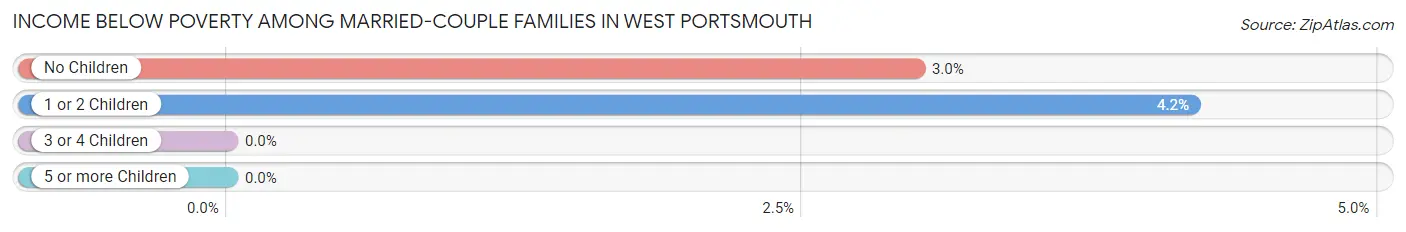
| Children | Above Poverty | Below Poverty |
| No Children | 227 (97.0%) | 7 (3.0%) |
| 1 or 2 Children | 206 (95.8%) | 9 (4.2%) |
| 3 or 4 Children | 67 (100.0%) | 0 (0.0%) |
| 5 or more Children | 0 (0.0%) | 0 (0.0%) |
| Total | 500 (96.9%) | 16 (3.1%) |
Income Below Poverty Among Single-Parent Households in West Portsmouth
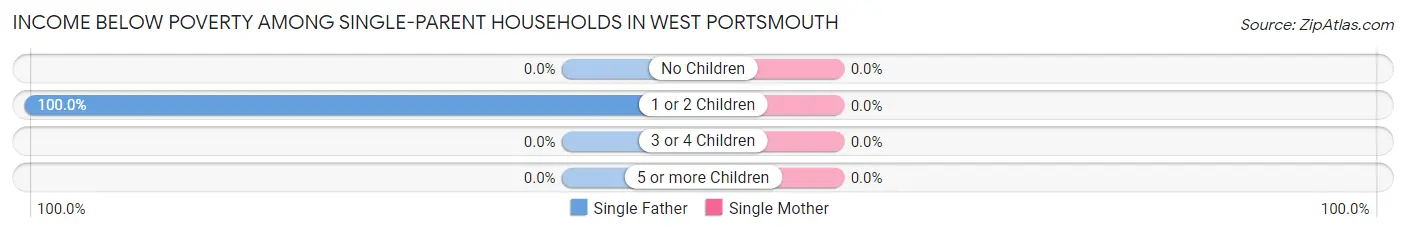
| Children | Single Father | Single Mother |
| No Children | 0 (0.0%) | 0 (0.0%) |
| 1 or 2 Children | 35 (100.0%) | 0 (0.0%) |
| 3 or 4 Children | 0 (0.0%) | 0 (0.0%) |
| 5 or more Children | 0 (0.0%) | 0 (0.0%) |
| Total | 35 (76.1%) | 0 (0.0%) |
Income Below Poverty Among Married-Couple vs Single-Parent Households in West Portsmouth
The poverty data for West Portsmouth shows that 16 of the married-couple family households (3.1%) and 35 of the single-parent households (50.0%) are living below the poverty level. Within the married-couple family households, those with 1 or 2 children have the highest poverty rate, with 9 households (4.2%) falling below the poverty line. Among the single-parent households, those with 1 or 2 children have the highest poverty rate, with 35 household (59.3%) living below poverty.
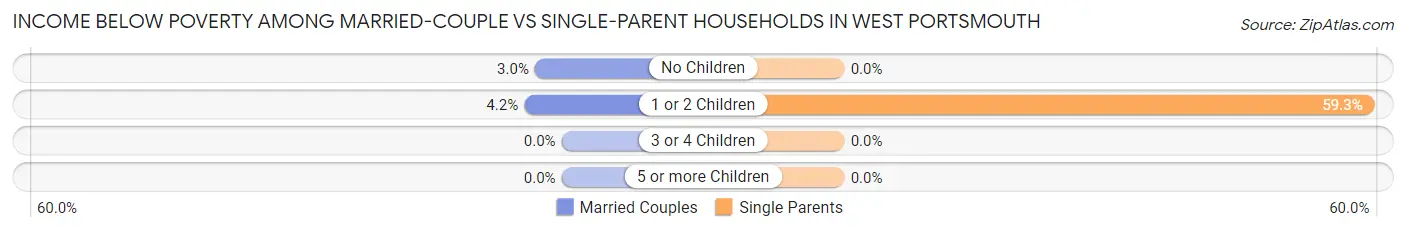
| Children | Married-Couple Families | Single-Parent Households |
| No Children | 7 (3.0%) | 0 (0.0%) |
| 1 or 2 Children | 9 (4.2%) | 35 (59.3%) |
| 3 or 4 Children | 0 (0.0%) | 0 (0.0%) |
| 5 or more Children | 0 (0.0%) | 0 (0.0%) |
| Total | 16 (3.1%) | 35 (50.0%) |
Race in West Portsmouth
The most populous races in West Portsmouth are White / Caucasian (2,414 | 95.0%), Two or more Races (58 | 2.3%), and Asian (40 | 1.6%).
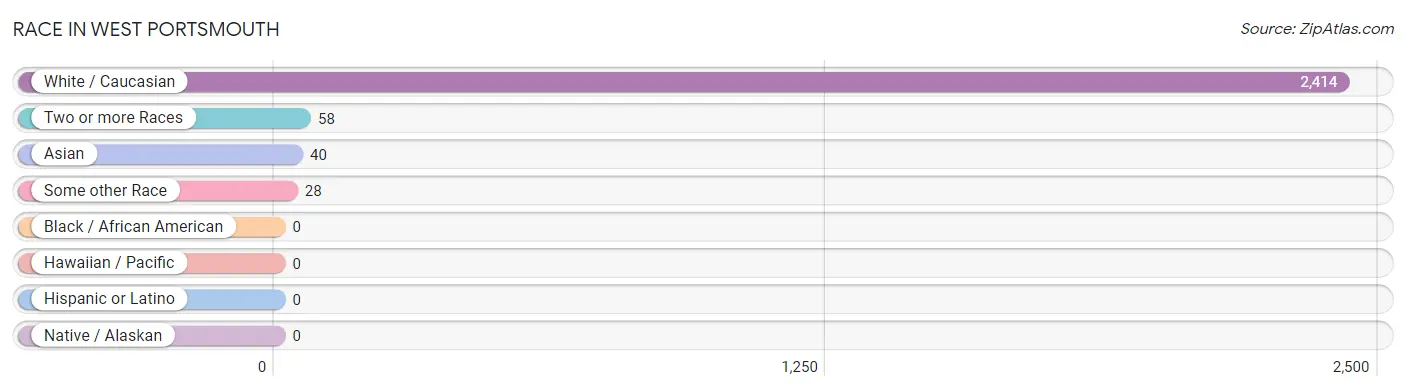
| Race | # Population | % Population |
| Asian | 40 | 1.6% |
| Black / African American | 0 | 0.0% |
| Hawaiian / Pacific | 0 | 0.0% |
| Hispanic or Latino | 0 | 0.0% |
| Native / Alaskan | 0 | 0.0% |
| White / Caucasian | 2,414 | 95.0% |
| Two or more Races | 58 | 2.3% |
| Some other Race | 28 | 1.1% |
| Total | 2,540 | 100.0% |
Ancestry in West Portsmouth
The most populous ancestries reported in West Portsmouth are Irish (286 | 11.3%), German (270 | 10.6%), English (255 | 10.0%), American (160 | 6.3%), and Scotch-Irish (72 | 2.8%), together accounting for 41.1% of all West Portsmouth residents.
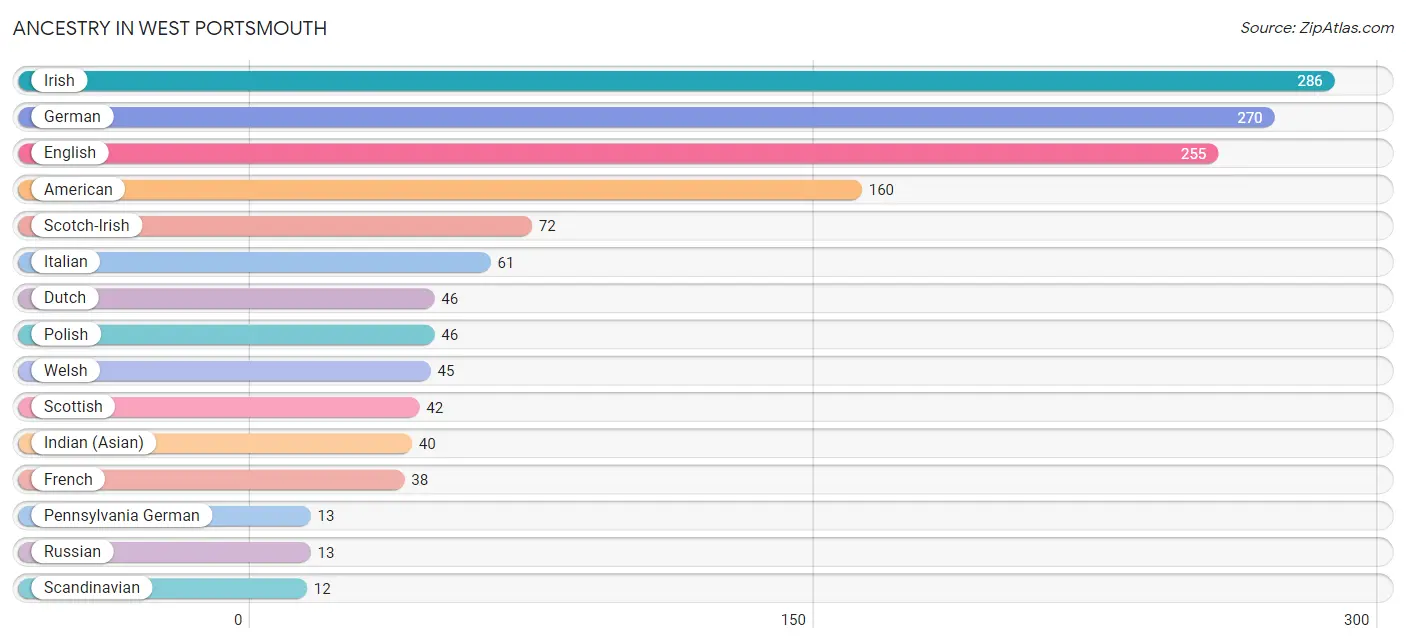
| Ancestry | # Population | % Population |
| American | 160 | 6.3% |
| Dutch | 46 | 1.8% |
| English | 255 | 10.0% |
| French | 38 | 1.5% |
| German | 270 | 10.6% |
| Indian (Asian) | 40 | 1.6% |
| Irish | 286 | 11.3% |
| Italian | 61 | 2.4% |
| Pennsylvania German | 13 | 0.5% |
| Polish | 46 | 1.8% |
| Russian | 13 | 0.5% |
| Scandinavian | 12 | 0.5% |
| Scotch-Irish | 72 | 2.8% |
| Scottish | 42 | 1.7% |
| Welsh | 45 | 1.8% | View All 15 Rows |
Immigrants in West Portsmouth
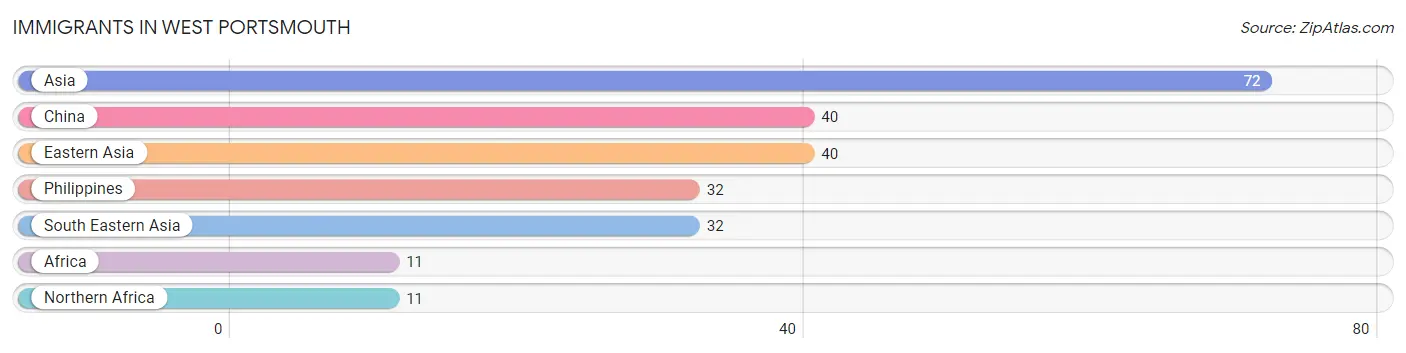
The most numerous immigrant groups reported in West Portsmouth came from Asia (72 | 2.8%), China (40 | 1.6%), Eastern Asia (40 | 1.6%), Philippines (32 | 1.3%), and South Eastern Asia (32 | 1.3%), together accounting for 8.5% of all West Portsmouth residents.
| Immigration Origin | # Population | % Population |
| Africa | 11 | 0.4% |
| Asia | 72 | 2.8% |
| China | 40 | 1.6% |
| Eastern Asia | 40 | 1.6% |
| Northern Africa | 11 | 0.4% |
| Philippines | 32 | 1.3% |
| South Eastern Asia | 32 | 1.3% | View All 7 Rows |
Sex and Age in West Portsmouth
Sex and Age in West Portsmouth
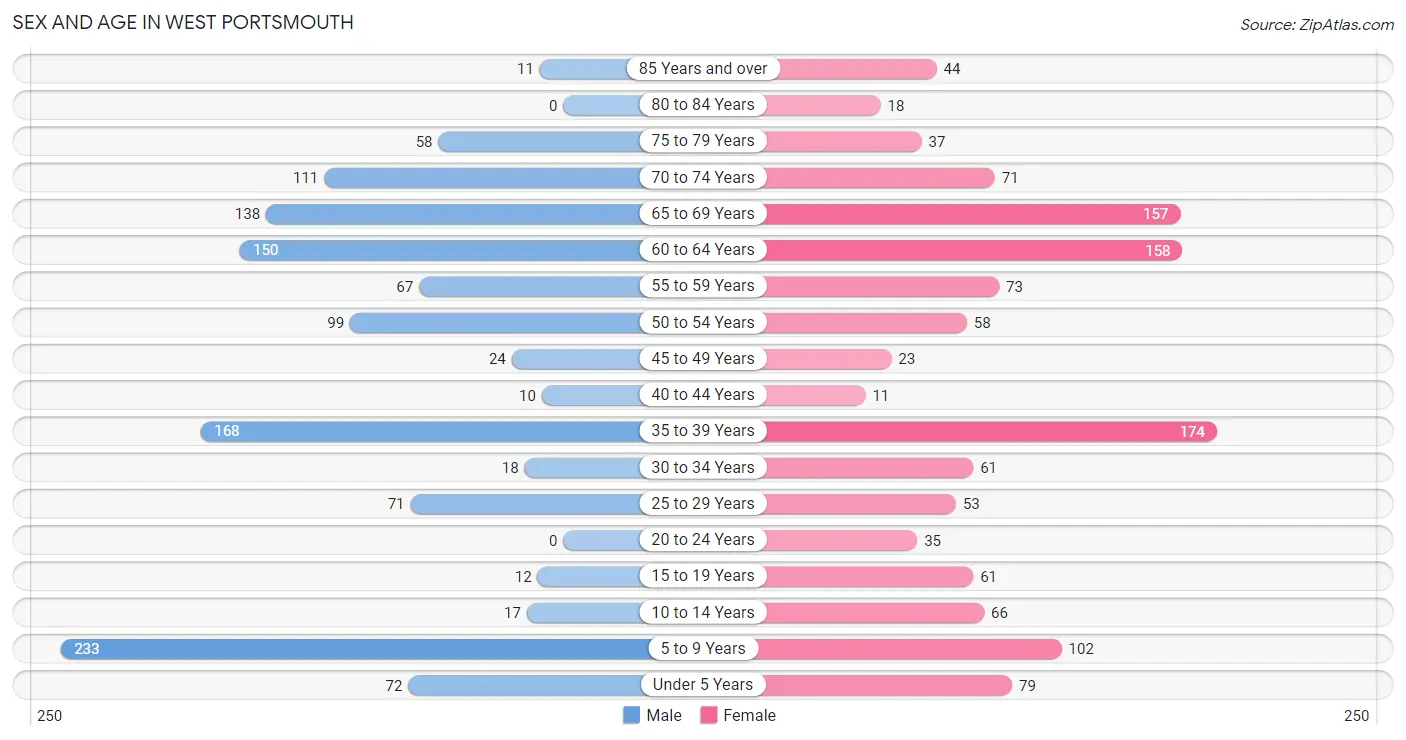
The most populous age groups in West Portsmouth are 5 to 9 Years (233 | 18.5%) for men and 35 to 39 Years (174 | 13.6%) for women.
| Age Bracket | Male | Female |
| Under 5 Years | 72 (5.7%) | 79 (6.2%) |
| 5 to 9 Years | 233 (18.5%) | 102 (8.0%) |
| 10 to 14 Years | 17 (1.3%) | 66 (5.1%) |
| 15 to 19 Years | 12 (0.9%) | 61 (4.8%) |
| 20 to 24 Years | 0 (0.0%) | 35 (2.7%) |
| 25 to 29 Years | 71 (5.6%) | 53 (4.1%) |
| 30 to 34 Years | 18 (1.4%) | 61 (4.8%) |
| 35 to 39 Years | 168 (13.3%) | 174 (13.6%) |
| 40 to 44 Years | 10 (0.8%) | 11 (0.9%) |
| 45 to 49 Years | 24 (1.9%) | 23 (1.8%) |
| 50 to 54 Years | 99 (7.9%) | 58 (4.5%) |
| 55 to 59 Years | 67 (5.3%) | 73 (5.7%) |
| 60 to 64 Years | 150 (11.9%) | 158 (12.3%) |
| 65 to 69 Years | 138 (11.0%) | 157 (12.3%) |
| 70 to 74 Years | 111 (8.8%) | 71 (5.5%) |
| 75 to 79 Years | 58 (4.6%) | 37 (2.9%) |
| 80 to 84 Years | 0 (0.0%) | 18 (1.4%) |
| 85 Years and over | 11 (0.9%) | 44 (3.4%) |
| Total | 1,259 (100.0%) | 1,281 (100.0%) |
Families and Households in West Portsmouth
Median Family Size in West Portsmouth
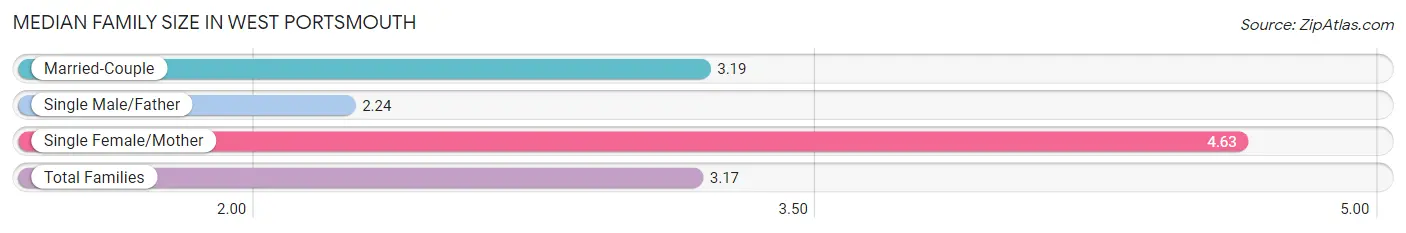
The median family size in West Portsmouth is 3.17 persons per family, with single female/mother families (24 | 4.1%) accounting for the largest median family size of 4.63 persons per family. On the other hand, single male/father families (46 | 7.9%) represent the smallest median family size with 2.24 persons per family.
| Family Type | # Families | Family Size |
| Married-Couple | 516 (88.0%) | 3.19 |
| Single Male/Father | 46 (7.9%) | 2.24 |
| Single Female/Mother | 24 (4.1%) | 4.63 |
| Total Families | 586 (100.0%) | 3.17 |
Median Household Size in West Portsmouth
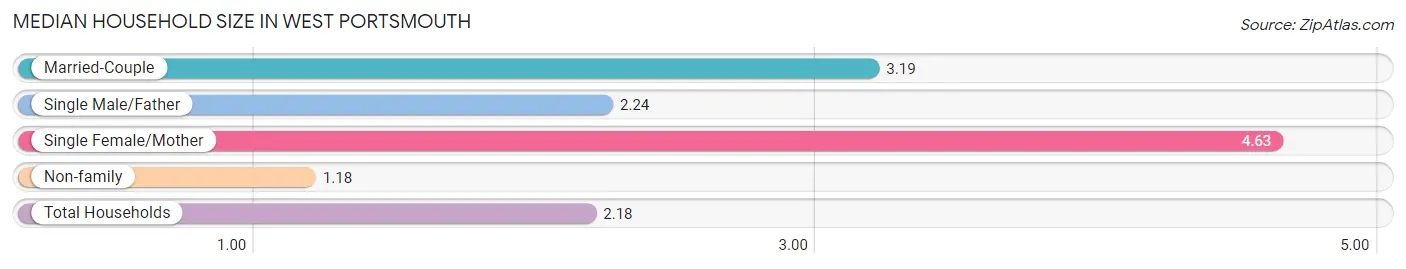
The median household size in West Portsmouth is 2.18 persons per household, with single female/mother households (24 | 2.1%) accounting for the largest median household size of 4.63 persons per household. non-family households (578 | 49.7%) represent the smallest median household size with 1.18 persons per household.
| Household Type | # Households | Household Size |
| Married-Couple | 516 (44.3%) | 3.19 |
| Single Male/Father | 46 (4.0%) | 2.24 |
| Single Female/Mother | 24 (2.1%) | 4.63 |
| Non-family | 578 (49.7%) | 1.18 |
| Total Households | 1,164 (100.0%) | 2.18 |
Household Size by Marriage Status in West Portsmouth
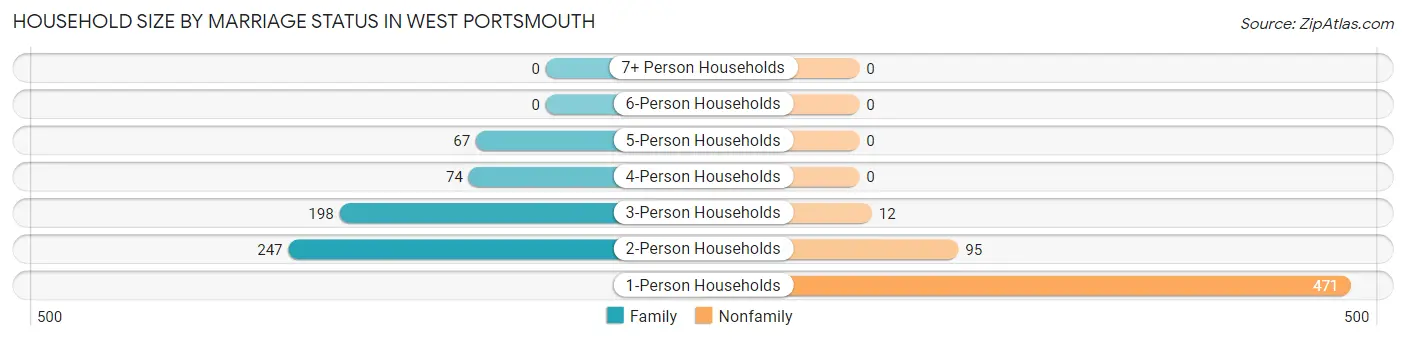
Out of a total of 1,164 households in West Portsmouth, 586 (50.3%) are family households, while 578 (49.7%) are nonfamily households. The most numerous type of family households are 2-person households, comprising 247, and the most common type of nonfamily households are 1-person households, comprising 471.
| Household Size | Family Households | Nonfamily Households |
| 1-Person Households | - | 471 (40.5%) |
| 2-Person Households | 247 (21.2%) | 95 (8.2%) |
| 3-Person Households | 198 (17.0%) | 12 (1.0%) |
| 4-Person Households | 74 (6.4%) | 0 (0.0%) |
| 5-Person Households | 67 (5.8%) | 0 (0.0%) |
| 6-Person Households | 0 (0.0%) | 0 (0.0%) |
| 7+ Person Households | 0 (0.0%) | 0 (0.0%) |
| Total | 586 (50.3%) | 578 (49.7%) |
Female Fertility in West Portsmouth
Fertility by Age in West Portsmouth
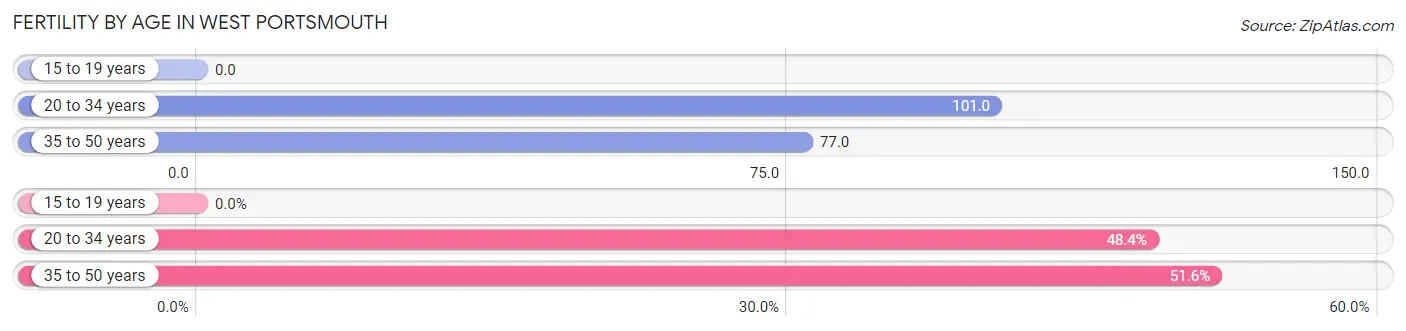
Average fertility rate in West Portsmouth is 74.0 births per 1,000 women. Women in the age bracket of 20 to 34 years have the highest fertility rate with 101.0 births per 1,000 women. Women in the age bracket of 35 to 50 years acount for 51.6% of all women with births.
| Age Bracket | Women with Births | Births / 1,000 Women |
| 15 to 19 years | 0 (0.0%) | 0.0 |
| 20 to 34 years | 15 (48.4%) | 101.0 |
| 35 to 50 years | 16 (51.6%) | 77.0 |
| Total | 31 (100.0%) | 74.0 |
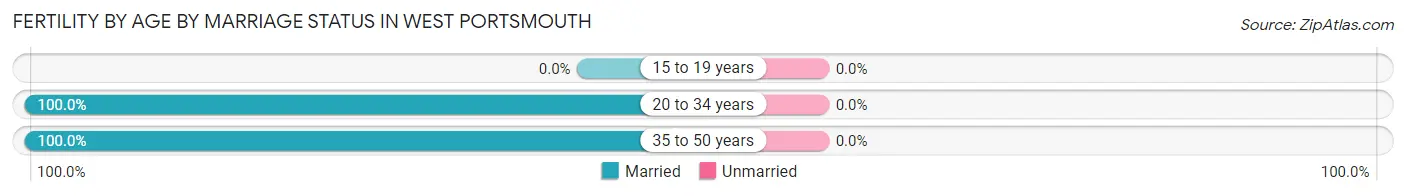
Fertility by Age by Marriage Status in West Portsmouth
| Age Bracket | Married | Unmarried |
| 15 to 19 years | 0 (0.0%) | 0 (0.0%) |
| 20 to 34 years | 15 (100.0%) | 0 (0.0%) |
| 35 to 50 years | 16 (100.0%) | 0 (0.0%) |
| Total | 31 (100.0%) | 0 (0.0%) |
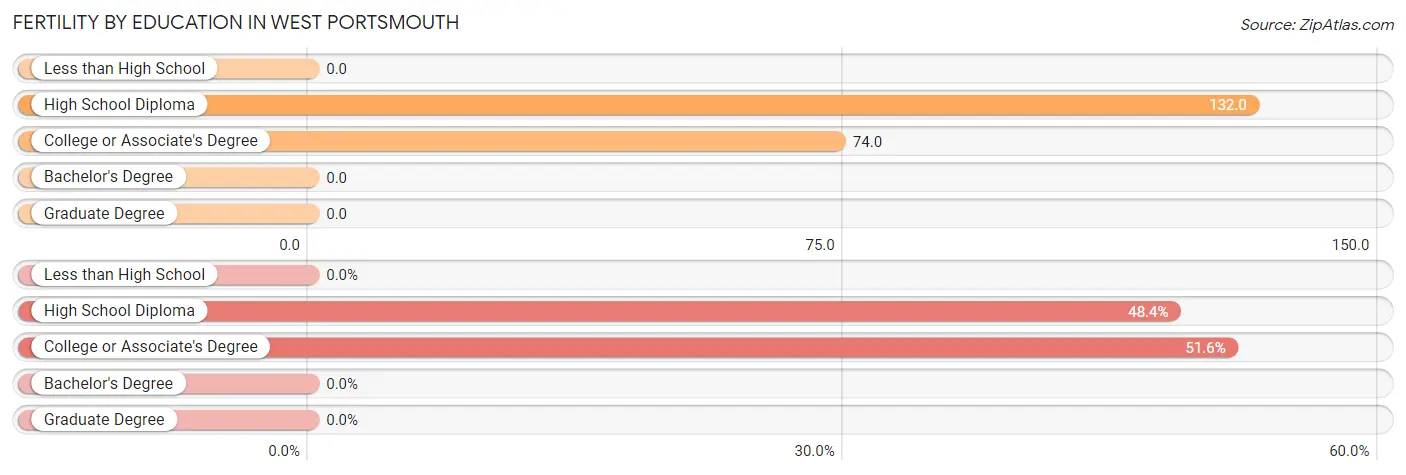
Fertility by Education in West Portsmouth
| Educational Attainment | Women with Births | Births / 1,000 Women |
| Less than High School | 0 (0.0%) | 0.0 |
| High School Diploma | 15 (48.4%) | 132.0 |
| College or Associate's Degree | 16 (51.6%) | 74.0 |
| Bachelor's Degree | 0 (0.0%) | 0.0 |
| Graduate Degree | 0 (0.0%) | 0.0 |
| Total | 31 (100.0%) | 74.0 |
Fertility by Education by Marriage Status in West Portsmouth
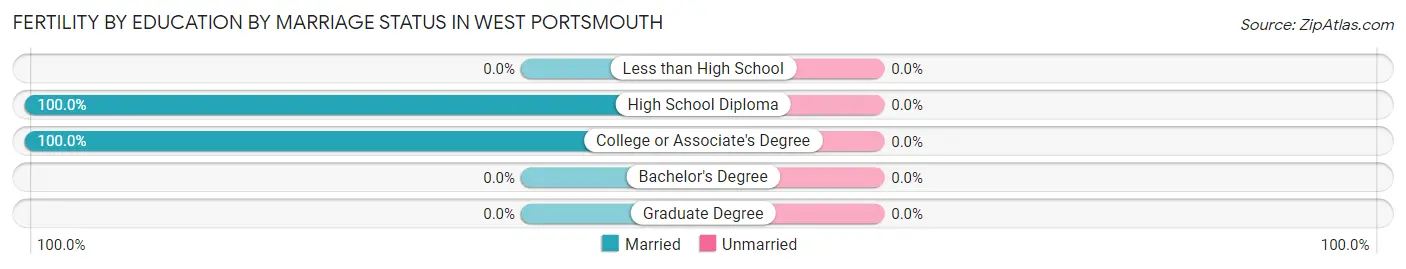
| Educational Attainment | Married | Unmarried |
| Less than High School | 0 (0.0%) | 0 (0.0%) |
| High School Diploma | 15 (100.0%) | 0 (0.0%) |
| College or Associate's Degree | 16 (100.0%) | 0 (0.0%) |
| Bachelor's Degree | 0 (0.0%) | 0 (0.0%) |
| Graduate Degree | 0 (0.0%) | 0 (0.0%) |
| Total | 31 (100.0%) | 0 (0.0%) |
Employment Characteristics in West Portsmouth
Employment by Class of Employer in West Portsmouth
Among the 869 employed individuals in West Portsmouth, private company employees (604 | 69.5%), local government employees (97 | 11.2%), and self-employed (not incorporated) (70 | 8.1%) make up the most common classes of employment.
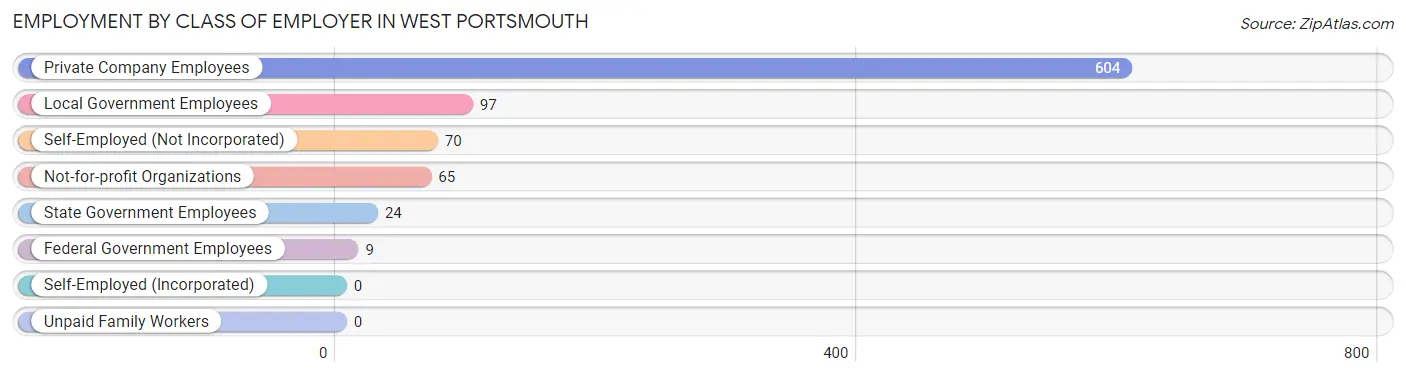
| Employer Class | # Employees | % Employees |
| Private Company Employees | 604 | 69.5% |
| Self-Employed (Incorporated) | 0 | 0.0% |
| Self-Employed (Not Incorporated) | 70 | 8.1% |
| Not-for-profit Organizations | 65 | 7.5% |
| Local Government Employees | 97 | 11.2% |
| State Government Employees | 24 | 2.8% |
| Federal Government Employees | 9 | 1.0% |
| Unpaid Family Workers | 0 | 0.0% |
| Total | 869 | 100.0% |
Employment Status by Age in West Portsmouth
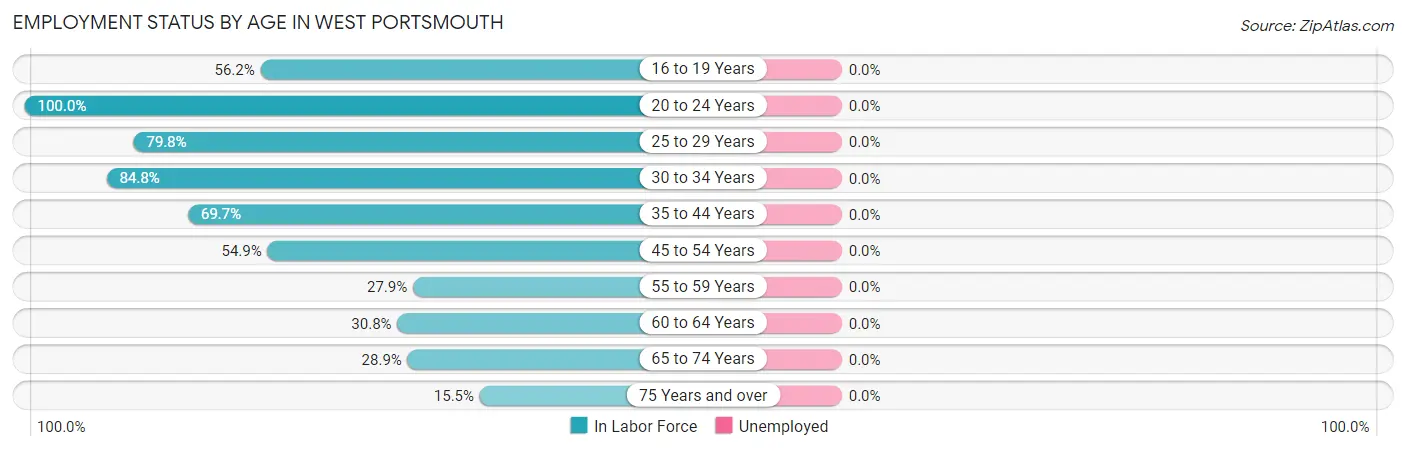
| Age Bracket | In Labor Force | Unemployed |
| 16 to 19 Years | 41 (56.2%) | 0 (0.0%) |
| 20 to 24 Years | 35 (100.0%) | 0 (0.0%) |
| 25 to 29 Years | 99 (79.8%) | 0 (0.0%) |
| 30 to 34 Years | 67 (84.8%) | 0 (0.0%) |
| 35 to 44 Years | 253 (69.7%) | 0 (0.0%) |
| 45 to 54 Years | 112 (54.9%) | 0 (0.0%) |
| 55 to 59 Years | 39 (27.9%) | 0 (0.0%) |
| 60 to 64 Years | 95 (30.8%) | 0 (0.0%) |
| 65 to 74 Years | 138 (28.9%) | 0 (0.0%) |
| 75 Years and over | 26 (15.5%) | 0 (0.0%) |
| Total | 905 (45.9%) | 0 (0.0%) |
Employment Status by Educational Attainment in West Portsmouth
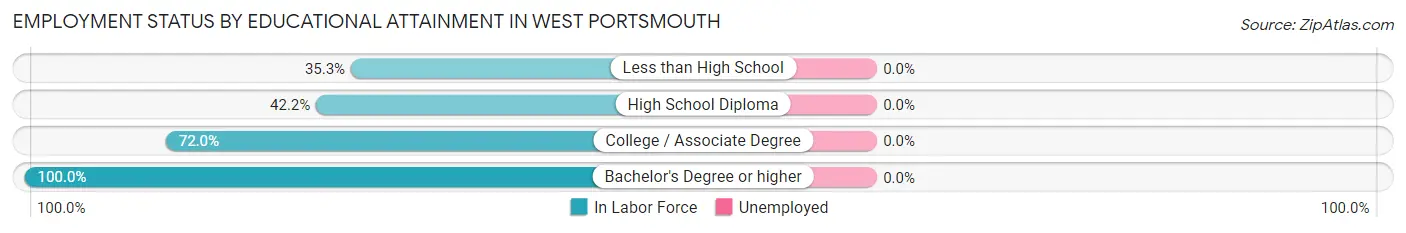
| Educational Attainment | In Labor Force | Unemployed |
| Less than High School | 55 (35.3%) | 0 (0.0%) |
| High School Diploma | 253 (42.2%) | 0 (0.0%) |
| College / Associate Degree | 272 (72.0%) | 0 (0.0%) |
| Bachelor's Degree or higher | 85 (100.0%) | 0 (0.0%) |
| Total | 665 (54.6%) | 0 (0.0%) |
Employment Occupations by Sex in West Portsmouth
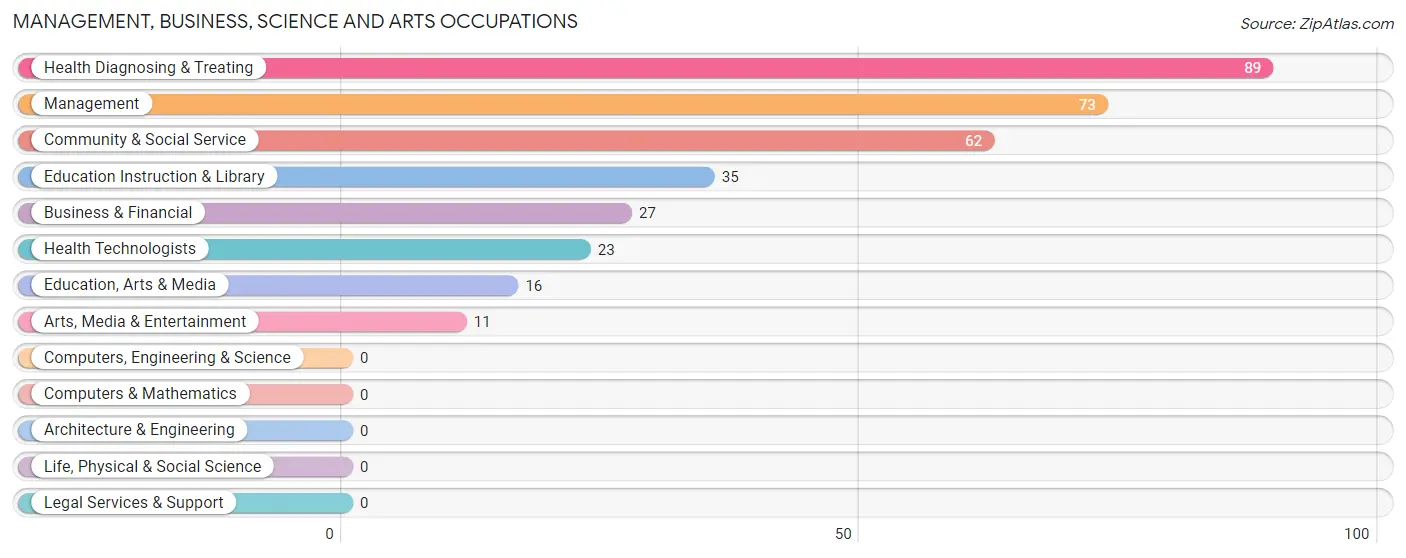
Management, Business, Science and Arts Occupations
The most common Management, Business, Science and Arts occupations in West Portsmouth are Health Diagnosing & Treating (89 | 9.8%), Management (73 | 8.1%), Community & Social Service (62 | 6.9%), Education Instruction & Library (35 | 3.9%), and Business & Financial (27 | 3.0%).
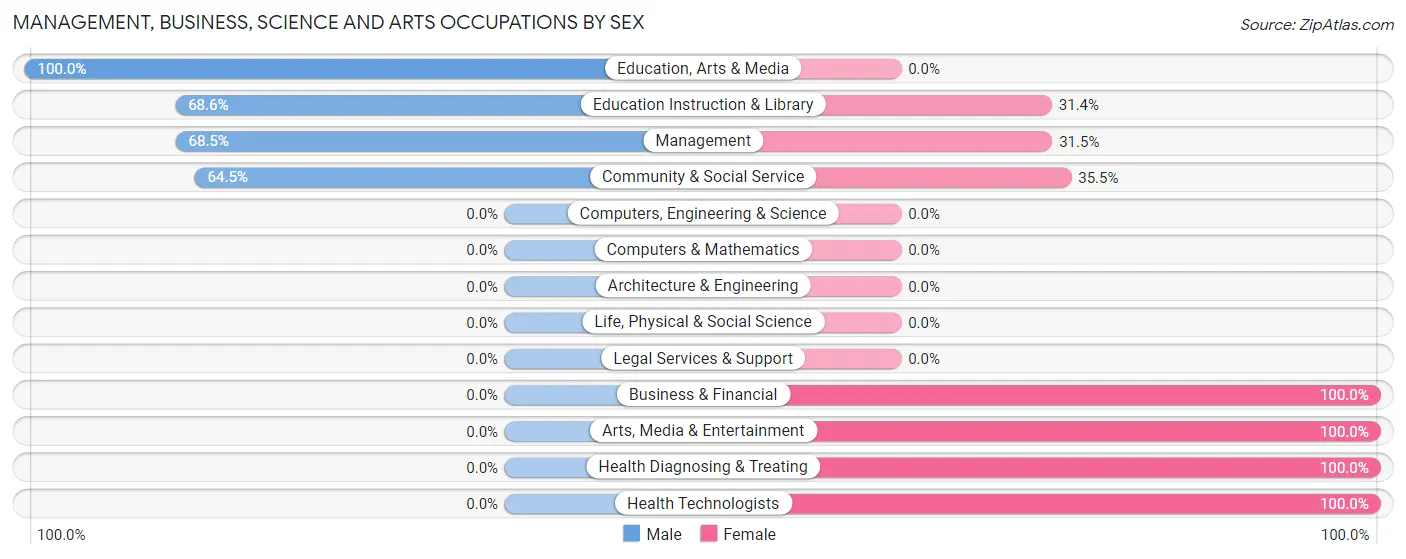
Management, Business, Science and Arts Occupations by Sex
Within the Management, Business, Science and Arts occupations in West Portsmouth, the most male-oriented occupations are Education, Arts & Media (100.0%), Education Instruction & Library (68.6%), and Management (68.5%), while the most female-oriented occupations are Business & Financial (100.0%), Arts, Media & Entertainment (100.0%), and Health Diagnosing & Treating (100.0%).
| Occupation | Male | Female |
| Management | 50 (68.5%) | 23 (31.5%) |
| Business & Financial | 0 (0.0%) | 27 (100.0%) |
| Computers, Engineering & Science | 0 (0.0%) | 0 (0.0%) |
| Computers & Mathematics | 0 (0.0%) | 0 (0.0%) |
| Architecture & Engineering | 0 (0.0%) | 0 (0.0%) |
| Life, Physical & Social Science | 0 (0.0%) | 0 (0.0%) |
| Community & Social Service | 40 (64.5%) | 22 (35.5%) |
| Education, Arts & Media | 16 (100.0%) | 0 (0.0%) |
| Legal Services & Support | 0 (0.0%) | 0 (0.0%) |
| Education Instruction & Library | 24 (68.6%) | 11 (31.4%) |
| Arts, Media & Entertainment | 0 (0.0%) | 11 (100.0%) |
| Health Diagnosing & Treating | 0 (0.0%) | 89 (100.0%) |
| Health Technologists | 0 (0.0%) | 23 (100.0%) |
| Total (Category) | 90 (35.9%) | 161 (64.1%) |
| Total (Overall) | 414 (45.8%) | 491 (54.2%) |
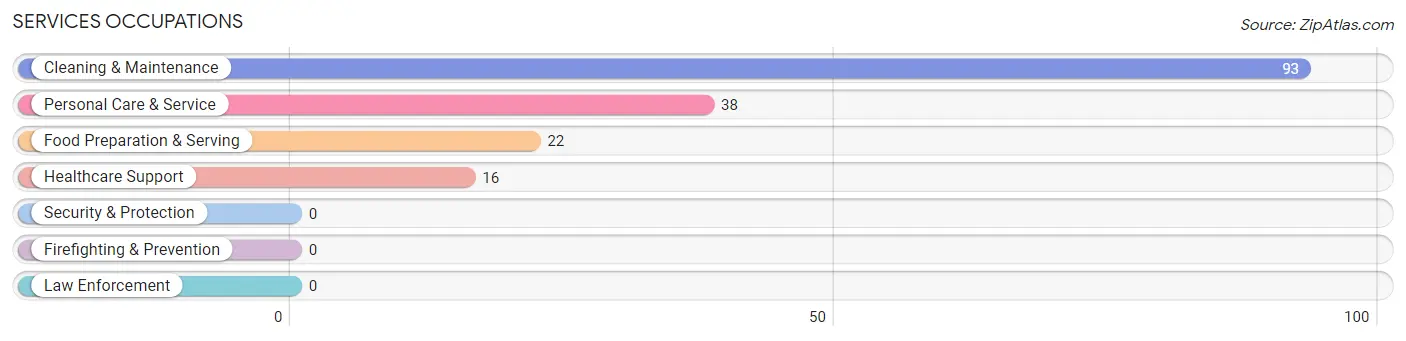
Services Occupations
The most common Services occupations in West Portsmouth are Cleaning & Maintenance (93 | 10.3%), Personal Care & Service (38 | 4.2%), Food Preparation & Serving (22 | 2.4%), and Healthcare Support (16 | 1.8%).
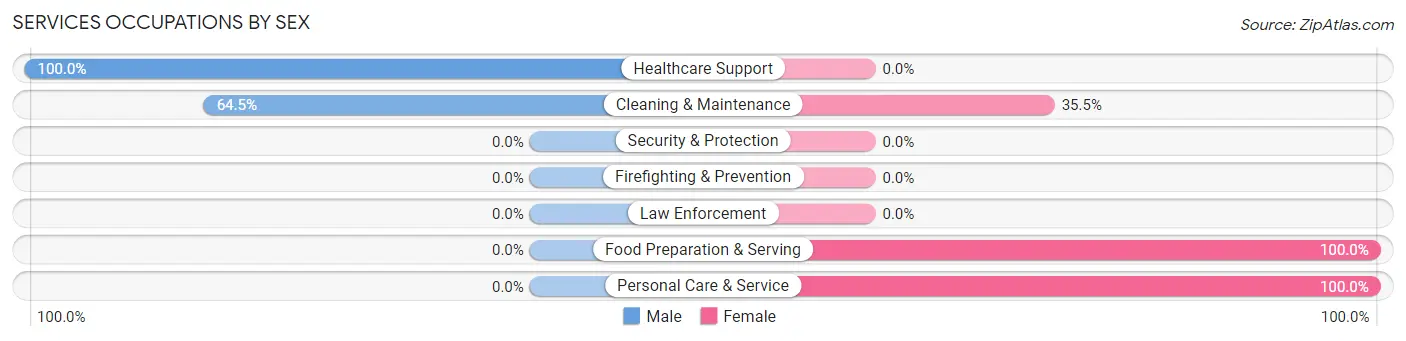
Services Occupations by Sex
Within the Services occupations in West Portsmouth, the most male-oriented occupations are Healthcare Support (100.0%), and Cleaning & Maintenance (64.5%), while the most female-oriented occupations are Food Preparation & Serving (100.0%), Personal Care & Service (100.0%), and Cleaning & Maintenance (35.5%).
| Occupation | Male | Female |
| Healthcare Support | 16 (100.0%) | 0 (0.0%) |
| Security & Protection | 0 (0.0%) | 0 (0.0%) |
| Firefighting & Prevention | 0 (0.0%) | 0 (0.0%) |
| Law Enforcement | 0 (0.0%) | 0 (0.0%) |
| Food Preparation & Serving | 0 (0.0%) | 22 (100.0%) |
| Cleaning & Maintenance | 60 (64.5%) | 33 (35.5%) |
| Personal Care & Service | 0 (0.0%) | 38 (100.0%) |
| Total (Category) | 76 (45.0%) | 93 (55.0%) |
| Total (Overall) | 414 (45.8%) | 491 (54.2%) |
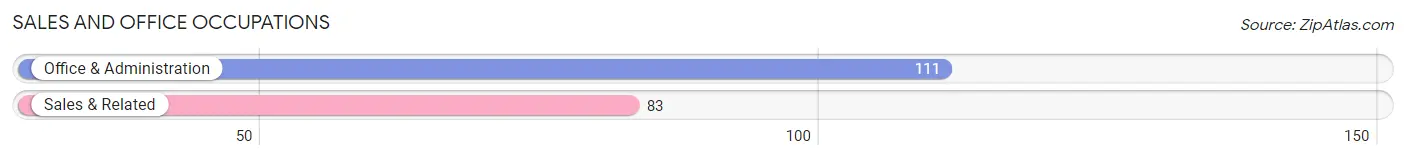
Sales and Office Occupations
The most common Sales and Office occupations in West Portsmouth are Office & Administration (111 | 12.3%), and Sales & Related (83 | 9.2%).
Sales and Office Occupations by Sex
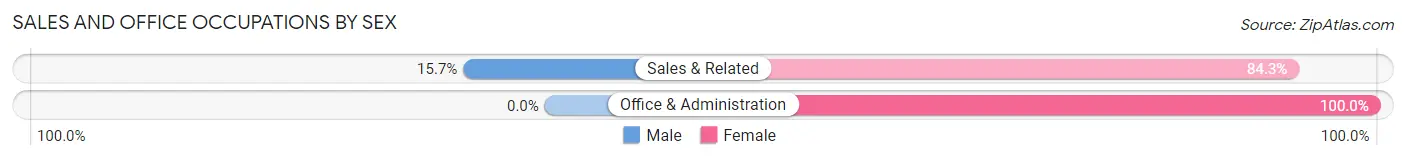
| Occupation | Male | Female |
| Sales & Related | 13 (15.7%) | 70 (84.3%) |
| Office & Administration | 0 (0.0%) | 111 (100.0%) |
| Total (Category) | 13 (6.7%) | 181 (93.3%) |
| Total (Overall) | 414 (45.8%) | 491 (54.2%) |
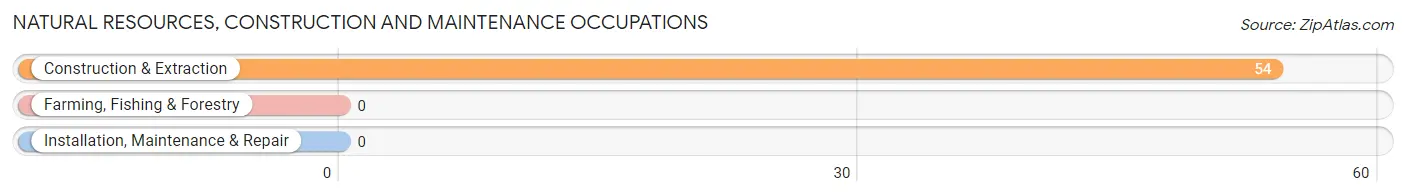
Natural Resources, Construction and Maintenance Occupations
The most common Natural Resources, Construction and Maintenance occupations in West Portsmouth are , and Construction & Extraction (54 | 6.0%).
Natural Resources, Construction and Maintenance Occupations by Sex
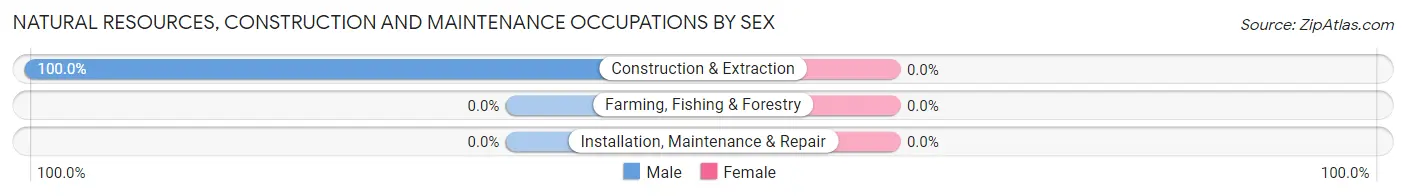
| Occupation | Male | Female |
| Farming, Fishing & Forestry | 0 (0.0%) | 0 (0.0%) |
| Construction & Extraction | 54 (100.0%) | 0 (0.0%) |
| Installation, Maintenance & Repair | 0 (0.0%) | 0 (0.0%) |
| Total (Category) | 54 (100.0%) | 0 (0.0%) |
| Total (Overall) | 414 (45.8%) | 491 (54.2%) |
Production, Transportation and Moving Occupations
The most common Production, Transportation and Moving occupations in West Portsmouth are Transportation (116 | 12.8%), Production (61 | 6.7%), and Material Moving (60 | 6.6%).
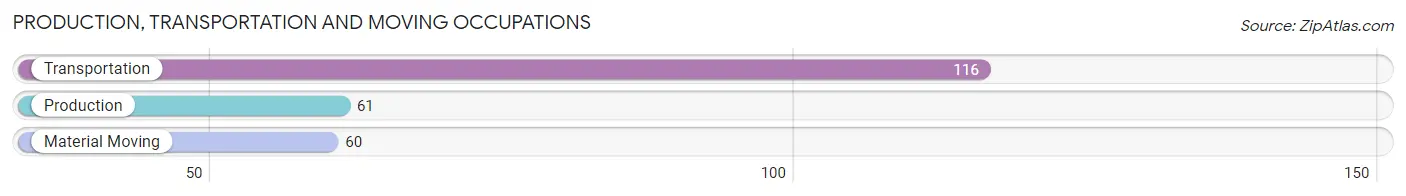
Production, Transportation and Moving Occupations by Sex
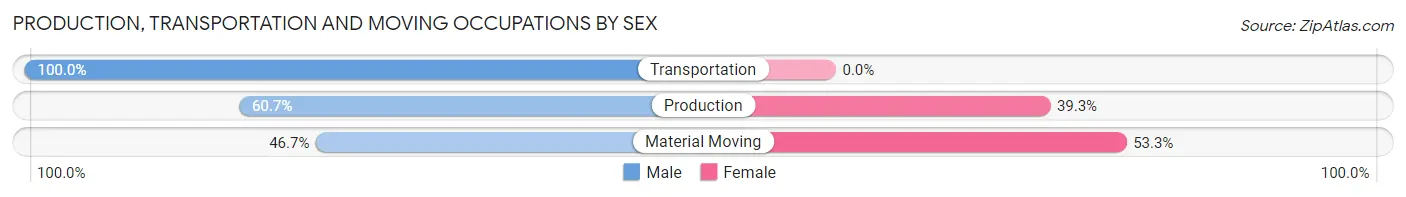
| Occupation | Male | Female |
| Production | 37 (60.7%) | 24 (39.3%) |
| Transportation | 116 (100.0%) | 0 (0.0%) |
| Material Moving | 28 (46.7%) | 32 (53.3%) |
| Total (Category) | 181 (76.4%) | 56 (23.6%) |
| Total (Overall) | 414 (45.8%) | 491 (54.2%) |
Employment Industries by Sex in West Portsmouth
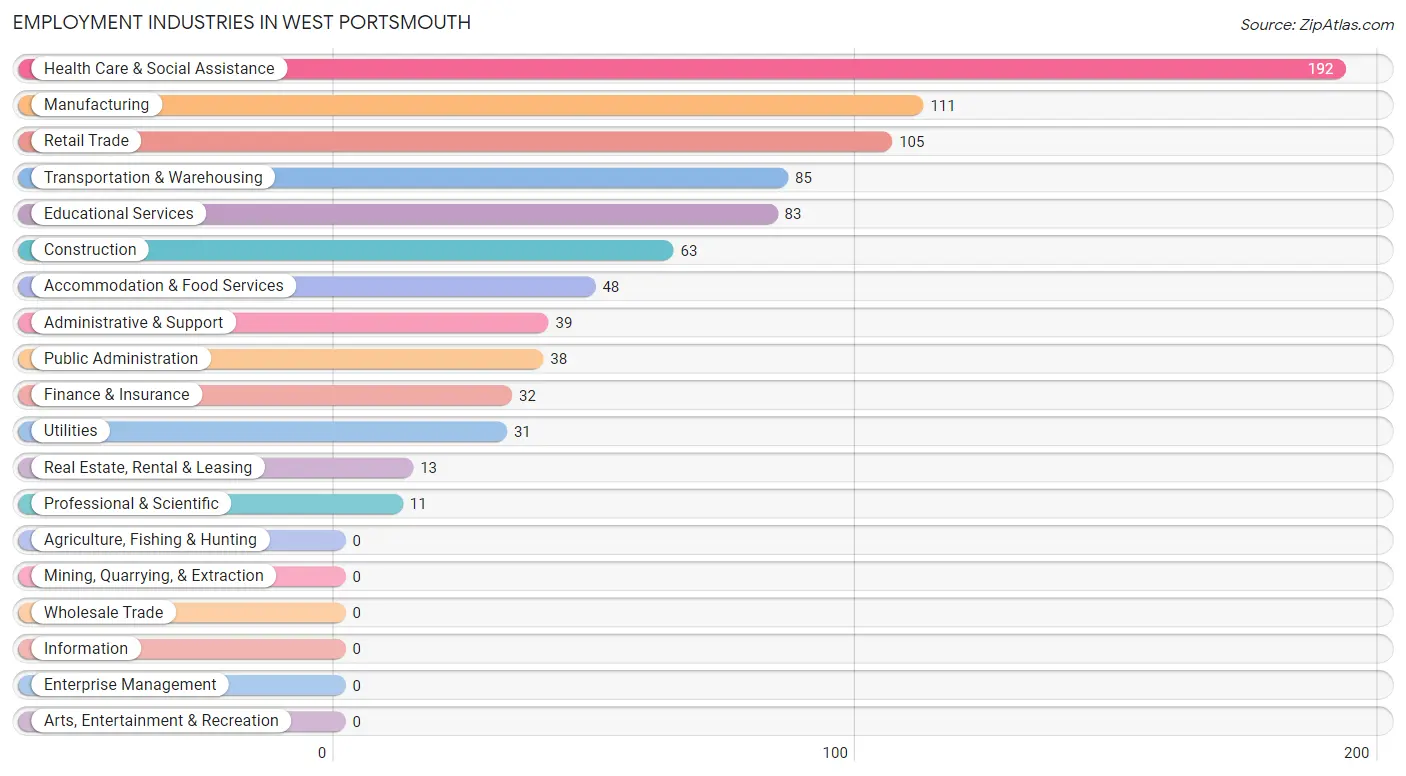
Employment Industries in West Portsmouth
The major employment industries in West Portsmouth include Health Care & Social Assistance (192 | 21.2%), Manufacturing (111 | 12.3%), Retail Trade (105 | 11.6%), Transportation & Warehousing (85 | 9.4%), and Educational Services (83 | 9.2%).
Employment Industries by Sex in West Portsmouth
The West Portsmouth industries that see more men than women are Construction (100.0%), Transportation & Warehousing (100.0%), and Utilities (100.0%), whereas the industries that tend to have a higher number of women are Finance & Insurance (100.0%), Real Estate, Rental & Leasing (100.0%), and Professional & Scientific (100.0%).
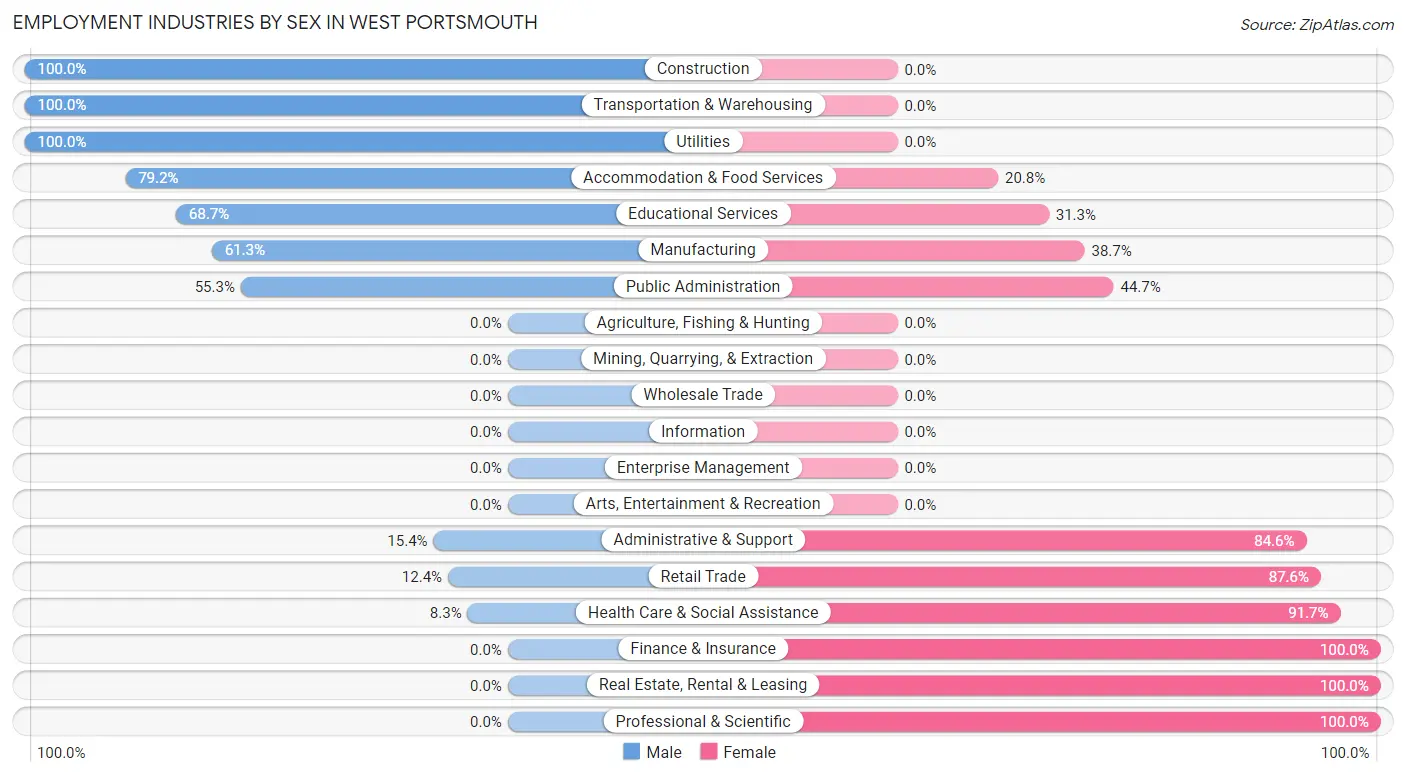
| Industry | Male | Female |
| Agriculture, Fishing & Hunting | 0 (0.0%) | 0 (0.0%) |
| Mining, Quarrying, & Extraction | 0 (0.0%) | 0 (0.0%) |
| Construction | 63 (100.0%) | 0 (0.0%) |
| Manufacturing | 68 (61.3%) | 43 (38.7%) |
| Wholesale Trade | 0 (0.0%) | 0 (0.0%) |
| Retail Trade | 13 (12.4%) | 92 (87.6%) |
| Transportation & Warehousing | 85 (100.0%) | 0 (0.0%) |
| Utilities | 31 (100.0%) | 0 (0.0%) |
| Information | 0 (0.0%) | 0 (0.0%) |
| Finance & Insurance | 0 (0.0%) | 32 (100.0%) |
| Real Estate, Rental & Leasing | 0 (0.0%) | 13 (100.0%) |
| Professional & Scientific | 0 (0.0%) | 11 (100.0%) |
| Enterprise Management | 0 (0.0%) | 0 (0.0%) |
| Administrative & Support | 6 (15.4%) | 33 (84.6%) |
| Educational Services | 57 (68.7%) | 26 (31.3%) |
| Health Care & Social Assistance | 16 (8.3%) | 176 (91.7%) |
| Arts, Entertainment & Recreation | 0 (0.0%) | 0 (0.0%) |
| Accommodation & Food Services | 38 (79.2%) | 10 (20.8%) |
| Public Administration | 21 (55.3%) | 17 (44.7%) |
| Total | 414 (45.8%) | 491 (54.2%) |
Education in West Portsmouth
School Enrollment in West Portsmouth
The most common levels of schooling among the 658 students in West Portsmouth are elementary school (207 | 31.5%), college / undergraduate (144 | 21.9%), and kindergarten (93 | 14.1%).
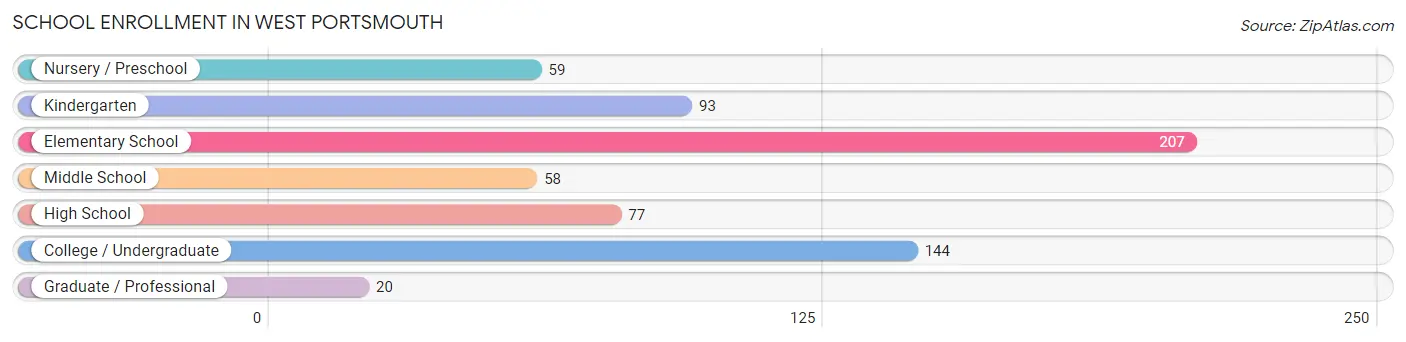
| School Level | # Students | % Students |
| Nursery / Preschool | 59 | 9.0% |
| Kindergarten | 93 | 14.1% |
| Elementary School | 207 | 31.5% |
| Middle School | 58 | 8.8% |
| High School | 77 | 11.7% |
| College / Undergraduate | 144 | 21.9% |
| Graduate / Professional | 20 | 3.0% |
| Total | 658 | 100.0% |
School Enrollment by Age by Funding Source in West Portsmouth
Out of a total of 658 students who are enrolled in schools in West Portsmouth, 11 (1.7%) attend a private institution, while the remaining 647 (98.3%) are enrolled in public schools. The age group of 35 years and over has the highest likelihood of being enrolled in private schools, with 11 (12.6% in the age bracket) enrolled. Conversely, the age group of 3 to 4 year olds has the lowest likelihood of being enrolled in a private school, with 24 (100.0% in the age bracket) attending a public institution.
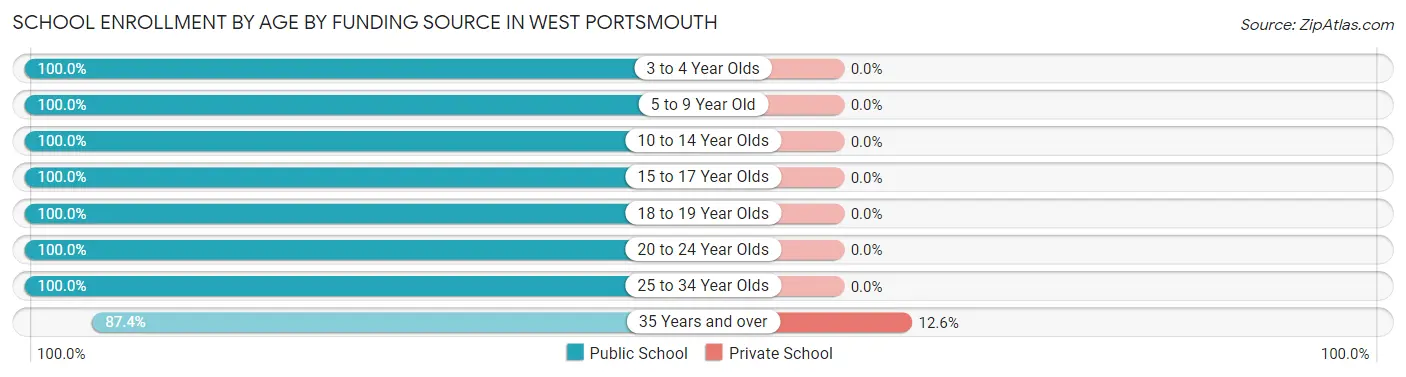
| Age Bracket | Public School | Private School |
| 3 to 4 Year Olds | 24 (100.0%) | 0 (0.0%) |
| 5 to 9 Year Old | 335 (100.0%) | 0 (0.0%) |
| 10 to 14 Year Olds | 83 (100.0%) | 0 (0.0%) |
| 15 to 17 Year Olds | 52 (100.0%) | 0 (0.0%) |
| 18 to 19 Year Olds | 21 (100.0%) | 0 (0.0%) |
| 20 to 24 Year Olds | 12 (100.0%) | 0 (0.0%) |
| 25 to 34 Year Olds | 44 (100.0%) | 0 (0.0%) |
| 35 Years and over | 76 (87.4%) | 11 (12.6%) |
| Total | 647 (98.3%) | 11 (1.7%) |
Educational Attainment by Field of Study in West Portsmouth
Psychology (74 | 48.7%), science & technology (27 | 17.8%), social sciences (24 | 15.8%), education (9 | 5.9%), and literature & languages (9 | 5.9%) are the most common fields of study among 152 individuals in West Portsmouth who have obtained a bachelor's degree or higher.
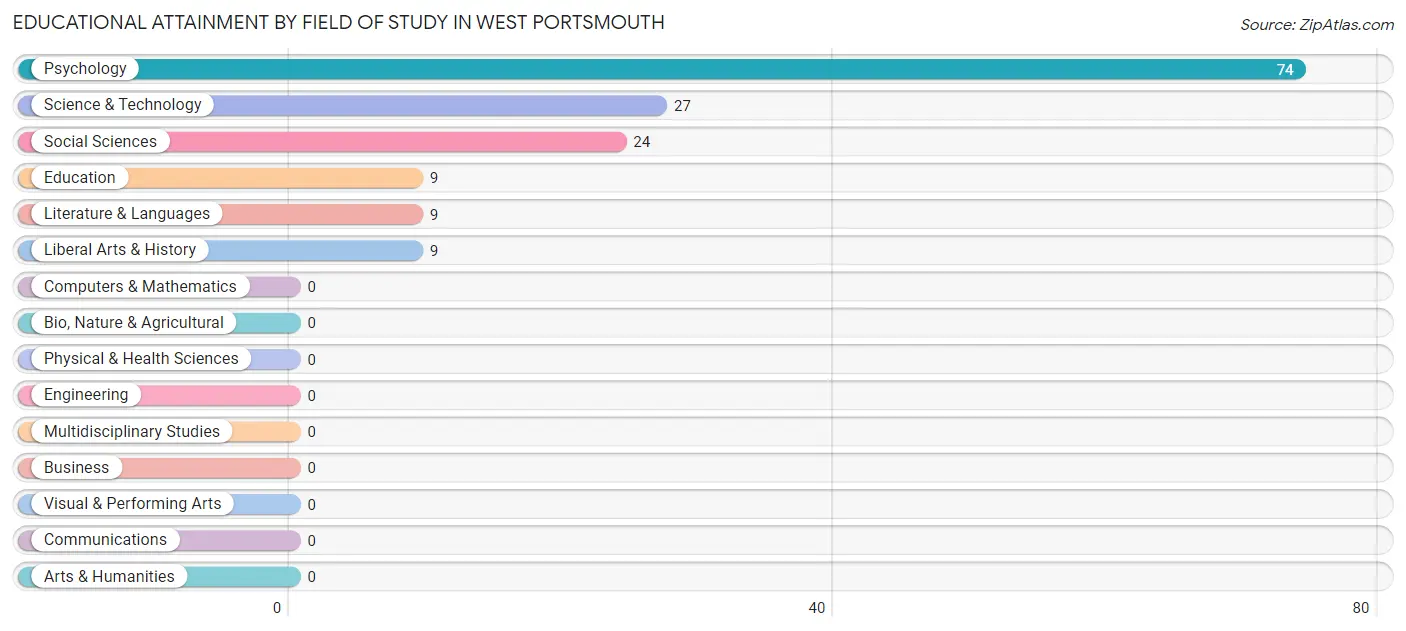
| Field of Study | # Graduates | % Graduates |
| Computers & Mathematics | 0 | 0.0% |
| Bio, Nature & Agricultural | 0 | 0.0% |
| Physical & Health Sciences | 0 | 0.0% |
| Psychology | 74 | 48.7% |
| Social Sciences | 24 | 15.8% |
| Engineering | 0 | 0.0% |
| Multidisciplinary Studies | 0 | 0.0% |
| Science & Technology | 27 | 17.8% |
| Business | 0 | 0.0% |
| Education | 9 | 5.9% |
| Literature & Languages | 9 | 5.9% |
| Liberal Arts & History | 9 | 5.9% |
| Visual & Performing Arts | 0 | 0.0% |
| Communications | 0 | 0.0% |
| Arts & Humanities | 0 | 0.0% |
| Total | 152 | 100.0% |
Transportation & Commute in West Portsmouth
Vehicle Availability by Sex in West Portsmouth
The most prevalent vehicle ownership categories in West Portsmouth are males with 2 vehicles (292, accounting for 70.5%) and females with 2 vehicles (185, making up 64.2%).
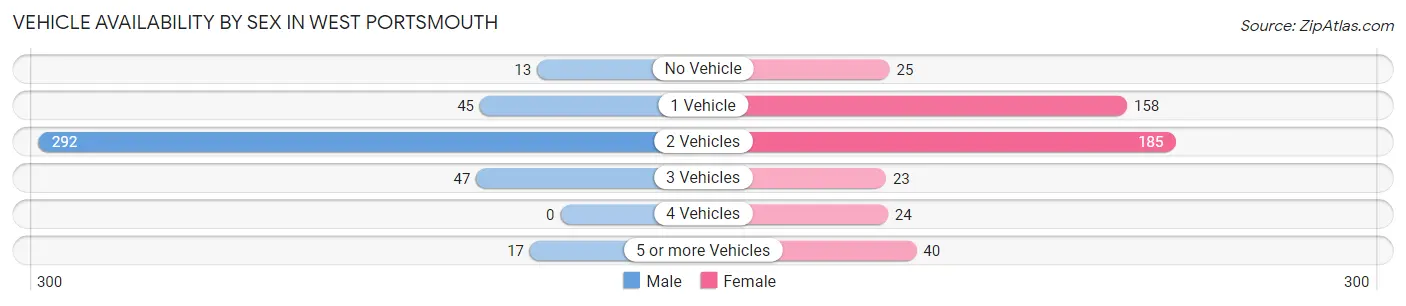
| Vehicles Available | Male | Female |
| No Vehicle | 13 (3.1%) | 25 (5.5%) |
| 1 Vehicle | 45 (10.9%) | 158 (34.7%) |
| 2 Vehicles | 292 (70.5%) | 185 (40.7%) |
| 3 Vehicles | 47 (11.4%) | 23 (5.1%) |
| 4 Vehicles | 0 (0.0%) | 24 (5.3%) |
| 5 or more Vehicles | 17 (4.1%) | 40 (8.8%) |
| Total | 414 (100.0%) | 455 (100.0%) |
Commute Time in West Portsmouth
The most frequently occuring commute durations in West Portsmouth are 15 to 19 minutes (201 commuters, 25.1%), 5 to 9 minutes (190 commuters, 23.7%), and 10 to 14 minutes (180 commuters, 22.5%).
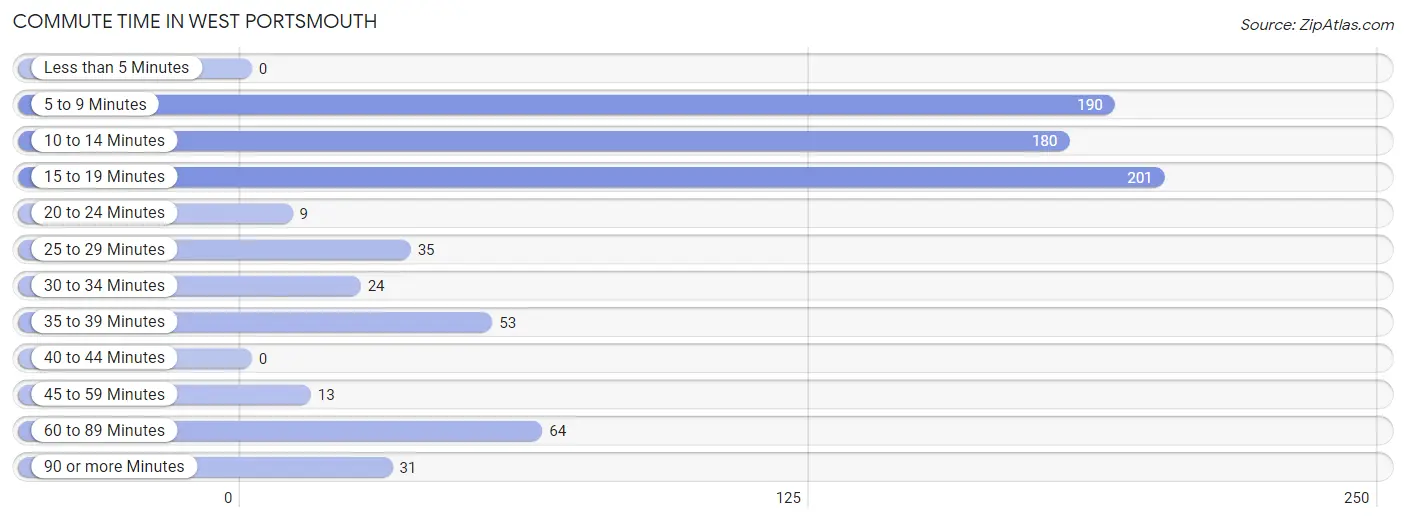
| Commute Time | # Commuters | % Commuters |
| Less than 5 Minutes | 0 | 0.0% |
| 5 to 9 Minutes | 190 | 23.7% |
| 10 to 14 Minutes | 180 | 22.5% |
| 15 to 19 Minutes | 201 | 25.1% |
| 20 to 24 Minutes | 9 | 1.1% |
| 25 to 29 Minutes | 35 | 4.4% |
| 30 to 34 Minutes | 24 | 3.0% |
| 35 to 39 Minutes | 53 | 6.6% |
| 40 to 44 Minutes | 0 | 0.0% |
| 45 to 59 Minutes | 13 | 1.6% |
| 60 to 89 Minutes | 64 | 8.0% |
| 90 or more Minutes | 31 | 3.9% |
Commute Time by Sex in West Portsmouth
The most common commute times in West Portsmouth are 5 to 9 minutes (112 commuters, 29.8%) for males and 10 to 14 minutes (153 commuters, 36.1%) for females.
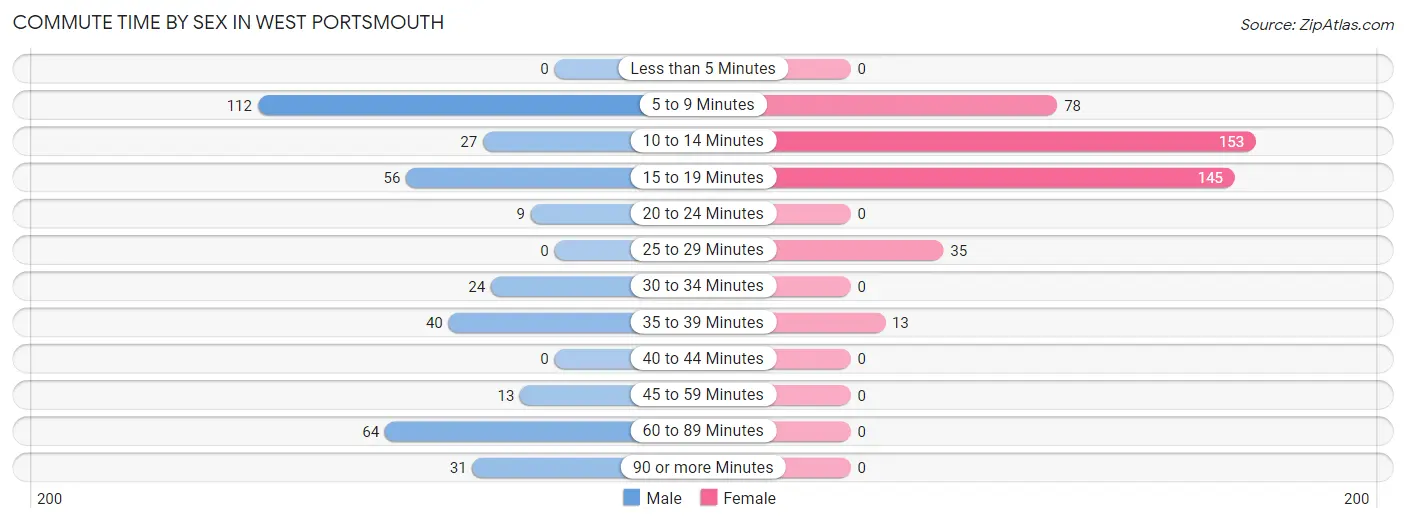
| Commute Time | Male | Female |
| Less than 5 Minutes | 0 (0.0%) | 0 (0.0%) |
| 5 to 9 Minutes | 112 (29.8%) | 78 (18.4%) |
| 10 to 14 Minutes | 27 (7.2%) | 153 (36.1%) |
| 15 to 19 Minutes | 56 (14.9%) | 145 (34.2%) |
| 20 to 24 Minutes | 9 (2.4%) | 0 (0.0%) |
| 25 to 29 Minutes | 0 (0.0%) | 35 (8.3%) |
| 30 to 34 Minutes | 24 (6.4%) | 0 (0.0%) |
| 35 to 39 Minutes | 40 (10.6%) | 13 (3.1%) |
| 40 to 44 Minutes | 0 (0.0%) | 0 (0.0%) |
| 45 to 59 Minutes | 13 (3.5%) | 0 (0.0%) |
| 60 to 89 Minutes | 64 (17.0%) | 0 (0.0%) |
| 90 or more Minutes | 31 (8.2%) | 0 (0.0%) |
Time of Departure to Work by Sex in West Portsmouth
The most frequent times of departure to work in West Portsmouth are 7:00 AM to 7:29 AM (90, 23.9%) for males and 8:30 AM to 8:59 AM (171, 40.3%) for females.
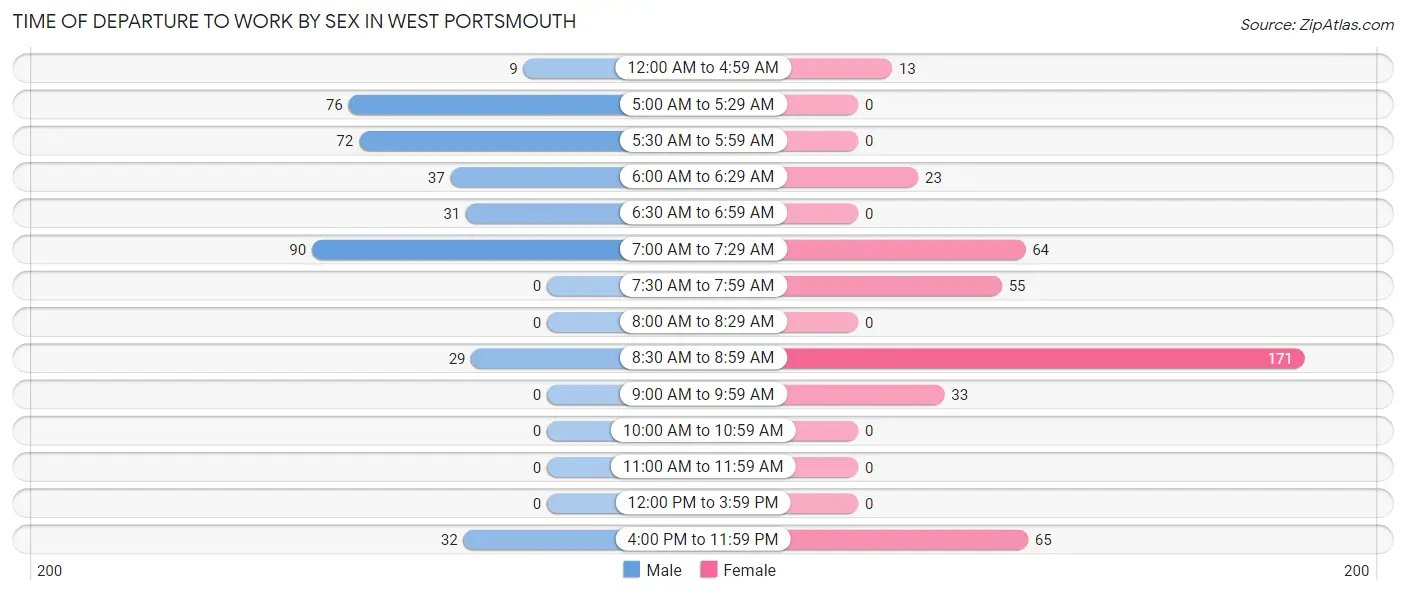
| Time of Departure | Male | Female |
| 12:00 AM to 4:59 AM | 9 (2.4%) | 13 (3.1%) |
| 5:00 AM to 5:29 AM | 76 (20.2%) | 0 (0.0%) |
| 5:30 AM to 5:59 AM | 72 (19.2%) | 0 (0.0%) |
| 6:00 AM to 6:29 AM | 37 (9.8%) | 23 (5.4%) |
| 6:30 AM to 6:59 AM | 31 (8.2%) | 0 (0.0%) |
| 7:00 AM to 7:29 AM | 90 (23.9%) | 64 (15.1%) |
| 7:30 AM to 7:59 AM | 0 (0.0%) | 55 (13.0%) |
| 8:00 AM to 8:29 AM | 0 (0.0%) | 0 (0.0%) |
| 8:30 AM to 8:59 AM | 29 (7.7%) | 171 (40.3%) |
| 9:00 AM to 9:59 AM | 0 (0.0%) | 33 (7.8%) |
| 10:00 AM to 10:59 AM | 0 (0.0%) | 0 (0.0%) |
| 11:00 AM to 11:59 AM | 0 (0.0%) | 0 (0.0%) |
| 12:00 PM to 3:59 PM | 0 (0.0%) | 0 (0.0%) |
| 4:00 PM to 11:59 PM | 32 (8.5%) | 65 (15.3%) |
| Total | 376 (100.0%) | 424 (100.0%) |
Housing Occupancy in West Portsmouth
Occupancy by Ownership in West Portsmouth
Of the total 1,164 dwellings in West Portsmouth, owner-occupied units account for 833 (71.6%), while renter-occupied units make up 331 (28.4%).
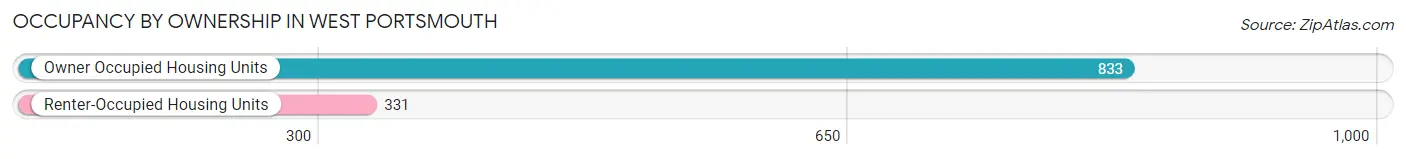
| Occupancy | # Housing Units | % Housing Units |
| Owner Occupied Housing Units | 833 | 71.6% |
| Renter-Occupied Housing Units | 331 | 28.4% |
| Total Occupied Housing Units | 1,164 | 100.0% |
Occupancy by Household Size in West Portsmouth
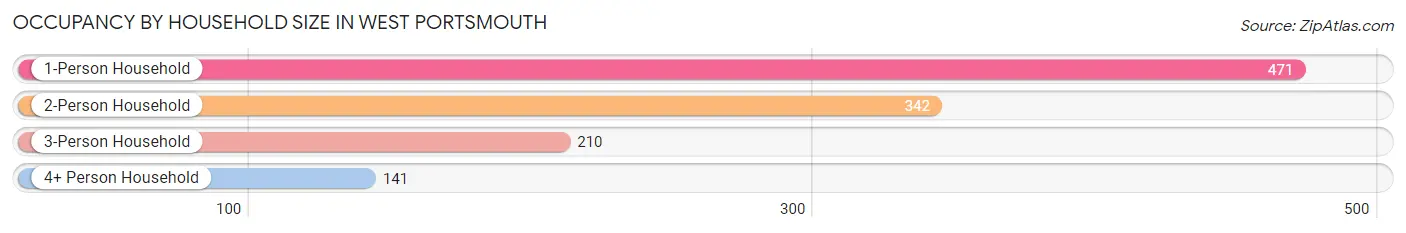
| Household Size | # Housing Units | % Housing Units |
| 1-Person Household | 471 | 40.5% |
| 2-Person Household | 342 | 29.4% |
| 3-Person Household | 210 | 18.0% |
| 4+ Person Household | 141 | 12.1% |
| Total Housing Units | 1,164 | 100.0% |
Occupancy by Ownership by Household Size in West Portsmouth
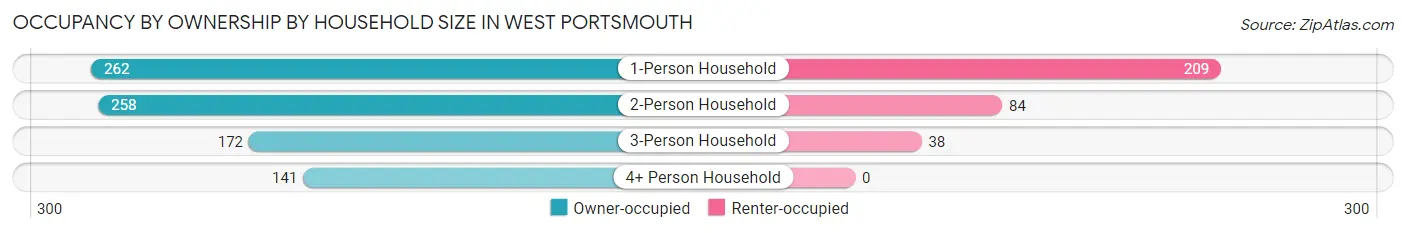
| Household Size | Owner-occupied | Renter-occupied |
| 1-Person Household | 262 (55.6%) | 209 (44.4%) |
| 2-Person Household | 258 (75.4%) | 84 (24.6%) |
| 3-Person Household | 172 (81.9%) | 38 (18.1%) |
| 4+ Person Household | 141 (100.0%) | 0 (0.0%) |
| Total Housing Units | 833 (71.6%) | 331 (28.4%) |
Occupancy by Educational Attainment in West Portsmouth
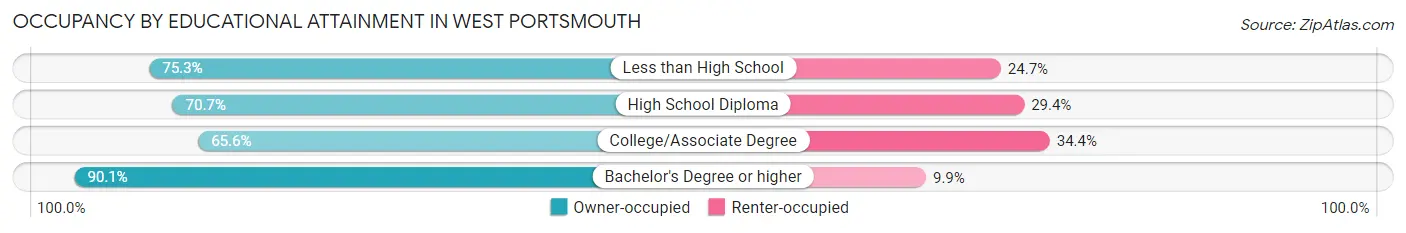
| Household Size | Owner-occupied | Renter-occupied |
| Less than High School | 137 (75.3%) | 45 (24.7%) |
| High School Diploma | 414 (70.7%) | 172 (29.3%) |
| College/Associate Degree | 200 (65.6%) | 105 (34.4%) |
| Bachelor's Degree or higher | 82 (90.1%) | 9 (9.9%) |
Occupancy by Age of Householder in West Portsmouth
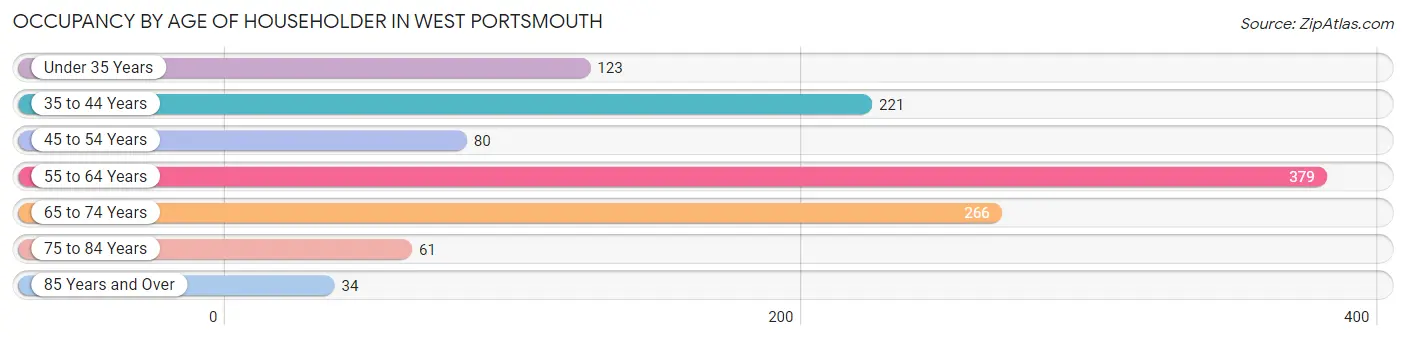
| Age Bracket | # Households | % Households |
| Under 35 Years | 123 | 10.6% |
| 35 to 44 Years | 221 | 19.0% |
| 45 to 54 Years | 80 | 6.9% |
| 55 to 64 Years | 379 | 32.6% |
| 65 to 74 Years | 266 | 22.9% |
| 75 to 84 Years | 61 | 5.2% |
| 85 Years and Over | 34 | 2.9% |
| Total | 1,164 | 100.0% |
Housing Finances in West Portsmouth
Median Income by Occupancy in West Portsmouth
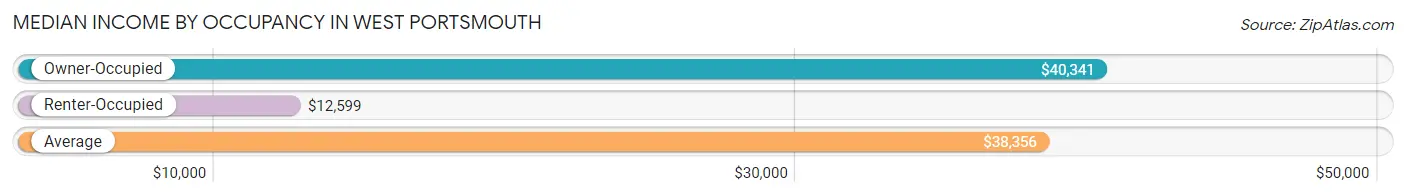
| Occupancy Type | # Households | Median Income |
| Owner-Occupied | 833 (71.6%) | $40,341 |
| Renter-Occupied | 331 (28.4%) | $12,599 |
| Average | 1,164 (100.0%) | $38,356 |
Occupancy by Householder Income Bracket in West Portsmouth
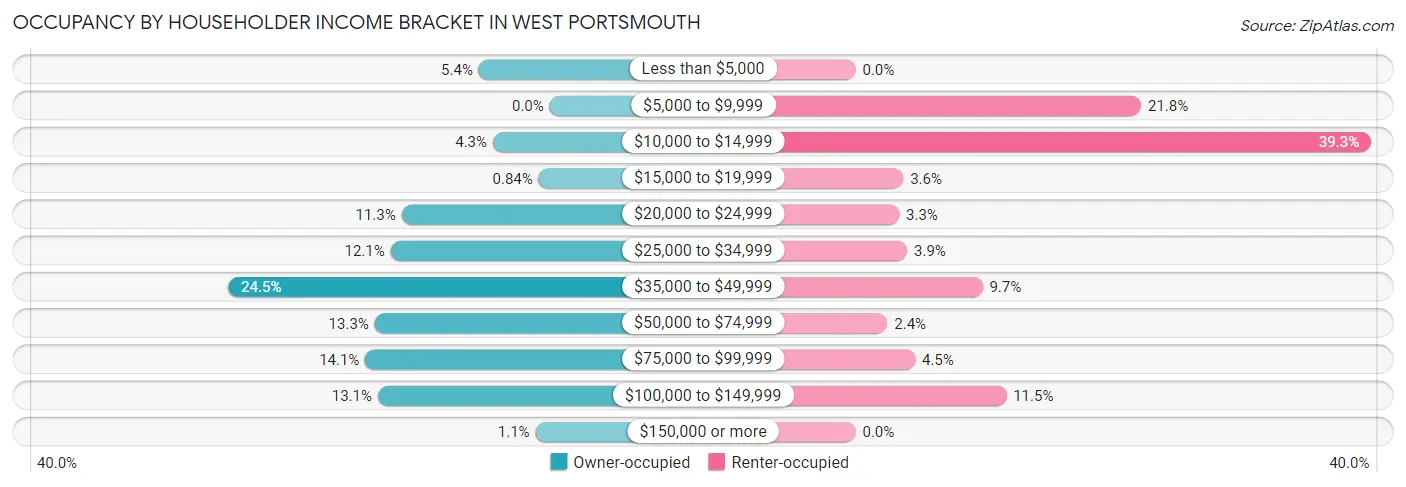
| Income Bracket | Owner-occupied | Renter-occupied |
| Less than $5,000 | 45 (5.4%) | 0 (0.0%) |
| $5,000 to $9,999 | 0 (0.0%) | 72 (21.7%) |
| $10,000 to $14,999 | 36 (4.3%) | 130 (39.3%) |
| $15,000 to $19,999 | 7 (0.8%) | 12 (3.6%) |
| $20,000 to $24,999 | 94 (11.3%) | 11 (3.3%) |
| $25,000 to $34,999 | 101 (12.1%) | 13 (3.9%) |
| $35,000 to $49,999 | 204 (24.5%) | 32 (9.7%) |
| $50,000 to $74,999 | 111 (13.3%) | 8 (2.4%) |
| $75,000 to $99,999 | 117 (14.1%) | 15 (4.5%) |
| $100,000 to $149,999 | 109 (13.1%) | 38 (11.5%) |
| $150,000 or more | 9 (1.1%) | 0 (0.0%) |
| Total | 833 (100.0%) | 331 (100.0%) |
Monthly Housing Cost Tiers in West Portsmouth
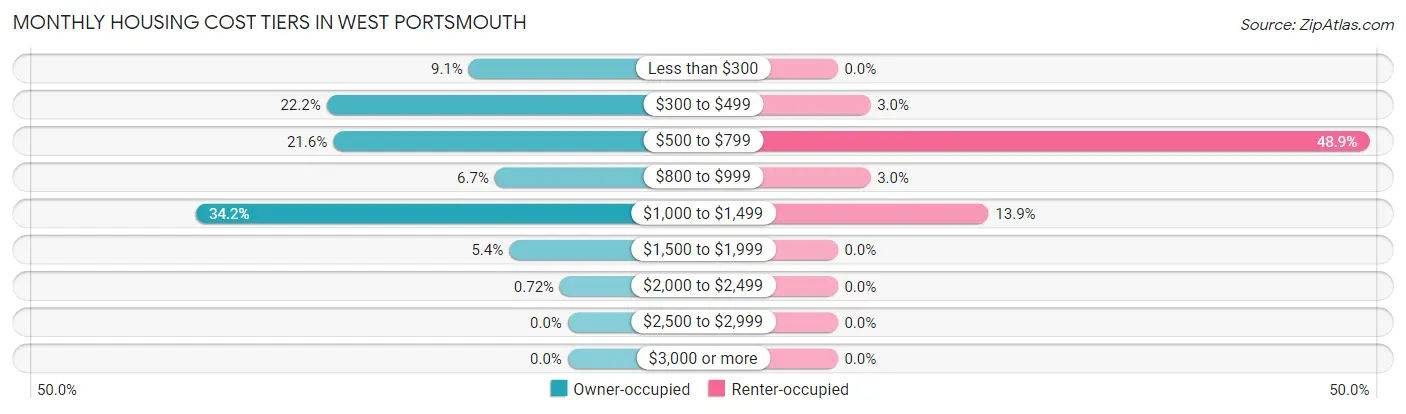
| Monthly Cost | Owner-occupied | Renter-occupied |
| Less than $300 | 76 (9.1%) | 0 (0.0%) |
| $300 to $499 | 185 (22.2%) | 10 (3.0%) |
| $500 to $799 | 180 (21.6%) | 162 (48.9%) |
| $800 to $999 | 56 (6.7%) | 10 (3.0%) |
| $1,000 to $1,499 | 285 (34.2%) | 46 (13.9%) |
| $1,500 to $1,999 | 45 (5.4%) | 0 (0.0%) |
| $2,000 to $2,499 | 6 (0.7%) | 0 (0.0%) |
| $2,500 to $2,999 | 0 (0.0%) | 0 (0.0%) |
| $3,000 or more | 0 (0.0%) | 0 (0.0%) |
| Total | 833 (100.0%) | 331 (100.0%) |
Physical Housing Characteristics in West Portsmouth
Housing Structures in West Portsmouth
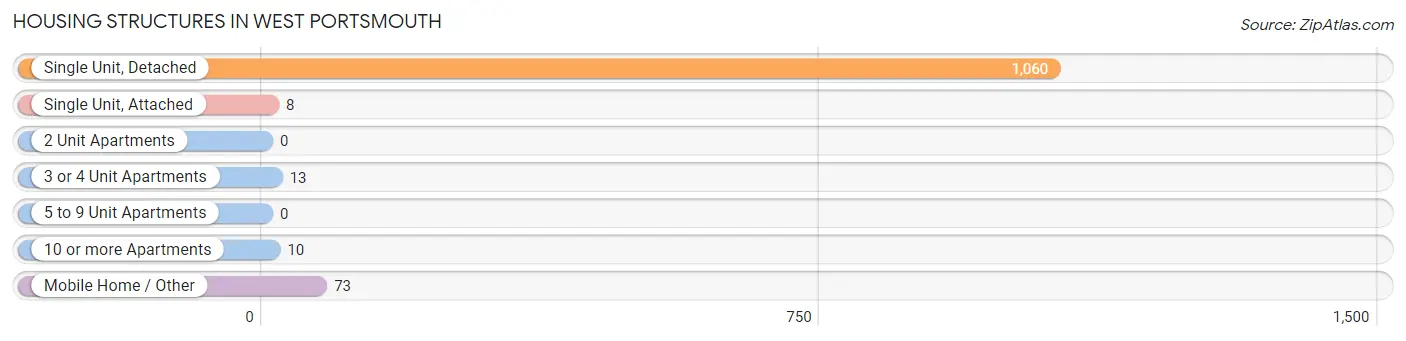
| Structure Type | # Housing Units | % Housing Units |
| Single Unit, Detached | 1,060 | 91.1% |
| Single Unit, Attached | 8 | 0.7% |
| 2 Unit Apartments | 0 | 0.0% |
| 3 or 4 Unit Apartments | 13 | 1.1% |
| 5 to 9 Unit Apartments | 0 | 0.0% |
| 10 or more Apartments | 10 | 0.9% |
| Mobile Home / Other | 73 | 6.3% |
| Total | 1,164 | 100.0% |
Housing Structures by Occupancy in West Portsmouth
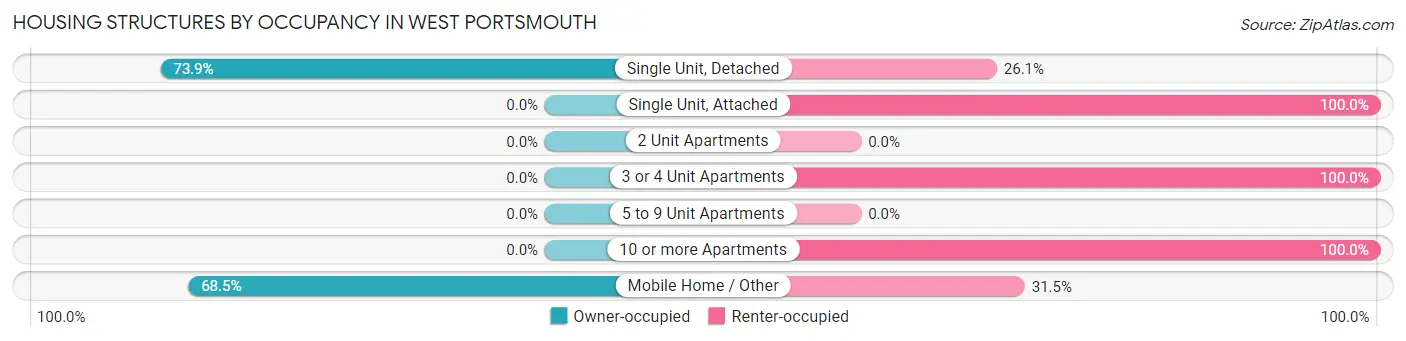
| Structure Type | Owner-occupied | Renter-occupied |
| Single Unit, Detached | 783 (73.9%) | 277 (26.1%) |
| Single Unit, Attached | 0 (0.0%) | 8 (100.0%) |
| 2 Unit Apartments | 0 (0.0%) | 0 (0.0%) |
| 3 or 4 Unit Apartments | 0 (0.0%) | 13 (100.0%) |
| 5 to 9 Unit Apartments | 0 (0.0%) | 0 (0.0%) |
| 10 or more Apartments | 0 (0.0%) | 10 (100.0%) |
| Mobile Home / Other | 50 (68.5%) | 23 (31.5%) |
| Total | 833 (71.6%) | 331 (28.4%) |
Housing Structures by Number of Rooms in West Portsmouth
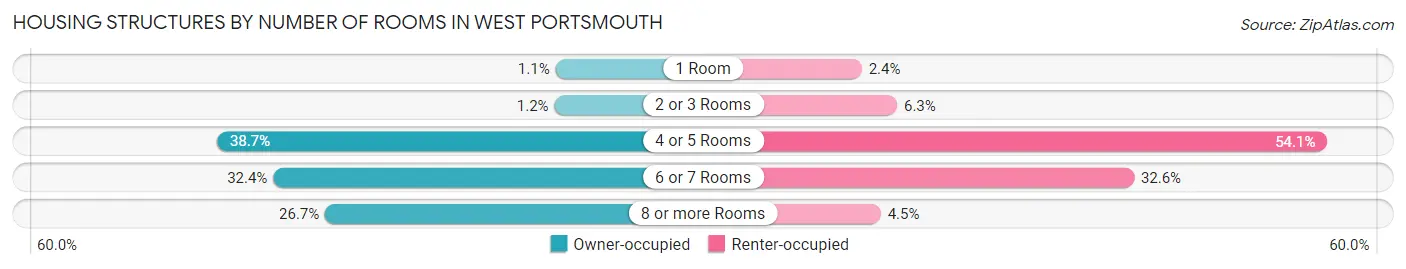
| Number of Rooms | Owner-occupied | Renter-occupied |
| 1 Room | 9 (1.1%) | 8 (2.4%) |
| 2 or 3 Rooms | 10 (1.2%) | 21 (6.3%) |
| 4 or 5 Rooms | 322 (38.7%) | 179 (54.1%) |
| 6 or 7 Rooms | 270 (32.4%) | 108 (32.6%) |
| 8 or more Rooms | 222 (26.7%) | 15 (4.5%) |
| Total | 833 (100.0%) | 331 (100.0%) |
Housing Structure by Heating Type in West Portsmouth
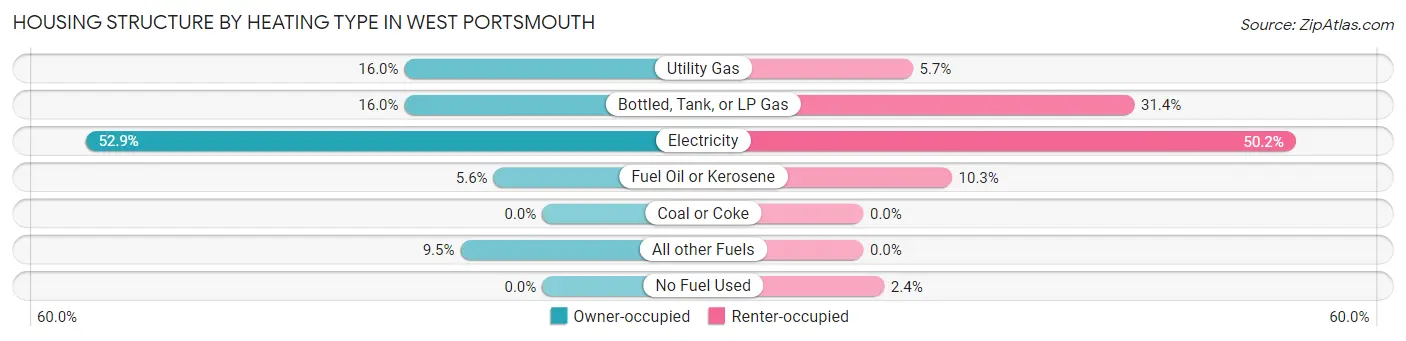
| Heating Type | Owner-occupied | Renter-occupied |
| Utility Gas | 133 (16.0%) | 19 (5.7%) |
| Bottled, Tank, or LP Gas | 133 (16.0%) | 104 (31.4%) |
| Electricity | 441 (52.9%) | 166 (50.1%) |
| Fuel Oil or Kerosene | 47 (5.6%) | 34 (10.3%) |
| Coal or Coke | 0 (0.0%) | 0 (0.0%) |
| All other Fuels | 79 (9.5%) | 0 (0.0%) |
| No Fuel Used | 0 (0.0%) | 8 (2.4%) |
| Total | 833 (100.0%) | 331 (100.0%) |
Household Vehicle Usage in West Portsmouth
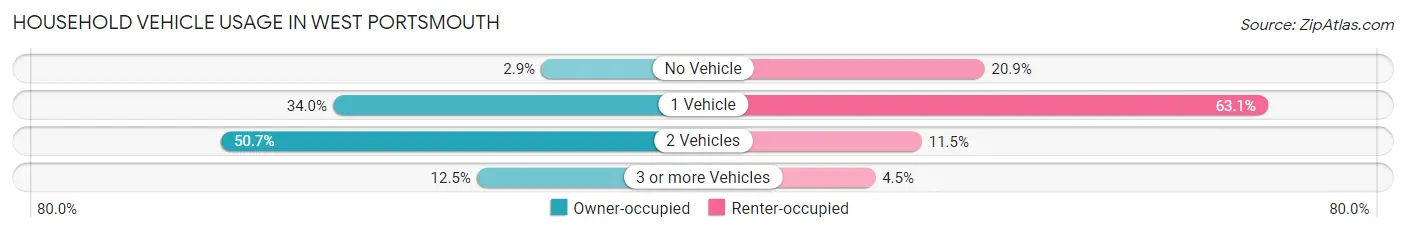
| Vehicles per Household | Owner-occupied | Renter-occupied |
| No Vehicle | 24 (2.9%) | 69 (20.8%) |
| 1 Vehicle | 283 (34.0%) | 209 (63.1%) |
| 2 Vehicles | 422 (50.7%) | 38 (11.5%) |
| 3 or more Vehicles | 104 (12.5%) | 15 (4.5%) |
| Total | 833 (100.0%) | 331 (100.0%) |
Real Estate & Mortgages in West Portsmouth
Real Estate and Mortgage Overview in West Portsmouth
| Characteristic | Without Mortgage | With Mortgage |
| Housing Units | 404 | 429 |
| Median Property Value | $101,900 | $97,400 |
| Median Household Income | $32,979 | $0 |
| Monthly Housing Costs | $416 | $0 |
| Real Estate Taxes | $1,037 | $0 |
Property Value by Mortgage Status in West Portsmouth
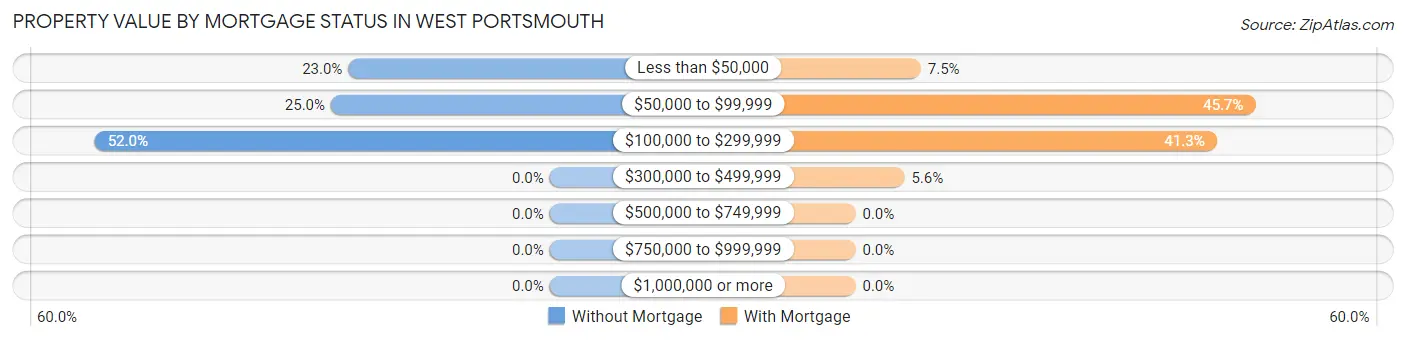
| Property Value | Without Mortgage | With Mortgage |
| Less than $50,000 | 93 (23.0%) | 32 (7.5%) |
| $50,000 to $99,999 | 101 (25.0%) | 196 (45.7%) |
| $100,000 to $299,999 | 210 (52.0%) | 177 (41.3%) |
| $300,000 to $499,999 | 0 (0.0%) | 24 (5.6%) |
| $500,000 to $749,999 | 0 (0.0%) | 0 (0.0%) |
| $750,000 to $999,999 | 0 (0.0%) | 0 (0.0%) |
| $1,000,000 or more | 0 (0.0%) | 0 (0.0%) |
| Total | 404 (100.0%) | 429 (100.0%) |
Household Income by Mortgage Status in West Portsmouth
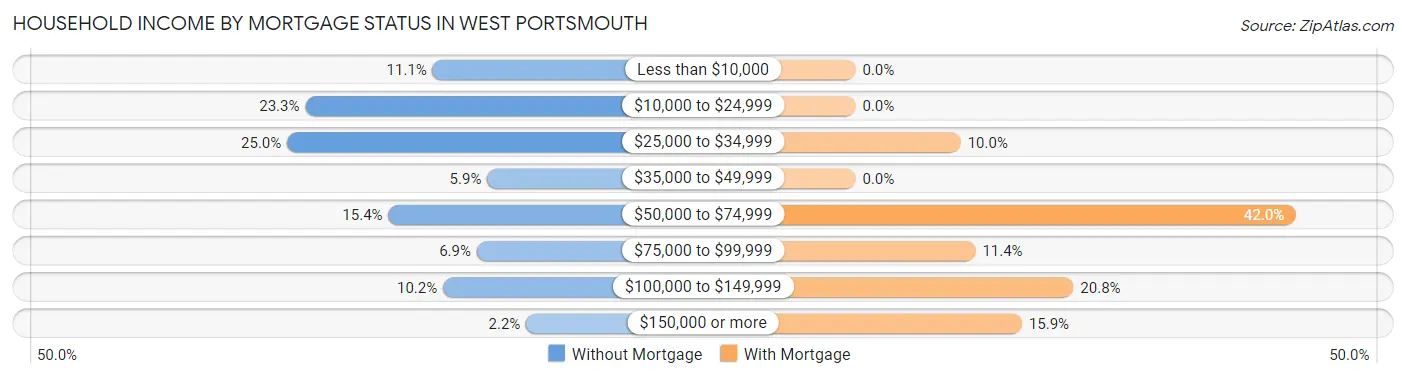
| Household Income | Without Mortgage | With Mortgage |
| Less than $10,000 | 45 (11.1%) | 0 (0.0%) |
| $10,000 to $24,999 | 94 (23.3%) | 0 (0.0%) |
| $25,000 to $34,999 | 101 (25.0%) | 43 (10.0%) |
| $35,000 to $49,999 | 24 (5.9%) | 0 (0.0%) |
| $50,000 to $74,999 | 62 (15.3%) | 180 (42.0%) |
| $75,000 to $99,999 | 28 (6.9%) | 49 (11.4%) |
| $100,000 to $149,999 | 41 (10.2%) | 89 (20.7%) |
| $150,000 or more | 9 (2.2%) | 68 (15.9%) |
| Total | 404 (100.0%) | 429 (100.0%) |
Property Value to Household Income Ratio in West Portsmouth
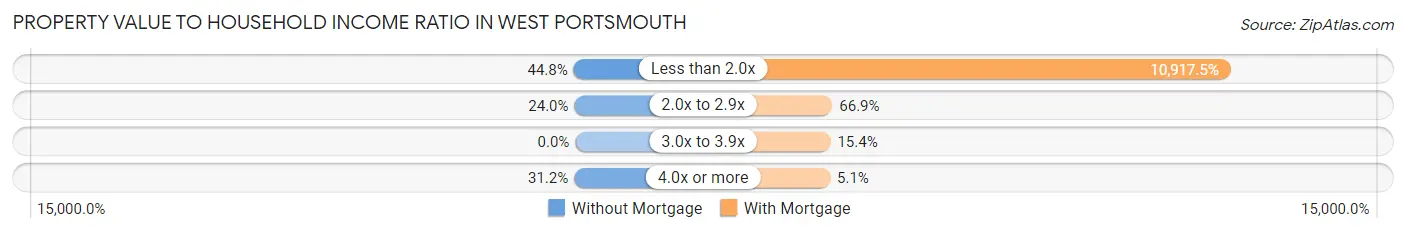
| Value-to-Income Ratio | Without Mortgage | With Mortgage |
| Less than 2.0x | 181 (44.8%) | 46,836 (10,917.5%) |
| 2.0x to 2.9x | 97 (24.0%) | 287 (66.9%) |
| 3.0x to 3.9x | 0 (0.0%) | 66 (15.4%) |
| 4.0x or more | 126 (31.2%) | 22 (5.1%) |
| Total | 404 (100.0%) | 429 (100.0%) |
Real Estate Taxes by Mortgage Status in West Portsmouth
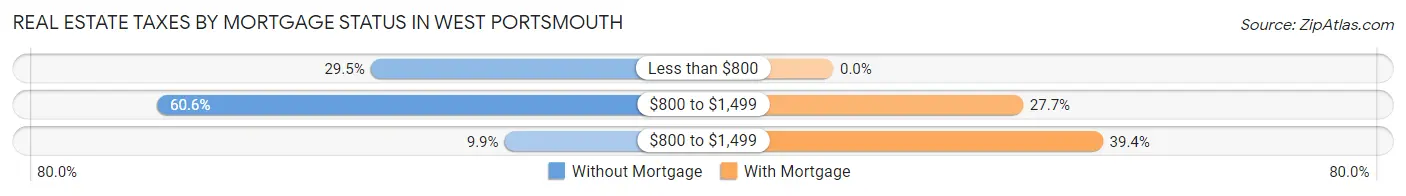
| Property Taxes | Without Mortgage | With Mortgage |
| Less than $800 | 119 (29.5%) | 0 (0.0%) |
| $800 to $1,499 | 245 (60.6%) | 119 (27.7%) |
| $800 to $1,499 | 40 (9.9%) | 169 (39.4%) |
| Total | 404 (100.0%) | 429 (100.0%) |
Health & Disability in West Portsmouth
Health Insurance Coverage by Age in West Portsmouth
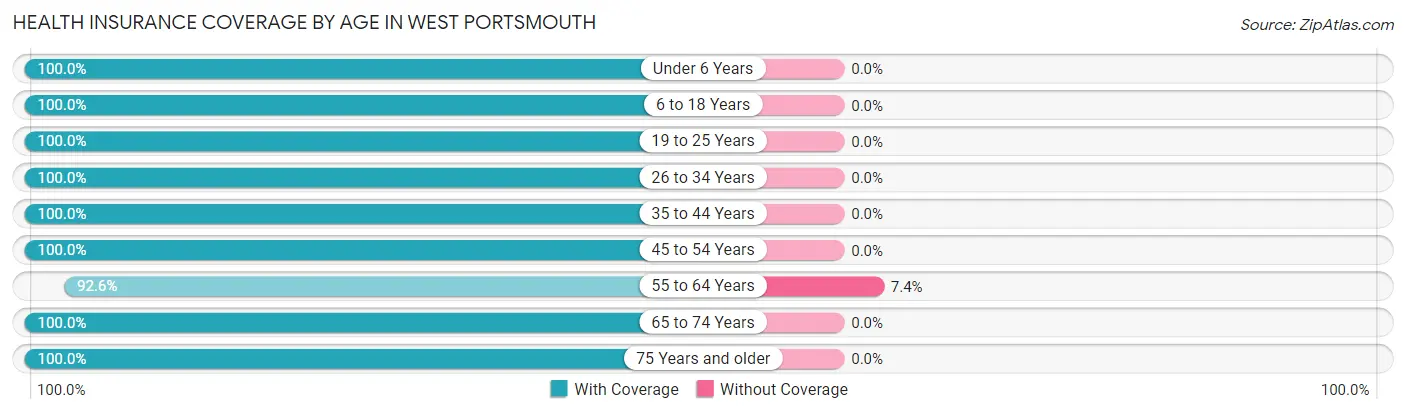
| Age Bracket | With Coverage | Without Coverage |
| Under 6 Years | 270 (100.0%) | 0 (0.0%) |
| 6 to 18 Years | 351 (100.0%) | 0 (0.0%) |
| 19 to 25 Years | 88 (100.0%) | 0 (0.0%) |
| 26 to 34 Years | 171 (100.0%) | 0 (0.0%) |
| 35 to 44 Years | 363 (100.0%) | 0 (0.0%) |
| 45 to 54 Years | 204 (100.0%) | 0 (0.0%) |
| 55 to 64 Years | 415 (92.6%) | 33 (7.4%) |
| 65 to 74 Years | 477 (100.0%) | 0 (0.0%) |
| 75 Years and older | 168 (100.0%) | 0 (0.0%) |
| Total | 2,507 (98.7%) | 33 (1.3%) |
Health Insurance Coverage by Citizenship Status in West Portsmouth
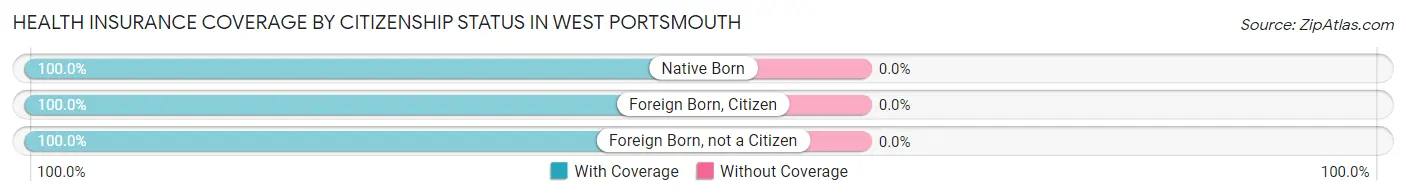
| Citizenship Status | With Coverage | Without Coverage |
| Native Born | 270 (100.0%) | 0 (0.0%) |
| Foreign Born, Citizen | 351 (100.0%) | 0 (0.0%) |
| Foreign Born, not a Citizen | 88 (100.0%) | 0 (0.0%) |
Health Insurance Coverage by Household Income in West Portsmouth
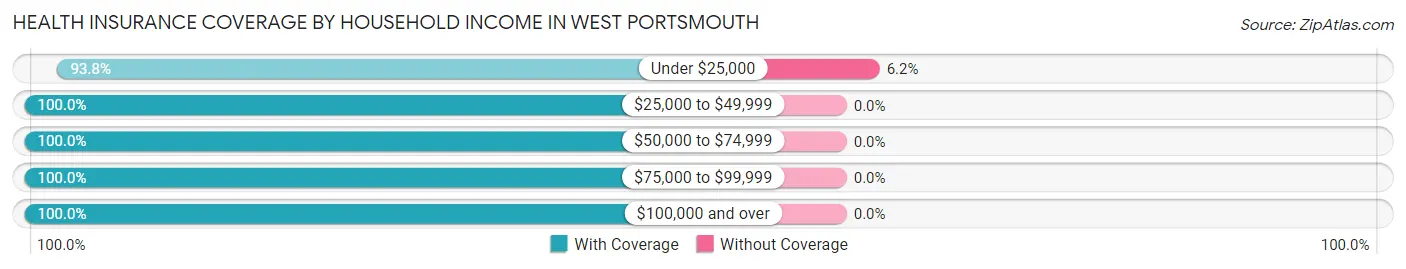
| Household Income | With Coverage | Without Coverage |
| Under $25,000 | 502 (93.8%) | 33 (6.2%) |
| $25,000 to $49,999 | 788 (100.0%) | 0 (0.0%) |
| $50,000 to $74,999 | 270 (100.0%) | 0 (0.0%) |
| $75,000 to $99,999 | 402 (100.0%) | 0 (0.0%) |
| $100,000 and over | 545 (100.0%) | 0 (0.0%) |
Public vs Private Health Insurance Coverage by Age in West Portsmouth
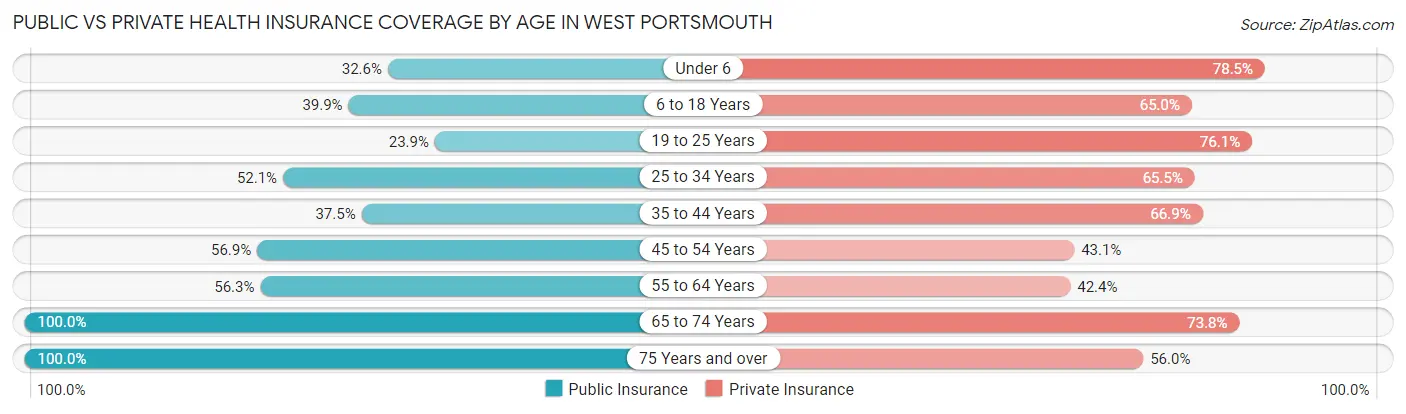
| Age Bracket | Public Insurance | Private Insurance |
| Under 6 | 88 (32.6%) | 212 (78.5%) |
| 6 to 18 Years | 140 (39.9%) | 228 (65.0%) |
| 19 to 25 Years | 21 (23.9%) | 67 (76.1%) |
| 25 to 34 Years | 89 (52.0%) | 112 (65.5%) |
| 35 to 44 Years | 136 (37.5%) | 243 (66.9%) |
| 45 to 54 Years | 116 (56.9%) | 88 (43.1%) |
| 55 to 64 Years | 252 (56.2%) | 190 (42.4%) |
| 65 to 74 Years | 477 (100.0%) | 352 (73.8%) |
| 75 Years and over | 168 (100.0%) | 94 (55.9%) |
| Total | 1,487 (58.5%) | 1,586 (62.4%) |
Disability Status by Sex by Age in West Portsmouth
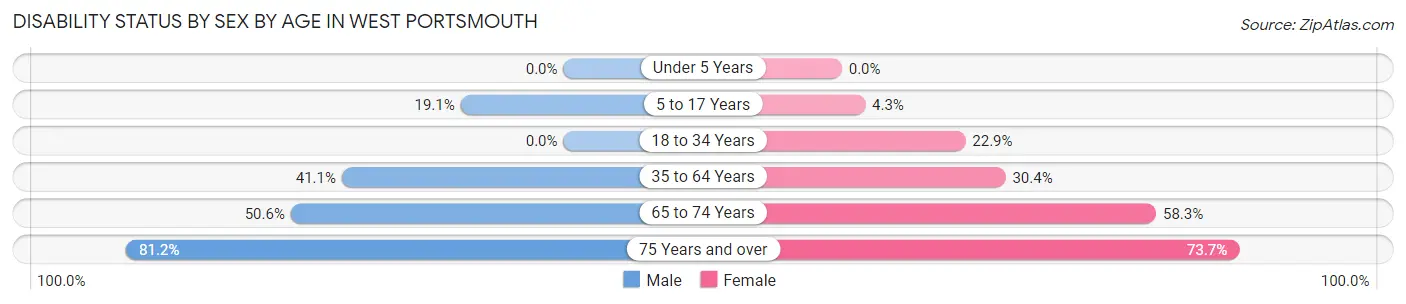
| Age Bracket | Male | Female |
| Under 5 Years | 0 (0.0%) | 0 (0.0%) |
| 5 to 17 Years | 50 (19.1%) | 9 (4.3%) |
| 18 to 34 Years | 0 (0.0%) | 39 (22.9%) |
| 35 to 64 Years | 213 (41.1%) | 151 (30.4%) |
| 65 to 74 Years | 126 (50.6%) | 133 (58.3%) |
| 75 Years and over | 56 (81.2%) | 73 (73.7%) |
Disability Class by Sex by Age in West Portsmouth
Disability Class: Hearing Difficulty
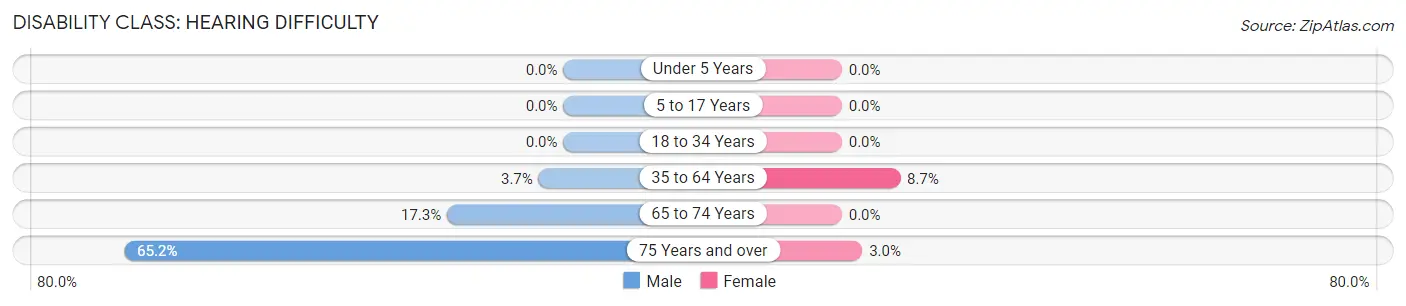
| Age Bracket | Male | Female |
| Under 5 Years | 0 (0.0%) | 0 (0.0%) |
| 5 to 17 Years | 0 (0.0%) | 0 (0.0%) |
| 18 to 34 Years | 0 (0.0%) | 0 (0.0%) |
| 35 to 64 Years | 19 (3.7%) | 43 (8.6%) |
| 65 to 74 Years | 43 (17.3%) | 0 (0.0%) |
| 75 Years and over | 45 (65.2%) | 3 (3.0%) |
Disability Class: Vision Difficulty
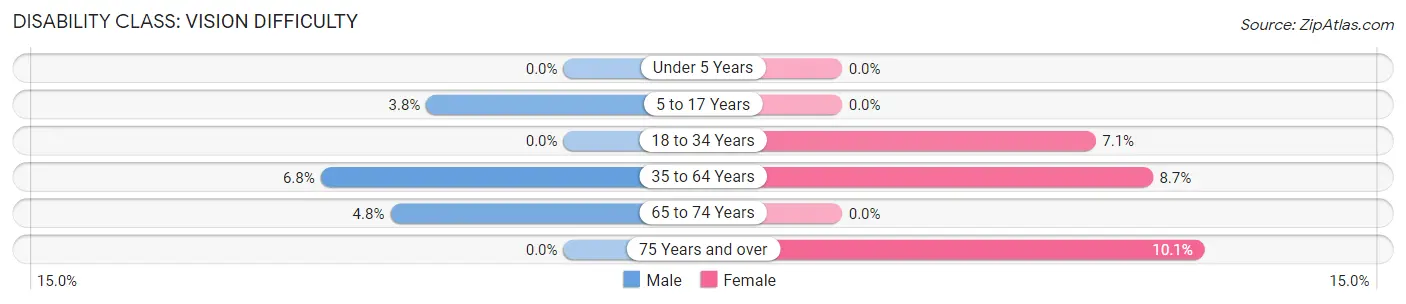
| Age Bracket | Male | Female |
| Under 5 Years | 0 (0.0%) | 0 (0.0%) |
| 5 to 17 Years | 10 (3.8%) | 0 (0.0%) |
| 18 to 34 Years | 0 (0.0%) | 12 (7.1%) |
| 35 to 64 Years | 35 (6.8%) | 43 (8.6%) |
| 65 to 74 Years | 12 (4.8%) | 0 (0.0%) |
| 75 Years and over | 0 (0.0%) | 10 (10.1%) |
Disability Class: Cognitive Difficulty
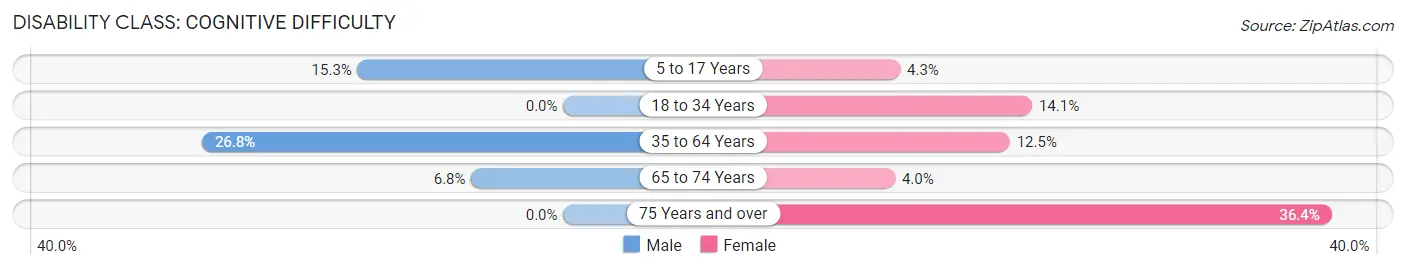
| Age Bracket | Male | Female |
| 5 to 17 Years | 40 (15.3%) | 9 (4.3%) |
| 18 to 34 Years | 0 (0.0%) | 24 (14.1%) |
| 35 to 64 Years | 139 (26.8%) | 62 (12.5%) |
| 65 to 74 Years | 17 (6.8%) | 9 (4.0%) |
| 75 Years and over | 0 (0.0%) | 36 (36.4%) |
Disability Class: Ambulatory Difficulty
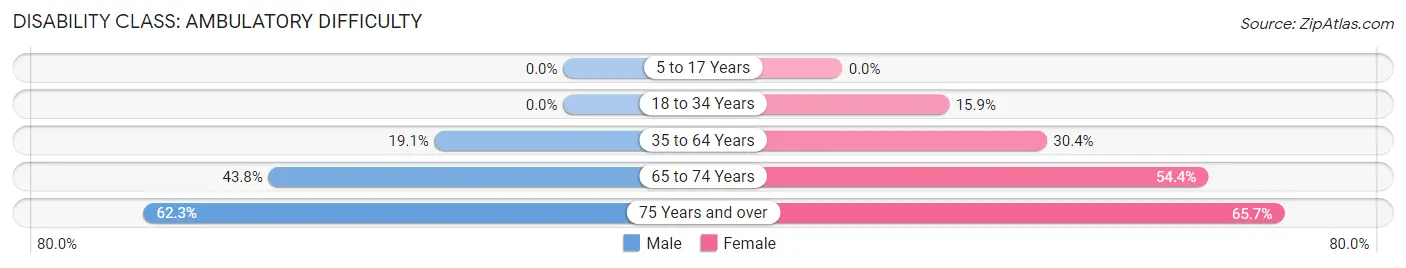
| Age Bracket | Male | Female |
| 5 to 17 Years | 0 (0.0%) | 0 (0.0%) |
| 18 to 34 Years | 0 (0.0%) | 27 (15.9%) |
| 35 to 64 Years | 99 (19.1%) | 151 (30.4%) |
| 65 to 74 Years | 109 (43.8%) | 124 (54.4%) |
| 75 Years and over | 43 (62.3%) | 65 (65.7%) |
Disability Class: Self-Care Difficulty
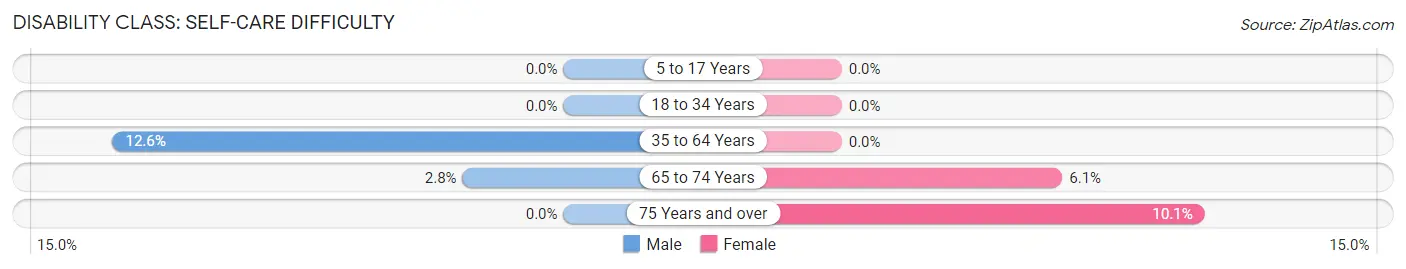
| Age Bracket | Male | Female |
| 5 to 17 Years | 0 (0.0%) | 0 (0.0%) |
| 18 to 34 Years | 0 (0.0%) | 0 (0.0%) |
| 35 to 64 Years | 65 (12.6%) | 0 (0.0%) |
| 65 to 74 Years | 7 (2.8%) | 14 (6.1%) |
| 75 Years and over | 0 (0.0%) | 10 (10.1%) |
Technology Access in West Portsmouth
Computing Device Access in West Portsmouth
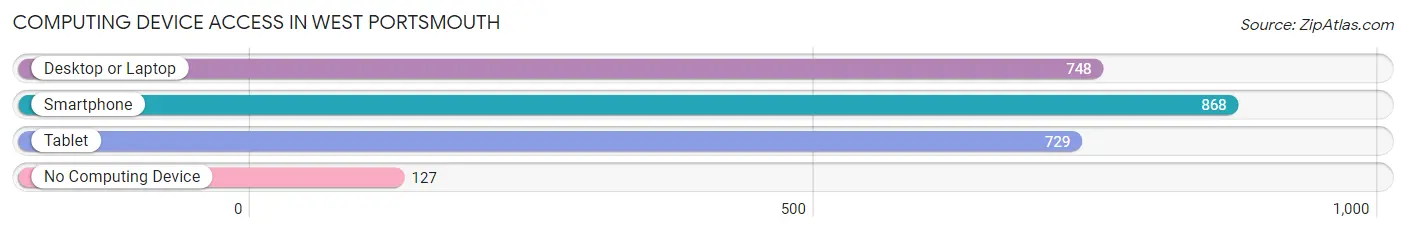
| Device Type | # Households | % Households |
| Desktop or Laptop | 748 | 64.3% |
| Smartphone | 868 | 74.6% |
| Tablet | 729 | 62.6% |
| No Computing Device | 127 | 10.9% |
| Total | 1,164 | 100.0% |
Internet Access in West Portsmouth
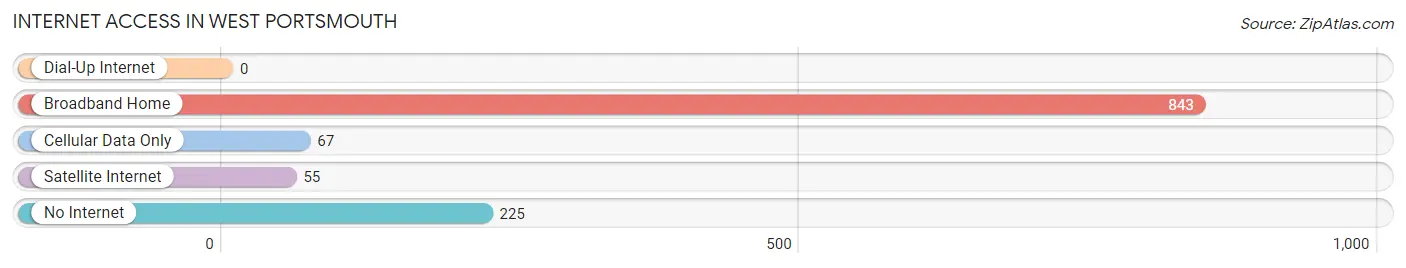
| Internet Type | # Households | % Households |
| Dial-Up Internet | 0 | 0.0% |
| Broadband Home | 843 | 72.4% |
| Cellular Data Only | 67 | 5.8% |
| Satellite Internet | 55 | 4.7% |
| No Internet | 225 | 19.3% |
| Total | 1,164 | 100.0% |
West Portsmouth Summary
Portsmouth, Ohio is a small city located in Scioto County, Ohio. It is situated on the Ohio River, just south of the city of Cincinnati. Portsmouth is the county seat of Scioto County and is the second largest city in the county. The city has a population of approximately 20,000 people and is part of the Portsmouth, Ohio Metropolitan Statistical Area.
History
Portsmouth was founded in 1803 by Colonel Nathaniel Massie, a Revolutionary War veteran. Massie named the city after Portsmouth, England, where he had served in the British Navy. The city was incorporated in 1815 and was the first city in Ohio to be incorporated by an act of the state legislature.
In the early 19th century, Portsmouth was a major port on the Ohio River and was a major center for the shipping of goods and commodities. The city was also a major center for the production of iron and steel. In the late 19th century, the city became a major center for the production of glass and pottery.
Geography
Portsmouth is located in the southwestern corner of Ohio, on the Ohio River. The city is situated on the north bank of the river, just south of the city of Cincinnati. The city is bordered by the towns of Lucasville, New Boston, and Wheelersburg. The city is located in a hilly region of the state, with the highest point in the city being the Scioto County Courthouse, which is located at an elevation of 845 feet.
The climate in Portsmouth is humid continental, with hot summers and cold winters. The average annual temperature is around 50 degrees Fahrenheit, with the average high temperature in the summer months being around 80 degrees Fahrenheit and the average low temperature in the winter months being around 20 degrees Fahrenheit.
Economy
Portsmouth has a diverse economy, with a variety of industries providing employment opportunities. The city is home to several manufacturing companies, including a steel mill, a glass factory, and a pottery factory. The city is also home to several retail stores, restaurants, and other businesses.
The city is also home to several educational institutions, including Shawnee State University, Ohio University-Chillicothe, and the University of Rio Grande. The city is also home to several healthcare facilities, including the Southern Ohio Medical Center and the Portsmouth Regional Medical Center.
Demographics
As of the 2010 census, the population of Portsmouth was 20,226. The racial makeup of the city was 87.3% White, 8.7% African American, 0.3% Native American, 0.7% Asian, 0.1% Pacific Islander, and 2.9% from two or more races. The median household income in the city was $30,945, and the median family income was $37,945. The per capita income in the city was $17,845.
Portsmouth is home to a variety of religious denominations, including Baptist, Methodist, Presbyterian, Catholic, and Lutheran. The city is also home to a variety of cultural and recreational activities, including the Portsmouth Little Theatre, the Portsmouth Symphony Orchestra, and the Portsmouth Museum of Art.
Common Questions
What is Per Capita Income in West Portsmouth?
Per Capita income in West Portsmouth is $23,494.
What is the Median Family Income in West Portsmouth?
Median Family Income in West Portsmouth is $60,577.
What is the Median Household income in West Portsmouth?
Median Household Income in West Portsmouth is $38,356.
What is Income or Wage Gap in West Portsmouth?
Income or Wage Gap in West Portsmouth is 38.6%.
Women in West Portsmouth earn 61.4 cents for every dollar earned by a man.
What is Inequality or Gini Index in West Portsmouth?
Inequality or Gini Index in West Portsmouth is 0.45.
What is the Total Population of West Portsmouth?
Total Population of West Portsmouth is 2,540.
What is the Total Male Population of West Portsmouth?
Total Male Population of West Portsmouth is 1,259.
What is the Total Female Population of West Portsmouth?
Total Female Population of West Portsmouth is 1,281.
What is the Ratio of Males per 100 Females in West Portsmouth?
There are 98.28 Males per 100 Females in West Portsmouth.
What is the Ratio of Females per 100 Males in West Portsmouth?
There are 101.75 Females per 100 Males in West Portsmouth.
What is the Median Population Age in West Portsmouth?
Median Population Age in West Portsmouth is 47.2 Years.
What is the Average Family Size in West Portsmouth
Average Family Size in West Portsmouth is 3.2 People.
What is the Average Household Size in West Portsmouth
Average Household Size in West Portsmouth is 2.2 People.
How Large is the Labor Force in West Portsmouth?
There are 905 People in the Labor Forcein in West Portsmouth.
What is the Percentage of People in the Labor Force in West Portsmouth?
45.9% of People are in the Labor Force in West Portsmouth.