West Alexandria, OH Map & Demographics
West Alexandria Map
West Alexandria Overview
$28,720
PER CAPITA INCOME
$74,375
AVG FAMILY INCOME
$56,800
AVG HOUSEHOLD INCOME
49.3%
WAGE / INCOME GAP [ % ]
50.7¢/ $1
WAGE / INCOME GAP [ $ ]
0.39
INEQUALITY / GINI INDEX
1,442
TOTAL POPULATION
702
MALE POPULATION
740
FEMALE POPULATION
94.86
MALES / 100 FEMALES
105.41
FEMALES / 100 MALES
33.5
MEDIAN AGE
3.1
AVG FAMILY SIZE
2.5
AVG HOUSEHOLD SIZE
724
LABOR FORCE [ PEOPLE ]
65.8%
PERCENT IN LABOR FORCE
4.6%
UNEMPLOYMENT RATE
West Alexandria Zip Codes
West Alexandria Area Codes
Income in West Alexandria
Income Overview in West Alexandria
Per Capita Income in West Alexandria is $28,720, while median incomes of families and households are $74,375 and $56,800 respectively.
| Characteristic | Number | Measure |
| Per Capita Income | 1,442 | $28,720 |
| Median Family Income | 387 | $74,375 |
| Mean Family Income | 387 | $86,191 |
| Median Household Income | 578 | $56,800 |
| Mean Household Income | 578 | $70,445 |
| Income Deficit | 387 | $0 |
| Wage / Income Gap (%) | 1,442 | 49.34% |
| Wage / Income Gap ($) | 1,442 | 50.66¢ per $1 |
| Gini / Inequality Index | 1,442 | 0.39 |
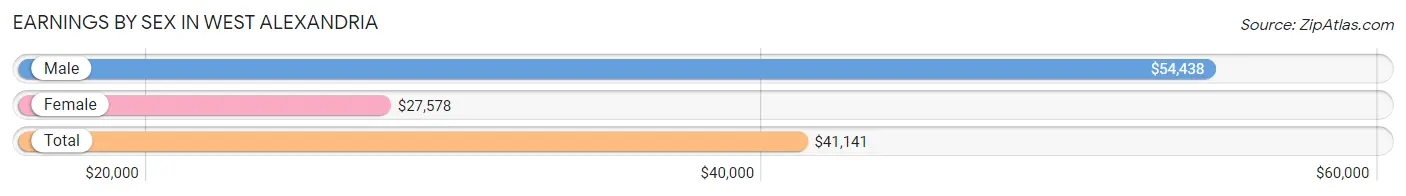
Earnings by Sex in West Alexandria
Average Earnings in West Alexandria are $41,141, $54,438 for men and $27,578 for women, a difference of 49.3%.
| Sex | Number | Average Earnings |
| Male | 384 (53.1%) | $54,438 |
| Female | 339 (46.9%) | $27,578 |
| Total | 723 (100.0%) | $41,141 |
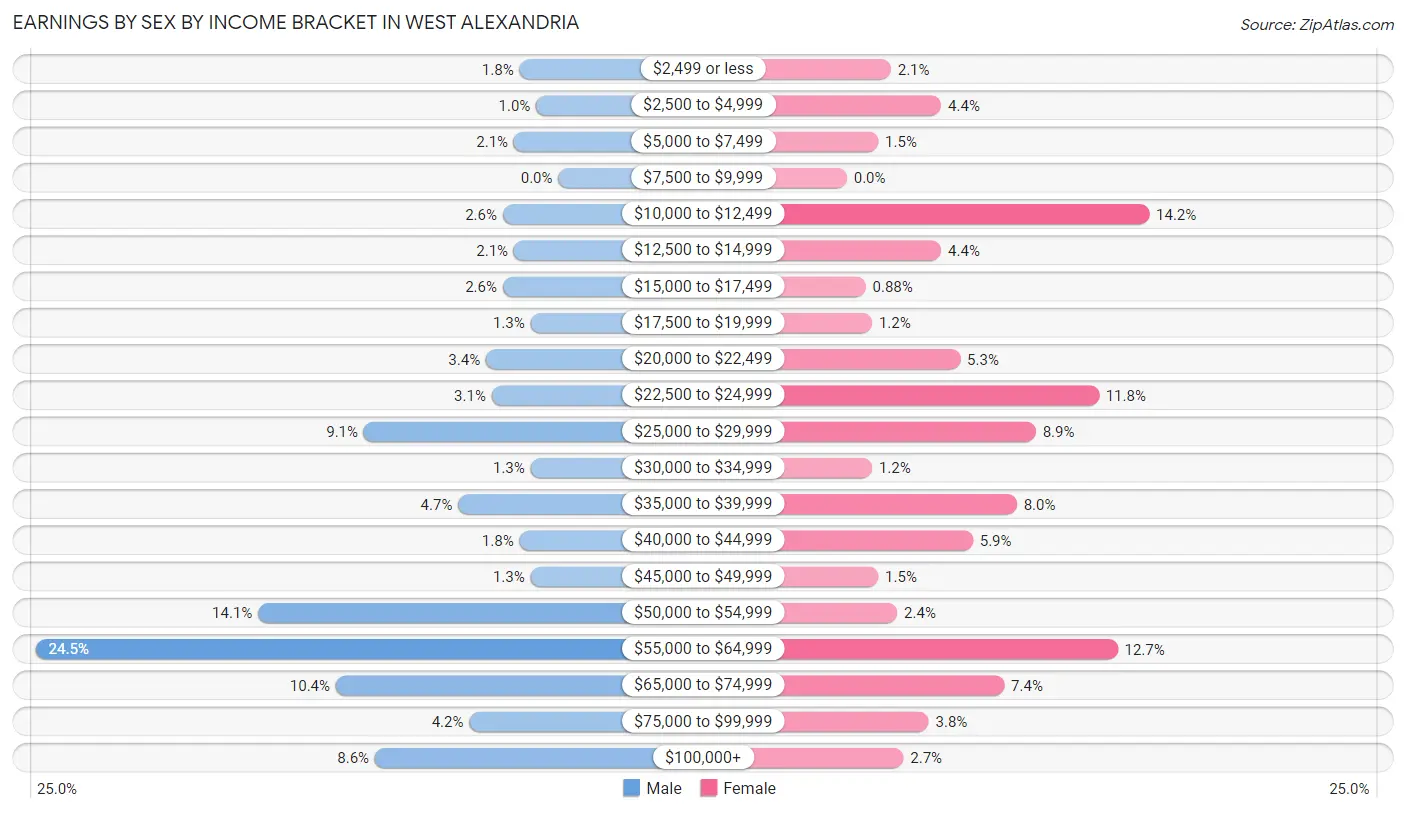
Earnings by Sex by Income Bracket in West Alexandria
The most common earnings brackets in West Alexandria are $55,000 to $64,999 for men (94 | 24.5%) and $10,000 to $12,499 for women (48 | 14.2%).
| Income | Male | Female |
| $2,499 or less | 7 (1.8%) | 7 (2.1%) |
| $2,500 to $4,999 | 4 (1.0%) | 15 (4.4%) |
| $5,000 to $7,499 | 8 (2.1%) | 5 (1.5%) |
| $7,500 to $9,999 | 0 (0.0%) | 0 (0.0%) |
| $10,000 to $12,499 | 10 (2.6%) | 48 (14.2%) |
| $12,500 to $14,999 | 8 (2.1%) | 15 (4.4%) |
| $15,000 to $17,499 | 10 (2.6%) | 3 (0.9%) |
| $17,500 to $19,999 | 5 (1.3%) | 4 (1.2%) |
| $20,000 to $22,499 | 13 (3.4%) | 18 (5.3%) |
| $22,500 to $24,999 | 12 (3.1%) | 40 (11.8%) |
| $25,000 to $29,999 | 35 (9.1%) | 30 (8.8%) |
| $30,000 to $34,999 | 5 (1.3%) | 4 (1.2%) |
| $35,000 to $39,999 | 18 (4.7%) | 27 (8.0%) |
| $40,000 to $44,999 | 7 (1.8%) | 20 (5.9%) |
| $45,000 to $49,999 | 5 (1.3%) | 5 (1.5%) |
| $50,000 to $54,999 | 54 (14.1%) | 8 (2.4%) |
| $55,000 to $64,999 | 94 (24.5%) | 43 (12.7%) |
| $65,000 to $74,999 | 40 (10.4%) | 25 (7.4%) |
| $75,000 to $99,999 | 16 (4.2%) | 13 (3.8%) |
| $100,000+ | 33 (8.6%) | 9 (2.6%) |
| Total | 384 (100.0%) | 339 (100.0%) |
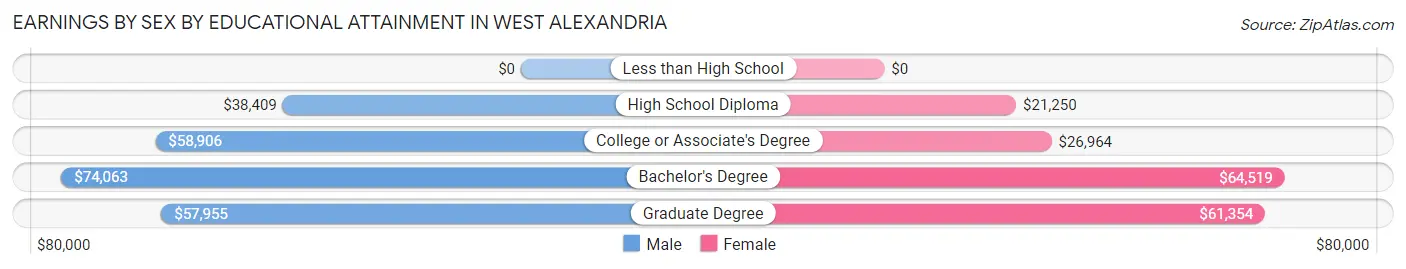
Earnings by Sex by Educational Attainment in West Alexandria
Average earnings in West Alexandria are $54,750 for men and $35,260 for women, a difference of 35.6%. Men with an educational attainment of bachelor's degree enjoy the highest average annual earnings of $74,063, while those with high school diploma education earn the least with $38,409. Women with an educational attainment of bachelor's degree earn the most with the average annual earnings of $64,519, while those with high school diploma education have the smallest earnings of $21,250.
| Educational Attainment | Male Income | Female Income |
| Less than High School | - | - |
| High School Diploma | $38,409 | $21,250 |
| College or Associate's Degree | $58,906 | $26,964 |
| Bachelor's Degree | $74,063 | $64,519 |
| Graduate Degree | $57,955 | $61,354 |
| Total | $54,750 | $35,260 |
Family Income in West Alexandria
Family Income Brackets in West Alexandria
According to the West Alexandria family income data, there are 100 families falling into the $100,000 to $149,999 income range, which is the most common income bracket and makes up 25.8% of all families. Conversely, the $10,000 to $14,999 income bracket is the least frequent group with only 3 families (0.8%) belonging to this category.
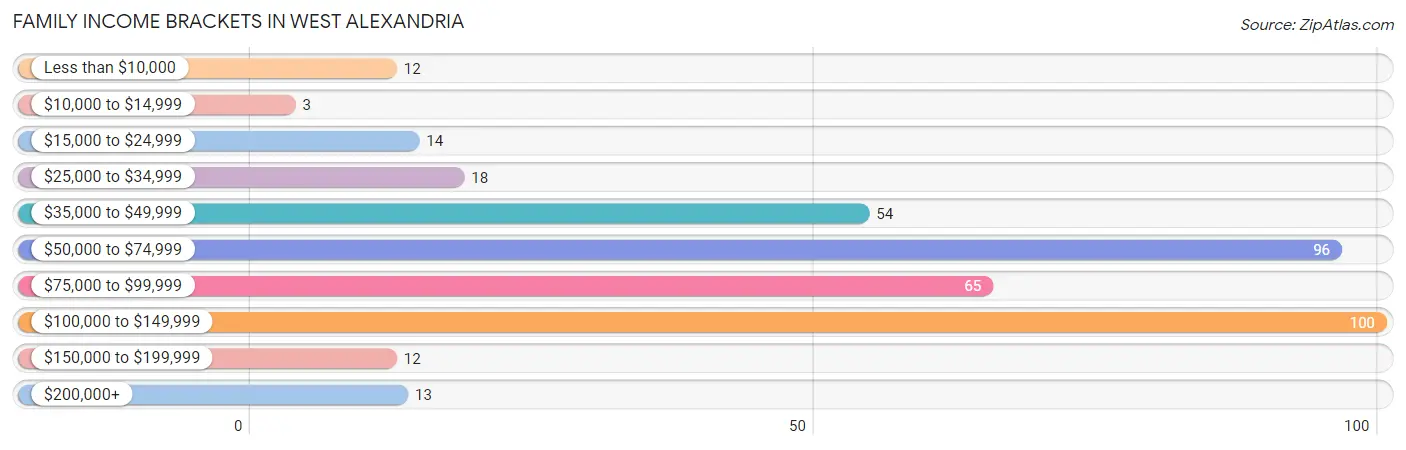
| Income Bracket | # Families | % Families |
| Less than $10,000 | 12 | 3.1% |
| $10,000 to $14,999 | 3 | 0.8% |
| $15,000 to $24,999 | 14 | 3.6% |
| $25,000 to $34,999 | 18 | 4.7% |
| $35,000 to $49,999 | 54 | 14.0% |
| $50,000 to $74,999 | 96 | 24.8% |
| $75,000 to $99,999 | 65 | 16.8% |
| $100,000 to $149,999 | 100 | 25.8% |
| $150,000 to $199,999 | 12 | 3.1% |
| $200,000+ | 13 | 3.4% |
Family Income by Famaliy Size in West Alexandria
5-person families (42 | 10.8%) account for the highest median family income in West Alexandria with $97,500 per family, while 2-person families (200 | 51.7%) have the highest median income of $35,341 per family member.
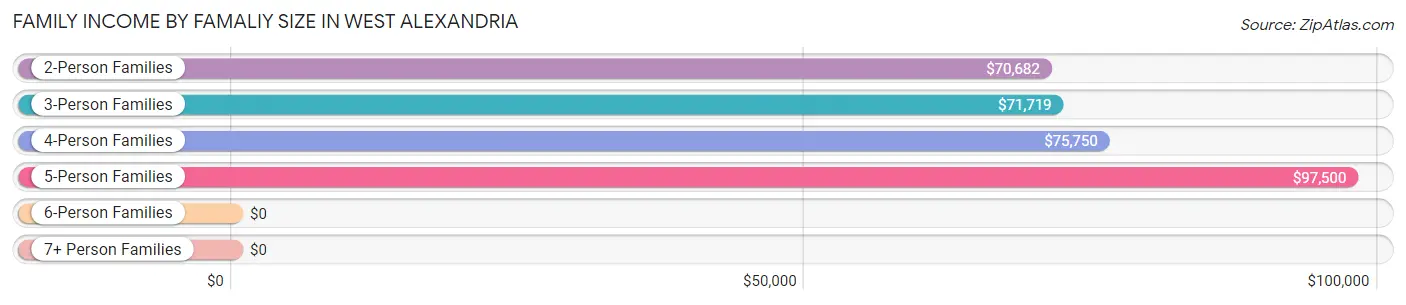
| Income Bracket | # Families | Median Income |
| 2-Person Families | 200 (51.7%) | $70,682 |
| 3-Person Families | 61 (15.8%) | $71,719 |
| 4-Person Families | 73 (18.9%) | $75,750 |
| 5-Person Families | 42 (10.8%) | $97,500 |
| 6-Person Families | 11 (2.8%) | $0 |
| 7+ Person Families | 0 (0.0%) | $0 |
| Total | 387 (100.0%) | $74,375 |
Family Income by Number of Earners in West Alexandria
The median family income in West Alexandria is $74,375, with families comprising 3+ earners (39) having the highest median family income of $103,309, while families with no earners (69) have the lowest median family income of $36,250, accounting for 10.1% and 17.8% of families, respectively.
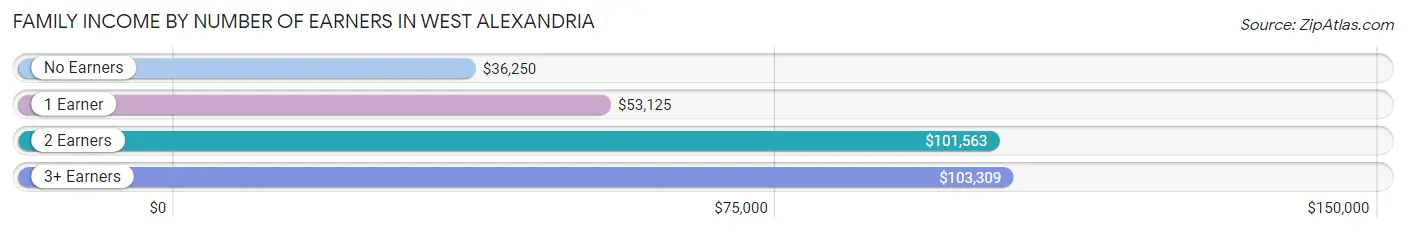
| Number of Earners | # Families | Median Income |
| No Earners | 69 (17.8%) | $36,250 |
| 1 Earner | 122 (31.5%) | $53,125 |
| 2 Earners | 157 (40.6%) | $101,563 |
| 3+ Earners | 39 (10.1%) | $103,309 |
| Total | 387 (100.0%) | $74,375 |
Household Income in West Alexandria
Household Income Brackets in West Alexandria
With 149 households falling in the category, the $50,000 to $74,999 income range is the most frequent in West Alexandria, accounting for 25.8% of all households. In contrast, only 13 households (2.2%) fall into the $200,000+ income bracket, making it the least populous group.
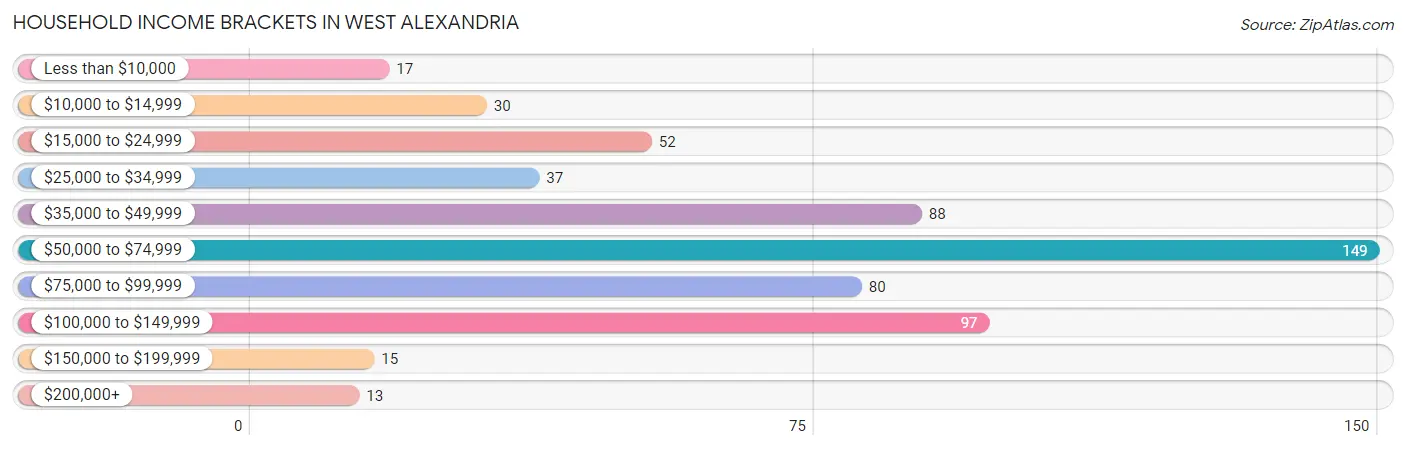
| Income Bracket | # Households | % Households |
| Less than $10,000 | 17 | 2.9% |
| $10,000 to $14,999 | 30 | 5.2% |
| $15,000 to $24,999 | 52 | 9.0% |
| $25,000 to $34,999 | 37 | 6.4% |
| $35,000 to $49,999 | 88 | 15.2% |
| $50,000 to $74,999 | 149 | 25.8% |
| $75,000 to $99,999 | 80 | 13.8% |
| $100,000 to $149,999 | 97 | 16.8% |
| $150,000 to $199,999 | 15 | 2.6% |
| $200,000+ | 13 | 2.2% |
Household Income by Householder Age in West Alexandria
The median household income in West Alexandria is $56,800, with the highest median household income of $66,771 found in the 25 to 44 years age bracket for the primary householder. A total of 219 households (37.9%) fall into this category. Meanwhile, the 65+ years age bracket for the primary householder has the lowest median household income of $35,368, with 143 households (24.7%) in this group.
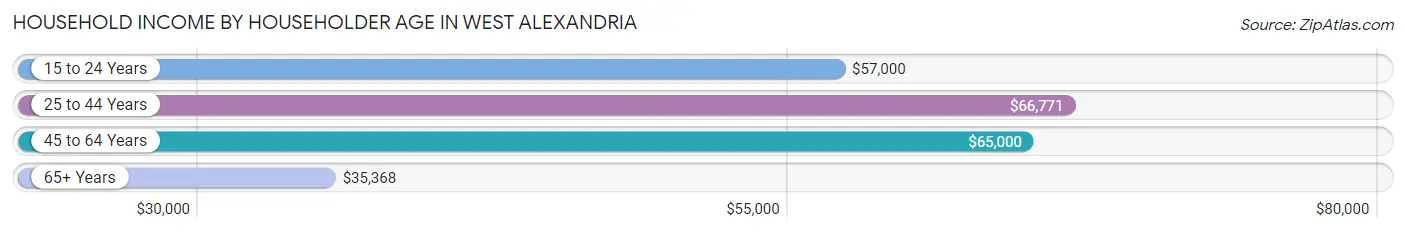
| Income Bracket | # Households | Median Income |
| 15 to 24 Years | 32 (5.5%) | $57,000 |
| 25 to 44 Years | 219 (37.9%) | $66,771 |
| 45 to 64 Years | 184 (31.8%) | $65,000 |
| 65+ Years | 143 (24.7%) | $35,368 |
| Total | 578 (100.0%) | $56,800 |
Poverty in West Alexandria
Income Below Poverty by Sex and Age in West Alexandria
With 10.3% poverty level for males and 6.8% for females among the residents of West Alexandria, under 5 year old males and 65 to 74 year old females are the most vulnerable to poverty, with 18 males (36.7%) and 8 females (15.7%) in their respective age groups living below the poverty level.
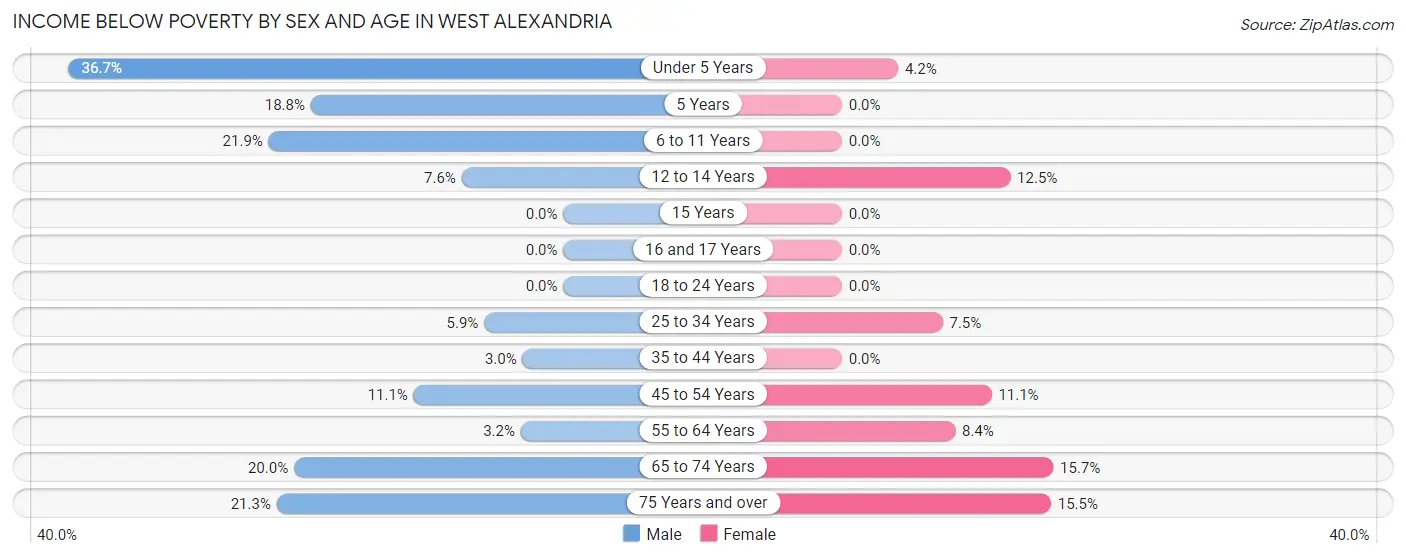
| Age Bracket | Male | Female |
| Under 5 Years | 18 (36.7%) | 3 (4.2%) |
| 5 Years | 3 (18.8%) | 0 (0.0%) |
| 6 to 11 Years | 7 (21.9%) | 0 (0.0%) |
| 12 to 14 Years | 4 (7.5%) | 3 (12.5%) |
| 15 Years | 0 (0.0%) | 0 (0.0%) |
| 16 and 17 Years | 0 (0.0%) | 0 (0.0%) |
| 18 to 24 Years | 0 (0.0%) | 0 (0.0%) |
| 25 to 34 Years | 7 (5.9%) | 11 (7.5%) |
| 35 to 44 Years | 3 (3.0%) | 0 (0.0%) |
| 45 to 54 Years | 5 (11.1%) | 6 (11.1%) |
| 55 to 64 Years | 3 (3.2%) | 10 (8.4%) |
| 65 to 74 Years | 11 (20.0%) | 8 (15.7%) |
| 75 Years and over | 10 (21.3%) | 9 (15.5%) |
| Total | 71 (10.3%) | 50 (6.8%) |
Income Above Poverty by Sex and Age in West Alexandria
According to the poverty statistics in West Alexandria, males aged 15 years and females aged 5 years are the age groups that are most secure financially, with 100.0% of males and 100.0% of females in these age groups living above the poverty line.
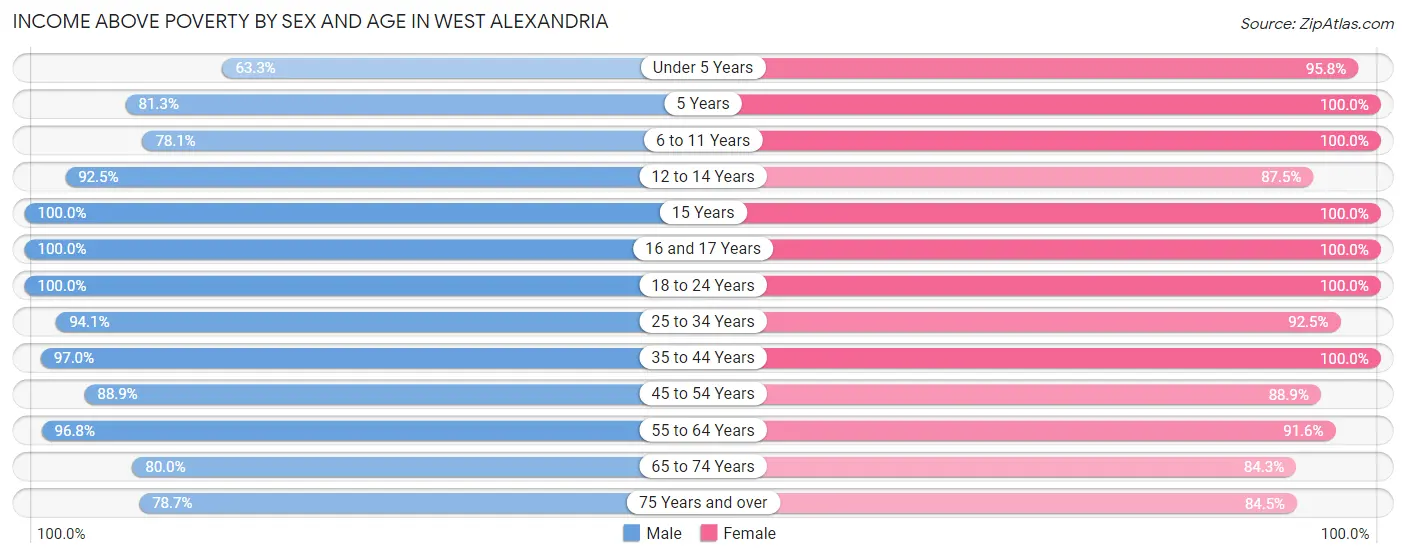
| Age Bracket | Male | Female |
| Under 5 Years | 31 (63.3%) | 69 (95.8%) |
| 5 Years | 13 (81.2%) | 20 (100.0%) |
| 6 to 11 Years | 25 (78.1%) | 54 (100.0%) |
| 12 to 14 Years | 49 (92.4%) | 21 (87.5%) |
| 15 Years | 3 (100.0%) | 5 (100.0%) |
| 16 and 17 Years | 9 (100.0%) | 14 (100.0%) |
| 18 to 24 Years | 66 (100.0%) | 51 (100.0%) |
| 25 to 34 Years | 112 (94.1%) | 136 (92.5%) |
| 35 to 44 Years | 96 (97.0%) | 71 (100.0%) |
| 45 to 54 Years | 40 (88.9%) | 48 (88.9%) |
| 55 to 64 Years | 92 (96.8%) | 109 (91.6%) |
| 65 to 74 Years | 44 (80.0%) | 43 (84.3%) |
| 75 Years and over | 37 (78.7%) | 49 (84.5%) |
| Total | 617 (89.7%) | 690 (93.2%) |
Income Below Poverty Among Married-Couple Families in West Alexandria
The poverty statistics for married-couple families in West Alexandria show that 2.6% or 7 of the total 272 families live below the poverty line. Families with no children have the highest poverty rate of 5.0%, comprising of 7 families. On the other hand, families with 1 or 2 children have the lowest poverty rate of 0.0%, which includes 0 families.
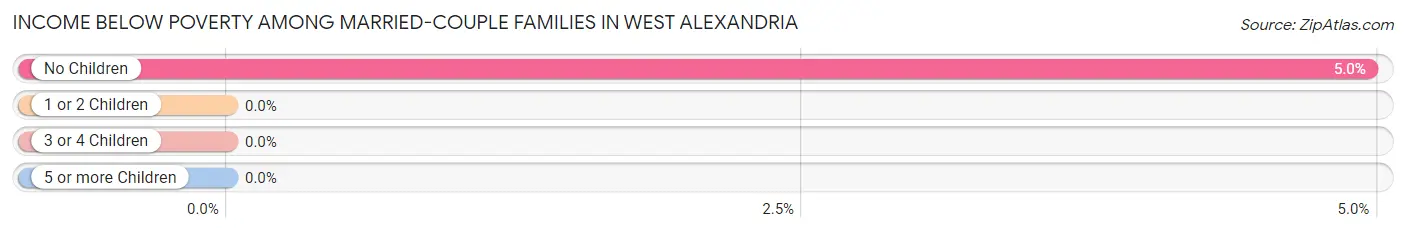
| Children | Above Poverty | Below Poverty |
| No Children | 134 (95.0%) | 7 (5.0%) |
| 1 or 2 Children | 82 (100.0%) | 0 (0.0%) |
| 3 or 4 Children | 49 (100.0%) | 0 (0.0%) |
| 5 or more Children | 0 (0.0%) | 0 (0.0%) |
| Total | 265 (97.4%) | 7 (2.6%) |
Income Below Poverty Among Single-Parent Households in West Alexandria
According to the poverty data in West Alexandria, 32.4% or 12 single-father households and 7.7% or 6 single-mother households are living below the poverty line. Among single-father households, those with 3 or 4 children have the highest poverty rate, with 3 households (100.0%) experiencing poverty. Likewise, among single-mother households, those with 3 or 4 children have the highest poverty rate, with 3 households (50.0%) falling below the poverty line.
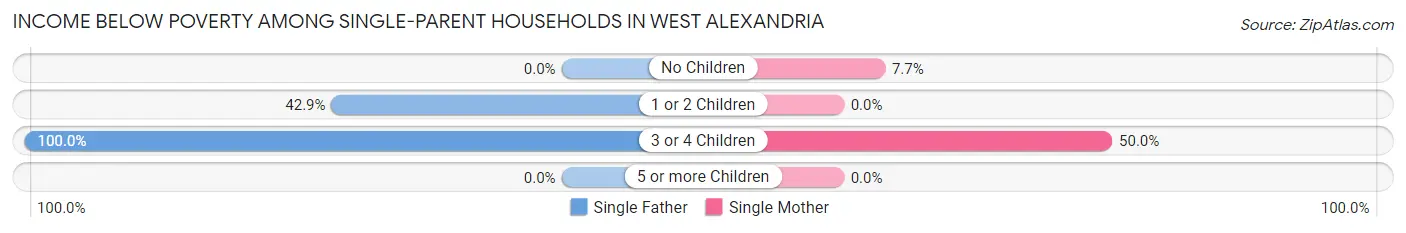
| Children | Single Father | Single Mother |
| No Children | 0 (0.0%) | 3 (7.7%) |
| 1 or 2 Children | 9 (42.9%) | 0 (0.0%) |
| 3 or 4 Children | 3 (100.0%) | 3 (50.0%) |
| 5 or more Children | 0 (0.0%) | 0 (0.0%) |
| Total | 12 (32.4%) | 6 (7.7%) |
Income Below Poverty Among Married-Couple vs Single-Parent Households in West Alexandria
The poverty data for West Alexandria shows that 7 of the married-couple family households (2.6%) and 18 of the single-parent households (15.7%) are living below the poverty level. Within the married-couple family households, those with no children have the highest poverty rate, with 7 households (5.0%) falling below the poverty line. Among the single-parent households, those with 3 or 4 children have the highest poverty rate, with 6 household (66.7%) living below poverty.
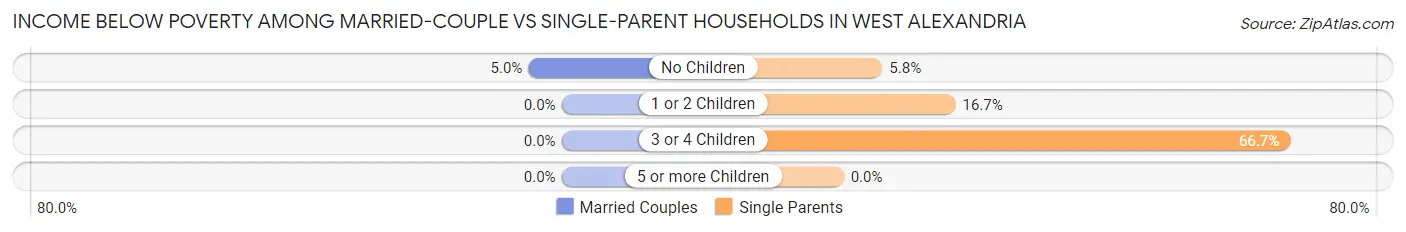
| Children | Married-Couple Families | Single-Parent Households |
| No Children | 7 (5.0%) | 3 (5.8%) |
| 1 or 2 Children | 0 (0.0%) | 9 (16.7%) |
| 3 or 4 Children | 0 (0.0%) | 6 (66.7%) |
| 5 or more Children | 0 (0.0%) | 0 (0.0%) |
| Total | 7 (2.6%) | 18 (15.7%) |
Race in West Alexandria
The most populous races in West Alexandria are White / Caucasian (1,314 | 91.1%), Hispanic or Latino (111 | 7.7%), and Two or more Races (78 | 5.4%).
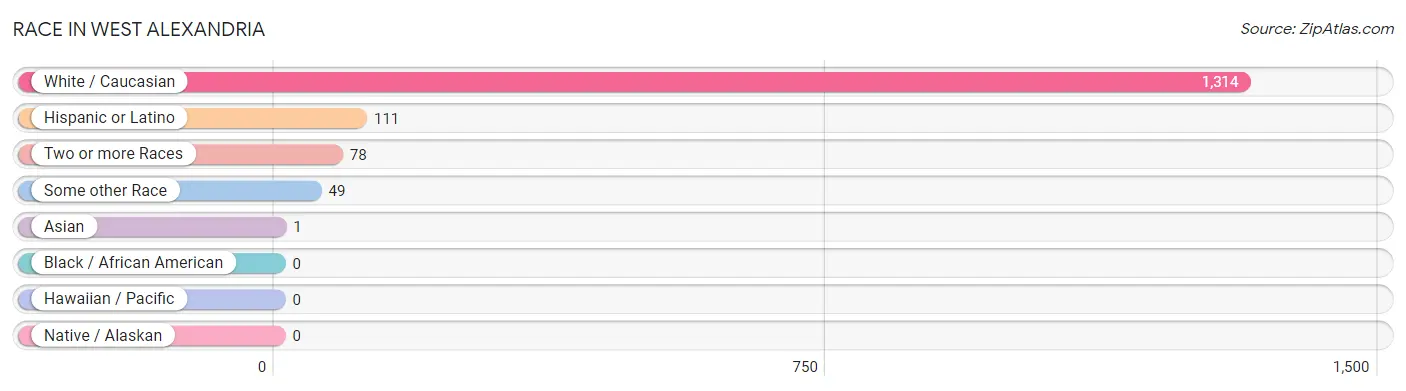
| Race | # Population | % Population |
| Asian | 1 | 0.1% |
| Black / African American | 0 | 0.0% |
| Hawaiian / Pacific | 0 | 0.0% |
| Hispanic or Latino | 111 | 7.7% |
| Native / Alaskan | 0 | 0.0% |
| White / Caucasian | 1,314 | 91.1% |
| Two or more Races | 78 | 5.4% |
| Some other Race | 49 | 3.4% |
| Total | 1,442 | 100.0% |
Ancestry in West Alexandria
The most populous ancestries reported in West Alexandria are German (385 | 26.7%), English (143 | 9.9%), Irish (140 | 9.7%), American (121 | 8.4%), and Mexican (111 | 7.7%), together accounting for 62.4% of all West Alexandria residents.
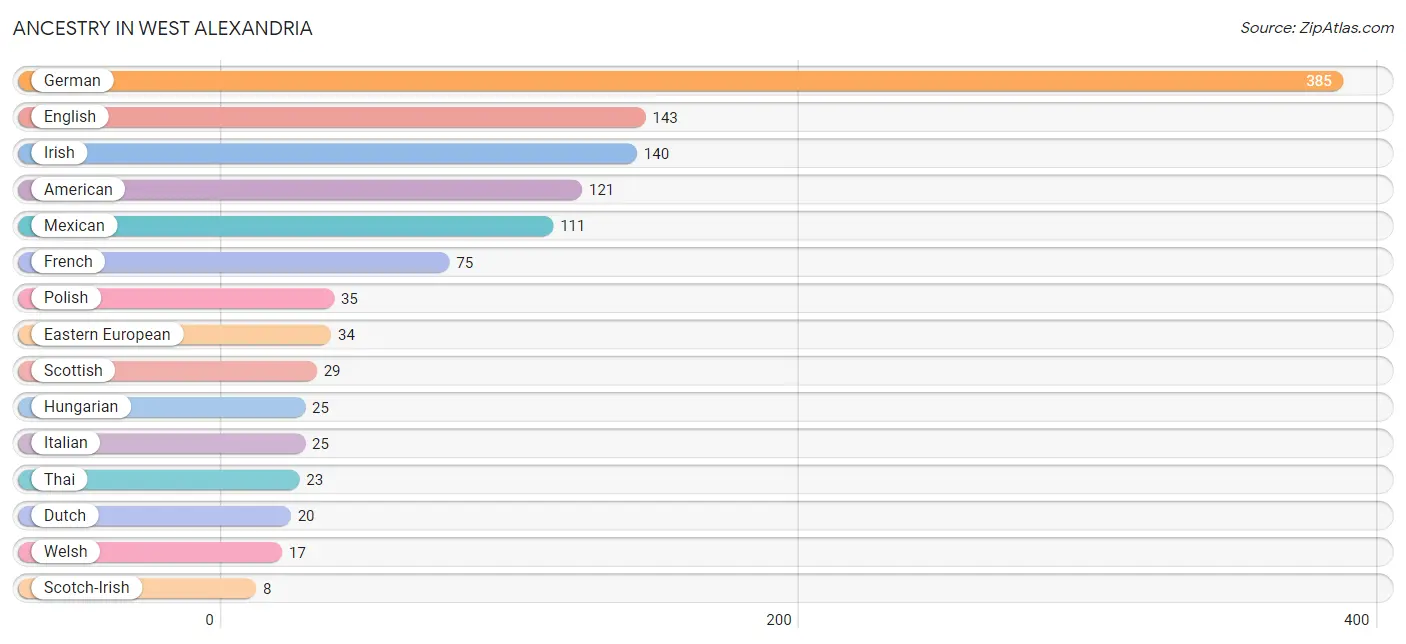
| Ancestry | # Population | % Population |
| American | 121 | 8.4% |
| Dutch | 20 | 1.4% |
| Eastern European | 34 | 2.4% |
| English | 143 | 9.9% |
| European | 5 | 0.4% |
| French | 75 | 5.2% |
| German | 385 | 26.7% |
| Greek | 4 | 0.3% |
| Hungarian | 25 | 1.7% |
| Irish | 140 | 9.7% |
| Italian | 25 | 1.7% |
| Lithuanian | 6 | 0.4% |
| Mexican | 111 | 7.7% |
| Polish | 35 | 2.4% |
| Romanian | 2 | 0.1% |
| Scotch-Irish | 8 | 0.5% |
| Scottish | 29 | 2.0% |
| Slovak | 7 | 0.5% |
| Swedish | 4 | 0.3% |
| Thai | 23 | 1.6% |
| Ukrainian | 2 | 0.1% |
| Welsh | 17 | 1.2% | View All 22 Rows |
Immigrants in West Alexandria
The most numerous immigrant groups reported in West Alexandria came from Central America (15 | 1.0%), Latin America (15 | 1.0%), Mexico (15 | 1.0%), Europe (3 | 0.2%), and Germany (3 | 0.2%), together accounting for 3.5% of all West Alexandria residents.
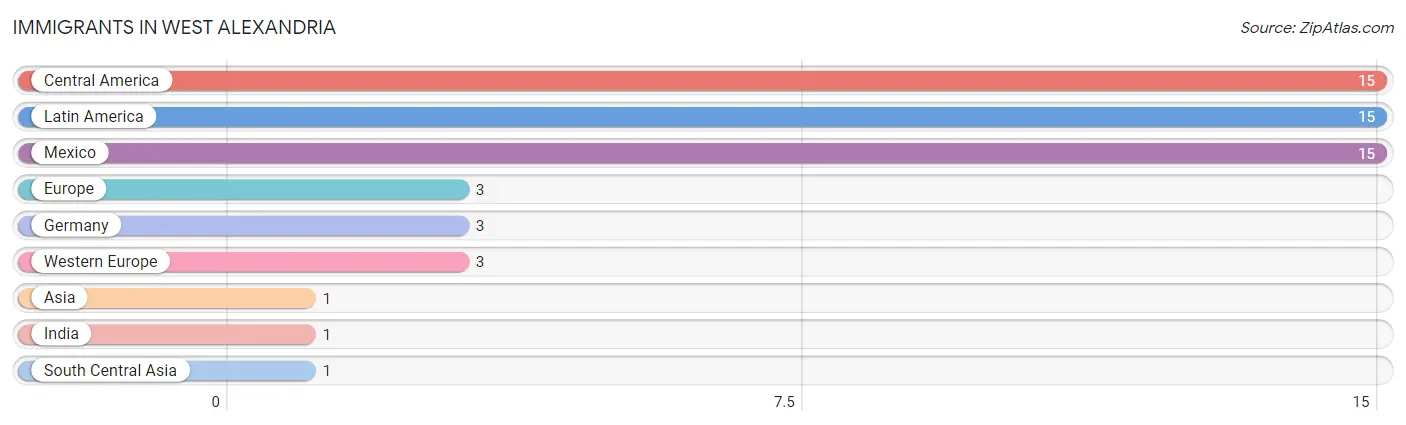
| Immigration Origin | # Population | % Population |
| Asia | 1 | 0.1% |
| Central America | 15 | 1.0% |
| Europe | 3 | 0.2% |
| Germany | 3 | 0.2% |
| India | 1 | 0.1% |
| Latin America | 15 | 1.0% |
| Mexico | 15 | 1.0% |
| South Central Asia | 1 | 0.1% |
| Western Europe | 3 | 0.2% | View All 9 Rows |
Sex and Age in West Alexandria
Sex and Age in West Alexandria
The most populous age groups in West Alexandria are 30 to 34 Years (77 | 11.0%) for men and 25 to 29 Years (93 | 12.6%) for women.
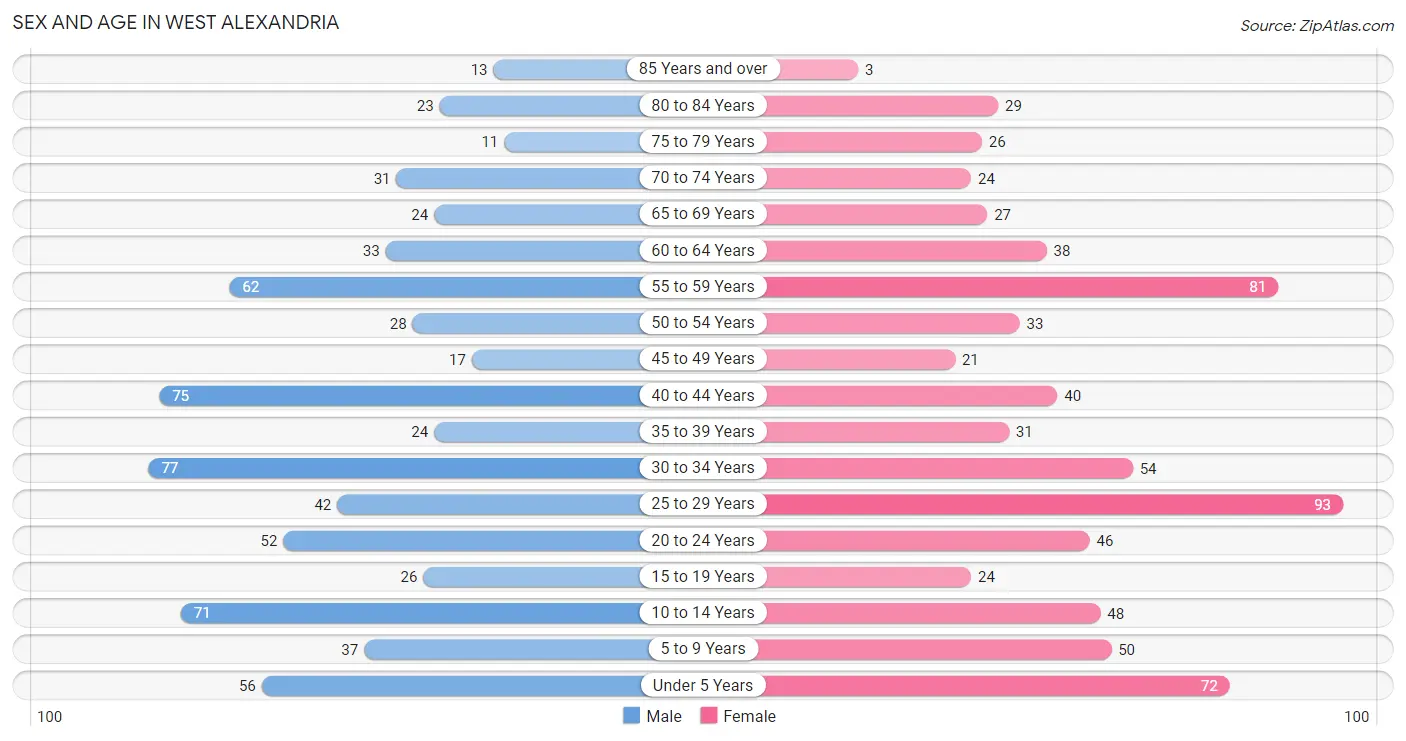
| Age Bracket | Male | Female |
| Under 5 Years | 56 (8.0%) | 72 (9.7%) |
| 5 to 9 Years | 37 (5.3%) | 50 (6.8%) |
| 10 to 14 Years | 71 (10.1%) | 48 (6.5%) |
| 15 to 19 Years | 26 (3.7%) | 24 (3.2%) |
| 20 to 24 Years | 52 (7.4%) | 46 (6.2%) |
| 25 to 29 Years | 42 (6.0%) | 93 (12.6%) |
| 30 to 34 Years | 77 (11.0%) | 54 (7.3%) |
| 35 to 39 Years | 24 (3.4%) | 31 (4.2%) |
| 40 to 44 Years | 75 (10.7%) | 40 (5.4%) |
| 45 to 49 Years | 17 (2.4%) | 21 (2.8%) |
| 50 to 54 Years | 28 (4.0%) | 33 (4.5%) |
| 55 to 59 Years | 62 (8.8%) | 81 (11.0%) |
| 60 to 64 Years | 33 (4.7%) | 38 (5.1%) |
| 65 to 69 Years | 24 (3.4%) | 27 (3.6%) |
| 70 to 74 Years | 31 (4.4%) | 24 (3.2%) |
| 75 to 79 Years | 11 (1.6%) | 26 (3.5%) |
| 80 to 84 Years | 23 (3.3%) | 29 (3.9%) |
| 85 Years and over | 13 (1.8%) | 3 (0.4%) |
| Total | 702 (100.0%) | 740 (100.0%) |
Families and Households in West Alexandria
Median Family Size in West Alexandria
The median family size in West Alexandria is 3.11 persons per family, with married-couple families (272 | 70.3%) accounting for the largest median family size of 3.22 persons per family. On the other hand, single male/father families (37 | 9.6%) represent the smallest median family size with 2.43 persons per family.
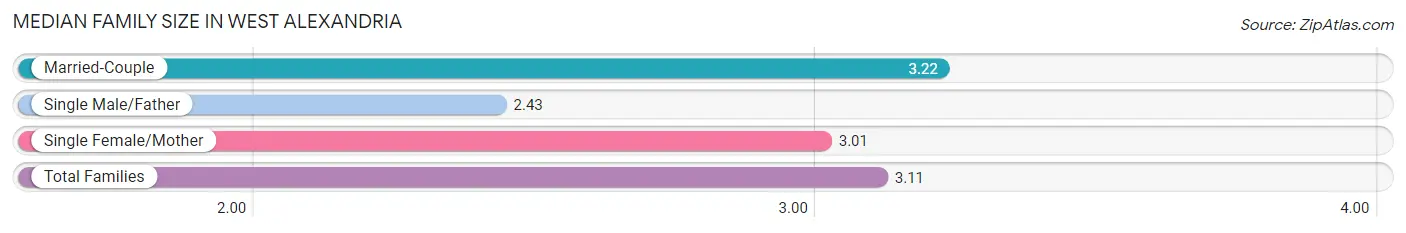
| Family Type | # Families | Family Size |
| Married-Couple | 272 (70.3%) | 3.22 |
| Single Male/Father | 37 (9.6%) | 2.43 |
| Single Female/Mother | 78 (20.2%) | 3.01 |
| Total Families | 387 (100.0%) | 3.11 |
Median Household Size in West Alexandria
The median household size in West Alexandria is 2.49 persons per household, with married-couple households (272 | 47.1%) accounting for the largest median household size of 3.26 persons per household. non-family households (191 | 33.0%) represent the smallest median household size with 1.06 persons per household.
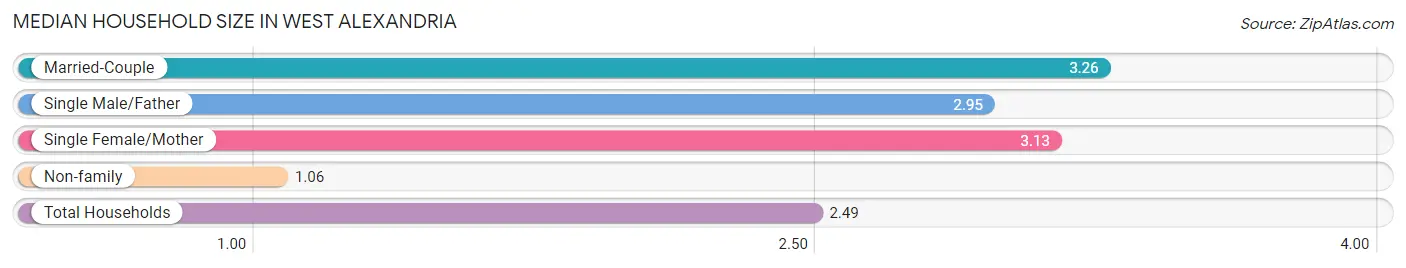
| Household Type | # Households | Household Size |
| Married-Couple | 272 (47.1%) | 3.26 |
| Single Male/Father | 37 (6.4%) | 2.95 |
| Single Female/Mother | 78 (13.5%) | 3.13 |
| Non-family | 191 (33.0%) | 1.06 |
| Total Households | 578 (100.0%) | 2.49 |
Household Size by Marriage Status in West Alexandria
Out of a total of 578 households in West Alexandria, 387 (67.0%) are family households, while 191 (33.0%) are nonfamily households. The most numerous type of family households are 2-person households, comprising 189, and the most common type of nonfamily households are 1-person households, comprising 180.
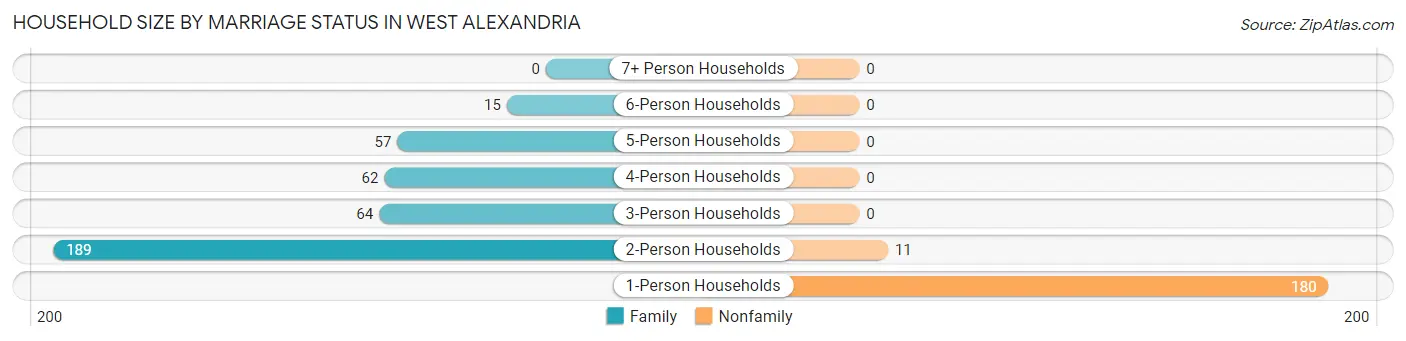
| Household Size | Family Households | Nonfamily Households |
| 1-Person Households | - | 180 (31.1%) |
| 2-Person Households | 189 (32.7%) | 11 (1.9%) |
| 3-Person Households | 64 (11.1%) | 0 (0.0%) |
| 4-Person Households | 62 (10.7%) | 0 (0.0%) |
| 5-Person Households | 57 (9.9%) | 0 (0.0%) |
| 6-Person Households | 15 (2.6%) | 0 (0.0%) |
| 7+ Person Households | 0 (0.0%) | 0 (0.0%) |
| Total | 387 (67.0%) | 191 (33.0%) |
Female Fertility in West Alexandria
Fertility by Age in West Alexandria
Average fertility rate in West Alexandria is 93.0 births per 1,000 women. Women in the age bracket of 20 to 34 years have the highest fertility rate with 145.0 births per 1,000 women. Women in the age bracket of 20 to 34 years acount for 93.3% of all women with births.
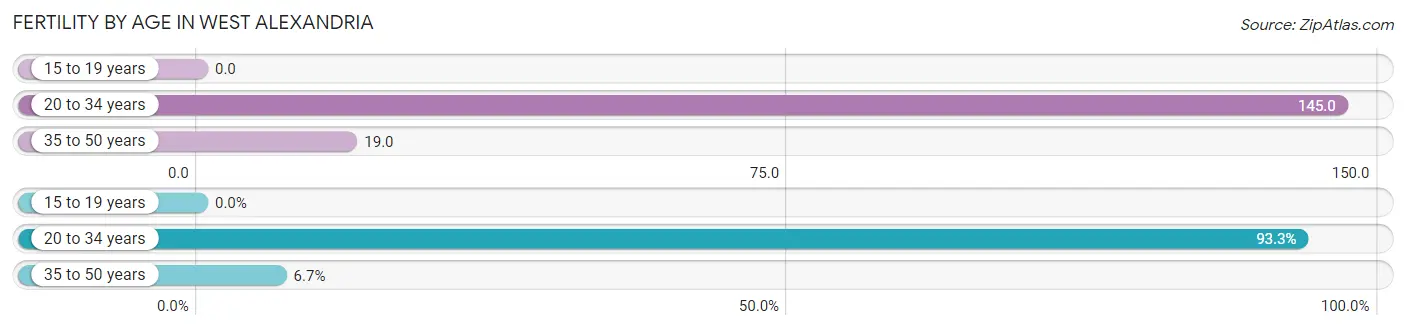
| Age Bracket | Women with Births | Births / 1,000 Women |
| 15 to 19 years | 0 (0.0%) | 0.0 |
| 20 to 34 years | 28 (93.3%) | 145.0 |
| 35 to 50 years | 2 (6.7%) | 19.0 |
| Total | 30 (100.0%) | 93.0 |
Fertility by Age by Marriage Status in West Alexandria
80.0% of women with births (30) in West Alexandria are married. The highest percentage of unmarried women with births falls into 35 to 50 years age bracket with 100.0% of them unmarried at the time of birth, while the lowest percentage of unmarried women with births belong to 20 to 34 years age bracket with 14.3% of them unmarried.
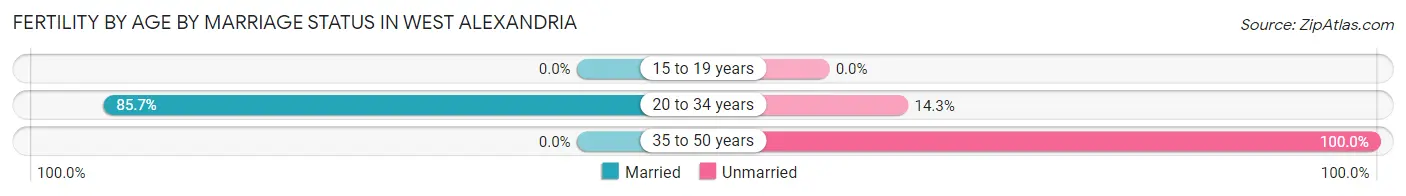
| Age Bracket | Married | Unmarried |
| 15 to 19 years | 0 (0.0%) | 0 (0.0%) |
| 20 to 34 years | 24 (85.7%) | 4 (14.3%) |
| 35 to 50 years | 0 (0.0%) | 2 (100.0%) |
| Total | 24 (80.0%) | 6 (20.0%) |
Fertility by Education in West Alexandria
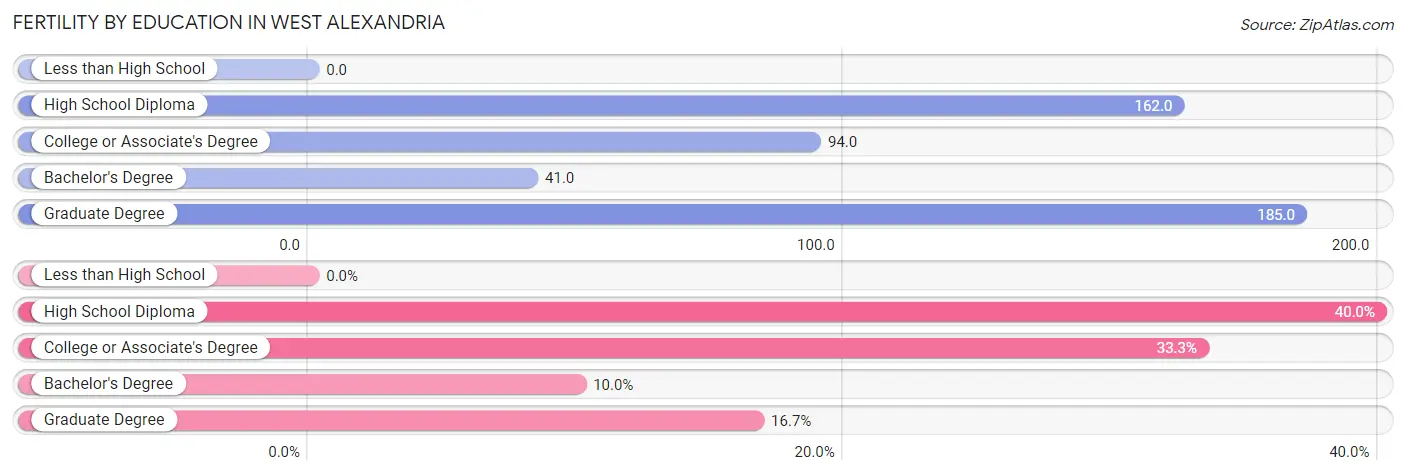
| Educational Attainment | Women with Births | Births / 1,000 Women |
| Less than High School | 0 (0.0%) | 0.0 |
| High School Diploma | 12 (40.0%) | 162.0 |
| College or Associate's Degree | 10 (33.3%) | 94.0 |
| Bachelor's Degree | 3 (10.0%) | 41.0 |
| Graduate Degree | 5 (16.7%) | 185.0 |
| Total | 30 (100.0%) | 93.0 |
Fertility by Education by Marriage Status in West Alexandria
20.0% of women with births in West Alexandria are unmarried. Women with the educational attainment of high school diploma are most likely to be married with 100.0% of them married at childbirth, while women with the educational attainment of college or associate's degree are least likely to be married with 60.0% of them unmarried at childbirth.
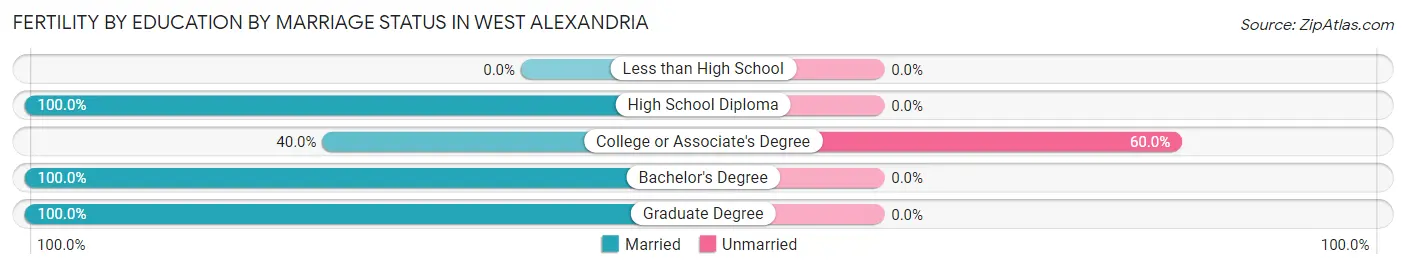
| Educational Attainment | Married | Unmarried |
| Less than High School | 0 (0.0%) | 0 (0.0%) |
| High School Diploma | 12 (100.0%) | 0 (0.0%) |
| College or Associate's Degree | 4 (40.0%) | 6 (60.0%) |
| Bachelor's Degree | 3 (100.0%) | 0 (0.0%) |
| Graduate Degree | 5 (100.0%) | 0 (0.0%) |
| Total | 24 (80.0%) | 6 (20.0%) |
Employment Characteristics in West Alexandria
Employment by Class of Employer in West Alexandria
Among the 682 employed individuals in West Alexandria, private company employees (493 | 72.3%), local government employees (106 | 15.5%), and self-employed (not incorporated) (31 | 4.5%) make up the most common classes of employment.
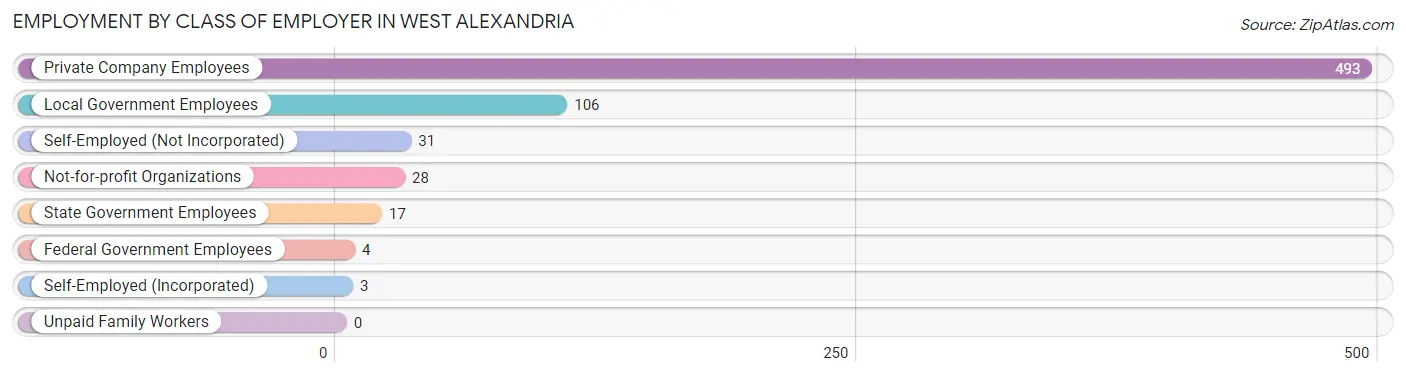
| Employer Class | # Employees | % Employees |
| Private Company Employees | 493 | 72.3% |
| Self-Employed (Incorporated) | 3 | 0.4% |
| Self-Employed (Not Incorporated) | 31 | 4.5% |
| Not-for-profit Organizations | 28 | 4.1% |
| Local Government Employees | 106 | 15.5% |
| State Government Employees | 17 | 2.5% |
| Federal Government Employees | 4 | 0.6% |
| Unpaid Family Workers | 0 | 0.0% |
| Total | 682 | 100.0% |
Employment Status by Age in West Alexandria
According to the labor force statistics for West Alexandria, out of the total population over 16 years of age (1,100), 65.8% or 724 individuals are in the labor force, with 4.6% or 33 of them unemployed. The age group with the highest labor force participation rate is 25 to 29 years, with 91.9% or 124 individuals in the labor force. Within the labor force, the 65 to 74 years age range has the highest percentage of unemployed individuals, with 33.3% or 4 of them being unemployed.
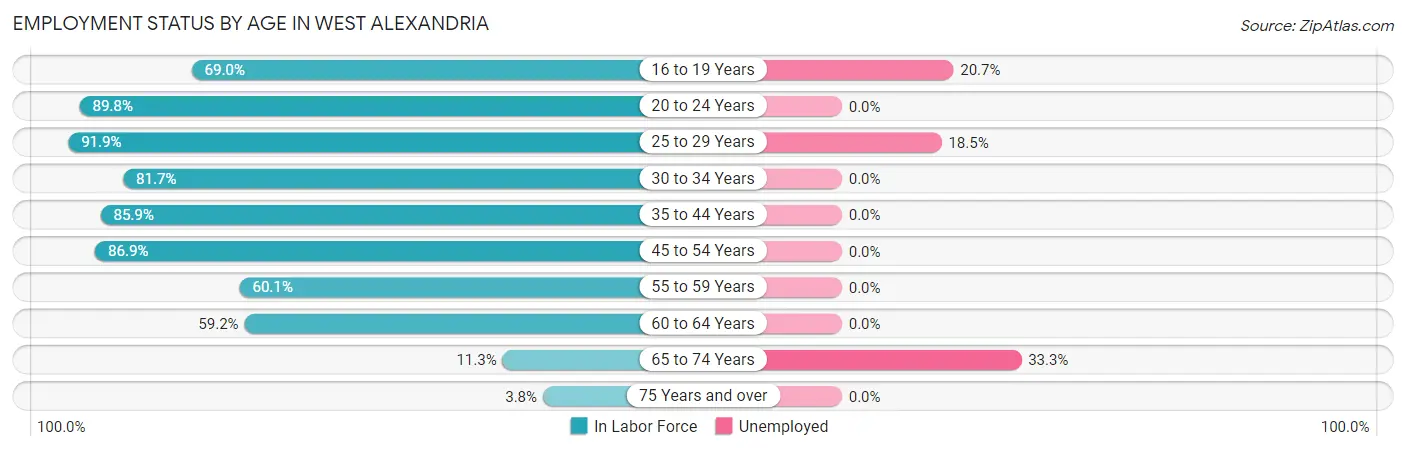
| Age Bracket | In Labor Force | Unemployed |
| 16 to 19 Years | 29 (69.0%) | 6 (20.7%) |
| 20 to 24 Years | 88 (89.8%) | 0 (0.0%) |
| 25 to 29 Years | 124 (91.9%) | 23 (18.5%) |
| 30 to 34 Years | 107 (81.7%) | 0 (0.0%) |
| 35 to 44 Years | 146 (85.9%) | 0 (0.0%) |
| 45 to 54 Years | 86 (86.9%) | 0 (0.0%) |
| 55 to 59 Years | 86 (60.1%) | 0 (0.0%) |
| 60 to 64 Years | 42 (59.2%) | 0 (0.0%) |
| 65 to 74 Years | 12 (11.3%) | 4 (33.3%) |
| 75 Years and over | 4 (3.8%) | 0 (0.0%) |
| Total | 724 (65.8%) | 33 (4.6%) |
Employment Status by Educational Attainment in West Alexandria
According to labor force statistics for West Alexandria, 78.9% of individuals (591) out of the total population between 25 and 64 years of age (749) are in the labor force, with 3.9% or 23 of them being unemployed. The group with the highest labor force participation rate are those with the educational attainment of college / associate degree, with 90.4% or 244 individuals in the labor force. Within the labor force, individuals with less than high school education have the highest percentage of unemployment, with 58.1% or 18 of them being unemployed.
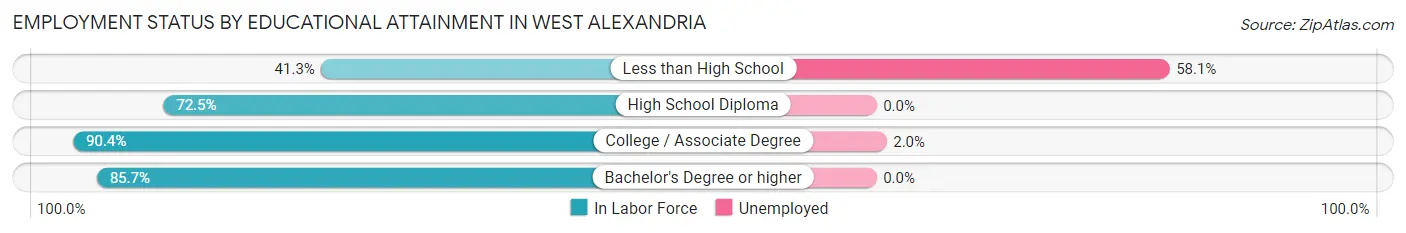
| Educational Attainment | In Labor Force | Unemployed |
| Less than High School | 31 (41.3%) | 44 (58.1%) |
| High School Diploma | 166 (72.5%) | 0 (0.0%) |
| College / Associate Degree | 244 (90.4%) | 5 (2.0%) |
| Bachelor's Degree or higher | 150 (85.7%) | 0 (0.0%) |
| Total | 591 (78.9%) | 29 (3.9%) |
Employment Occupations by Sex in West Alexandria
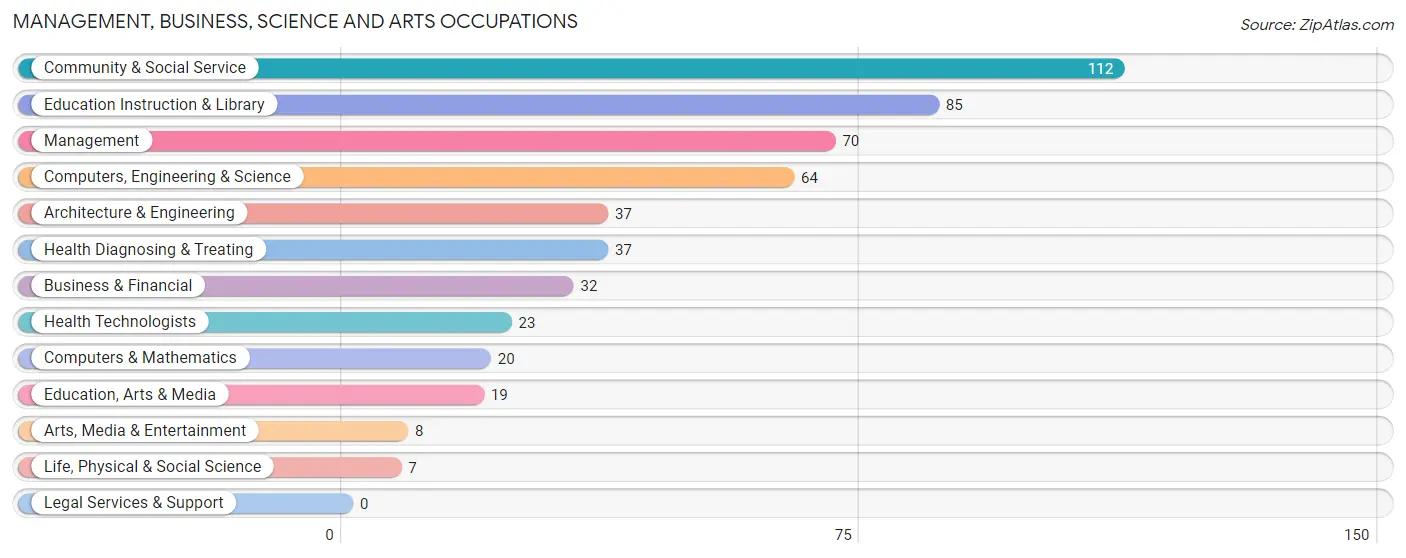
Management, Business, Science and Arts Occupations
The most common Management, Business, Science and Arts occupations in West Alexandria are Community & Social Service (112 | 16.2%), Education Instruction & Library (85 | 12.3%), Management (70 | 10.1%), Computers, Engineering & Science (64 | 9.3%), and Architecture & Engineering (37 | 5.3%).
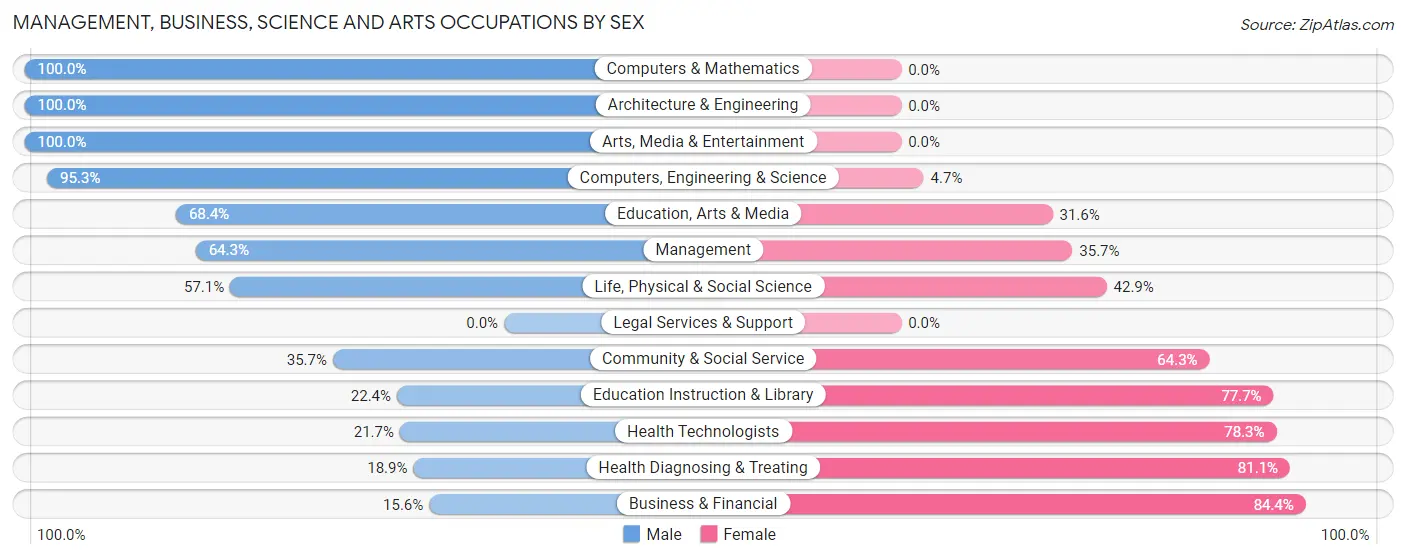
Management, Business, Science and Arts Occupations by Sex
Within the Management, Business, Science and Arts occupations in West Alexandria, the most male-oriented occupations are Computers & Mathematics (100.0%), Architecture & Engineering (100.0%), and Arts, Media & Entertainment (100.0%), while the most female-oriented occupations are Business & Financial (84.4%), Health Diagnosing & Treating (81.1%), and Health Technologists (78.3%).
| Occupation | Male | Female |
| Management | 45 (64.3%) | 25 (35.7%) |
| Business & Financial | 5 (15.6%) | 27 (84.4%) |
| Computers, Engineering & Science | 61 (95.3%) | 3 (4.7%) |
| Computers & Mathematics | 20 (100.0%) | 0 (0.0%) |
| Architecture & Engineering | 37 (100.0%) | 0 (0.0%) |
| Life, Physical & Social Science | 4 (57.1%) | 3 (42.9%) |
| Community & Social Service | 40 (35.7%) | 72 (64.3%) |
| Education, Arts & Media | 13 (68.4%) | 6 (31.6%) |
| Legal Services & Support | 0 (0.0%) | 0 (0.0%) |
| Education Instruction & Library | 19 (22.4%) | 66 (77.6%) |
| Arts, Media & Entertainment | 8 (100.0%) | 0 (0.0%) |
| Health Diagnosing & Treating | 7 (18.9%) | 30 (81.1%) |
| Health Technologists | 5 (21.7%) | 18 (78.3%) |
| Total (Category) | 158 (50.2%) | 157 (49.8%) |
| Total (Overall) | 376 (54.4%) | 315 (45.6%) |
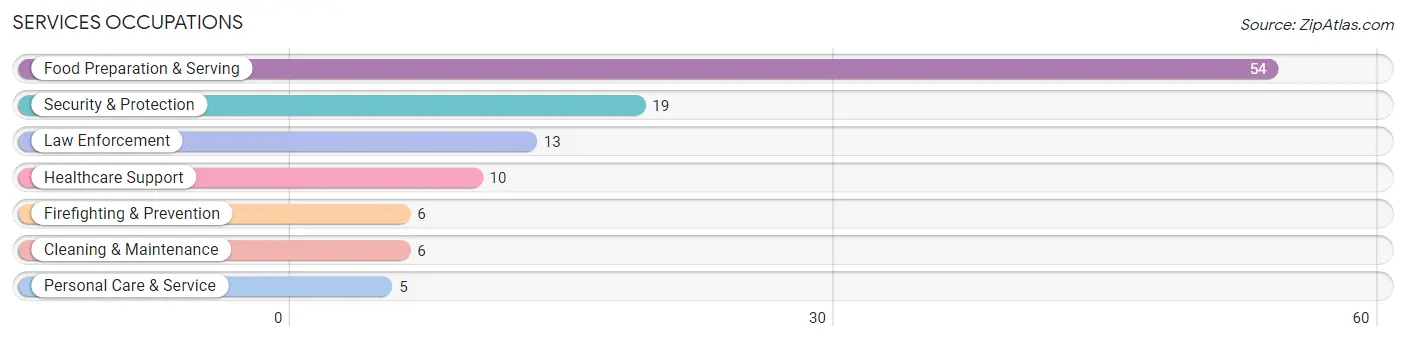
Services Occupations
The most common Services occupations in West Alexandria are Food Preparation & Serving (54 | 7.8%), Security & Protection (19 | 2.8%), Law Enforcement (13 | 1.9%), Healthcare Support (10 | 1.5%), and Firefighting & Prevention (6 | 0.9%).
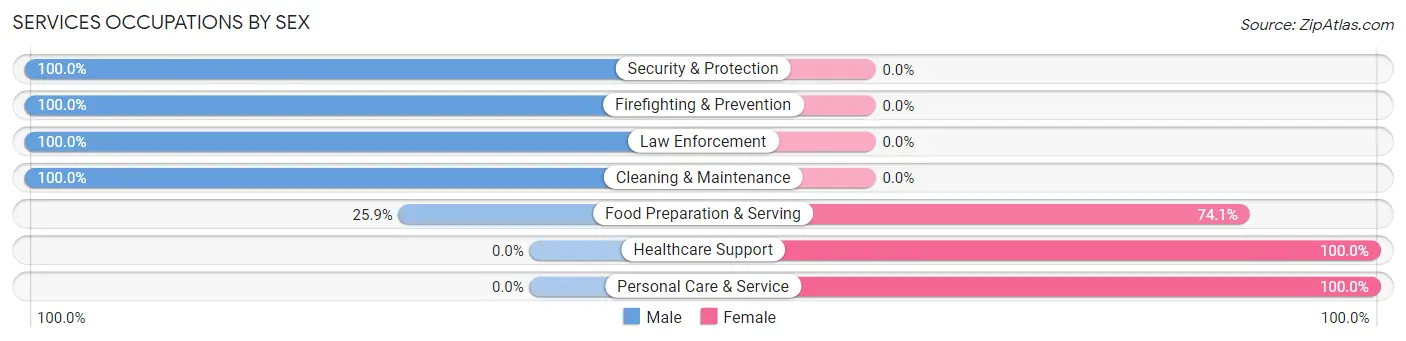
Services Occupations by Sex
Within the Services occupations in West Alexandria, the most male-oriented occupations are Security & Protection (100.0%), Firefighting & Prevention (100.0%), and Law Enforcement (100.0%), while the most female-oriented occupations are Healthcare Support (100.0%), Personal Care & Service (100.0%), and Food Preparation & Serving (74.1%).
| Occupation | Male | Female |
| Healthcare Support | 0 (0.0%) | 10 (100.0%) |
| Security & Protection | 19 (100.0%) | 0 (0.0%) |
| Firefighting & Prevention | 6 (100.0%) | 0 (0.0%) |
| Law Enforcement | 13 (100.0%) | 0 (0.0%) |
| Food Preparation & Serving | 14 (25.9%) | 40 (74.1%) |
| Cleaning & Maintenance | 6 (100.0%) | 0 (0.0%) |
| Personal Care & Service | 0 (0.0%) | 5 (100.0%) |
| Total (Category) | 39 (41.5%) | 55 (58.5%) |
| Total (Overall) | 376 (54.4%) | 315 (45.6%) |
Sales and Office Occupations
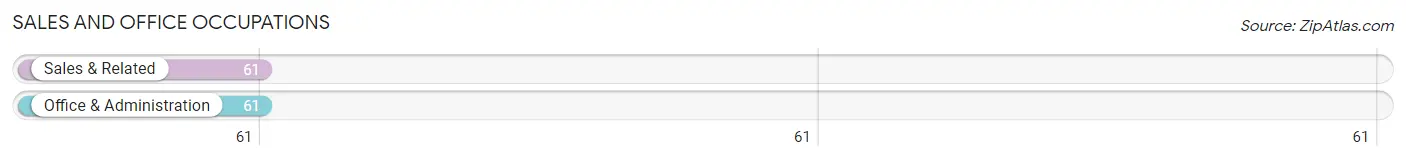
The most common Sales and Office occupations in West Alexandria are Sales & Related (61 | 8.8%), and Office & Administration (61 | 8.8%).
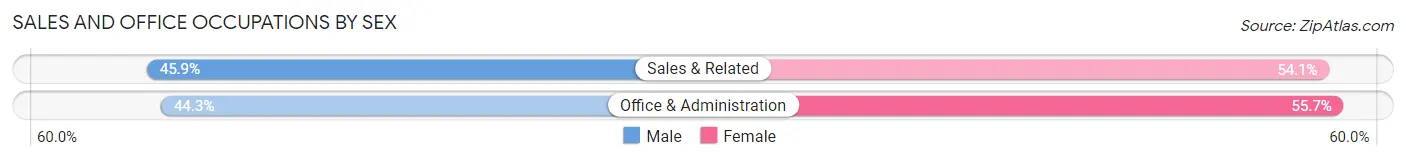
Sales and Office Occupations by Sex
| Occupation | Male | Female |
| Sales & Related | 28 (45.9%) | 33 (54.1%) |
| Office & Administration | 27 (44.3%) | 34 (55.7%) |
| Total (Category) | 55 (45.1%) | 67 (54.9%) |
| Total (Overall) | 376 (54.4%) | 315 (45.6%) |
Natural Resources, Construction and Maintenance Occupations
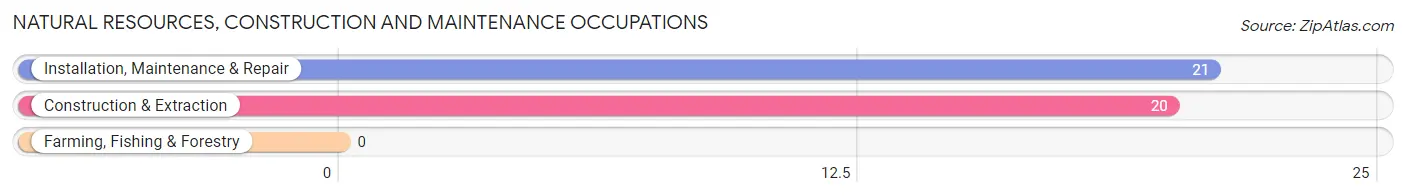
The most common Natural Resources, Construction and Maintenance occupations in West Alexandria are Installation, Maintenance & Repair (21 | 3.0%), and Construction & Extraction (20 | 2.9%).
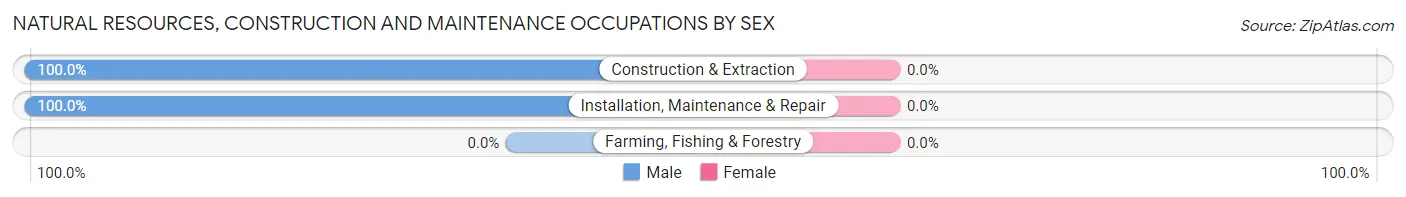
Natural Resources, Construction and Maintenance Occupations by Sex
| Occupation | Male | Female |
| Farming, Fishing & Forestry | 0 (0.0%) | 0 (0.0%) |
| Construction & Extraction | 20 (100.0%) | 0 (0.0%) |
| Installation, Maintenance & Repair | 21 (100.0%) | 0 (0.0%) |
| Total (Category) | 41 (100.0%) | 0 (0.0%) |
| Total (Overall) | 376 (54.4%) | 315 (45.6%) |
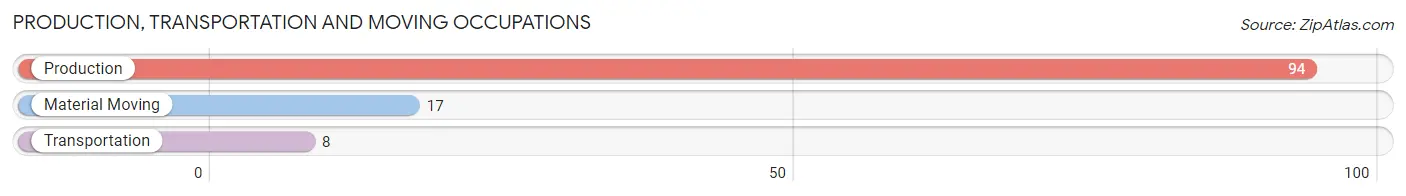
Production, Transportation and Moving Occupations
The most common Production, Transportation and Moving occupations in West Alexandria are Production (94 | 13.6%), Material Moving (17 | 2.5%), and Transportation (8 | 1.2%).
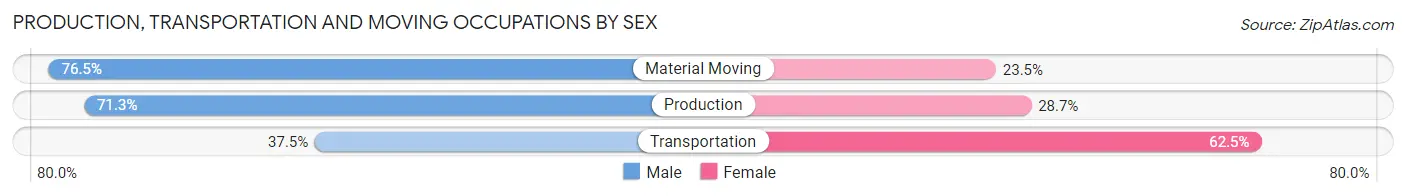
Production, Transportation and Moving Occupations by Sex
| Occupation | Male | Female |
| Production | 67 (71.3%) | 27 (28.7%) |
| Transportation | 3 (37.5%) | 5 (62.5%) |
| Material Moving | 13 (76.5%) | 4 (23.5%) |
| Total (Category) | 83 (69.8%) | 36 (30.2%) |
| Total (Overall) | 376 (54.4%) | 315 (45.6%) |
Employment Industries by Sex in West Alexandria
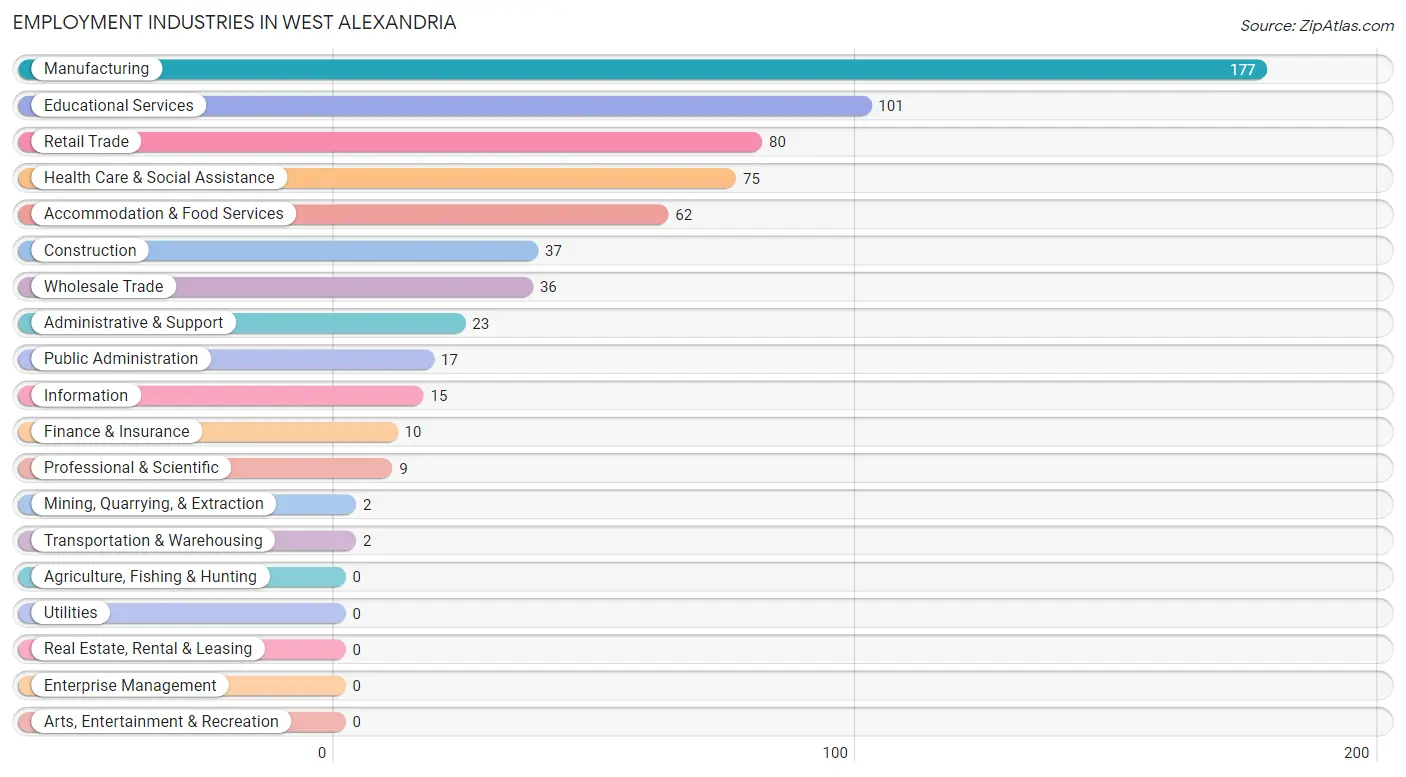
Employment Industries in West Alexandria
The major employment industries in West Alexandria include Manufacturing (177 | 25.6%), Educational Services (101 | 14.6%), Retail Trade (80 | 11.6%), Health Care & Social Assistance (75 | 10.8%), and Accommodation & Food Services (62 | 9.0%).
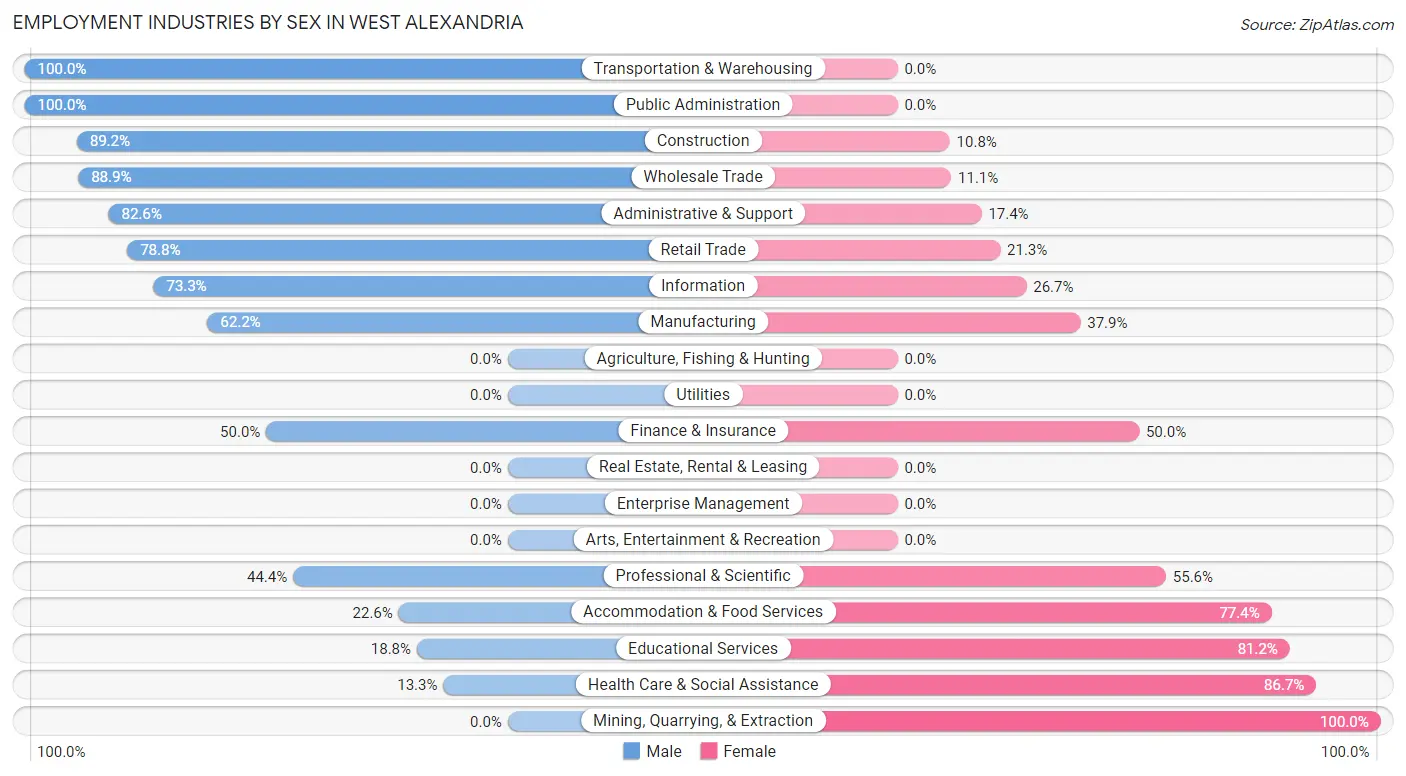
Employment Industries by Sex in West Alexandria
The West Alexandria industries that see more men than women are Transportation & Warehousing (100.0%), Public Administration (100.0%), and Construction (89.2%), whereas the industries that tend to have a higher number of women are Mining, Quarrying, & Extraction (100.0%), Health Care & Social Assistance (86.7%), and Educational Services (81.2%).
| Industry | Male | Female |
| Agriculture, Fishing & Hunting | 0 (0.0%) | 0 (0.0%) |
| Mining, Quarrying, & Extraction | 0 (0.0%) | 2 (100.0%) |
| Construction | 33 (89.2%) | 4 (10.8%) |
| Manufacturing | 110 (62.2%) | 67 (37.9%) |
| Wholesale Trade | 32 (88.9%) | 4 (11.1%) |
| Retail Trade | 63 (78.7%) | 17 (21.2%) |
| Transportation & Warehousing | 2 (100.0%) | 0 (0.0%) |
| Utilities | 0 (0.0%) | 0 (0.0%) |
| Information | 11 (73.3%) | 4 (26.7%) |
| Finance & Insurance | 5 (50.0%) | 5 (50.0%) |
| Real Estate, Rental & Leasing | 0 (0.0%) | 0 (0.0%) |
| Professional & Scientific | 4 (44.4%) | 5 (55.6%) |
| Enterprise Management | 0 (0.0%) | 0 (0.0%) |
| Administrative & Support | 19 (82.6%) | 4 (17.4%) |
| Educational Services | 19 (18.8%) | 82 (81.2%) |
| Health Care & Social Assistance | 10 (13.3%) | 65 (86.7%) |
| Arts, Entertainment & Recreation | 0 (0.0%) | 0 (0.0%) |
| Accommodation & Food Services | 14 (22.6%) | 48 (77.4%) |
| Public Administration | 17 (100.0%) | 0 (0.0%) |
| Total | 376 (54.4%) | 315 (45.6%) |
Education in West Alexandria
School Enrollment in West Alexandria
The most common levels of schooling among the 319 students in West Alexandria are middle school (83 | 26.0%), elementary school (77 | 24.1%), and college / undergraduate (67 | 21.0%).
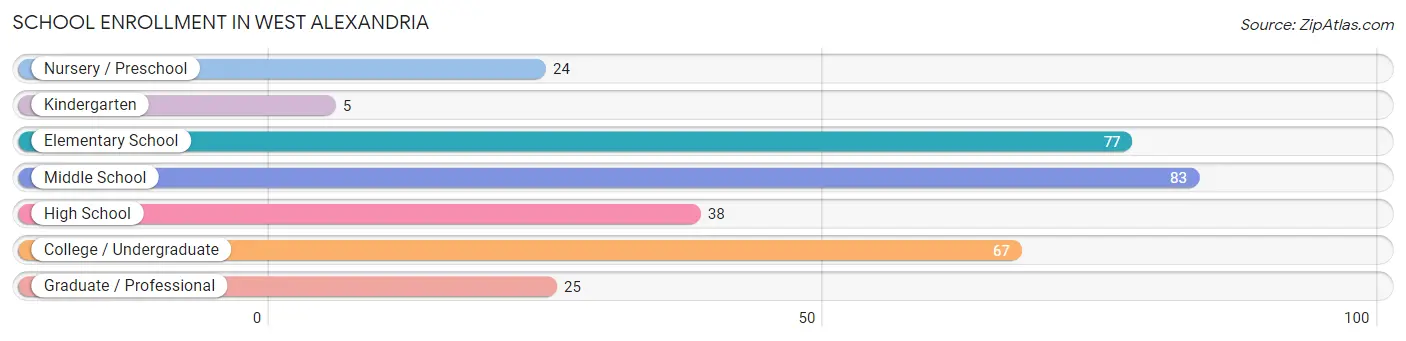
| School Level | # Students | % Students |
| Nursery / Preschool | 24 | 7.5% |
| Kindergarten | 5 | 1.6% |
| Elementary School | 77 | 24.1% |
| Middle School | 83 | 26.0% |
| High School | 38 | 11.9% |
| College / Undergraduate | 67 | 21.0% |
| Graduate / Professional | 25 | 7.8% |
| Total | 319 | 100.0% |
School Enrollment by Age by Funding Source in West Alexandria
Out of a total of 319 students who are enrolled in schools in West Alexandria, 30 (9.4%) attend a private institution, while the remaining 289 (90.6%) are enrolled in public schools. The age group of 5 to 9 year old has the highest likelihood of being enrolled in private schools, with 16 (23.9% in the age bracket) enrolled. Conversely, the age group of 3 to 4 year olds has the lowest likelihood of being enrolled in a private school, with 8 (100.0% in the age bracket) attending a public institution.
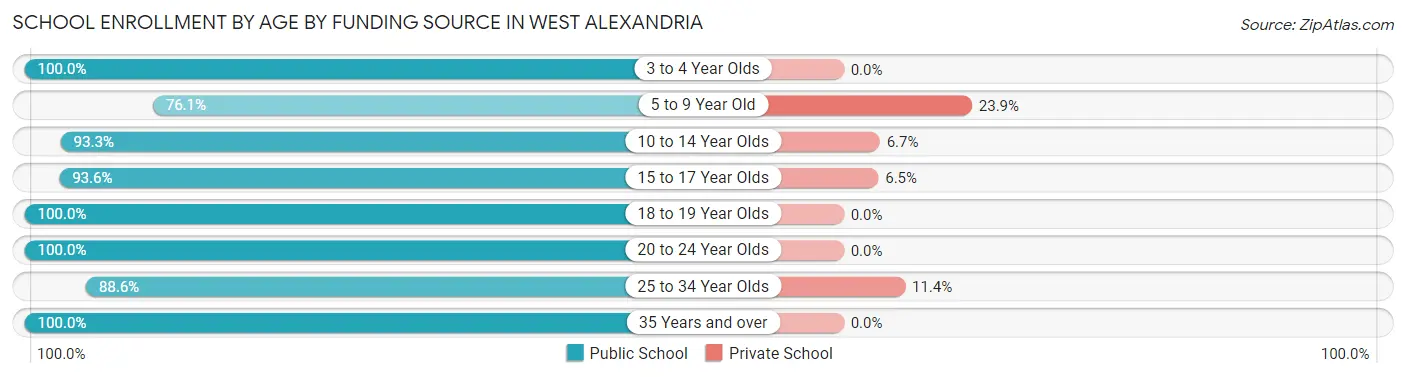
| Age Bracket | Public School | Private School |
| 3 to 4 Year Olds | 8 (100.0%) | 0 (0.0%) |
| 5 to 9 Year Old | 51 (76.1%) | 16 (23.9%) |
| 10 to 14 Year Olds | 111 (93.3%) | 8 (6.7%) |
| 15 to 17 Year Olds | 29 (93.5%) | 2 (6.5%) |
| 18 to 19 Year Olds | 5 (100.0%) | 0 (0.0%) |
| 20 to 24 Year Olds | 25 (100.0%) | 0 (0.0%) |
| 25 to 34 Year Olds | 31 (88.6%) | 4 (11.4%) |
| 35 Years and over | 29 (100.0%) | 0 (0.0%) |
| Total | 289 (90.6%) | 30 (9.4%) |
Educational Attainment by Field of Study in West Alexandria
Education (48 | 25.3%), business (46 | 24.2%), science & technology (25 | 13.2%), arts & humanities (17 | 8.9%), and bio, nature & agricultural (13 | 6.8%) are the most common fields of study among 190 individuals in West Alexandria who have obtained a bachelor's degree or higher.
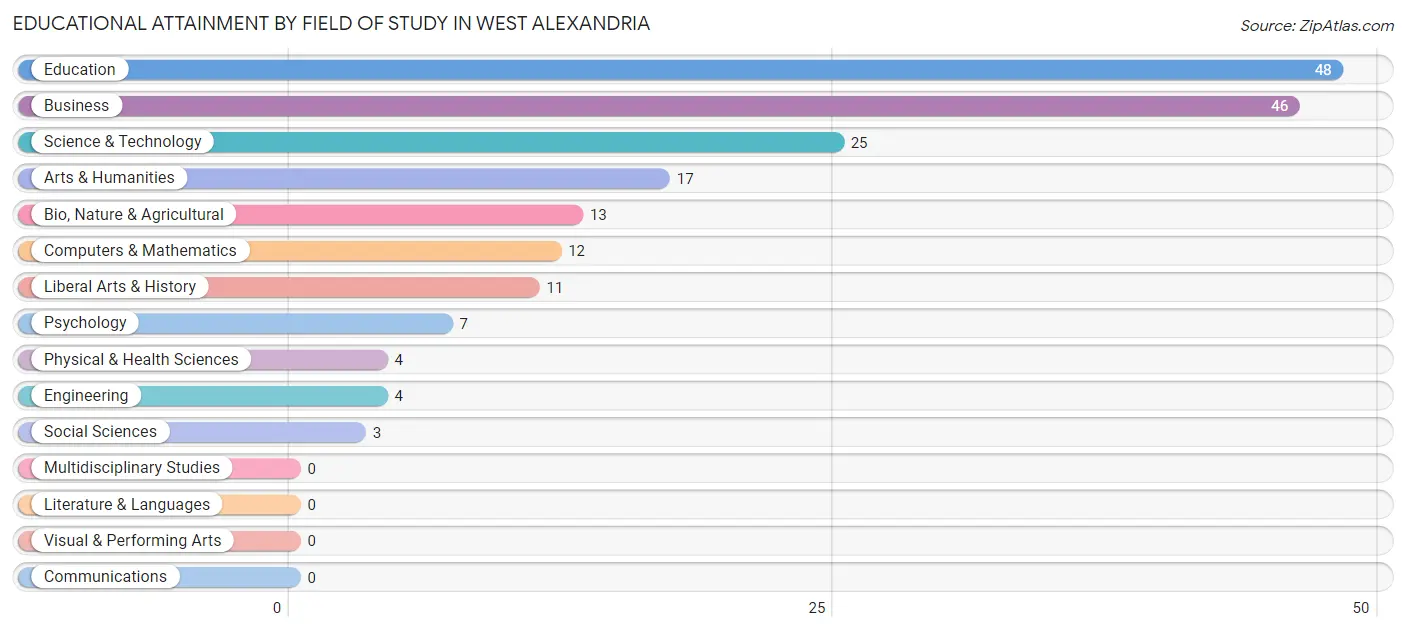
| Field of Study | # Graduates | % Graduates |
| Computers & Mathematics | 12 | 6.3% |
| Bio, Nature & Agricultural | 13 | 6.8% |
| Physical & Health Sciences | 4 | 2.1% |
| Psychology | 7 | 3.7% |
| Social Sciences | 3 | 1.6% |
| Engineering | 4 | 2.1% |
| Multidisciplinary Studies | 0 | 0.0% |
| Science & Technology | 25 | 13.2% |
| Business | 46 | 24.2% |
| Education | 48 | 25.3% |
| Literature & Languages | 0 | 0.0% |
| Liberal Arts & History | 11 | 5.8% |
| Visual & Performing Arts | 0 | 0.0% |
| Communications | 0 | 0.0% |
| Arts & Humanities | 17 | 8.9% |
| Total | 190 | 100.0% |
Transportation & Commute in West Alexandria
Vehicle Availability by Sex in West Alexandria
The most prevalent vehicle ownership categories in West Alexandria are males with 2 vehicles (148, accounting for 39.6%) and females with 2 vehicles (127, making up 48.0%).
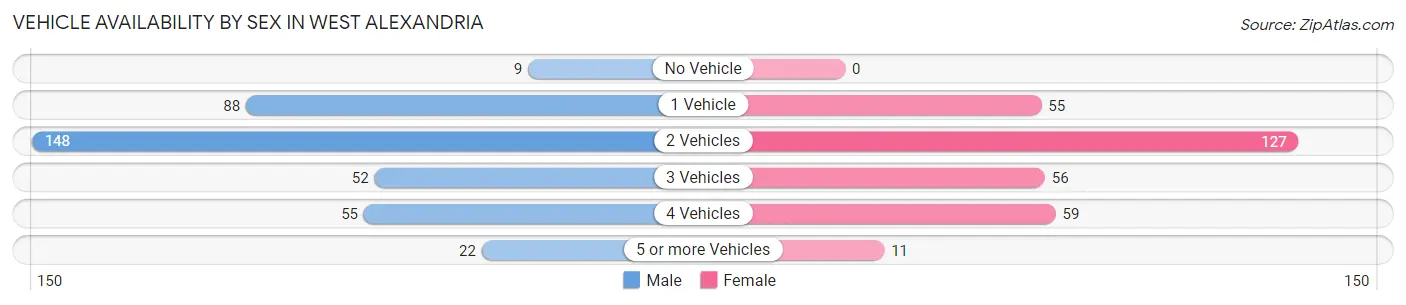
| Vehicles Available | Male | Female |
| No Vehicle | 9 (2.4%) | 0 (0.0%) |
| 1 Vehicle | 88 (23.5%) | 55 (17.9%) |
| 2 Vehicles | 148 (39.6%) | 127 (41.2%) |
| 3 Vehicles | 52 (13.9%) | 56 (18.2%) |
| 4 Vehicles | 55 (14.7%) | 59 (19.2%) |
| 5 or more Vehicles | 22 (5.9%) | 11 (3.6%) |
| Total | 374 (100.0%) | 308 (100.0%) |
Commute Time in West Alexandria
The most frequently occuring commute durations in West Alexandria are 15 to 19 minutes (150 commuters, 22.9%), 40 to 44 minutes (88 commuters, 13.4%), and 10 to 14 minutes (82 commuters, 12.5%).
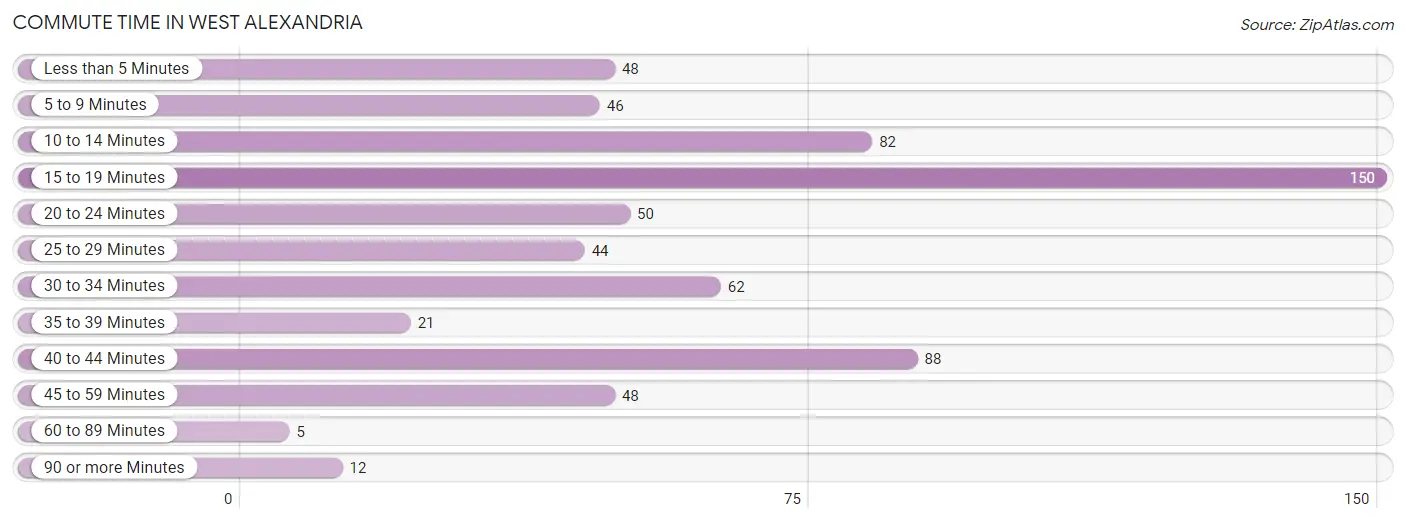
| Commute Time | # Commuters | % Commuters |
| Less than 5 Minutes | 48 | 7.3% |
| 5 to 9 Minutes | 46 | 7.0% |
| 10 to 14 Minutes | 82 | 12.5% |
| 15 to 19 Minutes | 150 | 22.9% |
| 20 to 24 Minutes | 50 | 7.6% |
| 25 to 29 Minutes | 44 | 6.7% |
| 30 to 34 Minutes | 62 | 9.5% |
| 35 to 39 Minutes | 21 | 3.2% |
| 40 to 44 Minutes | 88 | 13.4% |
| 45 to 59 Minutes | 48 | 7.3% |
| 60 to 89 Minutes | 5 | 0.8% |
| 90 or more Minutes | 12 | 1.8% |
Commute Time by Sex in West Alexandria
The most common commute times in West Alexandria are 15 to 19 minutes (91 commuters, 25.1%) for males and 15 to 19 minutes (59 commuters, 20.1%) for females.
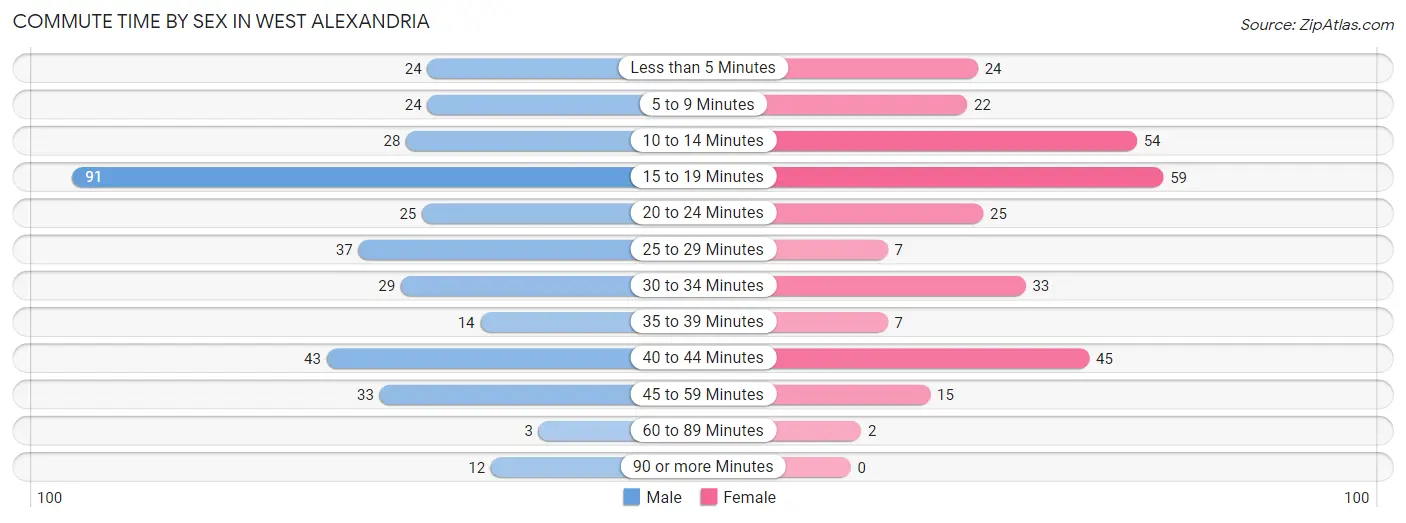
| Commute Time | Male | Female |
| Less than 5 Minutes | 24 (6.6%) | 24 (8.2%) |
| 5 to 9 Minutes | 24 (6.6%) | 22 (7.5%) |
| 10 to 14 Minutes | 28 (7.7%) | 54 (18.4%) |
| 15 to 19 Minutes | 91 (25.1%) | 59 (20.1%) |
| 20 to 24 Minutes | 25 (6.9%) | 25 (8.5%) |
| 25 to 29 Minutes | 37 (10.2%) | 7 (2.4%) |
| 30 to 34 Minutes | 29 (8.0%) | 33 (11.3%) |
| 35 to 39 Minutes | 14 (3.9%) | 7 (2.4%) |
| 40 to 44 Minutes | 43 (11.8%) | 45 (15.4%) |
| 45 to 59 Minutes | 33 (9.1%) | 15 (5.1%) |
| 60 to 89 Minutes | 3 (0.8%) | 2 (0.7%) |
| 90 or more Minutes | 12 (3.3%) | 0 (0.0%) |
Time of Departure to Work by Sex in West Alexandria
The most frequent times of departure to work in West Alexandria are 7:00 AM to 7:29 AM (67, 18.5%) for males and 7:00 AM to 7:29 AM (75, 25.6%) for females.
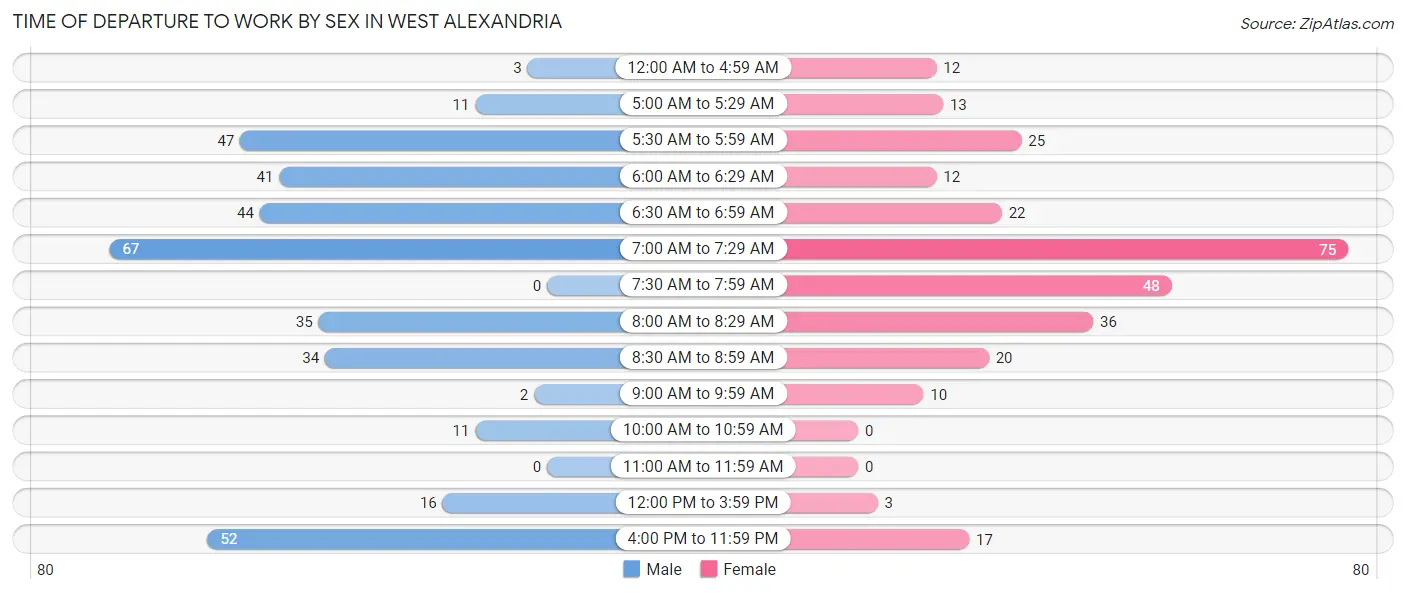
| Time of Departure | Male | Female |
| 12:00 AM to 4:59 AM | 3 (0.8%) | 12 (4.1%) |
| 5:00 AM to 5:29 AM | 11 (3.0%) | 13 (4.4%) |
| 5:30 AM to 5:59 AM | 47 (13.0%) | 25 (8.5%) |
| 6:00 AM to 6:29 AM | 41 (11.3%) | 12 (4.1%) |
| 6:30 AM to 6:59 AM | 44 (12.1%) | 22 (7.5%) |
| 7:00 AM to 7:29 AM | 67 (18.5%) | 75 (25.6%) |
| 7:30 AM to 7:59 AM | 0 (0.0%) | 48 (16.4%) |
| 8:00 AM to 8:29 AM | 35 (9.6%) | 36 (12.3%) |
| 8:30 AM to 8:59 AM | 34 (9.4%) | 20 (6.8%) |
| 9:00 AM to 9:59 AM | 2 (0.5%) | 10 (3.4%) |
| 10:00 AM to 10:59 AM | 11 (3.0%) | 0 (0.0%) |
| 11:00 AM to 11:59 AM | 0 (0.0%) | 0 (0.0%) |
| 12:00 PM to 3:59 PM | 16 (4.4%) | 3 (1.0%) |
| 4:00 PM to 11:59 PM | 52 (14.3%) | 17 (5.8%) |
| Total | 363 (100.0%) | 293 (100.0%) |
Housing Occupancy in West Alexandria
Occupancy by Ownership in West Alexandria
Of the total 578 dwellings in West Alexandria, owner-occupied units account for 359 (62.1%), while renter-occupied units make up 219 (37.9%).
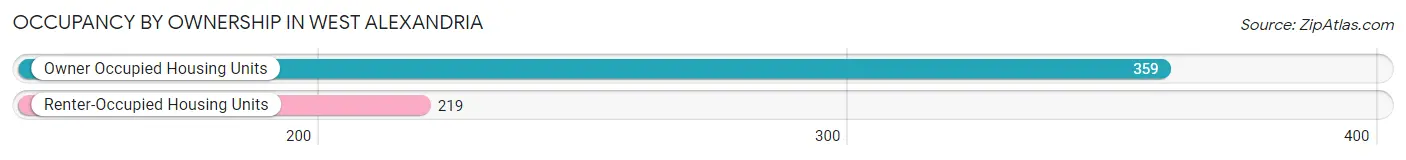
| Occupancy | # Housing Units | % Housing Units |
| Owner Occupied Housing Units | 359 | 62.1% |
| Renter-Occupied Housing Units | 219 | 37.9% |
| Total Occupied Housing Units | 578 | 100.0% |
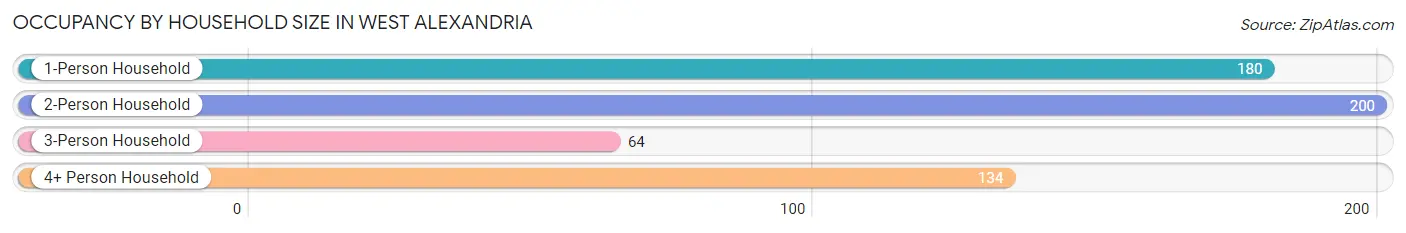
Occupancy by Household Size in West Alexandria
| Household Size | # Housing Units | % Housing Units |
| 1-Person Household | 180 | 31.1% |
| 2-Person Household | 200 | 34.6% |
| 3-Person Household | 64 | 11.1% |
| 4+ Person Household | 134 | 23.2% |
| Total Housing Units | 578 | 100.0% |
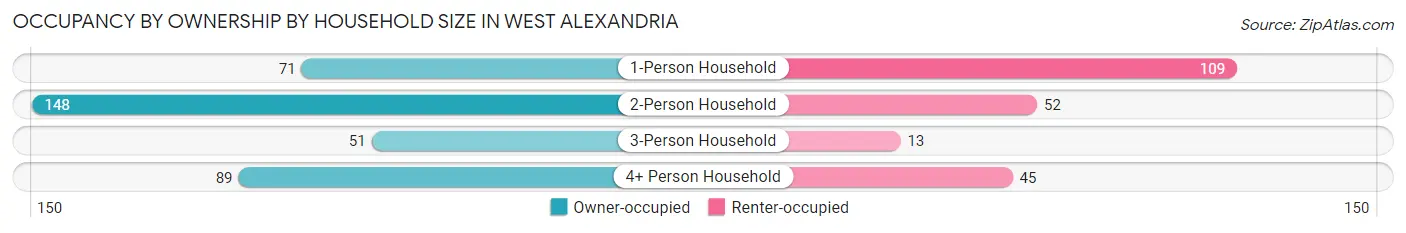
Occupancy by Ownership by Household Size in West Alexandria
| Household Size | Owner-occupied | Renter-occupied |
| 1-Person Household | 71 (39.4%) | 109 (60.6%) |
| 2-Person Household | 148 (74.0%) | 52 (26.0%) |
| 3-Person Household | 51 (79.7%) | 13 (20.3%) |
| 4+ Person Household | 89 (66.4%) | 45 (33.6%) |
| Total Housing Units | 359 (62.1%) | 219 (37.9%) |
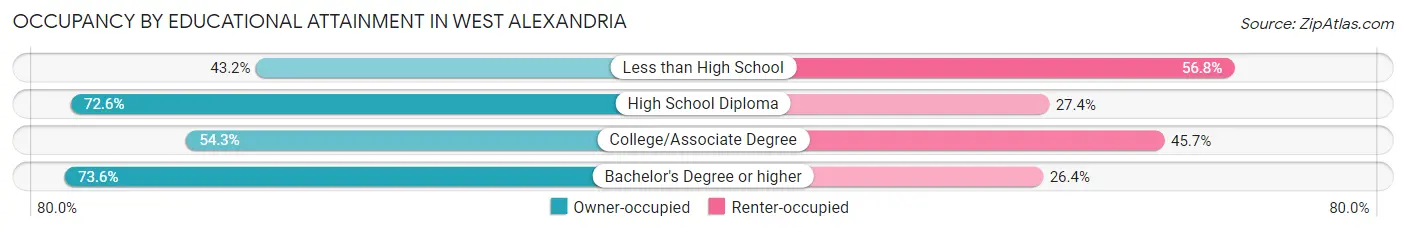
Occupancy by Educational Attainment in West Alexandria
| Household Size | Owner-occupied | Renter-occupied |
| Less than High School | 32 (43.2%) | 42 (56.8%) |
| High School Diploma | 130 (72.6%) | 49 (27.4%) |
| College/Associate Degree | 119 (54.3%) | 100 (45.7%) |
| Bachelor's Degree or higher | 78 (73.6%) | 28 (26.4%) |
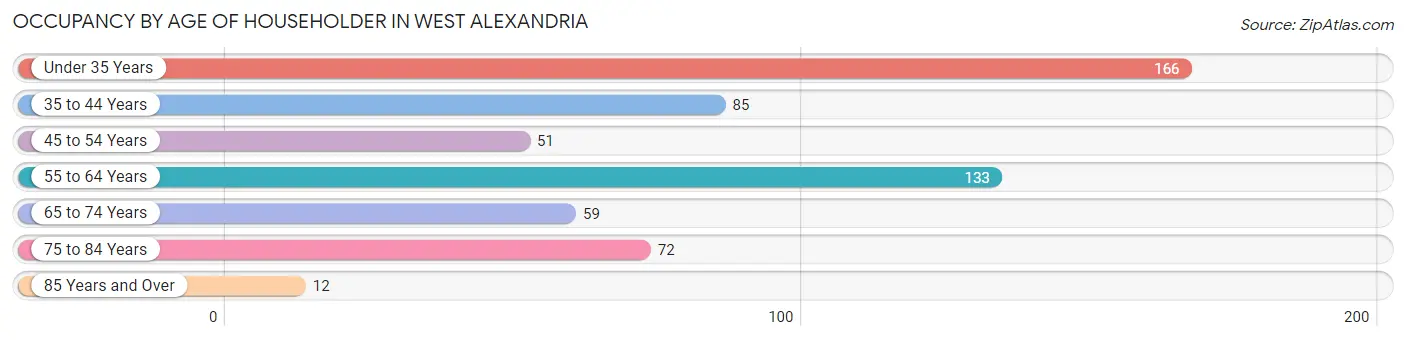
Occupancy by Age of Householder in West Alexandria
| Age Bracket | # Households | % Households |
| Under 35 Years | 166 | 28.7% |
| 35 to 44 Years | 85 | 14.7% |
| 45 to 54 Years | 51 | 8.8% |
| 55 to 64 Years | 133 | 23.0% |
| 65 to 74 Years | 59 | 10.2% |
| 75 to 84 Years | 72 | 12.5% |
| 85 Years and Over | 12 | 2.1% |
| Total | 578 | 100.0% |
Housing Finances in West Alexandria
Median Income by Occupancy in West Alexandria
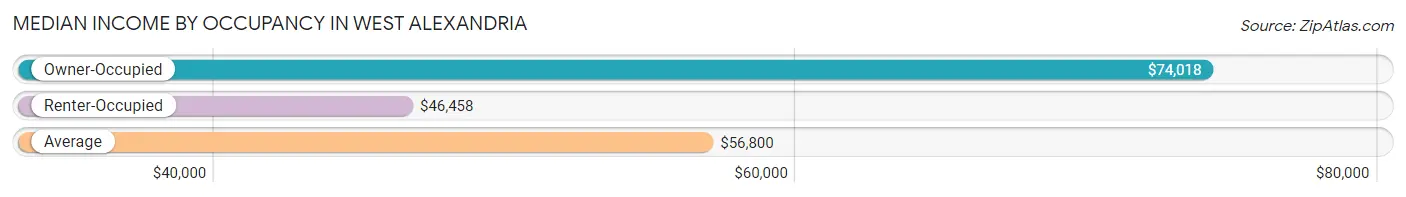
| Occupancy Type | # Households | Median Income |
| Owner-Occupied | 359 (62.1%) | $74,018 |
| Renter-Occupied | 219 (37.9%) | $46,458 |
| Average | 578 (100.0%) | $56,800 |
Occupancy by Householder Income Bracket in West Alexandria
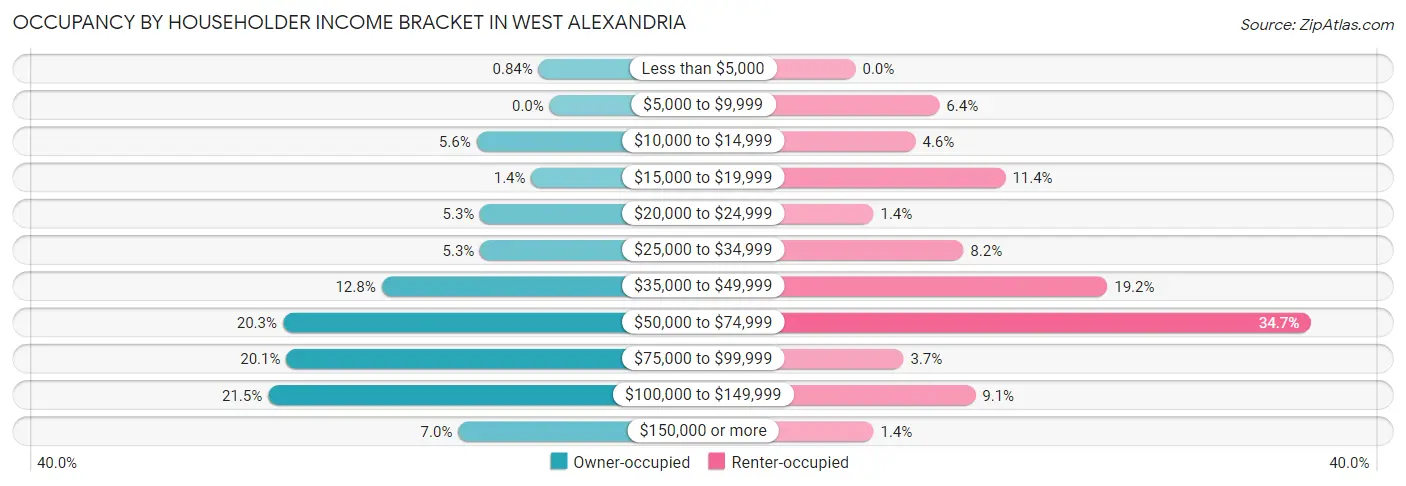
| Income Bracket | Owner-occupied | Renter-occupied |
| Less than $5,000 | 3 (0.8%) | 0 (0.0%) |
| $5,000 to $9,999 | 0 (0.0%) | 14 (6.4%) |
| $10,000 to $14,999 | 20 (5.6%) | 10 (4.6%) |
| $15,000 to $19,999 | 5 (1.4%) | 25 (11.4%) |
| $20,000 to $24,999 | 19 (5.3%) | 3 (1.4%) |
| $25,000 to $34,999 | 19 (5.3%) | 18 (8.2%) |
| $35,000 to $49,999 | 46 (12.8%) | 42 (19.2%) |
| $50,000 to $74,999 | 73 (20.3%) | 76 (34.7%) |
| $75,000 to $99,999 | 72 (20.1%) | 8 (3.6%) |
| $100,000 to $149,999 | 77 (21.4%) | 20 (9.1%) |
| $150,000 or more | 25 (7.0%) | 3 (1.4%) |
| Total | 359 (100.0%) | 219 (100.0%) |
Monthly Housing Cost Tiers in West Alexandria
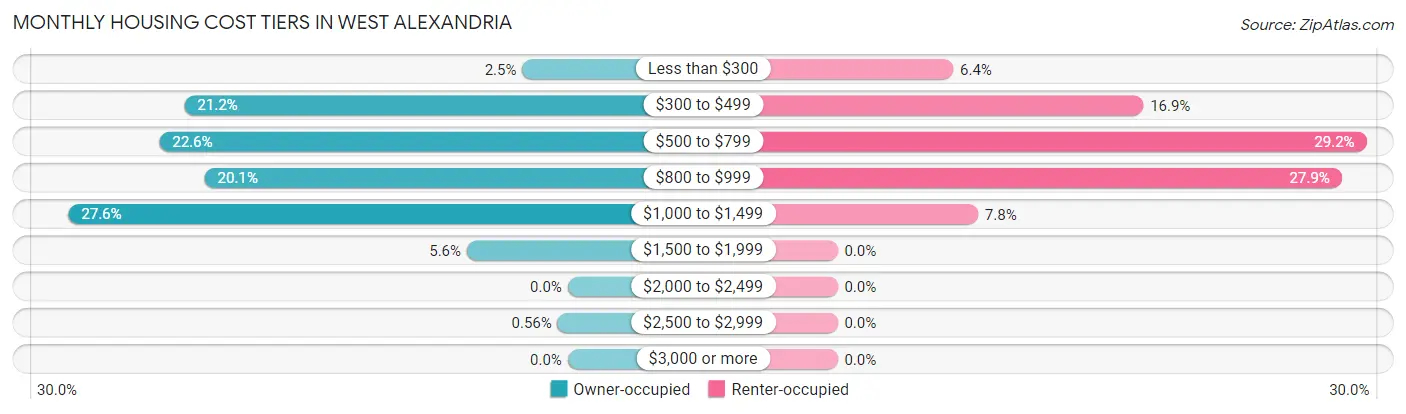
| Monthly Cost | Owner-occupied | Renter-occupied |
| Less than $300 | 9 (2.5%) | 14 (6.4%) |
| $300 to $499 | 76 (21.2%) | 37 (16.9%) |
| $500 to $799 | 81 (22.6%) | 64 (29.2%) |
| $800 to $999 | 72 (20.1%) | 61 (27.9%) |
| $1,000 to $1,499 | 99 (27.6%) | 17 (7.8%) |
| $1,500 to $1,999 | 20 (5.6%) | 0 (0.0%) |
| $2,000 to $2,499 | 0 (0.0%) | 0 (0.0%) |
| $2,500 to $2,999 | 2 (0.6%) | 0 (0.0%) |
| $3,000 or more | 0 (0.0%) | 0 (0.0%) |
| Total | 359 (100.0%) | 219 (100.0%) |
Physical Housing Characteristics in West Alexandria
Housing Structures in West Alexandria
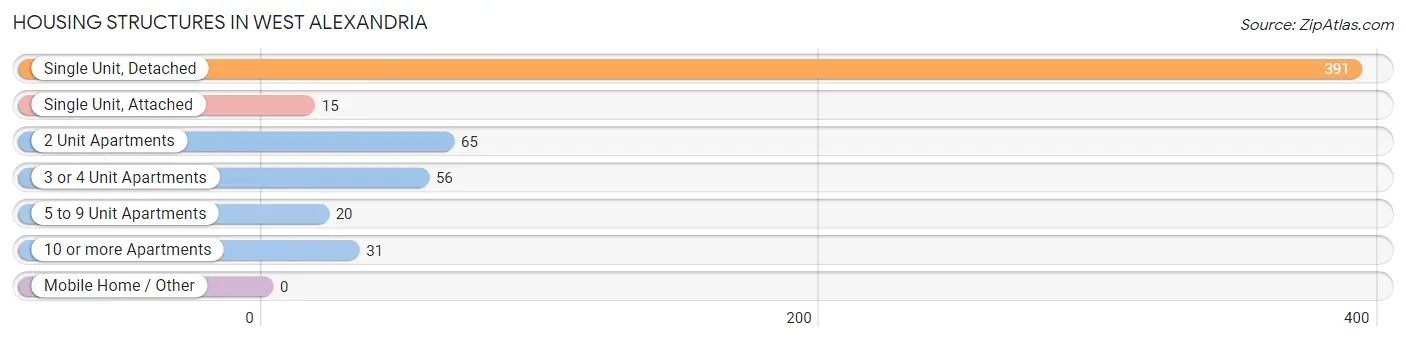
| Structure Type | # Housing Units | % Housing Units |
| Single Unit, Detached | 391 | 67.6% |
| Single Unit, Attached | 15 | 2.6% |
| 2 Unit Apartments | 65 | 11.3% |
| 3 or 4 Unit Apartments | 56 | 9.7% |
| 5 to 9 Unit Apartments | 20 | 3.5% |
| 10 or more Apartments | 31 | 5.4% |
| Mobile Home / Other | 0 | 0.0% |
| Total | 578 | 100.0% |
Housing Structures by Occupancy in West Alexandria
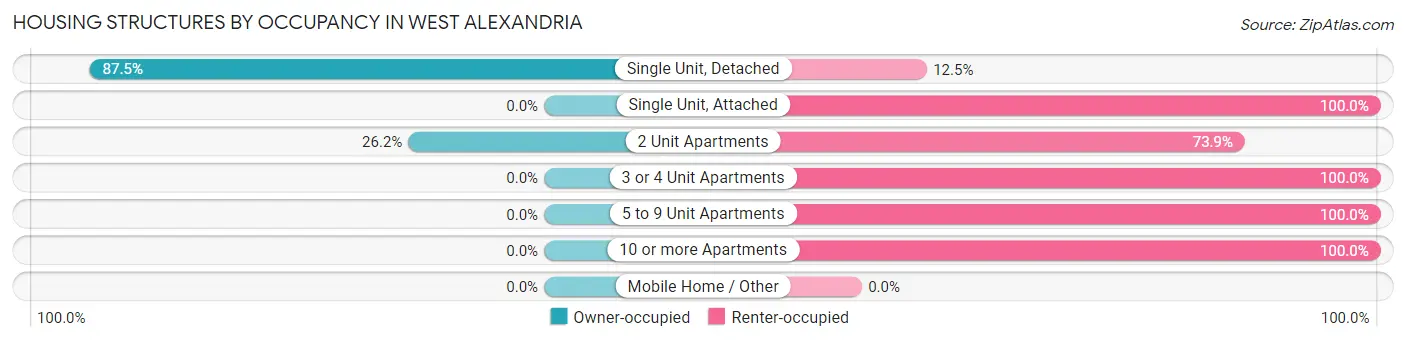
| Structure Type | Owner-occupied | Renter-occupied |
| Single Unit, Detached | 342 (87.5%) | 49 (12.5%) |
| Single Unit, Attached | 0 (0.0%) | 15 (100.0%) |
| 2 Unit Apartments | 17 (26.2%) | 48 (73.9%) |
| 3 or 4 Unit Apartments | 0 (0.0%) | 56 (100.0%) |
| 5 to 9 Unit Apartments | 0 (0.0%) | 20 (100.0%) |
| 10 or more Apartments | 0 (0.0%) | 31 (100.0%) |
| Mobile Home / Other | 0 (0.0%) | 0 (0.0%) |
| Total | 359 (62.1%) | 219 (37.9%) |
Housing Structures by Number of Rooms in West Alexandria
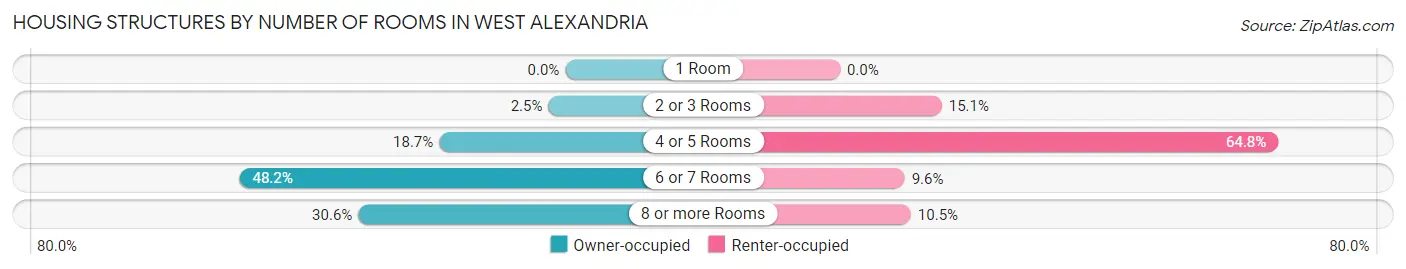
| Number of Rooms | Owner-occupied | Renter-occupied |
| 1 Room | 0 (0.0%) | 0 (0.0%) |
| 2 or 3 Rooms | 9 (2.5%) | 33 (15.1%) |
| 4 or 5 Rooms | 67 (18.7%) | 142 (64.8%) |
| 6 or 7 Rooms | 173 (48.2%) | 21 (9.6%) |
| 8 or more Rooms | 110 (30.6%) | 23 (10.5%) |
| Total | 359 (100.0%) | 219 (100.0%) |
Housing Structure by Heating Type in West Alexandria
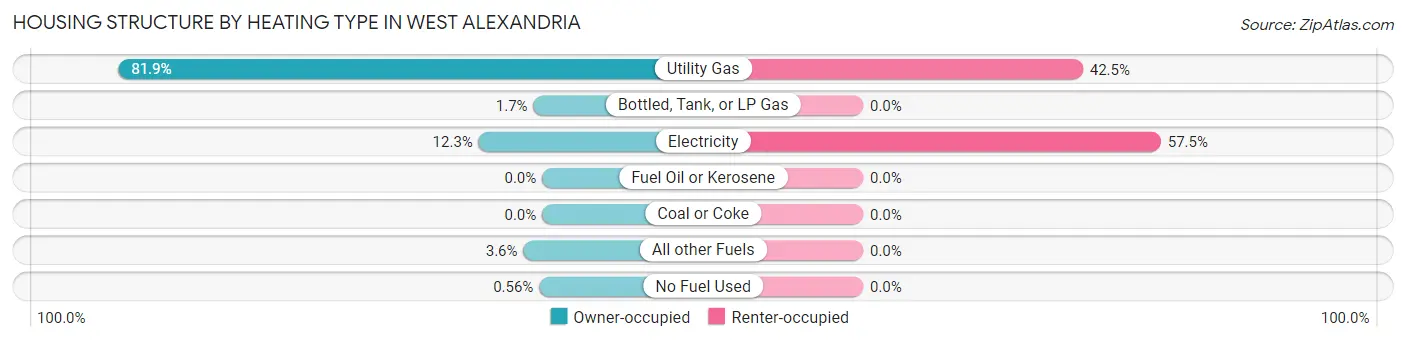
| Heating Type | Owner-occupied | Renter-occupied |
| Utility Gas | 294 (81.9%) | 93 (42.5%) |
| Bottled, Tank, or LP Gas | 6 (1.7%) | 0 (0.0%) |
| Electricity | 44 (12.3%) | 126 (57.5%) |
| Fuel Oil or Kerosene | 0 (0.0%) | 0 (0.0%) |
| Coal or Coke | 0 (0.0%) | 0 (0.0%) |
| All other Fuels | 13 (3.6%) | 0 (0.0%) |
| No Fuel Used | 2 (0.6%) | 0 (0.0%) |
| Total | 359 (100.0%) | 219 (100.0%) |
Household Vehicle Usage in West Alexandria
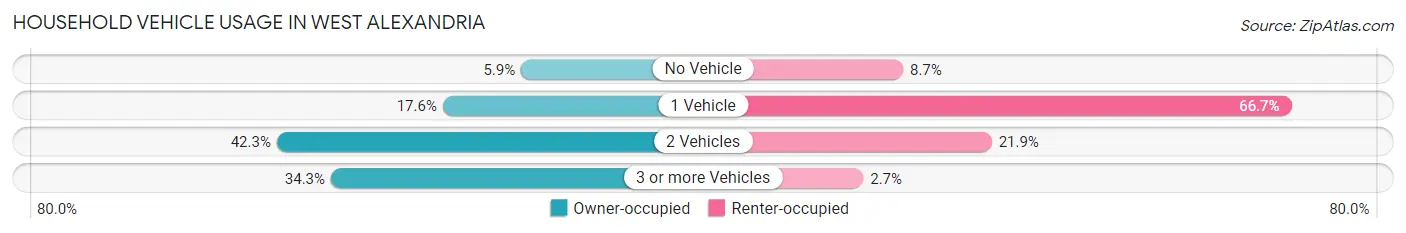
| Vehicles per Household | Owner-occupied | Renter-occupied |
| No Vehicle | 21 (5.9%) | 19 (8.7%) |
| 1 Vehicle | 63 (17.5%) | 146 (66.7%) |
| 2 Vehicles | 152 (42.3%) | 48 (21.9%) |
| 3 or more Vehicles | 123 (34.3%) | 6 (2.7%) |
| Total | 359 (100.0%) | 219 (100.0%) |
Real Estate & Mortgages in West Alexandria
Real Estate and Mortgage Overview in West Alexandria
| Characteristic | Without Mortgage | With Mortgage |
| Housing Units | 149 | 210 |
| Median Property Value | $113,000 | $137,500 |
| Median Household Income | $41,875 | $17 |
| Monthly Housing Costs | $481 | $0 |
| Real Estate Taxes | $1,412 | $0 |
Property Value by Mortgage Status in West Alexandria
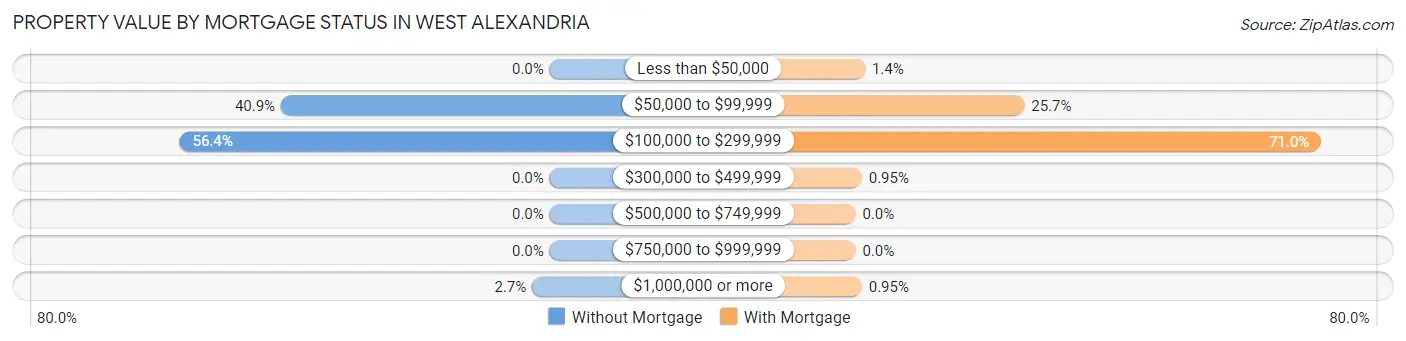
| Property Value | Without Mortgage | With Mortgage |
| Less than $50,000 | 0 (0.0%) | 3 (1.4%) |
| $50,000 to $99,999 | 61 (40.9%) | 54 (25.7%) |
| $100,000 to $299,999 | 84 (56.4%) | 149 (71.0%) |
| $300,000 to $499,999 | 0 (0.0%) | 2 (0.9%) |
| $500,000 to $749,999 | 0 (0.0%) | 0 (0.0%) |
| $750,000 to $999,999 | 0 (0.0%) | 0 (0.0%) |
| $1,000,000 or more | 4 (2.7%) | 2 (0.9%) |
| Total | 149 (100.0%) | 210 (100.0%) |
Household Income by Mortgage Status in West Alexandria
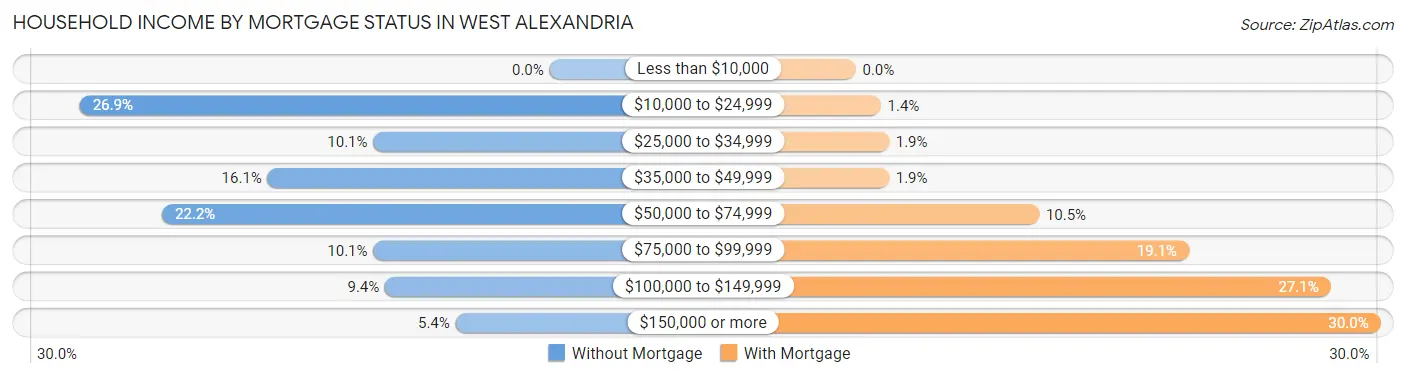
| Household Income | Without Mortgage | With Mortgage |
| Less than $10,000 | 0 (0.0%) | 0 (0.0%) |
| $10,000 to $24,999 | 40 (26.9%) | 3 (1.4%) |
| $25,000 to $34,999 | 15 (10.1%) | 4 (1.9%) |
| $35,000 to $49,999 | 24 (16.1%) | 4 (1.9%) |
| $50,000 to $74,999 | 33 (22.2%) | 22 (10.5%) |
| $75,000 to $99,999 | 15 (10.1%) | 40 (19.1%) |
| $100,000 to $149,999 | 14 (9.4%) | 57 (27.1%) |
| $150,000 or more | 8 (5.4%) | 63 (30.0%) |
| Total | 149 (100.0%) | 210 (100.0%) |
Property Value to Household Income Ratio in West Alexandria
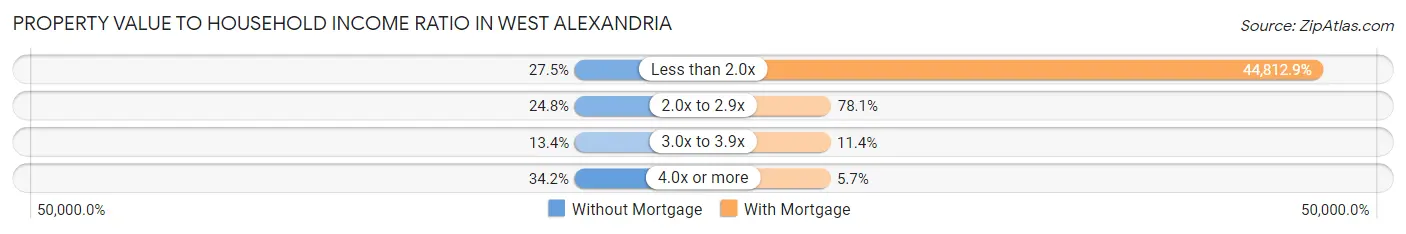
| Value-to-Income Ratio | Without Mortgage | With Mortgage |
| Less than 2.0x | 41 (27.5%) | 94,107 (44,812.9%) |
| 2.0x to 2.9x | 37 (24.8%) | 164 (78.1%) |
| 3.0x to 3.9x | 20 (13.4%) | 24 (11.4%) |
| 4.0x or more | 51 (34.2%) | 12 (5.7%) |
| Total | 149 (100.0%) | 210 (100.0%) |
Real Estate Taxes by Mortgage Status in West Alexandria
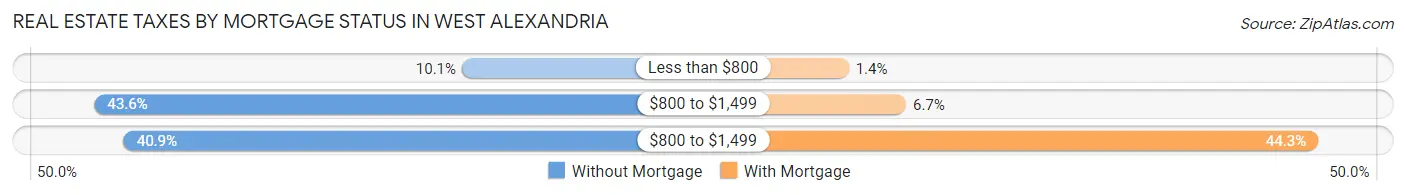
| Property Taxes | Without Mortgage | With Mortgage |
| Less than $800 | 15 (10.1%) | 3 (1.4%) |
| $800 to $1,499 | 65 (43.6%) | 14 (6.7%) |
| $800 to $1,499 | 61 (40.9%) | 93 (44.3%) |
| Total | 149 (100.0%) | 210 (100.0%) |
Health & Disability in West Alexandria
Health Insurance Coverage by Age in West Alexandria
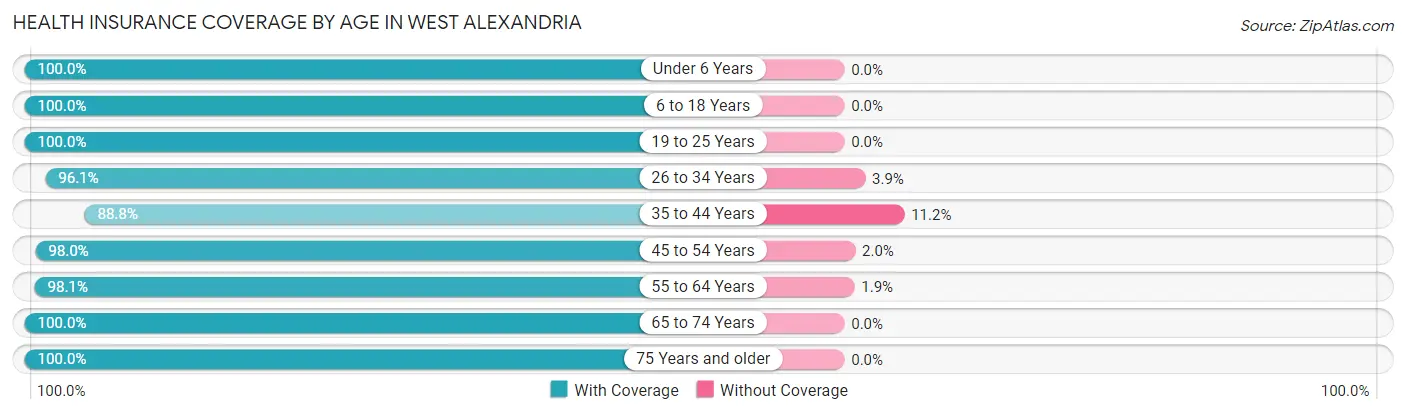
| Age Bracket | With Coverage | Without Coverage |
| Under 6 Years | 164 (100.0%) | 0 (0.0%) |
| 6 to 18 Years | 212 (100.0%) | 0 (0.0%) |
| 19 to 25 Years | 166 (100.0%) | 0 (0.0%) |
| 26 to 34 Years | 198 (96.1%) | 8 (3.9%) |
| 35 to 44 Years | 151 (88.8%) | 19 (11.2%) |
| 45 to 54 Years | 97 (98.0%) | 2 (2.0%) |
| 55 to 64 Years | 210 (98.1%) | 4 (1.9%) |
| 65 to 74 Years | 106 (100.0%) | 0 (0.0%) |
| 75 Years and older | 105 (100.0%) | 0 (0.0%) |
| Total | 1,409 (97.7%) | 33 (2.3%) |
Health Insurance Coverage by Citizenship Status in West Alexandria
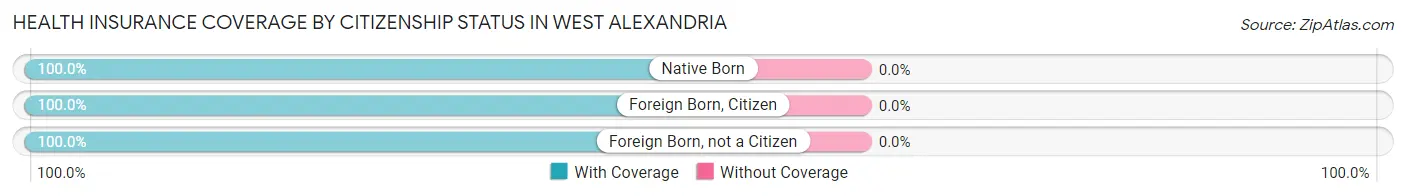
| Citizenship Status | With Coverage | Without Coverage |
| Native Born | 164 (100.0%) | 0 (0.0%) |
| Foreign Born, Citizen | 212 (100.0%) | 0 (0.0%) |
| Foreign Born, not a Citizen | 166 (100.0%) | 0 (0.0%) |
Health Insurance Coverage by Household Income in West Alexandria
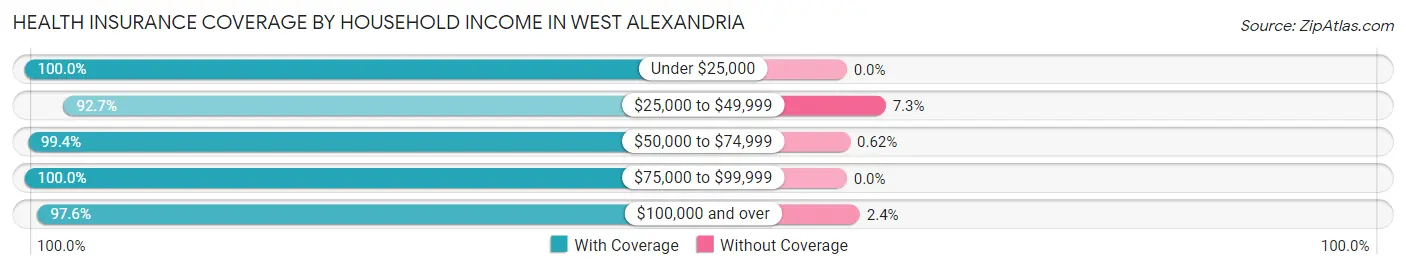
| Household Income | With Coverage | Without Coverage |
| Under $25,000 | 155 (100.0%) | 0 (0.0%) |
| $25,000 to $49,999 | 254 (92.7%) | 20 (7.3%) |
| $50,000 to $74,999 | 321 (99.4%) | 2 (0.6%) |
| $75,000 to $99,999 | 239 (100.0%) | 0 (0.0%) |
| $100,000 and over | 440 (97.6%) | 11 (2.4%) |
Public vs Private Health Insurance Coverage by Age in West Alexandria
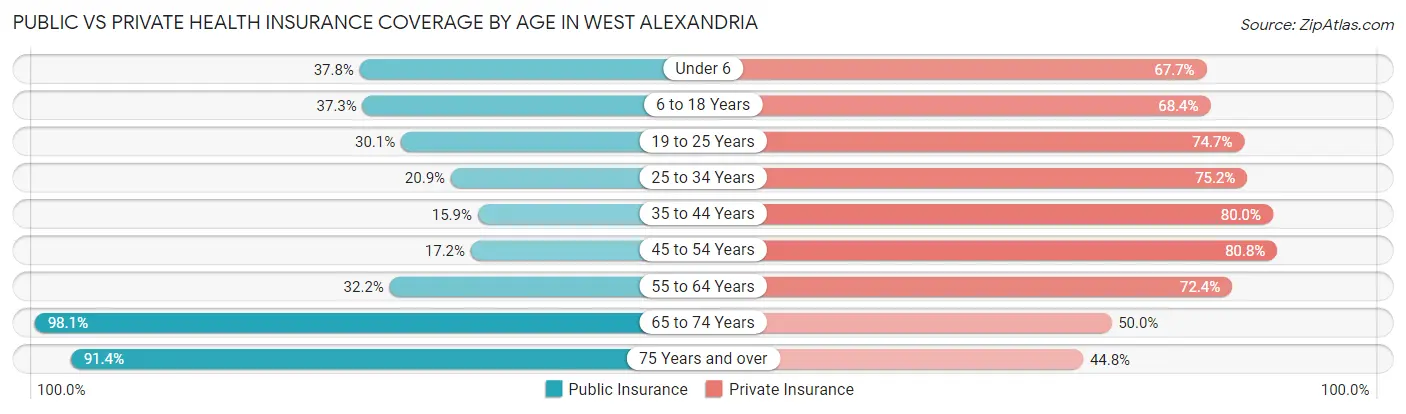
| Age Bracket | Public Insurance | Private Insurance |
| Under 6 | 62 (37.8%) | 111 (67.7%) |
| 6 to 18 Years | 79 (37.3%) | 145 (68.4%) |
| 19 to 25 Years | 50 (30.1%) | 124 (74.7%) |
| 25 to 34 Years | 43 (20.9%) | 155 (75.2%) |
| 35 to 44 Years | 27 (15.9%) | 136 (80.0%) |
| 45 to 54 Years | 17 (17.2%) | 80 (80.8%) |
| 55 to 64 Years | 69 (32.2%) | 155 (72.4%) |
| 65 to 74 Years | 104 (98.1%) | 53 (50.0%) |
| 75 Years and over | 96 (91.4%) | 47 (44.8%) |
| Total | 547 (37.9%) | 1,006 (69.8%) |
Disability Status by Sex by Age in West Alexandria
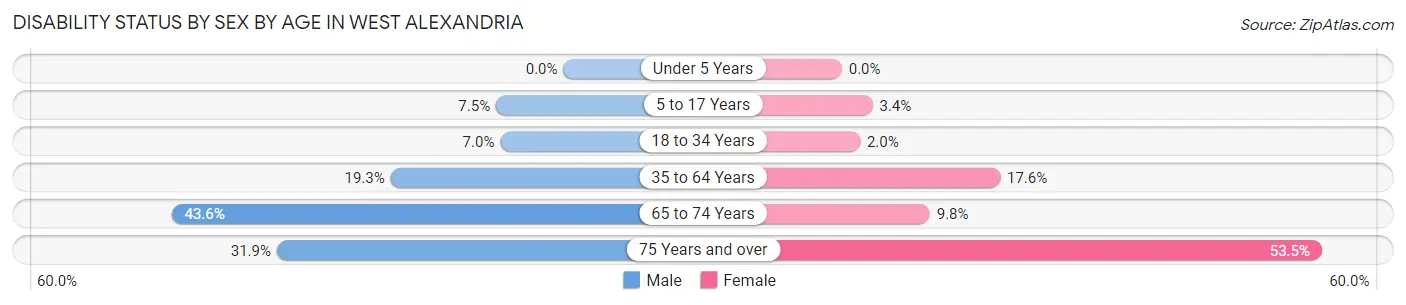
| Age Bracket | Male | Female |
| Under 5 Years | 0 (0.0%) | 0 (0.0%) |
| 5 to 17 Years | 9 (7.5%) | 4 (3.4%) |
| 18 to 34 Years | 13 (7.0%) | 4 (2.0%) |
| 35 to 64 Years | 46 (19.3%) | 43 (17.6%) |
| 65 to 74 Years | 24 (43.6%) | 5 (9.8%) |
| 75 Years and over | 15 (31.9%) | 31 (53.4%) |
Disability Class by Sex by Age in West Alexandria
Disability Class: Hearing Difficulty
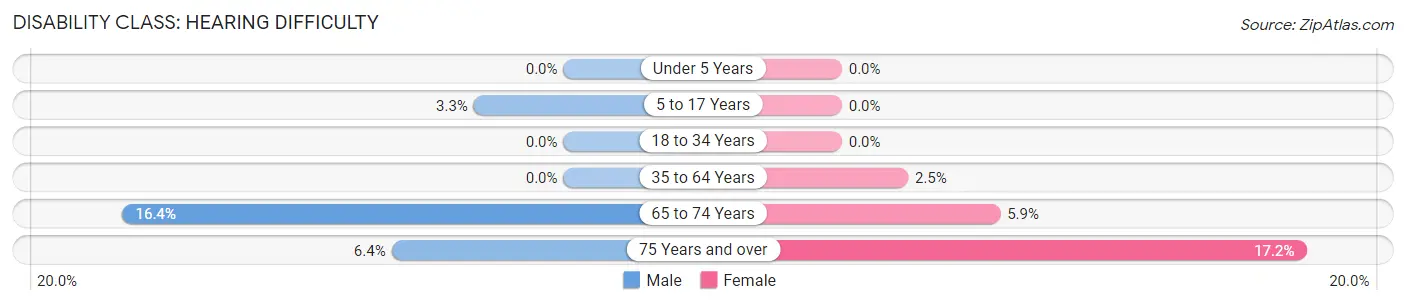
| Age Bracket | Male | Female |
| Under 5 Years | 0 (0.0%) | 0 (0.0%) |
| 5 to 17 Years | 4 (3.3%) | 0 (0.0%) |
| 18 to 34 Years | 0 (0.0%) | 0 (0.0%) |
| 35 to 64 Years | 0 (0.0%) | 6 (2.5%) |
| 65 to 74 Years | 9 (16.4%) | 3 (5.9%) |
| 75 Years and over | 3 (6.4%) | 10 (17.2%) |
Disability Class: Vision Difficulty
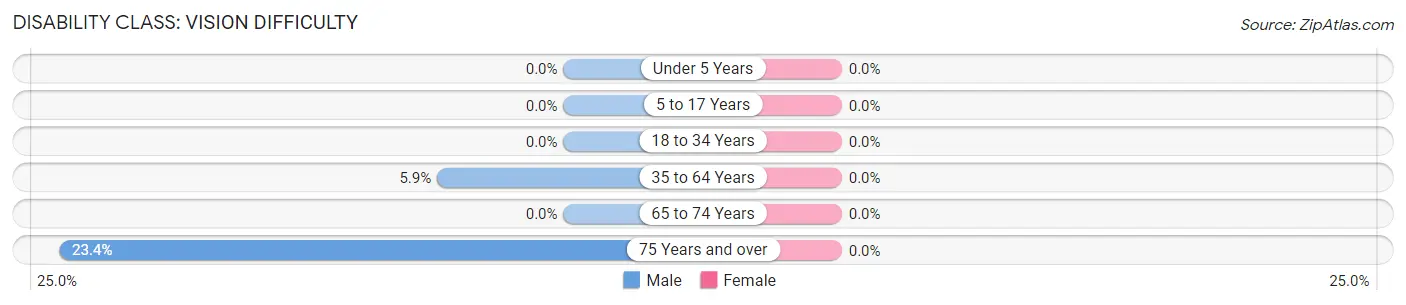
| Age Bracket | Male | Female |
| Under 5 Years | 0 (0.0%) | 0 (0.0%) |
| 5 to 17 Years | 0 (0.0%) | 0 (0.0%) |
| 18 to 34 Years | 0 (0.0%) | 0 (0.0%) |
| 35 to 64 Years | 14 (5.9%) | 0 (0.0%) |
| 65 to 74 Years | 0 (0.0%) | 0 (0.0%) |
| 75 Years and over | 11 (23.4%) | 0 (0.0%) |
Disability Class: Cognitive Difficulty
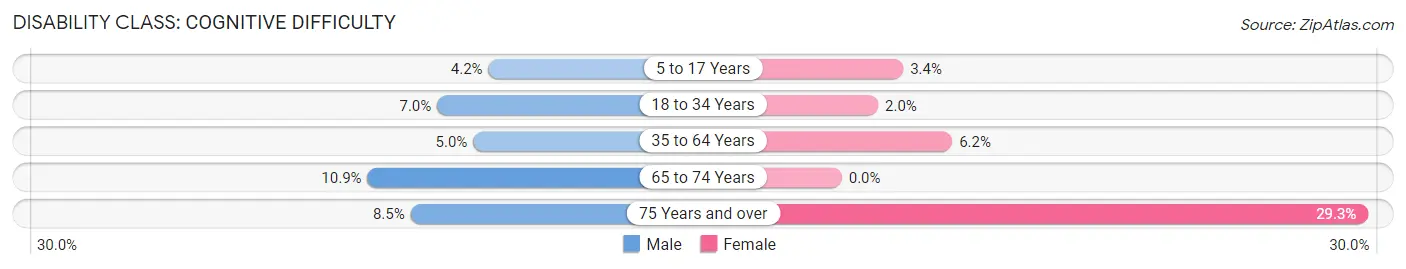
| Age Bracket | Male | Female |
| 5 to 17 Years | 5 (4.2%) | 4 (3.4%) |
| 18 to 34 Years | 13 (7.0%) | 4 (2.0%) |
| 35 to 64 Years | 12 (5.0%) | 15 (6.1%) |
| 65 to 74 Years | 6 (10.9%) | 0 (0.0%) |
| 75 Years and over | 4 (8.5%) | 17 (29.3%) |
Disability Class: Ambulatory Difficulty
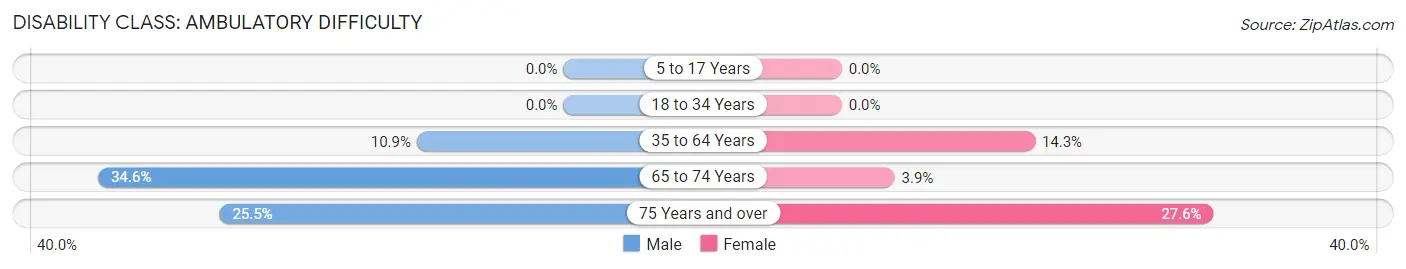
| Age Bracket | Male | Female |
| 5 to 17 Years | 0 (0.0%) | 0 (0.0%) |
| 18 to 34 Years | 0 (0.0%) | 0 (0.0%) |
| 35 to 64 Years | 26 (10.9%) | 35 (14.3%) |
| 65 to 74 Years | 19 (34.5%) | 2 (3.9%) |
| 75 Years and over | 12 (25.5%) | 16 (27.6%) |
Disability Class: Self-Care Difficulty
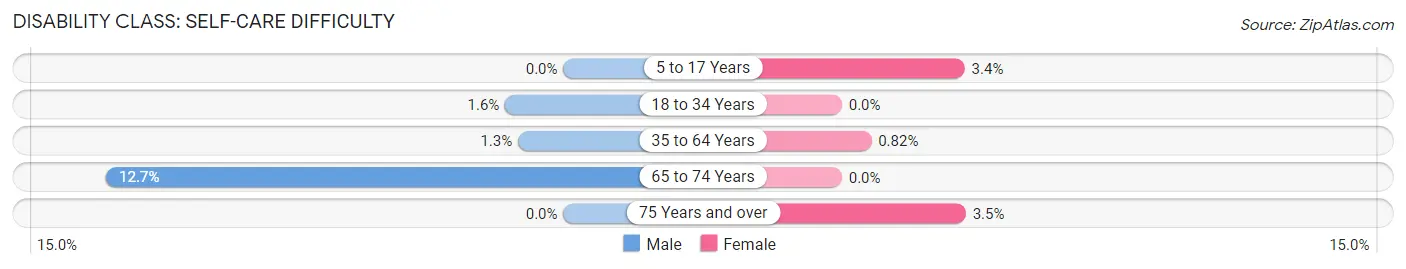
| Age Bracket | Male | Female |
| 5 to 17 Years | 0 (0.0%) | 4 (3.4%) |
| 18 to 34 Years | 3 (1.6%) | 0 (0.0%) |
| 35 to 64 Years | 3 (1.3%) | 2 (0.8%) |
| 65 to 74 Years | 7 (12.7%) | 0 (0.0%) |
| 75 Years and over | 0 (0.0%) | 2 (3.5%) |
Technology Access in West Alexandria
Computing Device Access in West Alexandria
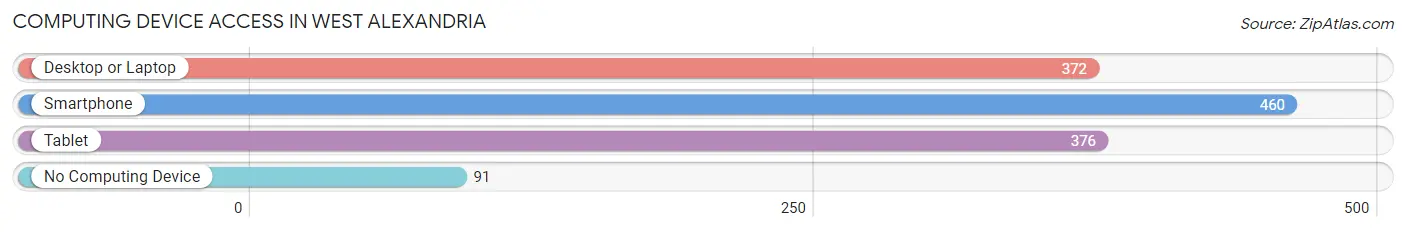
| Device Type | # Households | % Households |
| Desktop or Laptop | 372 | 64.4% |
| Smartphone | 460 | 79.6% |
| Tablet | 376 | 65.0% |
| No Computing Device | 91 | 15.7% |
| Total | 578 | 100.0% |
Internet Access in West Alexandria
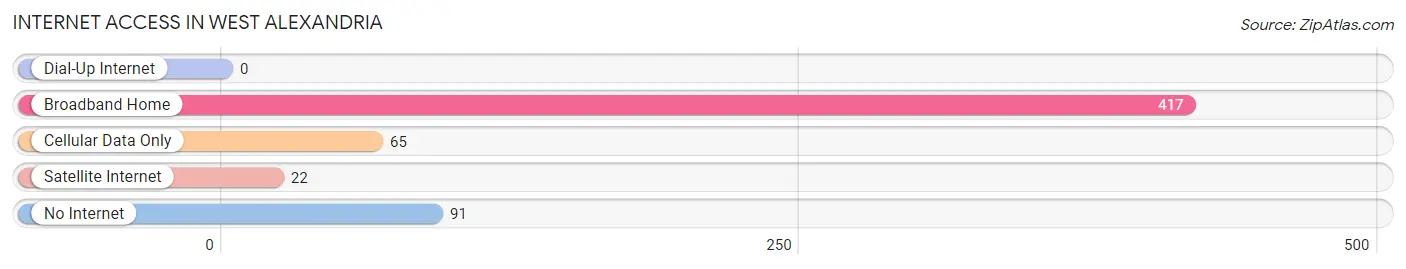
| Internet Type | # Households | % Households |
| Dial-Up Internet | 0 | 0.0% |
| Broadband Home | 417 | 72.2% |
| Cellular Data Only | 65 | 11.3% |
| Satellite Internet | 22 | 3.8% |
| No Internet | 91 | 15.7% |
| Total | 578 | 100.0% |
West Alexandria Summary
History
West Alexandria is a small village located in Preble County, Ohio. It is situated on the western edge of the county, near the border of Darke County. The village was founded in 1837 by a group of settlers from Virginia, who named it after the state they had come from. The village was incorporated in 1845 and has since grown to a population of 1,717 as of the 2010 census.
West Alexandria has a rich history that dates back to the early 19th century. The first settlers arrived in the area in 1805 and began to build homes and businesses. The village was officially founded in 1837 and was named after the state of Virginia. The village was incorporated in 1845 and has since grown to its current population.
The village has a long history of industry and agriculture. In the early days, the village was home to a number of mills, including a grist mill, a saw mill, and a woolen mill. The village also had a number of businesses, including a blacksmith shop, a general store, and a hotel.
The village was also home to a number of churches, including the First Presbyterian Church, which was founded in 1837. The village also had a number of schools, including the West Alexandria Academy, which was founded in 1845.
Geography
West Alexandria is located in Preble County, Ohio, on the western edge of the county, near the border of Darke County. The village is situated on the banks of the Twin Creek, a tributary of the Great Miami River. The village is located approximately 25 miles west of Dayton and 40 miles east of Richmond, Indiana.
The village has a total area of 0.9 square miles, all of which is land. The village is located in a rural area and is surrounded by farmland. The village is located at an elevation of 890 feet above sea level.
Economy
West Alexandria is a small village with a population of 1,717 as of the 2010 census. The village has a small economy that is largely based on agriculture and small businesses. The village is home to a number of small businesses, including a grocery store, a hardware store, a pharmacy, and a few restaurants.
The village is also home to a number of manufacturing businesses, including a plastics manufacturer, a metal fabricator, and a printing company. The village is also home to a number of agricultural businesses, including a dairy farm, a grain elevator, and a feed mill.
Demographics
As of the 2010 census, the village of West Alexandria had a population of 1,717. The population was spread out with 49.3% male and 50.7% female. The median age was 41.7 years. The racial makeup of the village was 97.2% White, 0.5% African American, 0.2% Native American, 0.2% Asian, 0.1% Pacific Islander, 0.7% from other races, and 1.1% from two or more races. Hispanic or Latino of any race were 1.7% of the population.
The median household income in the village was $41,250 and the median family income was $48,750. The per capita income for the village was $19,945. About 11.2% of the population was below the poverty line.
Common Questions
What is Per Capita Income in West Alexandria?
Per Capita income in West Alexandria is $28,720.
What is the Median Family Income in West Alexandria?
Median Family Income in West Alexandria is $74,375.
What is the Median Household income in West Alexandria?
Median Household Income in West Alexandria is $56,800.
What is Income or Wage Gap in West Alexandria?
Income or Wage Gap in West Alexandria is 49.3%.
Women in West Alexandria earn 50.7 cents for every dollar earned by a man.
What is Inequality or Gini Index in West Alexandria?
Inequality or Gini Index in West Alexandria is 0.39.
What is the Total Population of West Alexandria?
Total Population of West Alexandria is 1,442.
What is the Total Male Population of West Alexandria?
Total Male Population of West Alexandria is 702.
What is the Total Female Population of West Alexandria?
Total Female Population of West Alexandria is 740.
What is the Ratio of Males per 100 Females in West Alexandria?
There are 94.86 Males per 100 Females in West Alexandria.
What is the Ratio of Females per 100 Males in West Alexandria?
There are 105.41 Females per 100 Males in West Alexandria.
What is the Median Population Age in West Alexandria?
Median Population Age in West Alexandria is 33.5 Years.
What is the Average Family Size in West Alexandria
Average Family Size in West Alexandria is 3.1 People.
What is the Average Household Size in West Alexandria
Average Household Size in West Alexandria is 2.5 People.
How Large is the Labor Force in West Alexandria?
There are 724 People in the Labor Forcein in West Alexandria.
What is the Percentage of People in the Labor Force in West Alexandria?
65.8% of People are in the Labor Force in West Alexandria.
What is the Unemployment Rate in West Alexandria?
Unemployment Rate in West Alexandria is 4.6%.