Walbridge, OH Map & Demographics
Walbridge Map
Walbridge Overview
$30,377
PER CAPITA INCOME
$72,500
AVG FAMILY INCOME
$51,563
AVG HOUSEHOLD INCOME
38.9%
WAGE / INCOME GAP [ % ]
61.1¢/ $1
WAGE / INCOME GAP [ $ ]
0.39
INEQUALITY / GINI INDEX
3,023
TOTAL POPULATION
1,370
MALE POPULATION
1,653
FEMALE POPULATION
82.88
MALES / 100 FEMALES
120.66
FEMALES / 100 MALES
37.0
MEDIAN AGE
3.0
AVG FAMILY SIZE
2.2
AVG HOUSEHOLD SIZE
1,781
LABOR FORCE [ PEOPLE ]
70.5%
PERCENT IN LABOR FORCE
7.8%
UNEMPLOYMENT RATE
Walbridge Zip Codes
Walbridge Area Codes
Income in Walbridge
Income Overview in Walbridge
Per Capita Income in Walbridge is $30,377, while median incomes of families and households are $72,500 and $51,563 respectively.
| Characteristic | Number | Measure |
| Per Capita Income | 3,023 | $30,377 |
| Median Family Income | 690 | $72,500 |
| Mean Family Income | 690 | $79,799 |
| Median Household Income | 1,339 | $51,563 |
| Mean Household Income | 1,339 | $62,259 |
| Income Deficit | 690 | $0 |
| Wage / Income Gap (%) | 3,023 | 38.93% |
| Wage / Income Gap ($) | 3,023 | 61.07¢ per $1 |
| Gini / Inequality Index | 3,023 | 0.39 |
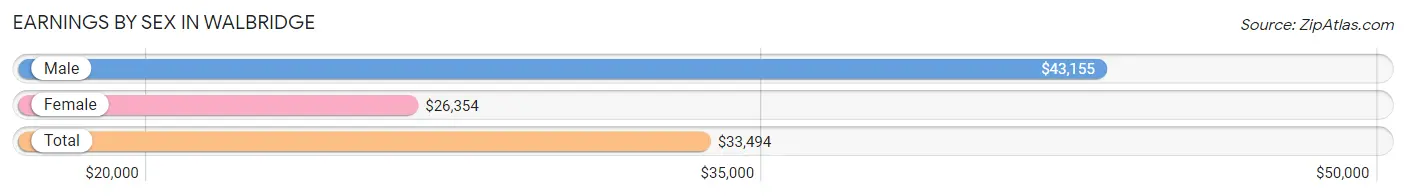
Earnings by Sex in Walbridge
Average Earnings in Walbridge are $33,494, $43,155 for men and $26,354 for women, a difference of 38.9%.
| Sex | Number | Average Earnings |
| Male | 865 (47.2%) | $43,155 |
| Female | 968 (52.8%) | $26,354 |
| Total | 1,833 (100.0%) | $33,494 |
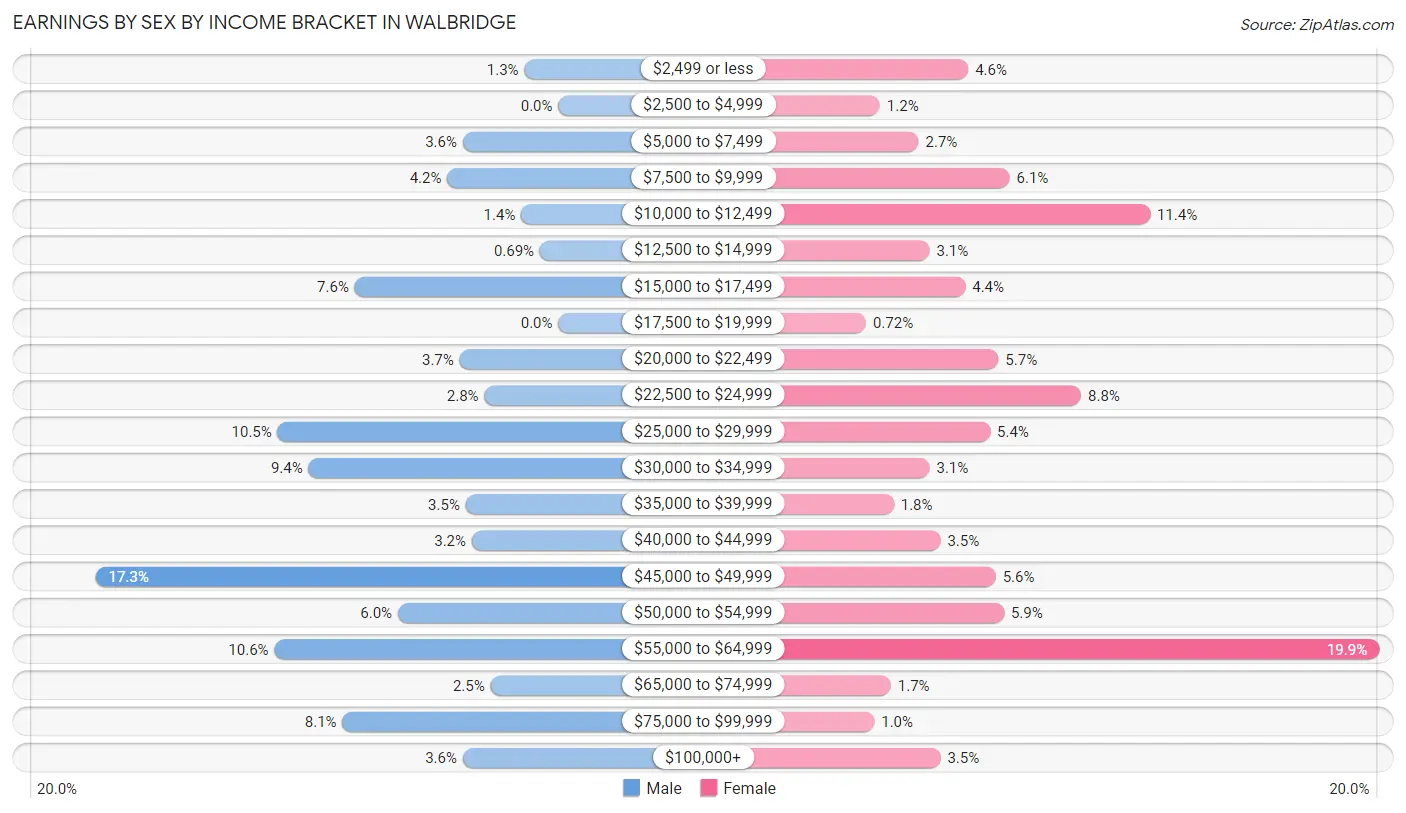
Earnings by Sex by Income Bracket in Walbridge
The most common earnings brackets in Walbridge are $45,000 to $49,999 for men (150 | 17.3%) and $55,000 to $64,999 for women (193 | 19.9%).
| Income | Male | Female |
| $2,499 or less | 11 (1.3%) | 44 (4.5%) |
| $2,500 to $4,999 | 0 (0.0%) | 12 (1.2%) |
| $5,000 to $7,499 | 31 (3.6%) | 26 (2.7%) |
| $7,500 to $9,999 | 36 (4.2%) | 59 (6.1%) |
| $10,000 to $12,499 | 12 (1.4%) | 110 (11.4%) |
| $12,500 to $14,999 | 6 (0.7%) | 30 (3.1%) |
| $15,000 to $17,499 | 66 (7.6%) | 43 (4.4%) |
| $17,500 to $19,999 | 0 (0.0%) | 7 (0.7%) |
| $20,000 to $22,499 | 32 (3.7%) | 55 (5.7%) |
| $22,500 to $24,999 | 24 (2.8%) | 85 (8.8%) |
| $25,000 to $29,999 | 91 (10.5%) | 52 (5.4%) |
| $30,000 to $34,999 | 81 (9.4%) | 30 (3.1%) |
| $35,000 to $39,999 | 30 (3.5%) | 17 (1.8%) |
| $40,000 to $44,999 | 28 (3.2%) | 34 (3.5%) |
| $45,000 to $49,999 | 150 (17.3%) | 54 (5.6%) |
| $50,000 to $54,999 | 52 (6.0%) | 57 (5.9%) |
| $55,000 to $64,999 | 92 (10.6%) | 193 (19.9%) |
| $65,000 to $74,999 | 22 (2.5%) | 16 (1.7%) |
| $75,000 to $99,999 | 70 (8.1%) | 10 (1.0%) |
| $100,000+ | 31 (3.6%) | 34 (3.5%) |
| Total | 865 (100.0%) | 968 (100.0%) |
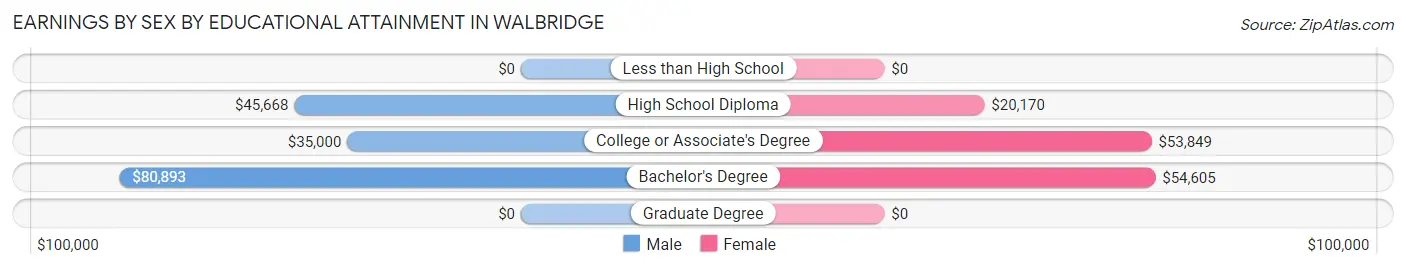
Earnings by Sex by Educational Attainment in Walbridge
Average earnings in Walbridge are $45,560 for men and $48,431 for women, a difference of 5.9%. Men with an educational attainment of bachelor's degree enjoy the highest average annual earnings of $80,893, while those with college or associate's degree education earn the least with $35,000. Women with an educational attainment of bachelor's degree earn the most with the average annual earnings of $54,605, while those with high school diploma education have the smallest earnings of $20,170.
| Educational Attainment | Male Income | Female Income |
| Less than High School | - | - |
| High School Diploma | $45,668 | $20,170 |
| College or Associate's Degree | $35,000 | $53,849 |
| Bachelor's Degree | $80,893 | $54,605 |
| Graduate Degree | - | - |
| Total | $45,560 | $48,431 |
Family Income in Walbridge
Family Income Brackets in Walbridge
According to the Walbridge family income data, there are 187 families falling into the $100,000 to $149,999 income range, which is the most common income bracket and makes up 27.1% of all families.
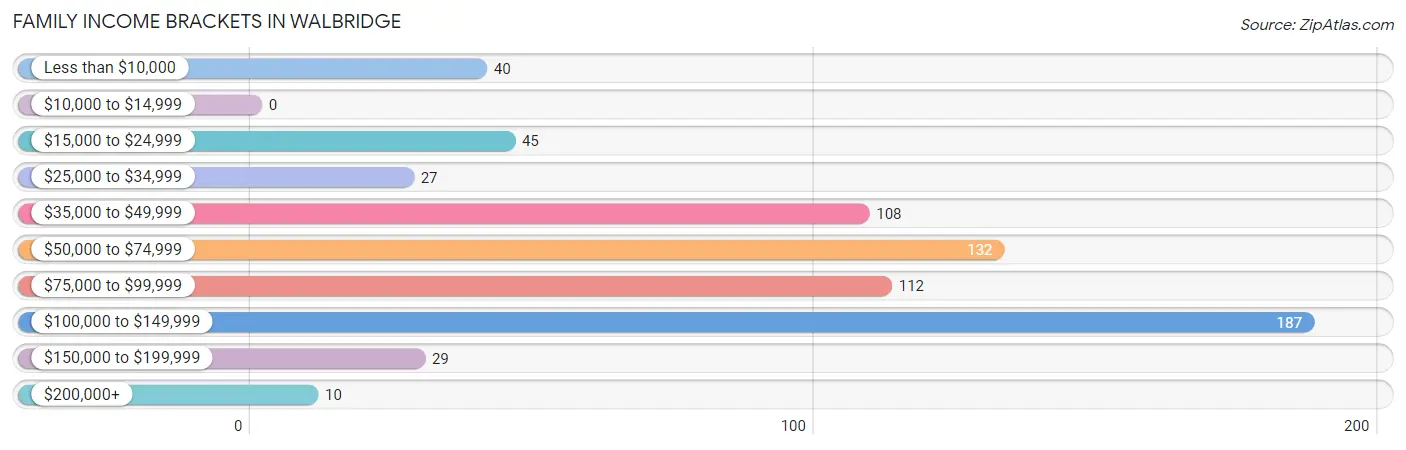
| Income Bracket | # Families | % Families |
| Less than $10,000 | 40 | 5.8% |
| $10,000 to $14,999 | 0 | 0.0% |
| $15,000 to $24,999 | 45 | 6.5% |
| $25,000 to $34,999 | 27 | 3.9% |
| $35,000 to $49,999 | 108 | 15.7% |
| $50,000 to $74,999 | 132 | 19.1% |
| $75,000 to $99,999 | 112 | 16.2% |
| $100,000 to $149,999 | 187 | 27.1% |
| $150,000 to $199,999 | 29 | 4.2% |
| $200,000+ | 10 | 1.4% |
Family Income by Famaliy Size in Walbridge
2-person families (326 | 47.2%) account for the highest median family income in Walbridge with $80,192 per family, while 2-person families (326 | 47.2%) have the highest median income of $40,096 per family member.
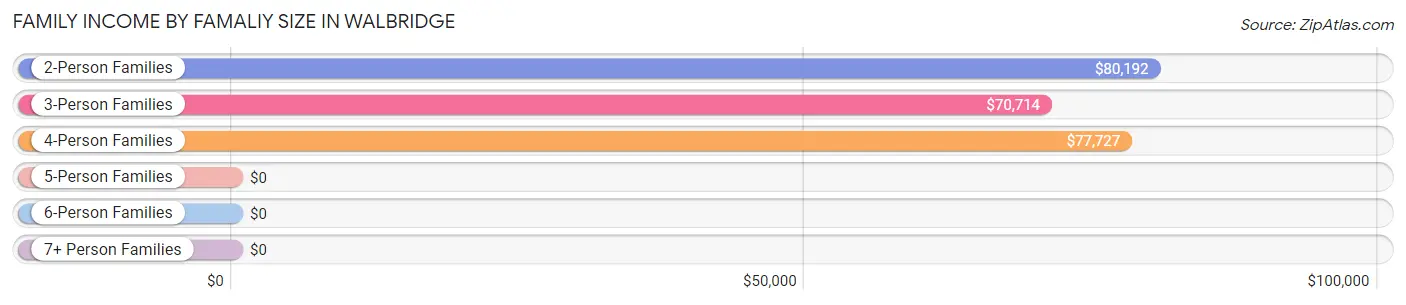
| Income Bracket | # Families | Median Income |
| 2-Person Families | 326 (47.2%) | $80,192 |
| 3-Person Families | 132 (19.1%) | $70,714 |
| 4-Person Families | 210 (30.4%) | $77,727 |
| 5-Person Families | 22 (3.2%) | $0 |
| 6-Person Families | 0 (0.0%) | $0 |
| 7+ Person Families | 0 (0.0%) | $0 |
| Total | 690 (100.0%) | $72,500 |
Family Income by Number of Earners in Walbridge
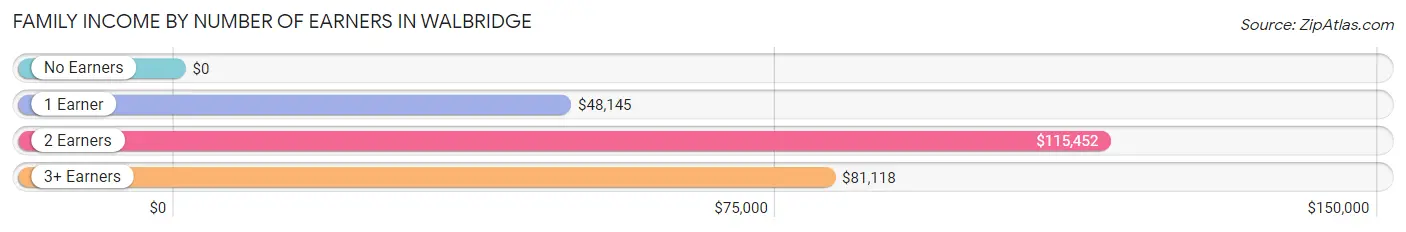
| Number of Earners | # Families | Median Income |
| No Earners | 55 (8.0%) | $0 |
| 1 Earner | 250 (36.2%) | $48,145 |
| 2 Earners | 291 (42.2%) | $115,452 |
| 3+ Earners | 94 (13.6%) | $81,118 |
| Total | 690 (100.0%) | $72,500 |
Household Income in Walbridge
Household Income Brackets in Walbridge
With 270 households falling in the category, the $50,000 to $74,999 income range is the most frequent in Walbridge, accounting for 20.2% of all households. In contrast, only 15 households (1.1%) fall into the $200,000+ income bracket, making it the least populous group.
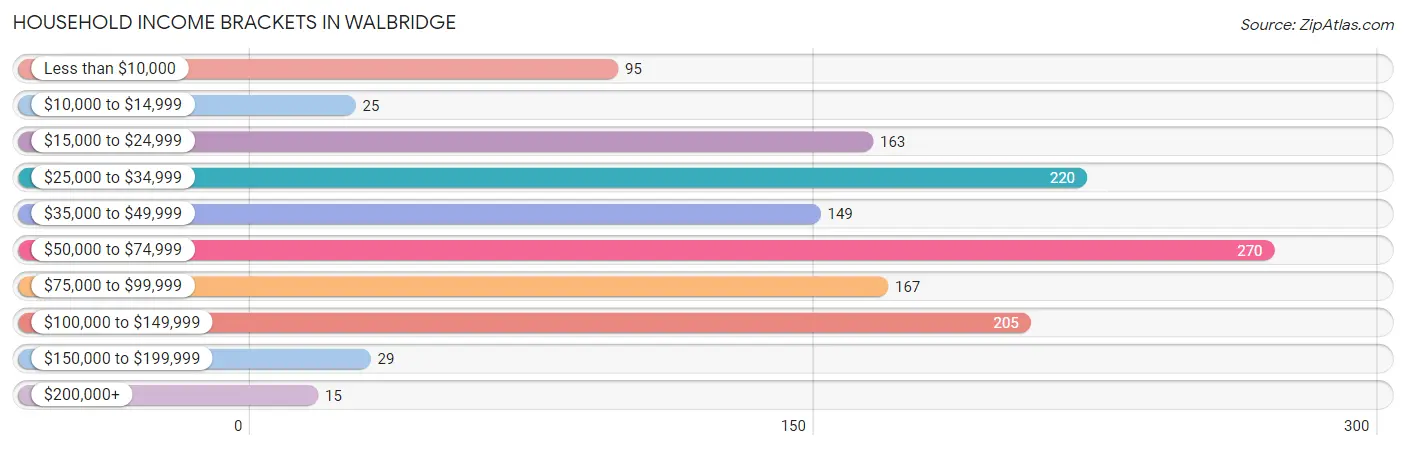
| Income Bracket | # Households | % Households |
| Less than $10,000 | 95 | 7.1% |
| $10,000 to $14,999 | 25 | 1.9% |
| $15,000 to $24,999 | 163 | 12.2% |
| $25,000 to $34,999 | 220 | 16.4% |
| $35,000 to $49,999 | 149 | 11.1% |
| $50,000 to $74,999 | 270 | 20.2% |
| $75,000 to $99,999 | 167 | 12.5% |
| $100,000 to $149,999 | 205 | 15.3% |
| $150,000 to $199,999 | 29 | 2.2% |
| $200,000+ | 15 | 1.1% |
Household Income by Householder Age in Walbridge
The median household income in Walbridge is $51,563, with the highest median household income of $82,386 found in the 45 to 64 years age bracket for the primary householder. A total of 376 households (28.1%) fall into this category. Meanwhile, the 65+ years age bracket for the primary householder has the lowest median household income of $33,056, with 480 households (35.8%) in this group.
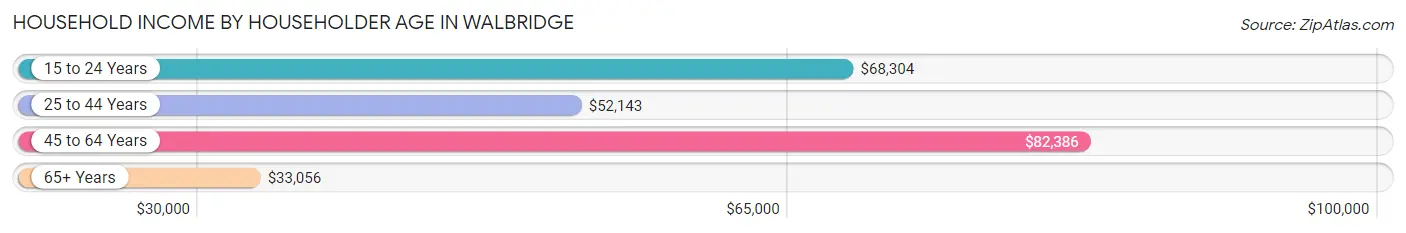
| Income Bracket | # Households | Median Income |
| 15 to 24 Years | 127 (9.5%) | $68,304 |
| 25 to 44 Years | 356 (26.6%) | $52,143 |
| 45 to 64 Years | 376 (28.1%) | $82,386 |
| 65+ Years | 480 (35.8%) | $33,056 |
| Total | 1,339 (100.0%) | $51,563 |
Poverty in Walbridge
Income Below Poverty by Sex and Age in Walbridge
With 15.7% poverty level for males and 18.5% for females among the residents of Walbridge, 16 and 17 year old males and 6 to 11 year old females are the most vulnerable to poverty, with 13 males (81.2%) and 44 females (91.7%) in their respective age groups living below the poverty level.
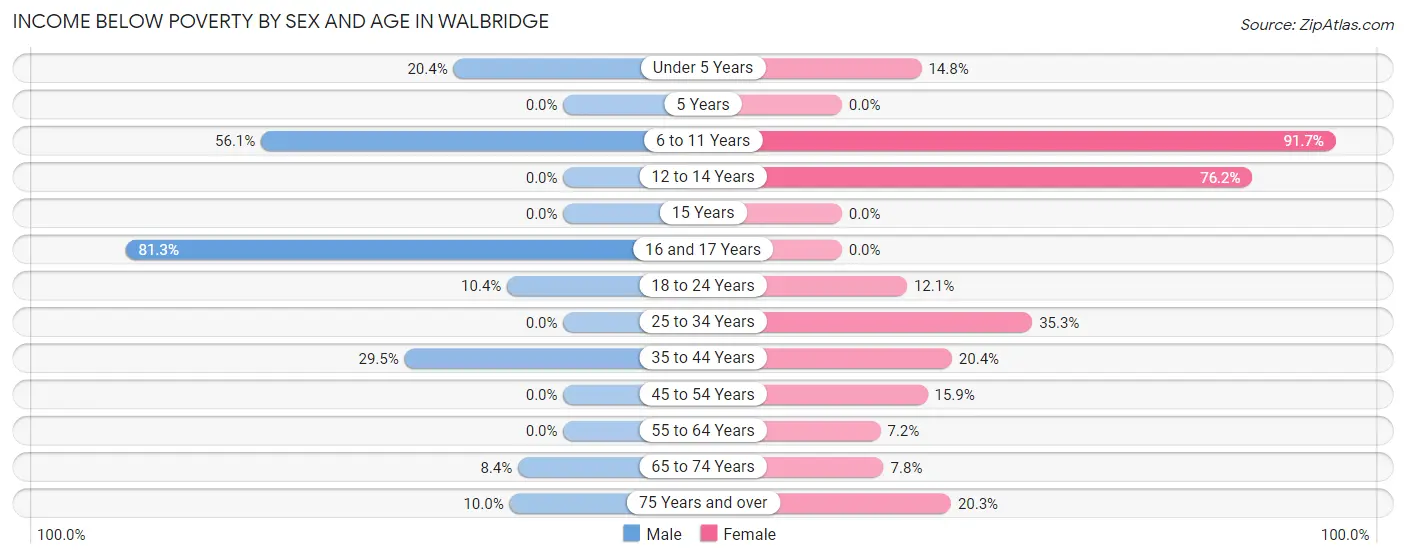
| Age Bracket | Male | Female |
| Under 5 Years | 21 (20.4%) | 21 (14.8%) |
| 5 Years | 0 (0.0%) | 0 (0.0%) |
| 6 to 11 Years | 69 (56.1%) | 44 (91.7%) |
| 12 to 14 Years | 0 (0.0%) | 16 (76.2%) |
| 15 Years | 0 (0.0%) | 0 (0.0%) |
| 16 and 17 Years | 13 (81.2%) | 0 (0.0%) |
| 18 to 24 Years | 12 (10.4%) | 34 (12.1%) |
| 25 to 34 Years | 0 (0.0%) | 47 (35.3%) |
| 35 to 44 Years | 84 (29.5%) | 37 (20.4%) |
| 45 to 54 Years | 0 (0.0%) | 28 (15.9%) |
| 55 to 64 Years | 0 (0.0%) | 11 (7.2%) |
| 65 to 74 Years | 9 (8.4%) | 22 (7.8%) |
| 75 Years and over | 7 (10.0%) | 46 (20.3%) |
| Total | 215 (15.7%) | 306 (18.5%) |
Income Above Poverty by Sex and Age in Walbridge
According to the poverty statistics in Walbridge, males aged 5 years and females aged 16 and 17 years are the age groups that are most secure financially, with 100.0% of males and 100.0% of females in these age groups living above the poverty line.
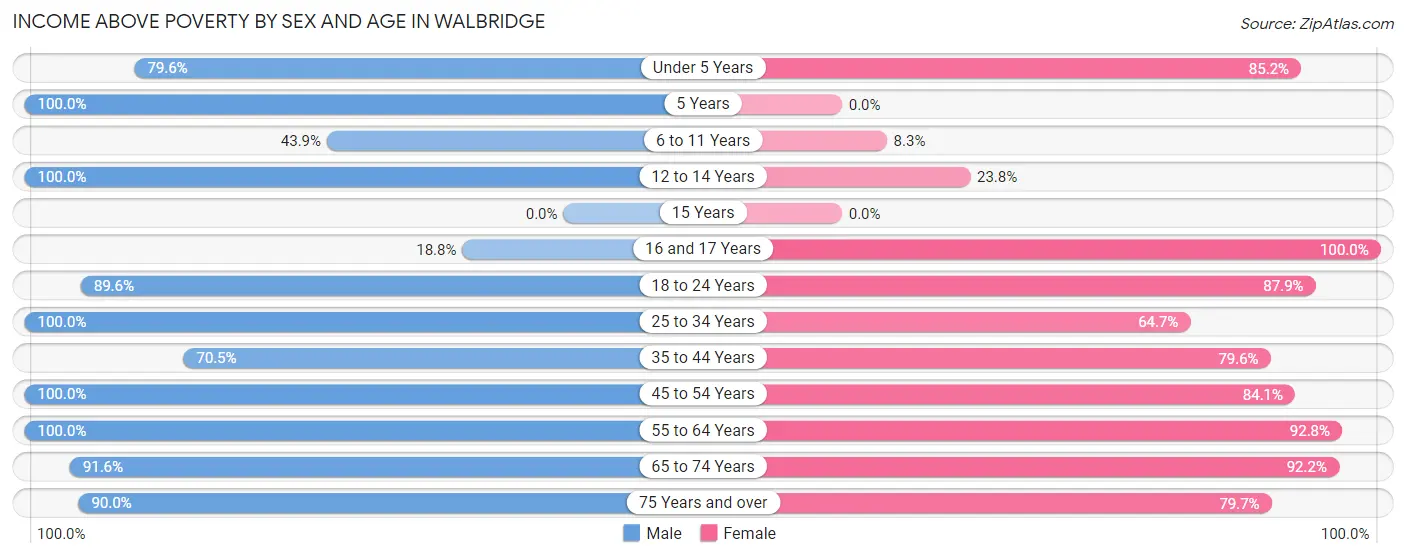
| Age Bracket | Male | Female |
| Under 5 Years | 82 (79.6%) | 121 (85.2%) |
| 5 Years | 11 (100.0%) | 0 (0.0%) |
| 6 to 11 Years | 54 (43.9%) | 4 (8.3%) |
| 12 to 14 Years | 49 (100.0%) | 5 (23.8%) |
| 15 Years | 0 (0.0%) | 0 (0.0%) |
| 16 and 17 Years | 3 (18.8%) | 8 (100.0%) |
| 18 to 24 Years | 103 (89.6%) | 247 (87.9%) |
| 25 to 34 Years | 204 (100.0%) | 86 (64.7%) |
| 35 to 44 Years | 201 (70.5%) | 144 (79.6%) |
| 45 to 54 Years | 125 (100.0%) | 148 (84.1%) |
| 55 to 64 Years | 162 (100.0%) | 142 (92.8%) |
| 65 to 74 Years | 98 (91.6%) | 261 (92.2%) |
| 75 Years and over | 63 (90.0%) | 181 (79.7%) |
| Total | 1,155 (84.3%) | 1,347 (81.5%) |
Income Below Poverty Among Married-Couple Families in Walbridge
The poverty statistics for married-couple families in Walbridge show that 3.3% or 13 of the total 391 families live below the poverty line. Families with 1 or 2 children have the highest poverty rate of 8.4%, comprising of 13 families. On the other hand, families with no children have the lowest poverty rate of 0.0%, which includes 0 families.
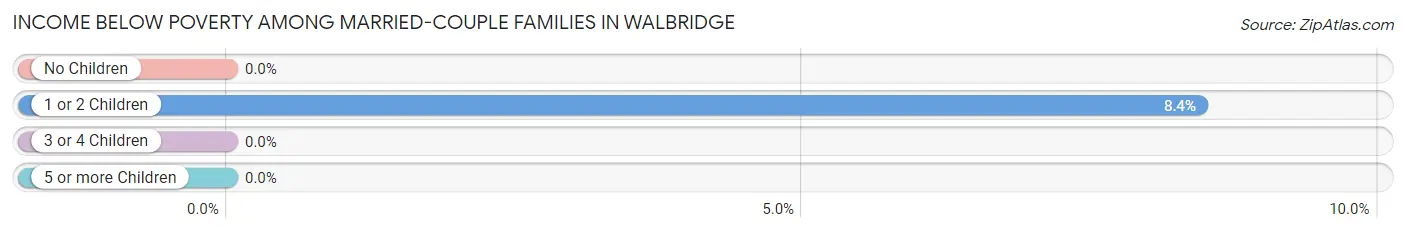
| Children | Above Poverty | Below Poverty |
| No Children | 237 (100.0%) | 0 (0.0%) |
| 1 or 2 Children | 141 (91.6%) | 13 (8.4%) |
| 3 or 4 Children | 0 (0.0%) | 0 (0.0%) |
| 5 or more Children | 0 (0.0%) | 0 (0.0%) |
| Total | 378 (96.7%) | 13 (3.3%) |
Income Below Poverty Among Single-Parent Households in Walbridge
According to the poverty data in Walbridge, 36.4% or 16 single-father households and 27.1% or 69 single-mother households are living below the poverty line. Among single-father households, those with 3 or 4 children have the highest poverty rate, with 16 households (100.0%) experiencing poverty. Likewise, among single-mother households, those with 3 or 4 children have the highest poverty rate, with 20 households (76.9%) falling below the poverty line.
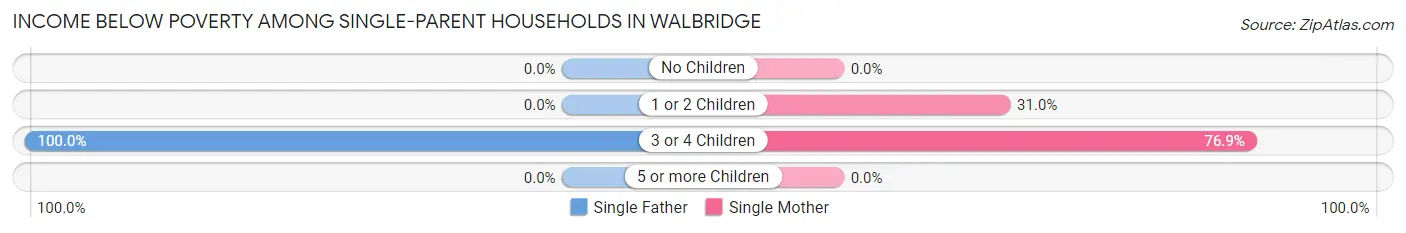
| Children | Single Father | Single Mother |
| No Children | 0 (0.0%) | 0 (0.0%) |
| 1 or 2 Children | 0 (0.0%) | 49 (31.0%) |
| 3 or 4 Children | 16 (100.0%) | 20 (76.9%) |
| 5 or more Children | 0 (0.0%) | 0 (0.0%) |
| Total | 16 (36.4%) | 69 (27.1%) |
Income Below Poverty Among Married-Couple vs Single-Parent Households in Walbridge
The poverty data for Walbridge shows that 13 of the married-couple family households (3.3%) and 85 of the single-parent households (28.4%) are living below the poverty level. Within the married-couple family households, those with 1 or 2 children have the highest poverty rate, with 13 households (8.4%) falling below the poverty line. Among the single-parent households, those with 3 or 4 children have the highest poverty rate, with 36 household (85.7%) living below poverty.
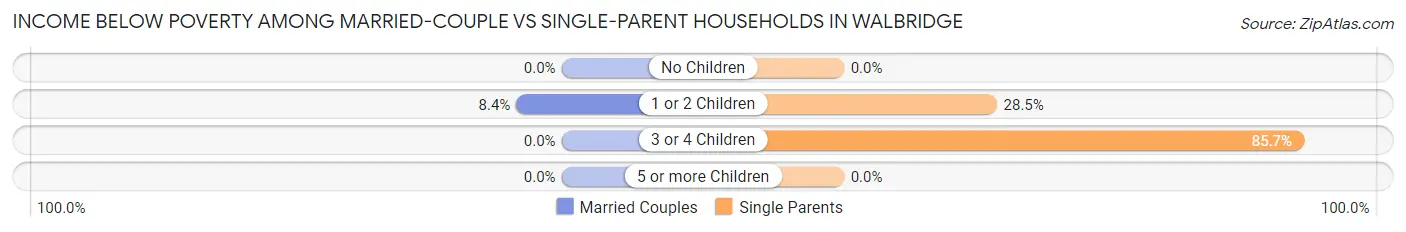
| Children | Married-Couple Families | Single-Parent Households |
| No Children | 0 (0.0%) | 0 (0.0%) |
| 1 or 2 Children | 13 (8.4%) | 49 (28.5%) |
| 3 or 4 Children | 0 (0.0%) | 36 (85.7%) |
| 5 or more Children | 0 (0.0%) | 0 (0.0%) |
| Total | 13 (3.3%) | 85 (28.4%) |
Race in Walbridge
The most populous races in Walbridge are White / Caucasian (2,523 | 83.5%), Hispanic or Latino (448 | 14.8%), and Two or more Races (388 | 12.8%).
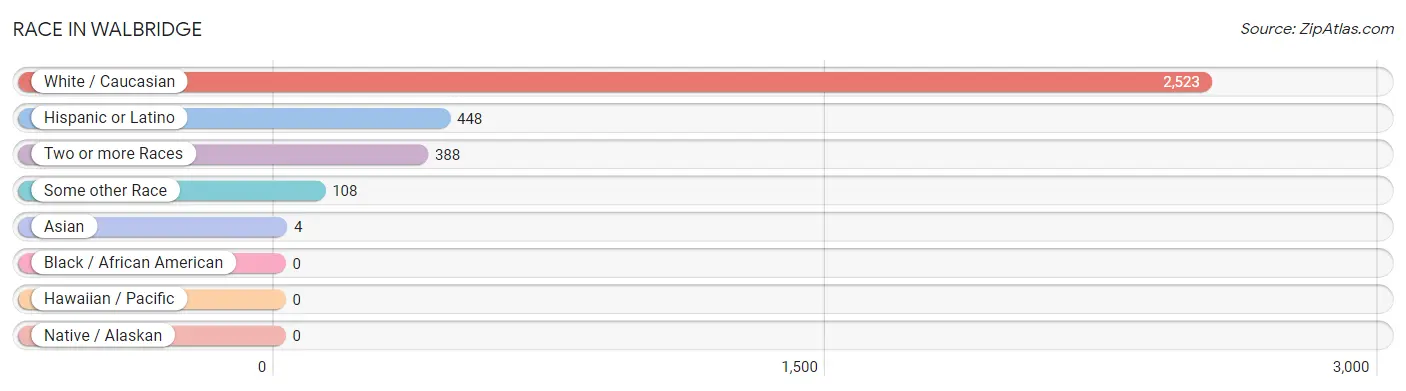
| Race | # Population | % Population |
| Asian | 4 | 0.1% |
| Black / African American | 0 | 0.0% |
| Hawaiian / Pacific | 0 | 0.0% |
| Hispanic or Latino | 448 | 14.8% |
| Native / Alaskan | 0 | 0.0% |
| White / Caucasian | 2,523 | 83.5% |
| Two or more Races | 388 | 12.8% |
| Some other Race | 108 | 3.6% |
| Total | 3,023 | 100.0% |
Ancestry in Walbridge
The most populous ancestries reported in Walbridge are German (941 | 31.1%), Mexican (410 | 13.6%), Irish (388 | 12.8%), English (200 | 6.6%), and Polish (162 | 5.4%), together accounting for 69.5% of all Walbridge residents.
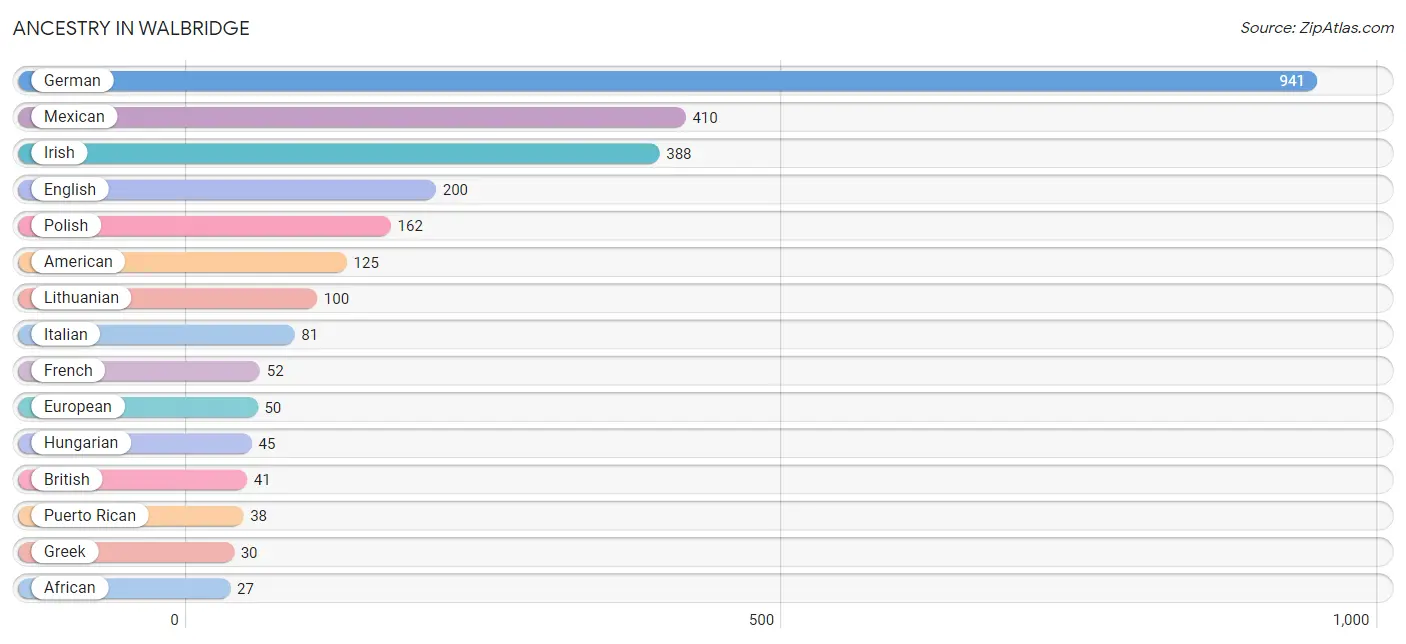
| Ancestry | # Population | % Population |
| African | 27 | 0.9% |
| American | 125 | 4.1% |
| Austrian | 3 | 0.1% |
| British | 41 | 1.4% |
| Czech | 5 | 0.2% |
| Dutch | 15 | 0.5% |
| English | 200 | 6.6% |
| European | 50 | 1.7% |
| French | 52 | 1.7% |
| French Canadian | 4 | 0.1% |
| German | 941 | 31.1% |
| Greek | 30 | 1.0% |
| Hungarian | 45 | 1.5% |
| Irish | 388 | 12.8% |
| Italian | 81 | 2.7% |
| Japanese | 14 | 0.5% |
| Lithuanian | 100 | 3.3% |
| Mexican | 410 | 13.6% |
| Norwegian | 16 | 0.5% |
| Polish | 162 | 5.4% |
| Puerto Rican | 38 | 1.3% |
| Scotch-Irish | 25 | 0.8% |
| Scottish | 18 | 0.6% |
| Slovak | 6 | 0.2% |
| Subsaharan African | 27 | 0.9% |
| Swiss | 12 | 0.4% |
| Welsh | 18 | 0.6% | View All 27 Rows |
Immigrants in Walbridge
The most numerous immigrant groups reported in Walbridge came from Central America (116 | 3.8%), Latin America (116 | 3.8%), Mexico (116 | 3.8%), Czechoslovakia (5 | 0.2%), and Eastern Europe (5 | 0.2%), together accounting for 11.9% of all Walbridge residents.
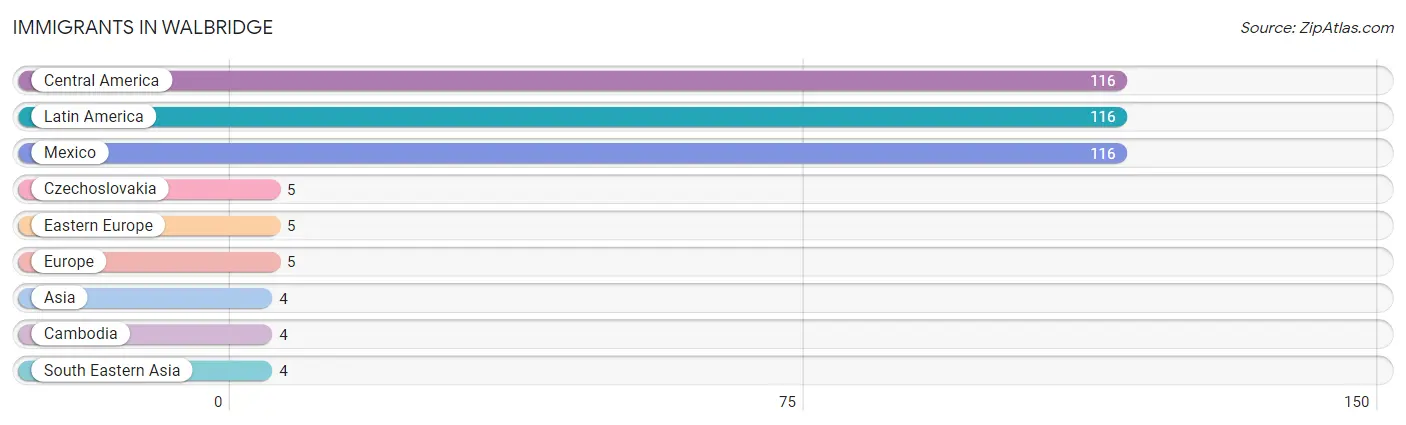
| Immigration Origin | # Population | % Population |
| Asia | 4 | 0.1% |
| Cambodia | 4 | 0.1% |
| Central America | 116 | 3.8% |
| Czechoslovakia | 5 | 0.2% |
| Eastern Europe | 5 | 0.2% |
| Europe | 5 | 0.2% |
| Latin America | 116 | 3.8% |
| Mexico | 116 | 3.8% |
| South Eastern Asia | 4 | 0.1% | View All 9 Rows |
Sex and Age in Walbridge
Sex and Age in Walbridge
The most populous age groups in Walbridge are 35 to 39 Years (231 | 16.9%) for men and 20 to 24 Years (231 | 14.0%) for women.
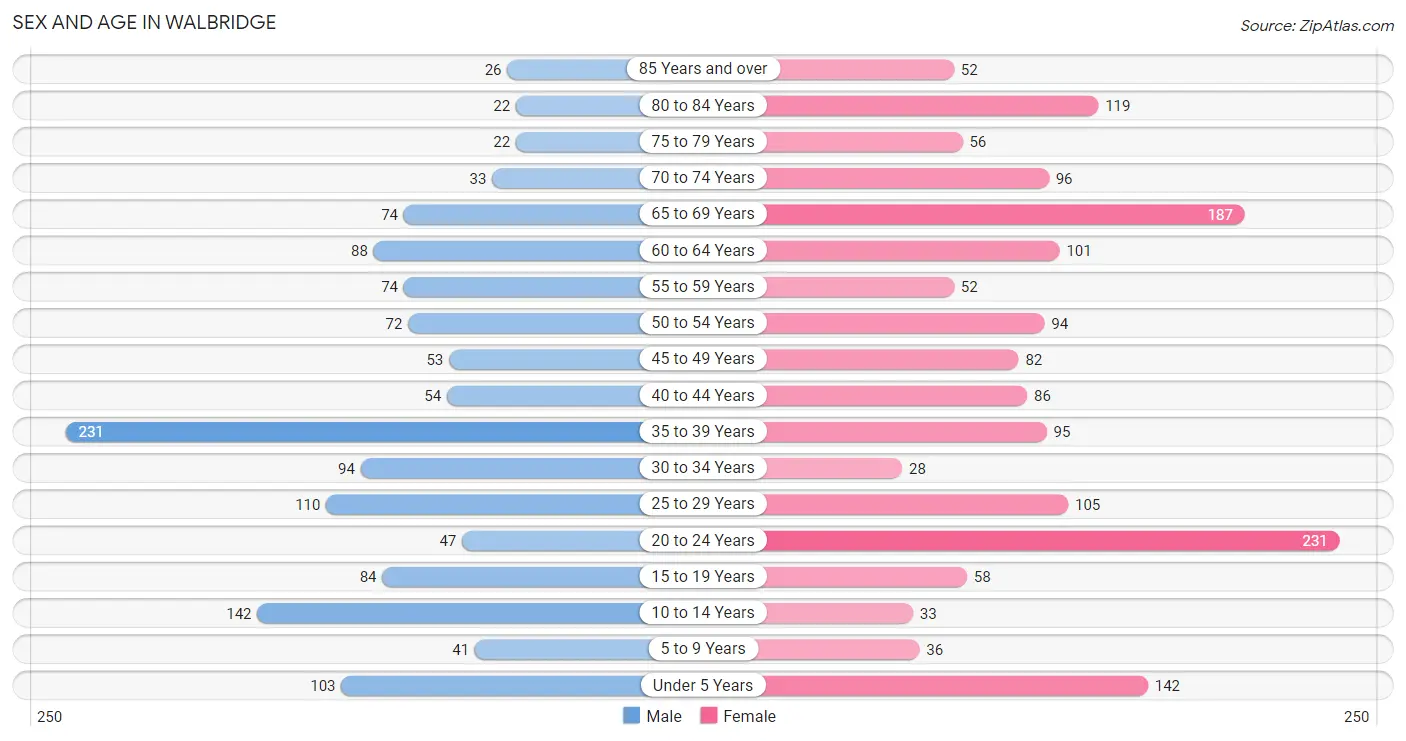
| Age Bracket | Male | Female |
| Under 5 Years | 103 (7.5%) | 142 (8.6%) |
| 5 to 9 Years | 41 (3.0%) | 36 (2.2%) |
| 10 to 14 Years | 142 (10.4%) | 33 (2.0%) |
| 15 to 19 Years | 84 (6.1%) | 58 (3.5%) |
| 20 to 24 Years | 47 (3.4%) | 231 (14.0%) |
| 25 to 29 Years | 110 (8.0%) | 105 (6.4%) |
| 30 to 34 Years | 94 (6.9%) | 28 (1.7%) |
| 35 to 39 Years | 231 (16.9%) | 95 (5.8%) |
| 40 to 44 Years | 54 (3.9%) | 86 (5.2%) |
| 45 to 49 Years | 53 (3.9%) | 82 (5.0%) |
| 50 to 54 Years | 72 (5.3%) | 94 (5.7%) |
| 55 to 59 Years | 74 (5.4%) | 52 (3.2%) |
| 60 to 64 Years | 88 (6.4%) | 101 (6.1%) |
| 65 to 69 Years | 74 (5.4%) | 187 (11.3%) |
| 70 to 74 Years | 33 (2.4%) | 96 (5.8%) |
| 75 to 79 Years | 22 (1.6%) | 56 (3.4%) |
| 80 to 84 Years | 22 (1.6%) | 119 (7.2%) |
| 85 Years and over | 26 (1.9%) | 52 (3.2%) |
| Total | 1,370 (100.0%) | 1,653 (100.0%) |
Families and Households in Walbridge
Median Family Size in Walbridge
The median family size in Walbridge is 3.02 persons per family, with single female/mother families (255 | 37.0%) accounting for the largest median family size of 3.38 persons per family. On the other hand, married-couple families (391 | 56.7%) represent the smallest median family size with 2.75 persons per family.
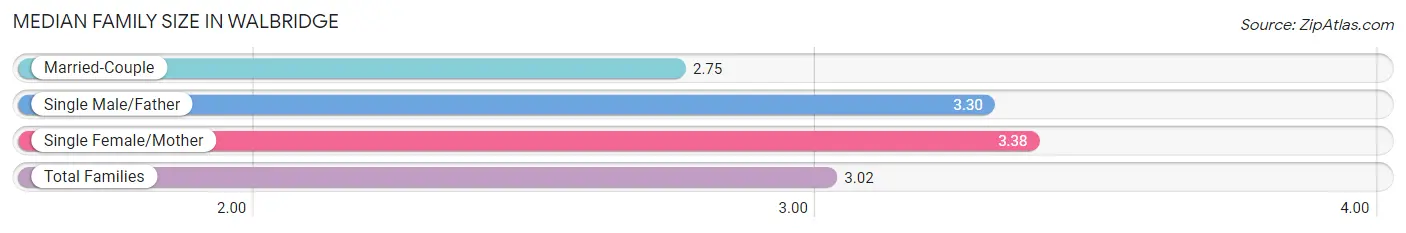
| Family Type | # Families | Family Size |
| Married-Couple | 391 (56.7%) | 2.75 |
| Single Male/Father | 44 (6.4%) | 3.30 |
| Single Female/Mother | 255 (37.0%) | 3.38 |
| Total Families | 690 (100.0%) | 3.02 |
Median Household Size in Walbridge
The median household size in Walbridge is 2.25 persons per household, with single female/mother households (255 | 19.0%) accounting for the largest median household size of 3.9 persons per household. non-family households (649 | 48.5%) represent the smallest median household size with 1.20 persons per household.
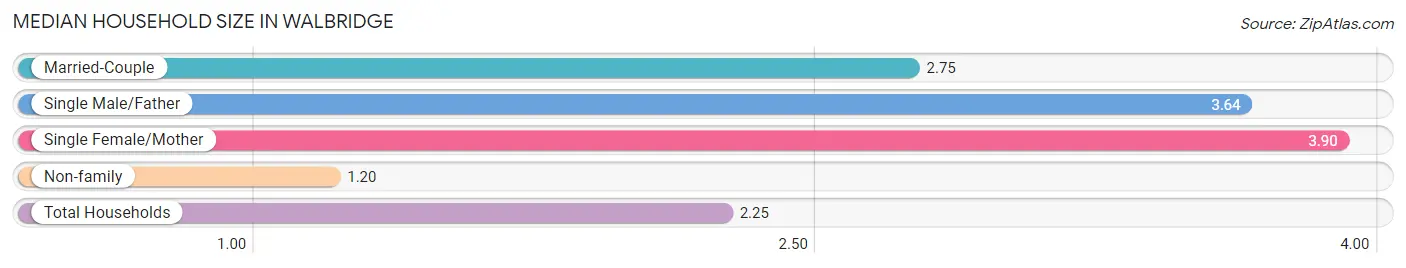
| Household Type | # Households | Household Size |
| Married-Couple | 391 (29.2%) | 2.75 |
| Single Male/Father | 44 (3.3%) | 3.64 |
| Single Female/Mother | 255 (19.0%) | 3.90 |
| Non-family | 649 (48.5%) | 1.20 |
| Total Households | 1,339 (100.0%) | 2.25 |
Household Size by Marriage Status in Walbridge
Out of a total of 1,339 households in Walbridge, 690 (51.5%) are family households, while 649 (48.5%) are nonfamily households. The most numerous type of family households are 2-person households, comprising 291, and the most common type of nonfamily households are 1-person households, comprising 529.
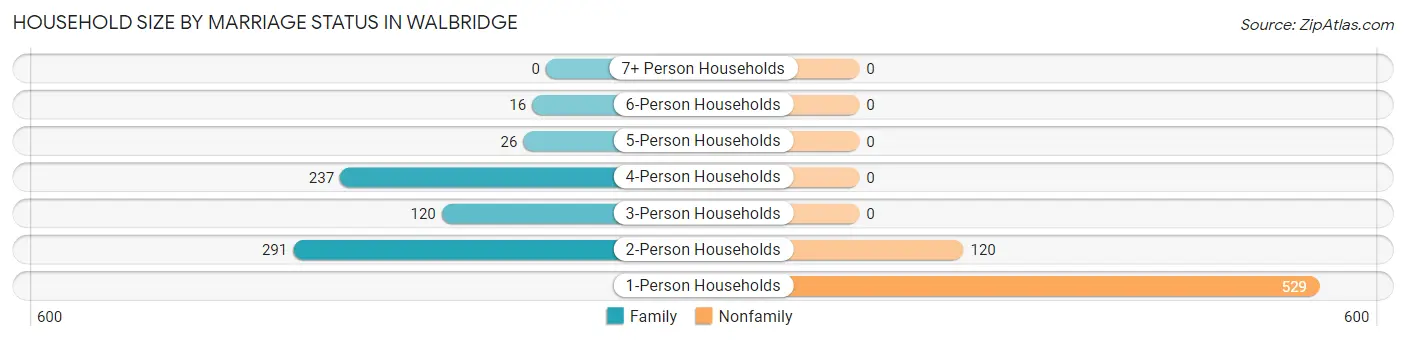
| Household Size | Family Households | Nonfamily Households |
| 1-Person Households | - | 529 (39.5%) |
| 2-Person Households | 291 (21.7%) | 120 (9.0%) |
| 3-Person Households | 120 (9.0%) | 0 (0.0%) |
| 4-Person Households | 237 (17.7%) | 0 (0.0%) |
| 5-Person Households | 26 (1.9%) | 0 (0.0%) |
| 6-Person Households | 16 (1.2%) | 0 (0.0%) |
| 7+ Person Households | 0 (0.0%) | 0 (0.0%) |
| Total | 690 (51.5%) | 649 (48.5%) |
Female Fertility in Walbridge
Fertility by Age in Walbridge
Average fertility rate in Walbridge is 48.0 births per 1,000 women. Women in the age bracket of 20 to 34 years have the highest fertility rate with 91.0 births per 1,000 women. Women in the age bracket of 20 to 34 years acount for 100.0% of all women with births.
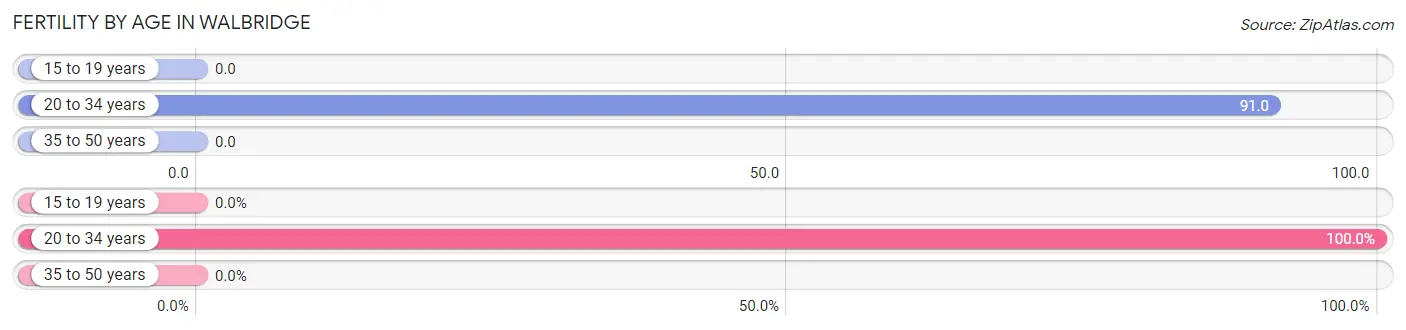
| Age Bracket | Women with Births | Births / 1,000 Women |
| 15 to 19 years | 0 (0.0%) | 0.0 |
| 20 to 34 years | 33 (100.0%) | 91.0 |
| 35 to 50 years | 0 (0.0%) | 0.0 |
| Total | 33 (100.0%) | 48.0 |
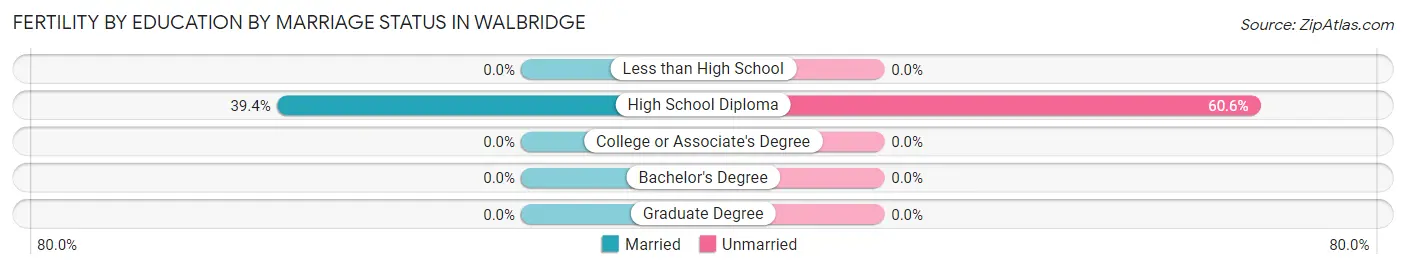
Fertility by Age by Marriage Status in Walbridge
39.4% of women with births (33) in Walbridge are married. The highest percentage of unmarried women with births falls into 20 to 34 years age bracket with 60.6% of them unmarried at the time of birth, while the lowest percentage of unmarried women with births belong to 20 to 34 years age bracket with 60.6% of them unmarried.
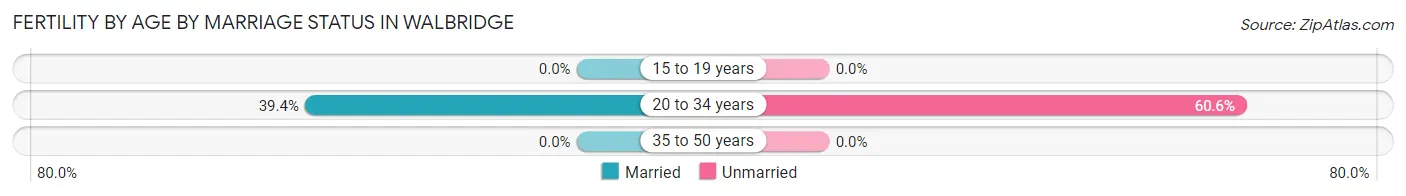
| Age Bracket | Married | Unmarried |
| 15 to 19 years | 0 (0.0%) | 0 (0.0%) |
| 20 to 34 years | 13 (39.4%) | 20 (60.6%) |
| 35 to 50 years | 0 (0.0%) | 0 (0.0%) |
| Total | 13 (39.4%) | 20 (60.6%) |
Fertility by Education in Walbridge
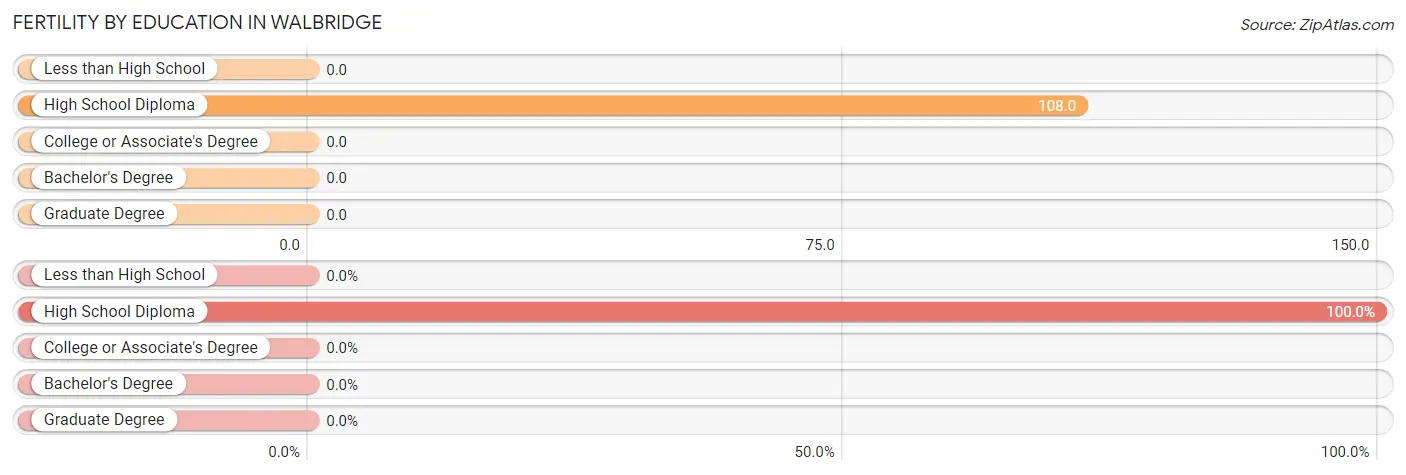
| Educational Attainment | Women with Births | Births / 1,000 Women |
| Less than High School | 0 (0.0%) | 0.0 |
| High School Diploma | 33 (100.0%) | 108.0 |
| College or Associate's Degree | 0 (0.0%) | 0.0 |
| Bachelor's Degree | 0 (0.0%) | 0.0 |
| Graduate Degree | 0 (0.0%) | 0.0 |
| Total | 33 (100.0%) | 48.0 |
Fertility by Education by Marriage Status in Walbridge
60.6% of women with births in Walbridge are unmarried. Women with the educational attainment of high school diploma are most likely to be married with 39.4% of them married at childbirth, while women with the educational attainment of high school diploma are least likely to be married with 60.6% of them unmarried at childbirth.
| Educational Attainment | Married | Unmarried |
| Less than High School | 0 (0.0%) | 0 (0.0%) |
| High School Diploma | 13 (39.4%) | 20 (60.6%) |
| College or Associate's Degree | 0 (0.0%) | 0 (0.0%) |
| Bachelor's Degree | 0 (0.0%) | 0 (0.0%) |
| Graduate Degree | 0 (0.0%) | 0 (0.0%) |
| Total | 13 (39.4%) | 20 (60.6%) |
Employment Characteristics in Walbridge
Employment by Class of Employer in Walbridge
Among the 1,607 employed individuals in Walbridge, private company employees (1,216 | 75.7%), state government employees (116 | 7.2%), and not-for-profit organizations (106 | 6.6%) make up the most common classes of employment.
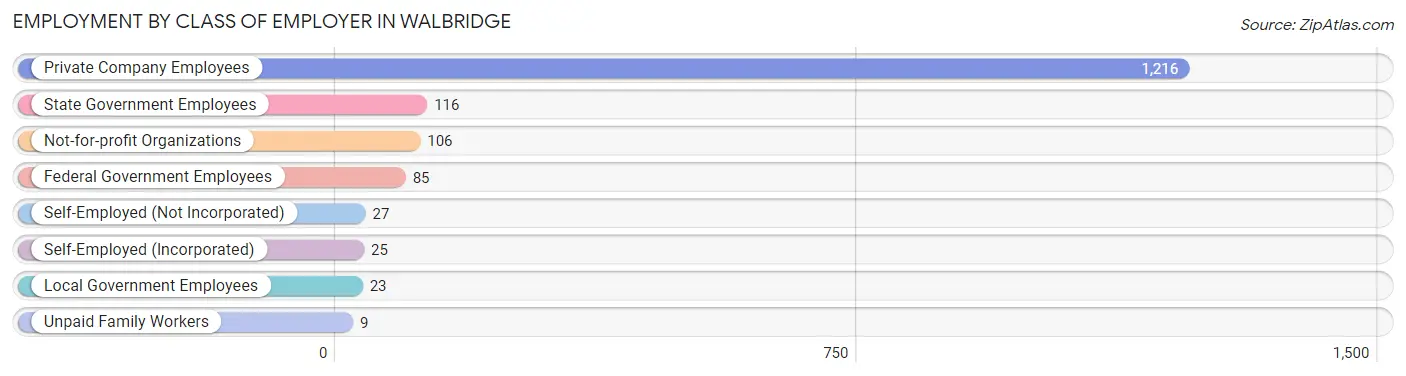
| Employer Class | # Employees | % Employees |
| Private Company Employees | 1,216 | 75.7% |
| Self-Employed (Incorporated) | 25 | 1.6% |
| Self-Employed (Not Incorporated) | 27 | 1.7% |
| Not-for-profit Organizations | 106 | 6.6% |
| Local Government Employees | 23 | 1.4% |
| State Government Employees | 116 | 7.2% |
| Federal Government Employees | 85 | 5.3% |
| Unpaid Family Workers | 9 | 0.6% |
| Total | 1,607 | 100.0% |
Employment Status by Age in Walbridge
According to the labor force statistics for Walbridge, out of the total population over 16 years of age (2,526), 70.5% or 1,781 individuals are in the labor force, with 7.8% or 139 of them unemployed. The age group with the highest labor force participation rate is 35 to 44 years, with 95.5% or 445 individuals in the labor force. Within the labor force, the 30 to 34 years age range has the highest percentage of unemployed individuals, with 21.6% or 25 of them being unemployed.
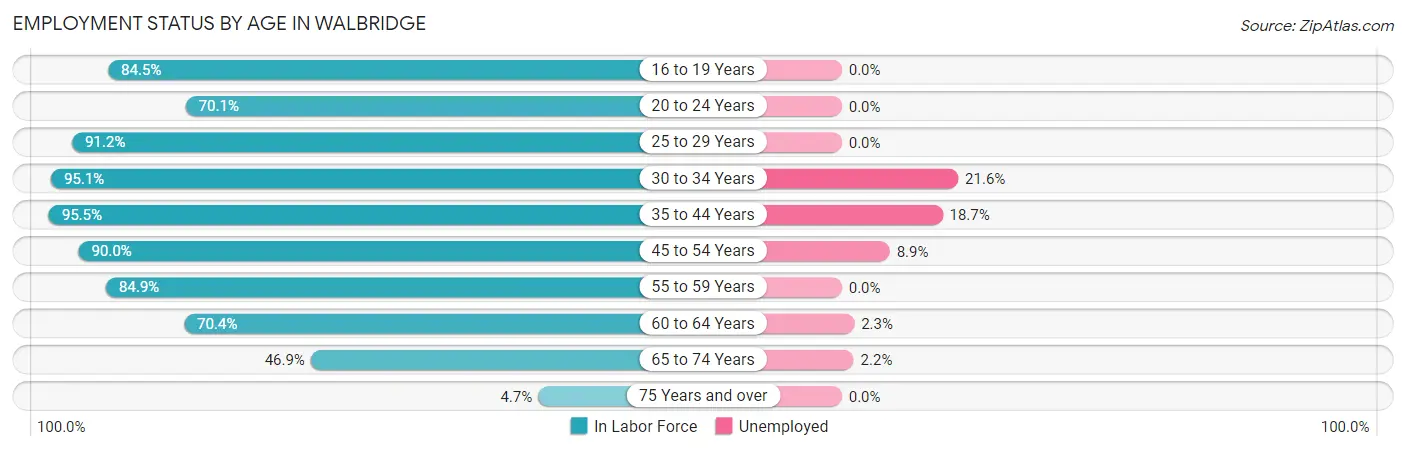
| Age Bracket | In Labor Force | Unemployed |
| 16 to 19 Years | 120 (84.5%) | 0 (0.0%) |
| 20 to 24 Years | 195 (70.1%) | 0 (0.0%) |
| 25 to 29 Years | 196 (91.2%) | 0 (0.0%) |
| 30 to 34 Years | 116 (95.1%) | 25 (21.6%) |
| 35 to 44 Years | 445 (95.5%) | 83 (18.7%) |
| 45 to 54 Years | 271 (90.0%) | 24 (8.9%) |
| 55 to 59 Years | 107 (84.9%) | 0 (0.0%) |
| 60 to 64 Years | 133 (70.4%) | 3 (2.3%) |
| 65 to 74 Years | 183 (46.9%) | 4 (2.2%) |
| 75 Years and over | 14 (4.7%) | 0 (0.0%) |
| Total | 1,781 (70.5%) | 139 (7.8%) |
Employment Status by Educational Attainment in Walbridge
According to labor force statistics for Walbridge, 89.4% of individuals (1,269) out of the total population between 25 and 64 years of age (1,419) are in the labor force, with 10.6% or 135 of them being unemployed. The group with the highest labor force participation rate are those with the educational attainment of bachelor's degree or higher, with 97.3% or 143 individuals in the labor force. Within the labor force, individuals with high school diploma education have the highest percentage of unemployment, with 14.0% or 68 of them being unemployed.
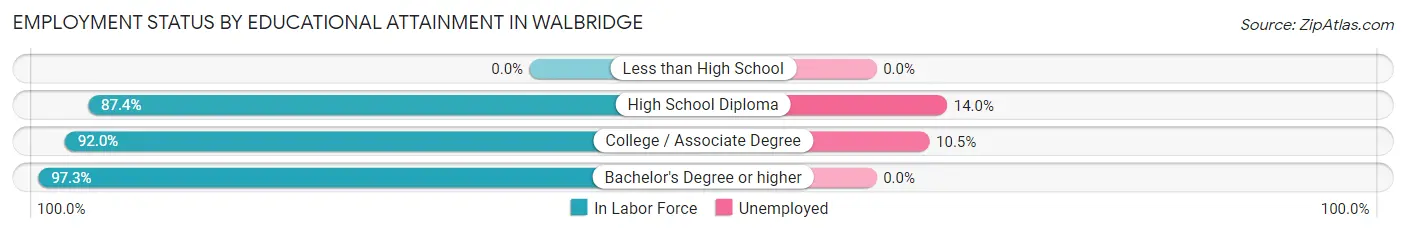
| Educational Attainment | In Labor Force | Unemployed |
| Less than High School | 0 (0.0%) | 0 (0.0%) |
| High School Diploma | 484 (87.4%) | 78 (14.0%) |
| College / Associate Degree | 641 (92.0%) | 73 (10.5%) |
| Bachelor's Degree or higher | 143 (97.3%) | 0 (0.0%) |
| Total | 1,269 (89.4%) | 150 (10.6%) |
Employment Occupations by Sex in Walbridge
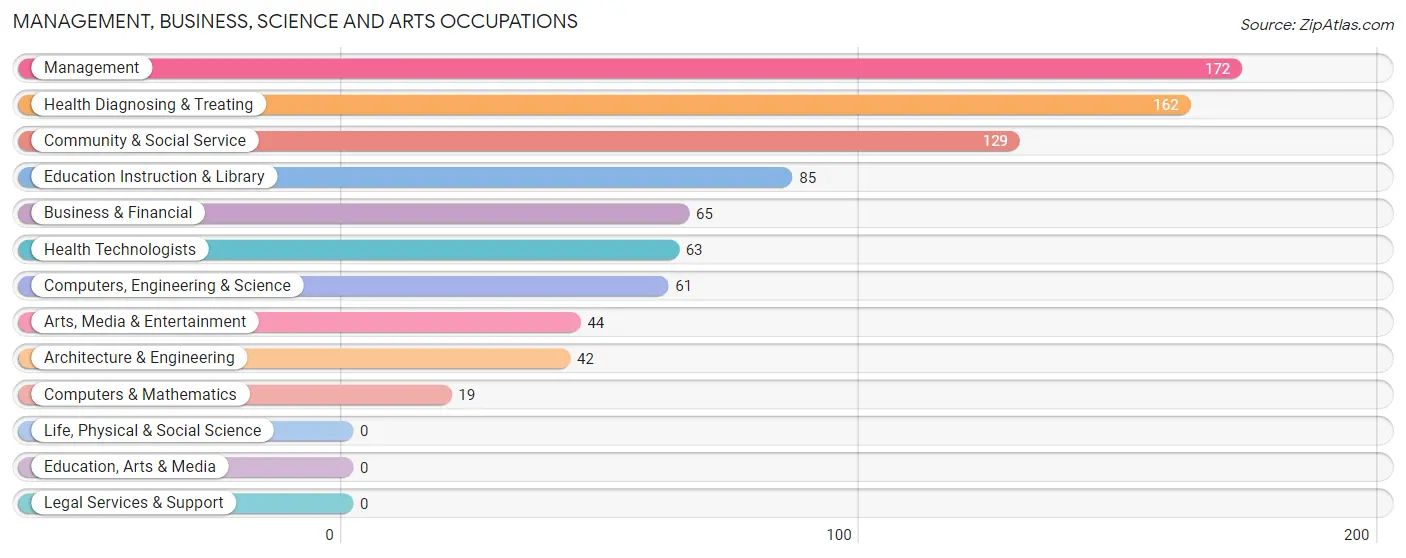
Management, Business, Science and Arts Occupations
The most common Management, Business, Science and Arts occupations in Walbridge are Management (172 | 10.5%), Health Diagnosing & Treating (162 | 9.9%), Community & Social Service (129 | 7.9%), Education Instruction & Library (85 | 5.2%), and Business & Financial (65 | 4.0%).
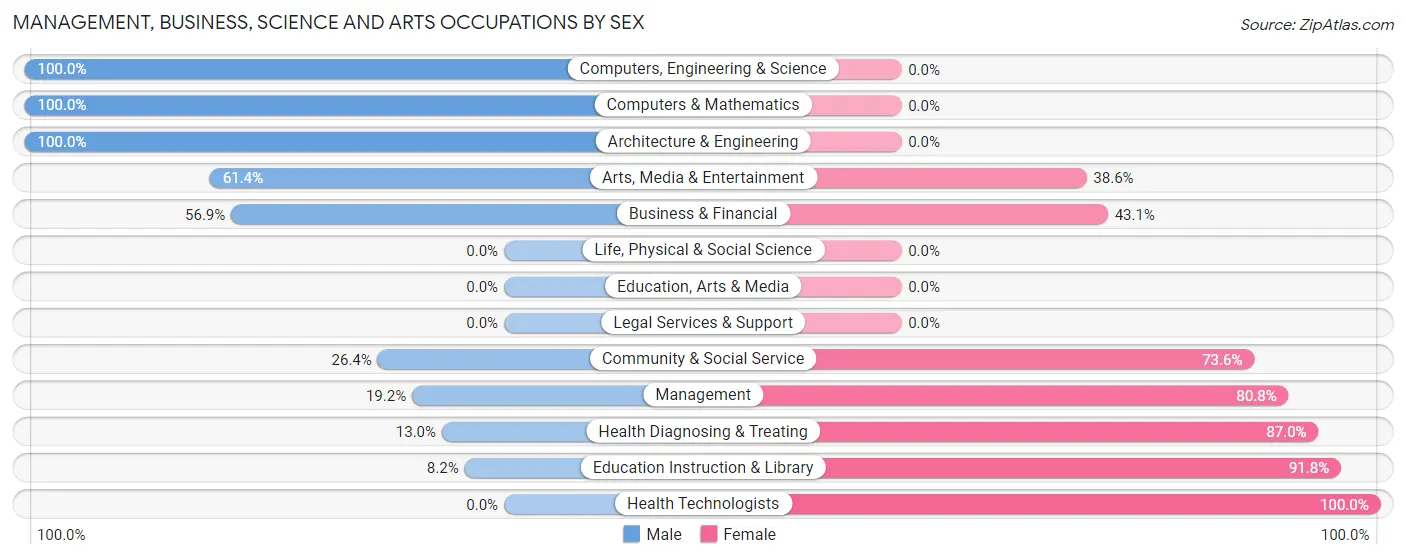
Management, Business, Science and Arts Occupations by Sex
Within the Management, Business, Science and Arts occupations in Walbridge, the most male-oriented occupations are Computers, Engineering & Science (100.0%), Computers & Mathematics (100.0%), and Architecture & Engineering (100.0%), while the most female-oriented occupations are Health Technologists (100.0%), Education Instruction & Library (91.8%), and Health Diagnosing & Treating (87.0%).
| Occupation | Male | Female |
| Management | 33 (19.2%) | 139 (80.8%) |
| Business & Financial | 37 (56.9%) | 28 (43.1%) |
| Computers, Engineering & Science | 61 (100.0%) | 0 (0.0%) |
| Computers & Mathematics | 19 (100.0%) | 0 (0.0%) |
| Architecture & Engineering | 42 (100.0%) | 0 (0.0%) |
| Life, Physical & Social Science | 0 (0.0%) | 0 (0.0%) |
| Community & Social Service | 34 (26.4%) | 95 (73.6%) |
| Education, Arts & Media | 0 (0.0%) | 0 (0.0%) |
| Legal Services & Support | 0 (0.0%) | 0 (0.0%) |
| Education Instruction & Library | 7 (8.2%) | 78 (91.8%) |
| Arts, Media & Entertainment | 27 (61.4%) | 17 (38.6%) |
| Health Diagnosing & Treating | 21 (13.0%) | 141 (87.0%) |
| Health Technologists | 0 (0.0%) | 63 (100.0%) |
| Total (Category) | 186 (31.6%) | 403 (68.4%) |
| Total (Overall) | 811 (49.4%) | 830 (50.6%) |
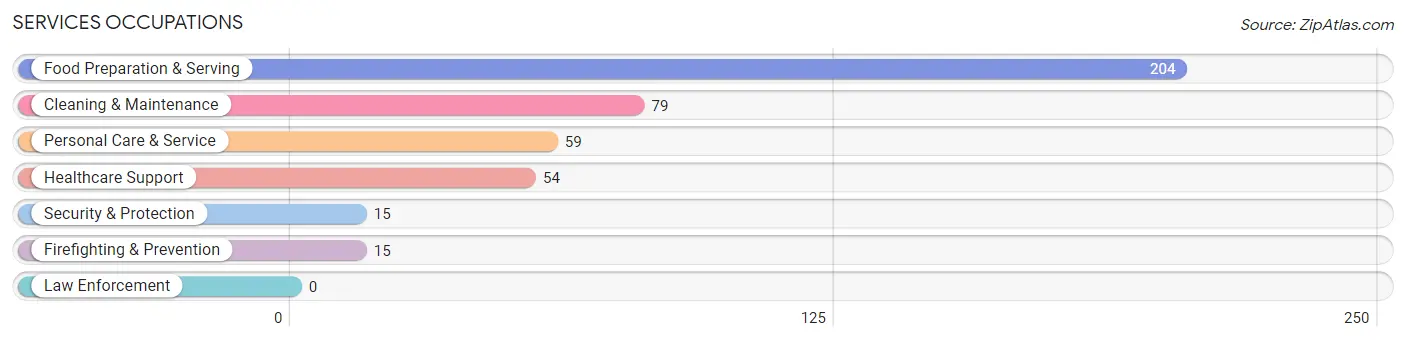
Services Occupations
The most common Services occupations in Walbridge are Food Preparation & Serving (204 | 12.4%), Cleaning & Maintenance (79 | 4.8%), Personal Care & Service (59 | 3.6%), Healthcare Support (54 | 3.3%), and Security & Protection (15 | 0.9%).
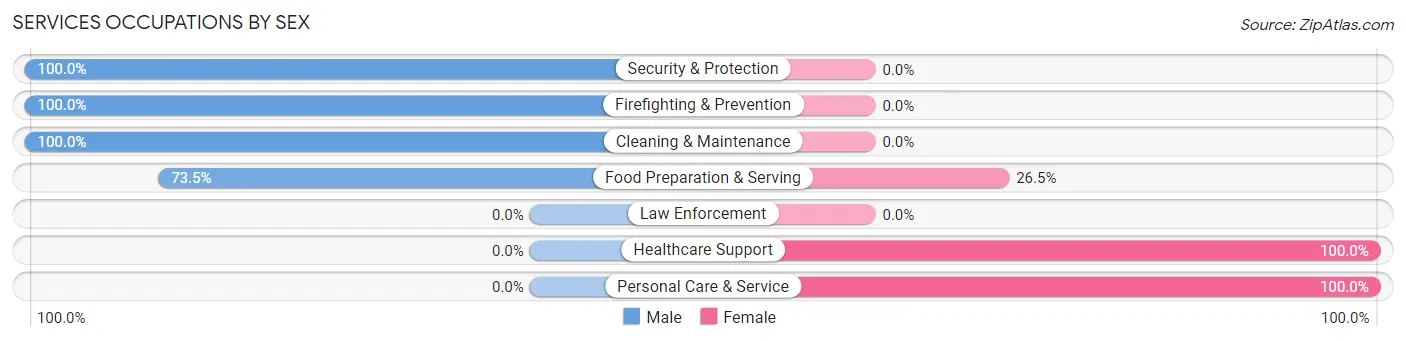
Services Occupations by Sex
Within the Services occupations in Walbridge, the most male-oriented occupations are Security & Protection (100.0%), Firefighting & Prevention (100.0%), and Cleaning & Maintenance (100.0%), while the most female-oriented occupations are Healthcare Support (100.0%), Personal Care & Service (100.0%), and Food Preparation & Serving (26.5%).
| Occupation | Male | Female |
| Healthcare Support | 0 (0.0%) | 54 (100.0%) |
| Security & Protection | 15 (100.0%) | 0 (0.0%) |
| Firefighting & Prevention | 15 (100.0%) | 0 (0.0%) |
| Law Enforcement | 0 (0.0%) | 0 (0.0%) |
| Food Preparation & Serving | 150 (73.5%) | 54 (26.5%) |
| Cleaning & Maintenance | 79 (100.0%) | 0 (0.0%) |
| Personal Care & Service | 0 (0.0%) | 59 (100.0%) |
| Total (Category) | 244 (59.4%) | 167 (40.6%) |
| Total (Overall) | 811 (49.4%) | 830 (50.6%) |
Sales and Office Occupations
The most common Sales and Office occupations in Walbridge are Office & Administration (208 | 12.7%), and Sales & Related (113 | 6.9%).

Sales and Office Occupations by Sex

| Occupation | Male | Female |
| Sales & Related | 87 (77.0%) | 26 (23.0%) |
| Office & Administration | 21 (10.1%) | 187 (89.9%) |
| Total (Category) | 108 (33.6%) | 213 (66.4%) |
| Total (Overall) | 811 (49.4%) | 830 (50.6%) |
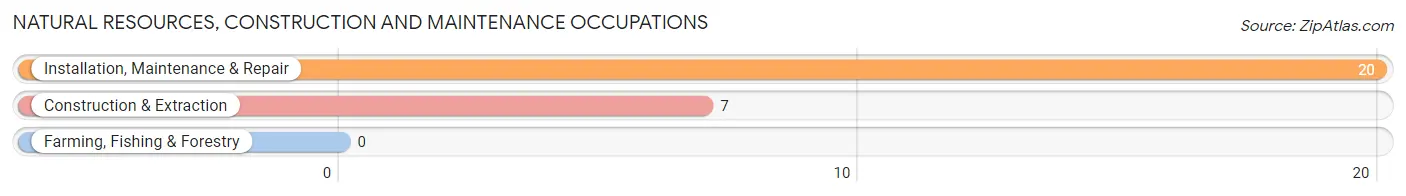
Natural Resources, Construction and Maintenance Occupations
The most common Natural Resources, Construction and Maintenance occupations in Walbridge are Installation, Maintenance & Repair (20 | 1.2%), and Construction & Extraction (7 | 0.4%).
Natural Resources, Construction and Maintenance Occupations by Sex
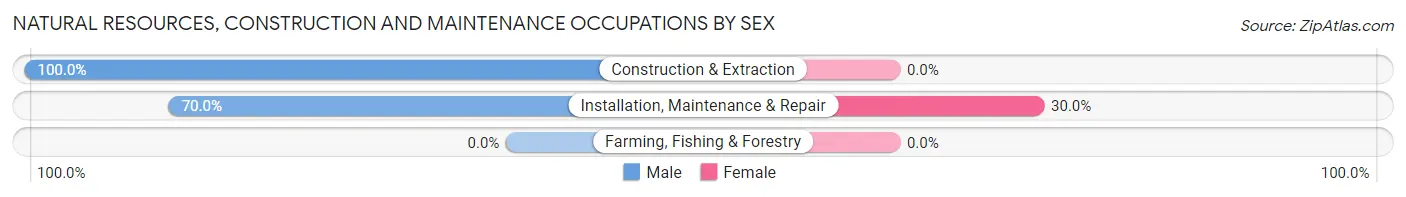
| Occupation | Male | Female |
| Farming, Fishing & Forestry | 0 (0.0%) | 0 (0.0%) |
| Construction & Extraction | 7 (100.0%) | 0 (0.0%) |
| Installation, Maintenance & Repair | 14 (70.0%) | 6 (30.0%) |
| Total (Category) | 21 (77.8%) | 6 (22.2%) |
| Total (Overall) | 811 (49.4%) | 830 (50.6%) |
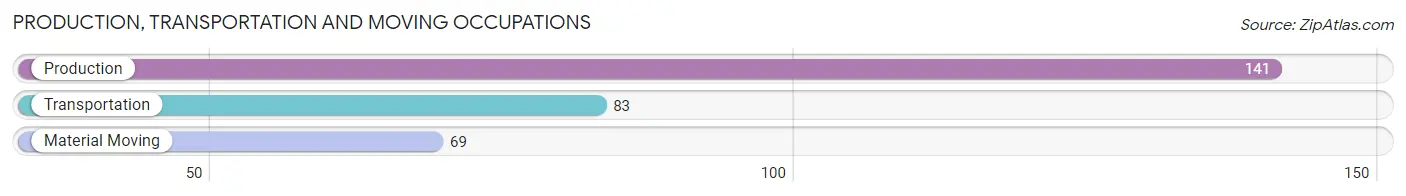
Production, Transportation and Moving Occupations
The most common Production, Transportation and Moving occupations in Walbridge are Production (141 | 8.6%), Transportation (83 | 5.1%), and Material Moving (69 | 4.2%).
Production, Transportation and Moving Occupations by Sex
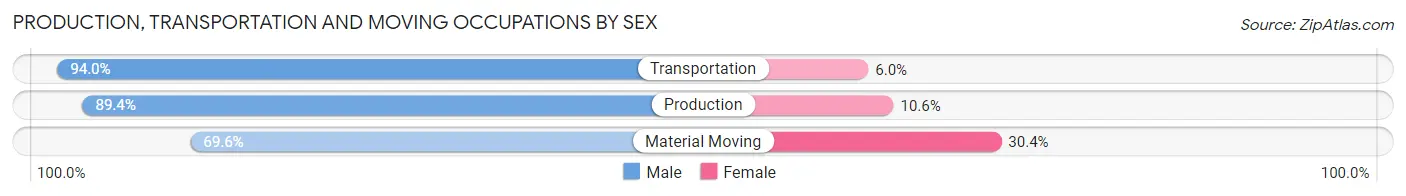
| Occupation | Male | Female |
| Production | 126 (89.4%) | 15 (10.6%) |
| Transportation | 78 (94.0%) | 5 (6.0%) |
| Material Moving | 48 (69.6%) | 21 (30.4%) |
| Total (Category) | 252 (86.0%) | 41 (14.0%) |
| Total (Overall) | 811 (49.4%) | 830 (50.6%) |
Employment Industries by Sex in Walbridge
Employment Industries in Walbridge
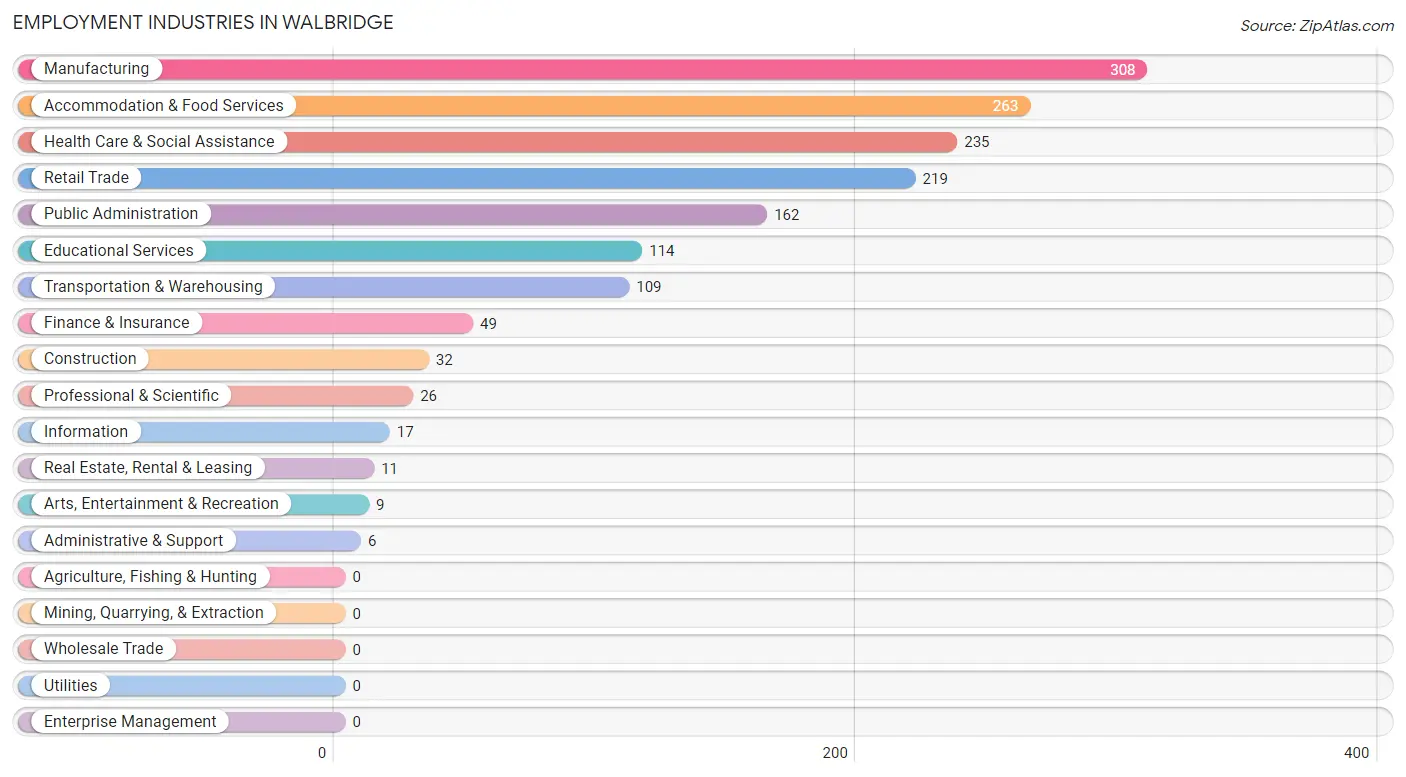
The major employment industries in Walbridge include Manufacturing (308 | 18.8%), Accommodation & Food Services (263 | 16.0%), Health Care & Social Assistance (235 | 14.3%), Retail Trade (219 | 13.4%), and Public Administration (162 | 9.9%).
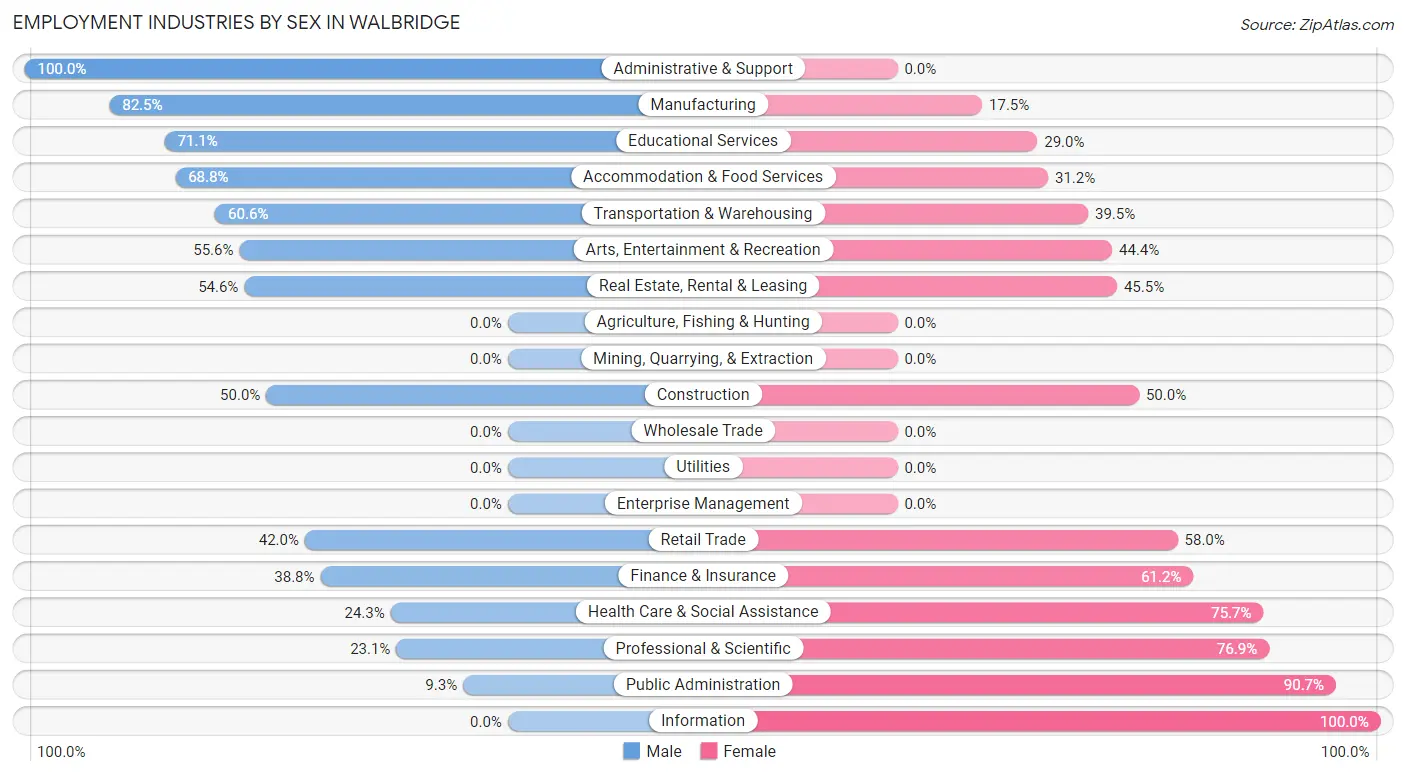
Employment Industries by Sex in Walbridge
The Walbridge industries that see more men than women are Administrative & Support (100.0%), Manufacturing (82.5%), and Educational Services (71.1%), whereas the industries that tend to have a higher number of women are Information (100.0%), Public Administration (90.7%), and Professional & Scientific (76.9%).
| Industry | Male | Female |
| Agriculture, Fishing & Hunting | 0 (0.0%) | 0 (0.0%) |
| Mining, Quarrying, & Extraction | 0 (0.0%) | 0 (0.0%) |
| Construction | 16 (50.0%) | 16 (50.0%) |
| Manufacturing | 254 (82.5%) | 54 (17.5%) |
| Wholesale Trade | 0 (0.0%) | 0 (0.0%) |
| Retail Trade | 92 (42.0%) | 127 (58.0%) |
| Transportation & Warehousing | 66 (60.6%) | 43 (39.5%) |
| Utilities | 0 (0.0%) | 0 (0.0%) |
| Information | 0 (0.0%) | 17 (100.0%) |
| Finance & Insurance | 19 (38.8%) | 30 (61.2%) |
| Real Estate, Rental & Leasing | 6 (54.5%) | 5 (45.5%) |
| Professional & Scientific | 6 (23.1%) | 20 (76.9%) |
| Enterprise Management | 0 (0.0%) | 0 (0.0%) |
| Administrative & Support | 6 (100.0%) | 0 (0.0%) |
| Educational Services | 81 (71.1%) | 33 (28.9%) |
| Health Care & Social Assistance | 57 (24.3%) | 178 (75.7%) |
| Arts, Entertainment & Recreation | 5 (55.6%) | 4 (44.4%) |
| Accommodation & Food Services | 181 (68.8%) | 82 (31.2%) |
| Public Administration | 15 (9.3%) | 147 (90.7%) |
| Total | 811 (49.4%) | 830 (50.6%) |
Education in Walbridge
School Enrollment in Walbridge
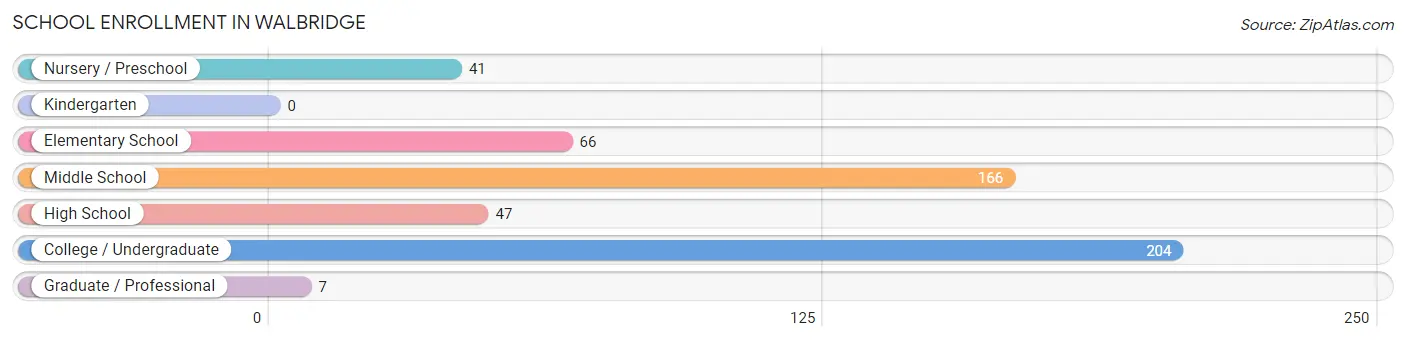
The most common levels of schooling among the 531 students in Walbridge are college / undergraduate (204 | 38.4%), middle school (166 | 31.3%), and elementary school (66 | 12.4%).
| School Level | # Students | % Students |
| Nursery / Preschool | 41 | 7.7% |
| Kindergarten | 0 | 0.0% |
| Elementary School | 66 | 12.4% |
| Middle School | 166 | 31.3% |
| High School | 47 | 8.8% |
| College / Undergraduate | 204 | 38.4% |
| Graduate / Professional | 7 | 1.3% |
| Total | 531 | 100.0% |
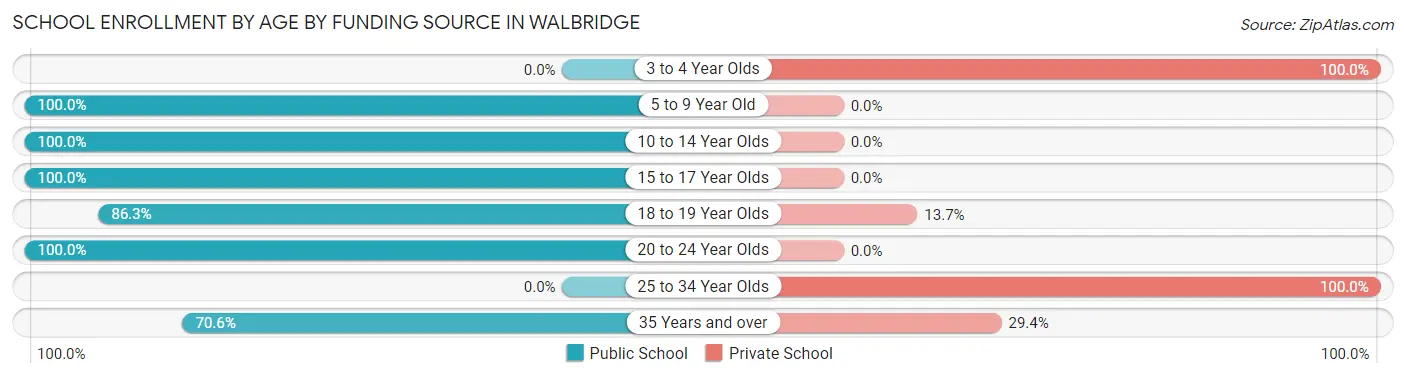
School Enrollment by Age by Funding Source in Walbridge
Out of a total of 531 students who are enrolled in schools in Walbridge, 70 (13.2%) attend a private institution, while the remaining 461 (86.8%) are enrolled in public schools. The age group of 3 to 4 year olds has the highest likelihood of being enrolled in private schools, with 41 (100.0% in the age bracket) enrolled. Conversely, the age group of 5 to 9 year old has the lowest likelihood of being enrolled in a private school, with 66 (100.0% in the age bracket) attending a public institution.
| Age Bracket | Public School | Private School |
| 3 to 4 Year Olds | 0 (0.0%) | 41 (100.0%) |
| 5 to 9 Year Old | 66 (100.0%) | 0 (0.0%) |
| 10 to 14 Year Olds | 163 (100.0%) | 0 (0.0%) |
| 15 to 17 Year Olds | 24 (100.0%) | 0 (0.0%) |
| 18 to 19 Year Olds | 44 (86.3%) | 7 (13.7%) |
| 20 to 24 Year Olds | 128 (100.0%) | 0 (0.0%) |
| 25 to 34 Year Olds | 0 (0.0%) | 7 (100.0%) |
| 35 Years and over | 36 (70.6%) | 15 (29.4%) |
| Total | 461 (86.8%) | 70 (13.2%) |
Educational Attainment by Field of Study in Walbridge
Education (114 | 39.2%), business (74 | 25.4%), arts & humanities (28 | 9.6%), science & technology (25 | 8.6%), and social sciences (18 | 6.2%) are the most common fields of study among 291 individuals in Walbridge who have obtained a bachelor's degree or higher.
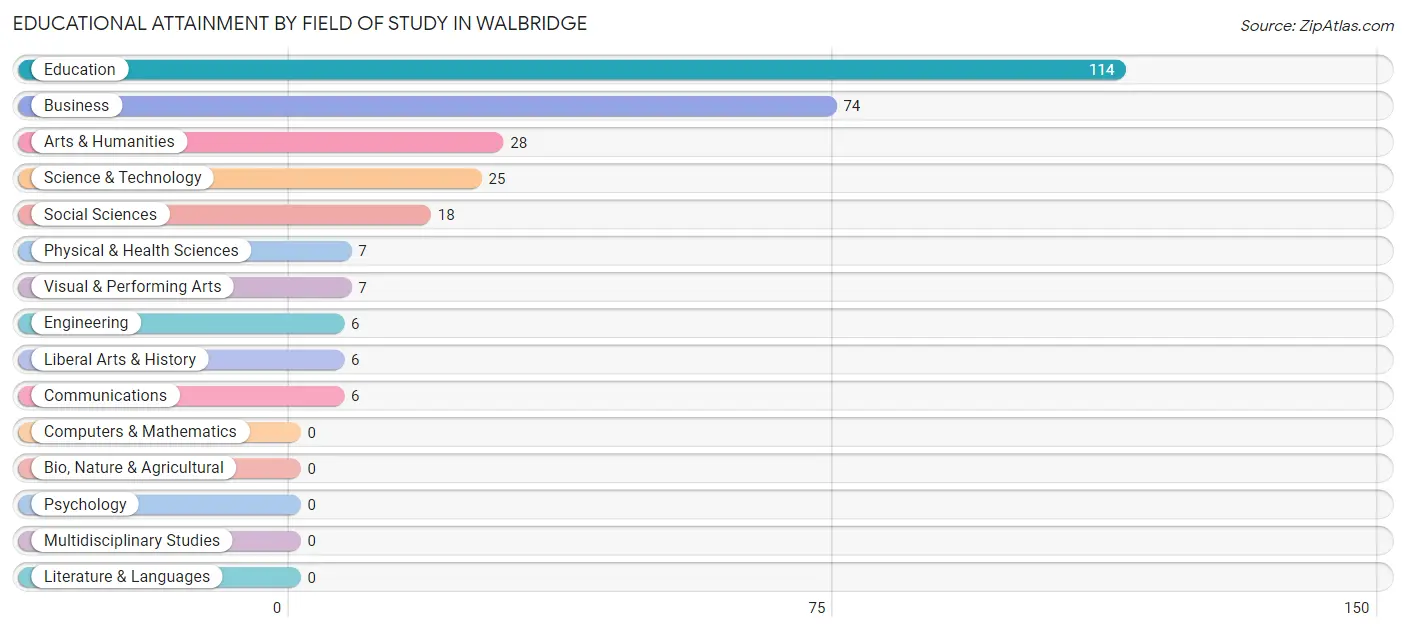
| Field of Study | # Graduates | % Graduates |
| Computers & Mathematics | 0 | 0.0% |
| Bio, Nature & Agricultural | 0 | 0.0% |
| Physical & Health Sciences | 7 | 2.4% |
| Psychology | 0 | 0.0% |
| Social Sciences | 18 | 6.2% |
| Engineering | 6 | 2.1% |
| Multidisciplinary Studies | 0 | 0.0% |
| Science & Technology | 25 | 8.6% |
| Business | 74 | 25.4% |
| Education | 114 | 39.2% |
| Literature & Languages | 0 | 0.0% |
| Liberal Arts & History | 6 | 2.1% |
| Visual & Performing Arts | 7 | 2.4% |
| Communications | 6 | 2.1% |
| Arts & Humanities | 28 | 9.6% |
| Total | 291 | 100.0% |
Transportation & Commute in Walbridge
Vehicle Availability by Sex in Walbridge
The most prevalent vehicle ownership categories in Walbridge are males with 2 vehicles (370, accounting for 46.0%) and females with 2 vehicles (422, making up 46.1%).
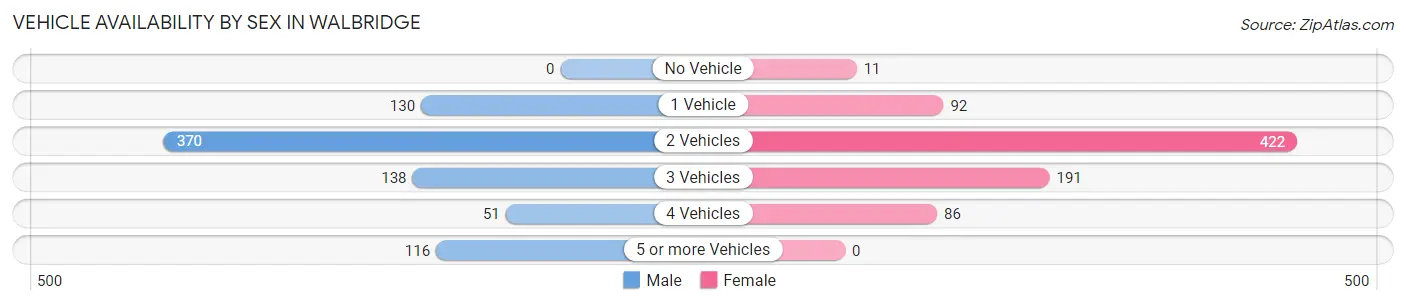
| Vehicles Available | Male | Female |
| No Vehicle | 0 (0.0%) | 11 (1.4%) |
| 1 Vehicle | 130 (16.2%) | 92 (11.5%) |
| 2 Vehicles | 370 (46.0%) | 422 (52.6%) |
| 3 Vehicles | 138 (17.1%) | 191 (23.8%) |
| 4 Vehicles | 51 (6.3%) | 86 (10.7%) |
| 5 or more Vehicles | 116 (14.4%) | 0 (0.0%) |
| Total | 805 (100.0%) | 802 (100.0%) |
Commute Time in Walbridge
The most frequently occuring commute durations in Walbridge are 10 to 14 minutes (315 commuters, 20.0%), 5 to 9 minutes (265 commuters, 16.8%), and 20 to 24 minutes (237 commuters, 15.0%).
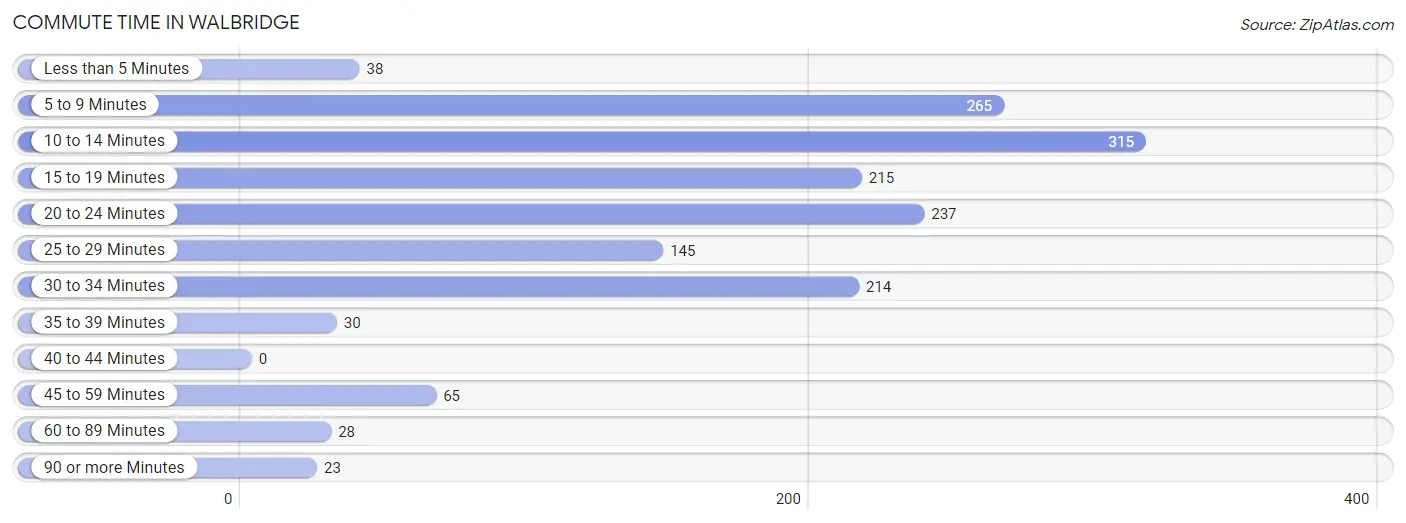
| Commute Time | # Commuters | % Commuters |
| Less than 5 Minutes | 38 | 2.4% |
| 5 to 9 Minutes | 265 | 16.8% |
| 10 to 14 Minutes | 315 | 20.0% |
| 15 to 19 Minutes | 215 | 13.7% |
| 20 to 24 Minutes | 237 | 15.0% |
| 25 to 29 Minutes | 145 | 9.2% |
| 30 to 34 Minutes | 214 | 13.6% |
| 35 to 39 Minutes | 30 | 1.9% |
| 40 to 44 Minutes | 0 | 0.0% |
| 45 to 59 Minutes | 65 | 4.1% |
| 60 to 89 Minutes | 28 | 1.8% |
| 90 or more Minutes | 23 | 1.5% |
Commute Time by Sex in Walbridge
The most common commute times in Walbridge are 5 to 9 minutes (173 commuters, 21.9%) for males and 10 to 14 minutes (202 commuters, 25.7%) for females.
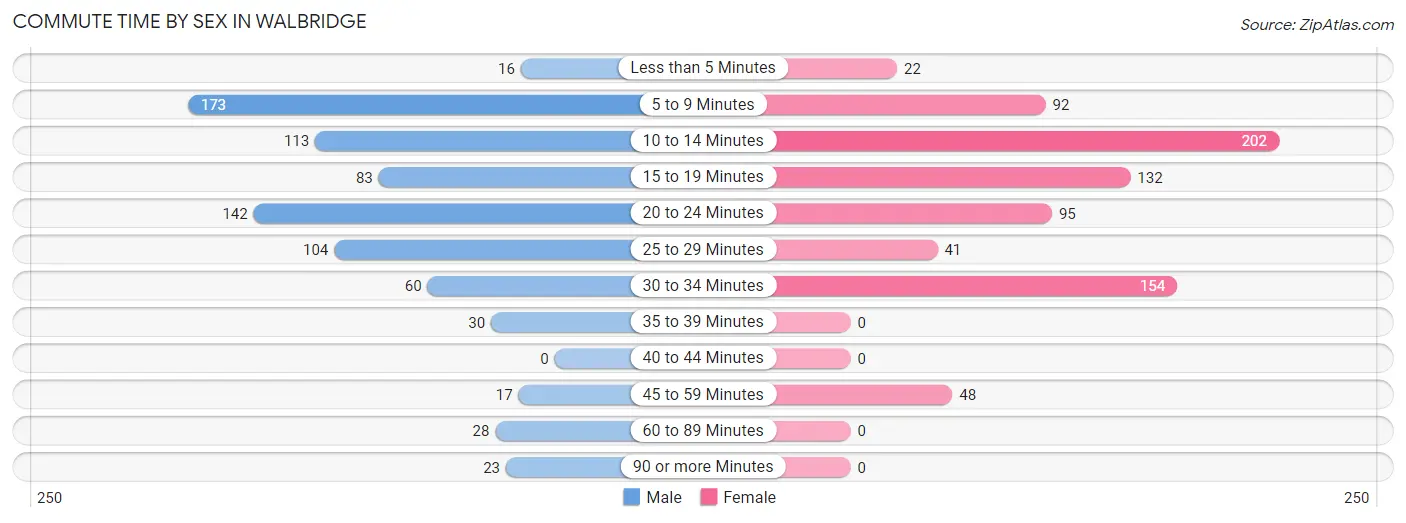
| Commute Time | Male | Female |
| Less than 5 Minutes | 16 (2.0%) | 22 (2.8%) |
| 5 to 9 Minutes | 173 (21.9%) | 92 (11.7%) |
| 10 to 14 Minutes | 113 (14.3%) | 202 (25.7%) |
| 15 to 19 Minutes | 83 (10.5%) | 132 (16.8%) |
| 20 to 24 Minutes | 142 (18.0%) | 95 (12.1%) |
| 25 to 29 Minutes | 104 (13.2%) | 41 (5.2%) |
| 30 to 34 Minutes | 60 (7.6%) | 154 (19.6%) |
| 35 to 39 Minutes | 30 (3.8%) | 0 (0.0%) |
| 40 to 44 Minutes | 0 (0.0%) | 0 (0.0%) |
| 45 to 59 Minutes | 17 (2.1%) | 48 (6.1%) |
| 60 to 89 Minutes | 28 (3.5%) | 0 (0.0%) |
| 90 or more Minutes | 23 (2.9%) | 0 (0.0%) |
Time of Departure to Work by Sex in Walbridge
The most frequent times of departure to work in Walbridge are 5:30 AM to 5:59 AM (155, 19.7%) for males and 8:00 AM to 8:29 AM (163, 20.7%) for females.
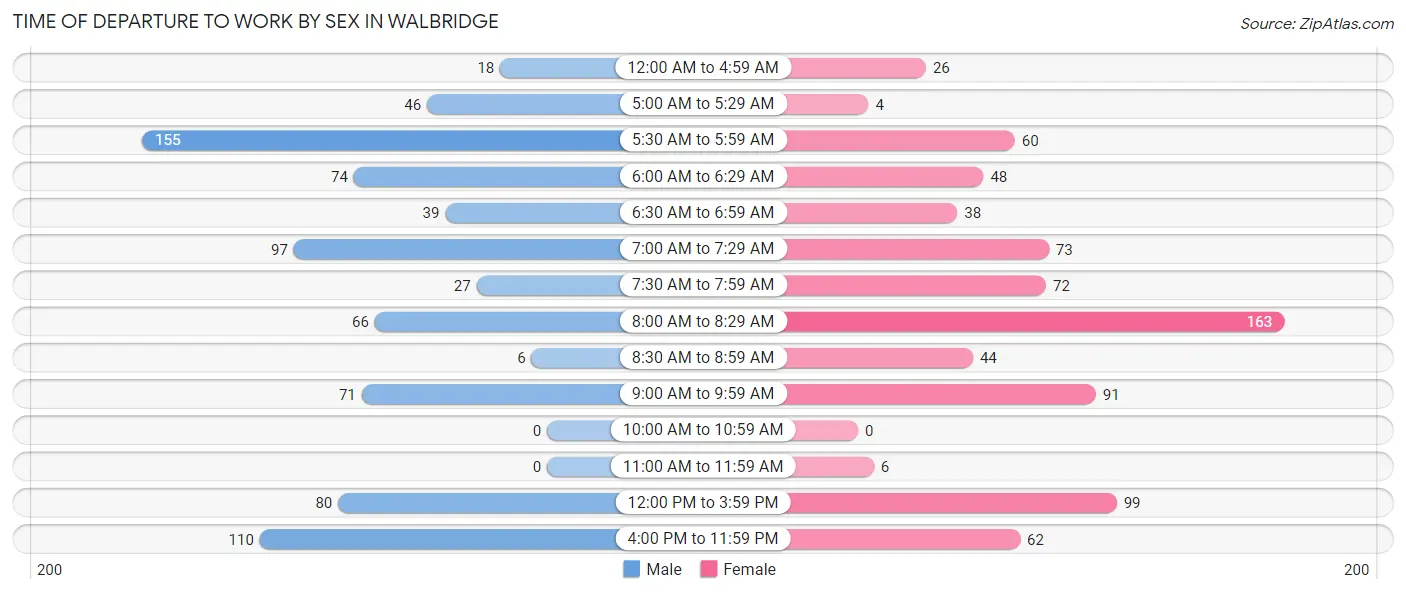
| Time of Departure | Male | Female |
| 12:00 AM to 4:59 AM | 18 (2.3%) | 26 (3.3%) |
| 5:00 AM to 5:29 AM | 46 (5.8%) | 4 (0.5%) |
| 5:30 AM to 5:59 AM | 155 (19.7%) | 60 (7.6%) |
| 6:00 AM to 6:29 AM | 74 (9.4%) | 48 (6.1%) |
| 6:30 AM to 6:59 AM | 39 (4.9%) | 38 (4.8%) |
| 7:00 AM to 7:29 AM | 97 (12.3%) | 73 (9.3%) |
| 7:30 AM to 7:59 AM | 27 (3.4%) | 72 (9.2%) |
| 8:00 AM to 8:29 AM | 66 (8.4%) | 163 (20.7%) |
| 8:30 AM to 8:59 AM | 6 (0.8%) | 44 (5.6%) |
| 9:00 AM to 9:59 AM | 71 (9.0%) | 91 (11.6%) |
| 10:00 AM to 10:59 AM | 0 (0.0%) | 0 (0.0%) |
| 11:00 AM to 11:59 AM | 0 (0.0%) | 6 (0.8%) |
| 12:00 PM to 3:59 PM | 80 (10.1%) | 99 (12.6%) |
| 4:00 PM to 11:59 PM | 110 (13.9%) | 62 (7.9%) |
| Total | 789 (100.0%) | 786 (100.0%) |
Housing Occupancy in Walbridge
Occupancy by Ownership in Walbridge
Of the total 1,339 dwellings in Walbridge, owner-occupied units account for 927 (69.2%), while renter-occupied units make up 412 (30.8%).
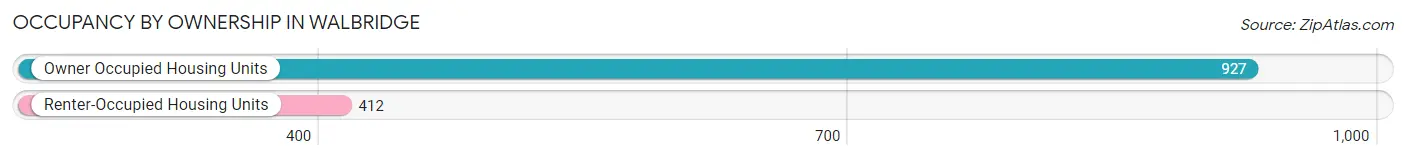
| Occupancy | # Housing Units | % Housing Units |
| Owner Occupied Housing Units | 927 | 69.2% |
| Renter-Occupied Housing Units | 412 | 30.8% |
| Total Occupied Housing Units | 1,339 | 100.0% |
Occupancy by Household Size in Walbridge
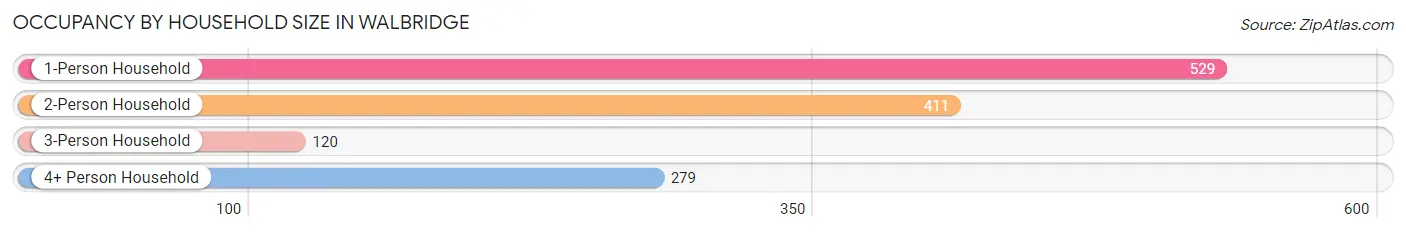
| Household Size | # Housing Units | % Housing Units |
| 1-Person Household | 529 | 39.5% |
| 2-Person Household | 411 | 30.7% |
| 3-Person Household | 120 | 9.0% |
| 4+ Person Household | 279 | 20.8% |
| Total Housing Units | 1,339 | 100.0% |
Occupancy by Ownership by Household Size in Walbridge
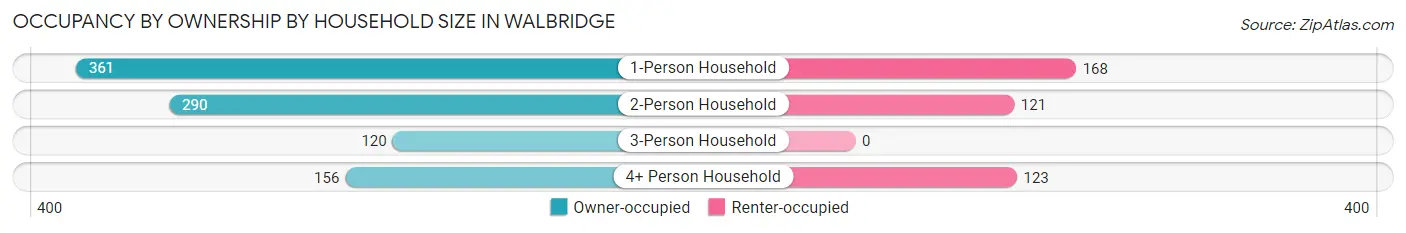
| Household Size | Owner-occupied | Renter-occupied |
| 1-Person Household | 361 (68.2%) | 168 (31.8%) |
| 2-Person Household | 290 (70.6%) | 121 (29.4%) |
| 3-Person Household | 120 (100.0%) | 0 (0.0%) |
| 4+ Person Household | 156 (55.9%) | 123 (44.1%) |
| Total Housing Units | 927 (69.2%) | 412 (30.8%) |
Occupancy by Educational Attainment in Walbridge
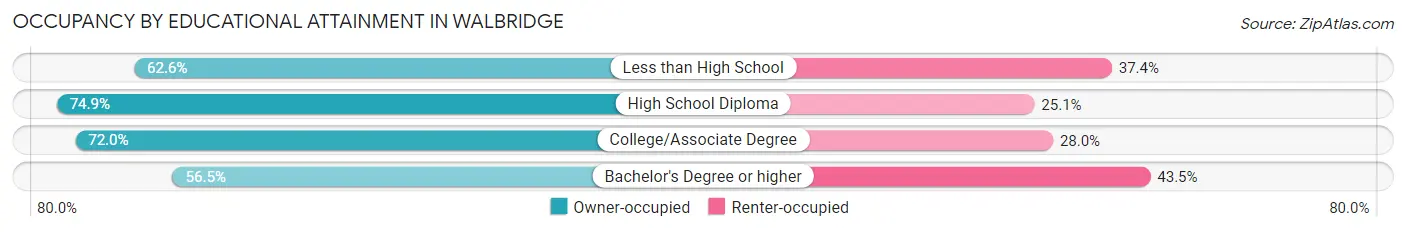
| Household Size | Owner-occupied | Renter-occupied |
| Less than High School | 62 (62.6%) | 37 (37.4%) |
| High School Diploma | 364 (74.9%) | 122 (25.1%) |
| College/Associate Degree | 349 (72.0%) | 136 (28.0%) |
| Bachelor's Degree or higher | 152 (56.5%) | 117 (43.5%) |
Occupancy by Age of Householder in Walbridge
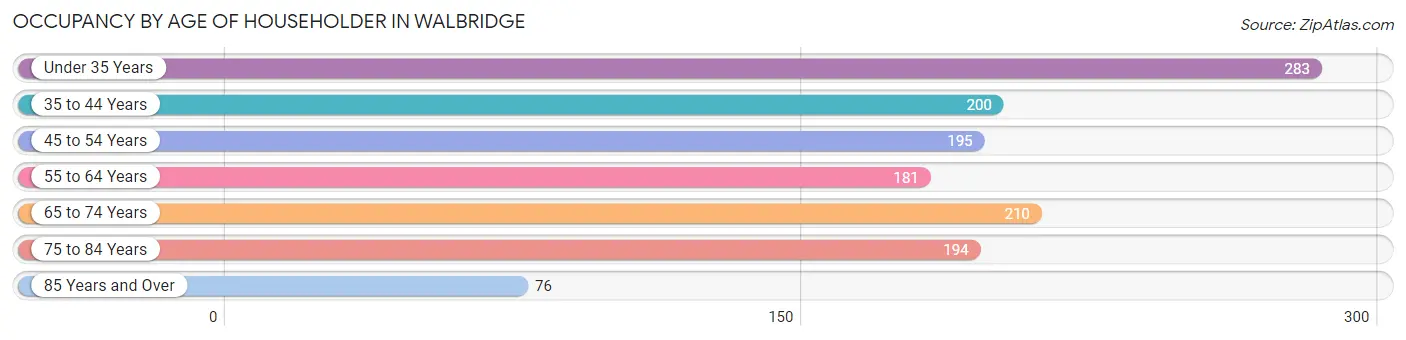
| Age Bracket | # Households | % Households |
| Under 35 Years | 283 | 21.1% |
| 35 to 44 Years | 200 | 14.9% |
| 45 to 54 Years | 195 | 14.6% |
| 55 to 64 Years | 181 | 13.5% |
| 65 to 74 Years | 210 | 15.7% |
| 75 to 84 Years | 194 | 14.5% |
| 85 Years and Over | 76 | 5.7% |
| Total | 1,339 | 100.0% |
Housing Finances in Walbridge
Median Income by Occupancy in Walbridge
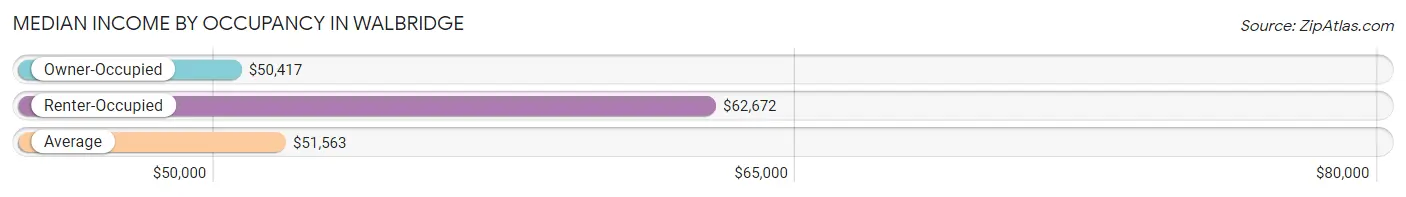
| Occupancy Type | # Households | Median Income |
| Owner-Occupied | 927 (69.2%) | $50,417 |
| Renter-Occupied | 412 (30.8%) | $62,672 |
| Average | 1,339 (100.0%) | $51,563 |
Occupancy by Householder Income Bracket in Walbridge
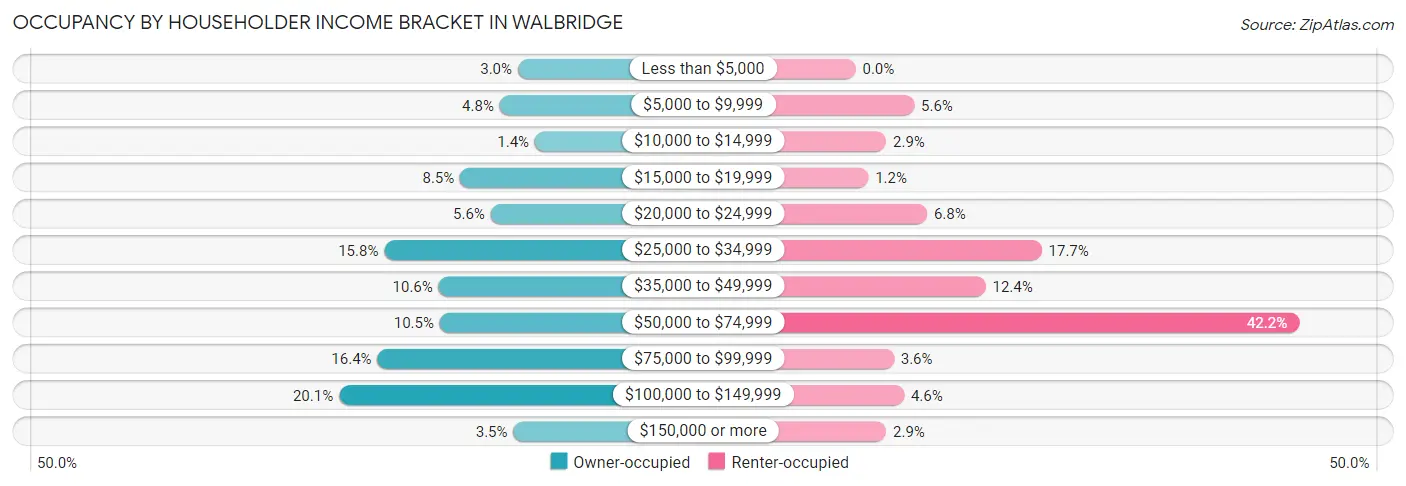
| Income Bracket | Owner-occupied | Renter-occupied |
| Less than $5,000 | 28 (3.0%) | 0 (0.0%) |
| $5,000 to $9,999 | 44 (4.8%) | 23 (5.6%) |
| $10,000 to $14,999 | 13 (1.4%) | 12 (2.9%) |
| $15,000 to $19,999 | 79 (8.5%) | 5 (1.2%) |
| $20,000 to $24,999 | 52 (5.6%) | 28 (6.8%) |
| $25,000 to $34,999 | 146 (15.8%) | 73 (17.7%) |
| $35,000 to $49,999 | 98 (10.6%) | 51 (12.4%) |
| $50,000 to $74,999 | 97 (10.5%) | 174 (42.2%) |
| $75,000 to $99,999 | 152 (16.4%) | 15 (3.6%) |
| $100,000 to $149,999 | 186 (20.1%) | 19 (4.6%) |
| $150,000 or more | 32 (3.5%) | 12 (2.9%) |
| Total | 927 (100.0%) | 412 (100.0%) |
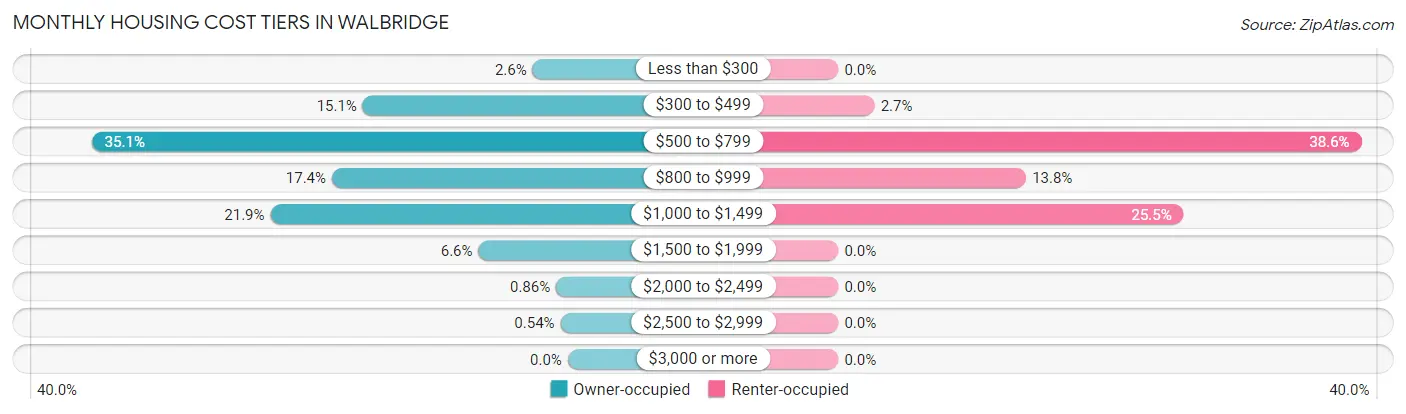
Monthly Housing Cost Tiers in Walbridge
| Monthly Cost | Owner-occupied | Renter-occupied |
| Less than $300 | 24 (2.6%) | 0 (0.0%) |
| $300 to $499 | 140 (15.1%) | 11 (2.7%) |
| $500 to $799 | 325 (35.1%) | 159 (38.6%) |
| $800 to $999 | 161 (17.4%) | 57 (13.8%) |
| $1,000 to $1,499 | 203 (21.9%) | 105 (25.5%) |
| $1,500 to $1,999 | 61 (6.6%) | 0 (0.0%) |
| $2,000 to $2,499 | 8 (0.9%) | 0 (0.0%) |
| $2,500 to $2,999 | 5 (0.5%) | 0 (0.0%) |
| $3,000 or more | 0 (0.0%) | 0 (0.0%) |
| Total | 927 (100.0%) | 412 (100.0%) |
Physical Housing Characteristics in Walbridge
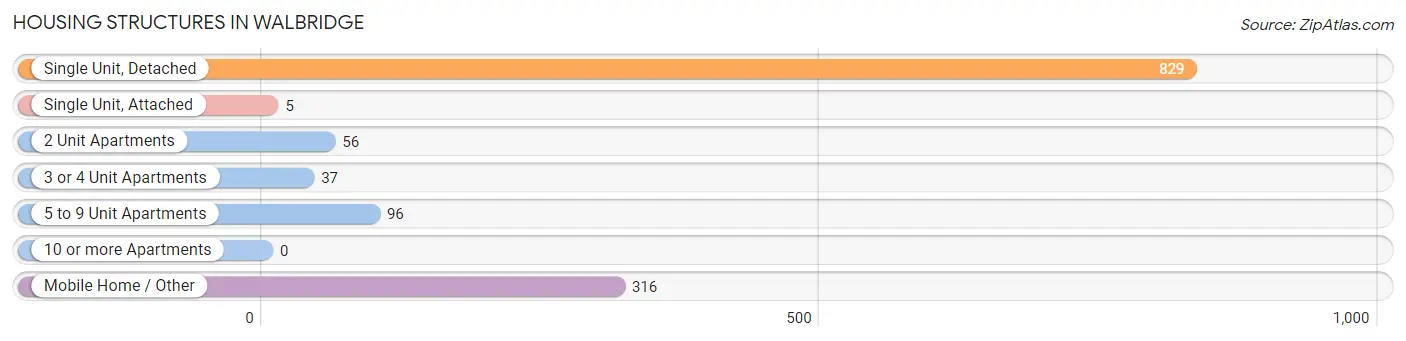
Housing Structures in Walbridge
| Structure Type | # Housing Units | % Housing Units |
| Single Unit, Detached | 829 | 61.9% |
| Single Unit, Attached | 5 | 0.4% |
| 2 Unit Apartments | 56 | 4.2% |
| 3 or 4 Unit Apartments | 37 | 2.8% |
| 5 to 9 Unit Apartments | 96 | 7.2% |
| 10 or more Apartments | 0 | 0.0% |
| Mobile Home / Other | 316 | 23.6% |
| Total | 1,339 | 100.0% |
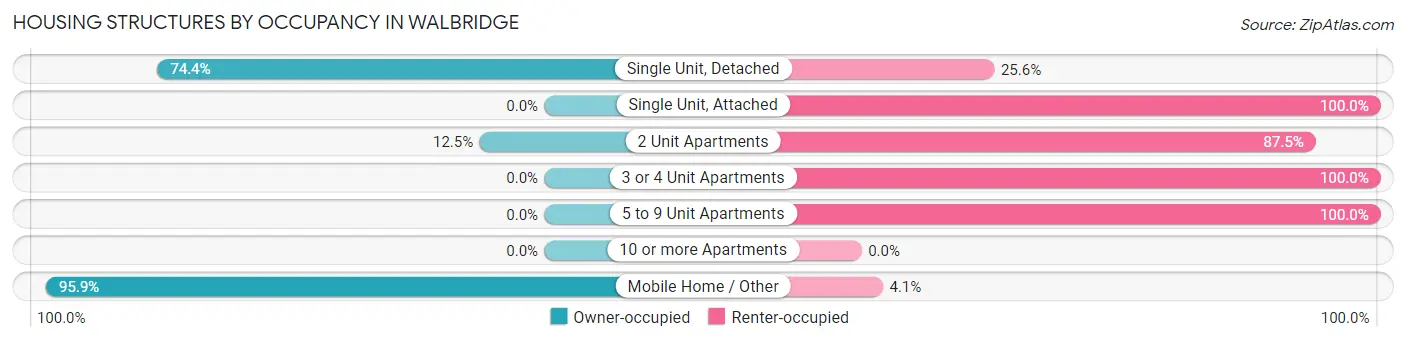
Housing Structures by Occupancy in Walbridge
| Structure Type | Owner-occupied | Renter-occupied |
| Single Unit, Detached | 617 (74.4%) | 212 (25.6%) |
| Single Unit, Attached | 0 (0.0%) | 5 (100.0%) |
| 2 Unit Apartments | 7 (12.5%) | 49 (87.5%) |
| 3 or 4 Unit Apartments | 0 (0.0%) | 37 (100.0%) |
| 5 to 9 Unit Apartments | 0 (0.0%) | 96 (100.0%) |
| 10 or more Apartments | 0 (0.0%) | 0 (0.0%) |
| Mobile Home / Other | 303 (95.9%) | 13 (4.1%) |
| Total | 927 (69.2%) | 412 (30.8%) |
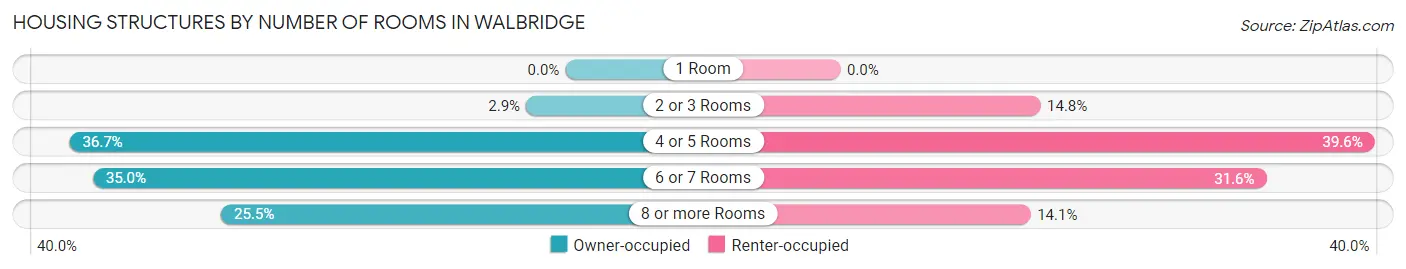
Housing Structures by Number of Rooms in Walbridge
| Number of Rooms | Owner-occupied | Renter-occupied |
| 1 Room | 0 (0.0%) | 0 (0.0%) |
| 2 or 3 Rooms | 27 (2.9%) | 61 (14.8%) |
| 4 or 5 Rooms | 340 (36.7%) | 163 (39.6%) |
| 6 or 7 Rooms | 324 (34.9%) | 130 (31.6%) |
| 8 or more Rooms | 236 (25.5%) | 58 (14.1%) |
| Total | 927 (100.0%) | 412 (100.0%) |
Housing Structure by Heating Type in Walbridge
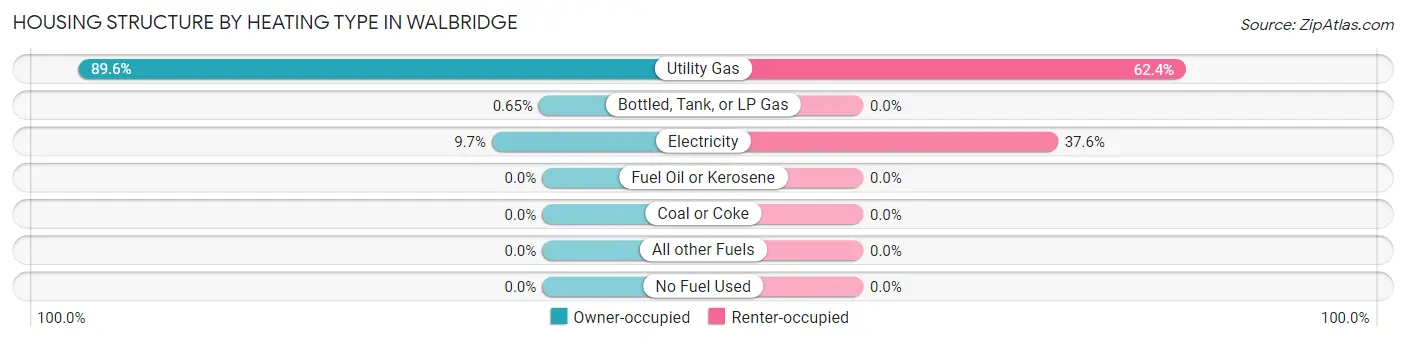
| Heating Type | Owner-occupied | Renter-occupied |
| Utility Gas | 831 (89.6%) | 257 (62.4%) |
| Bottled, Tank, or LP Gas | 6 (0.6%) | 0 (0.0%) |
| Electricity | 90 (9.7%) | 155 (37.6%) |
| Fuel Oil or Kerosene | 0 (0.0%) | 0 (0.0%) |
| Coal or Coke | 0 (0.0%) | 0 (0.0%) |
| All other Fuels | 0 (0.0%) | 0 (0.0%) |
| No Fuel Used | 0 (0.0%) | 0 (0.0%) |
| Total | 927 (100.0%) | 412 (100.0%) |
Household Vehicle Usage in Walbridge
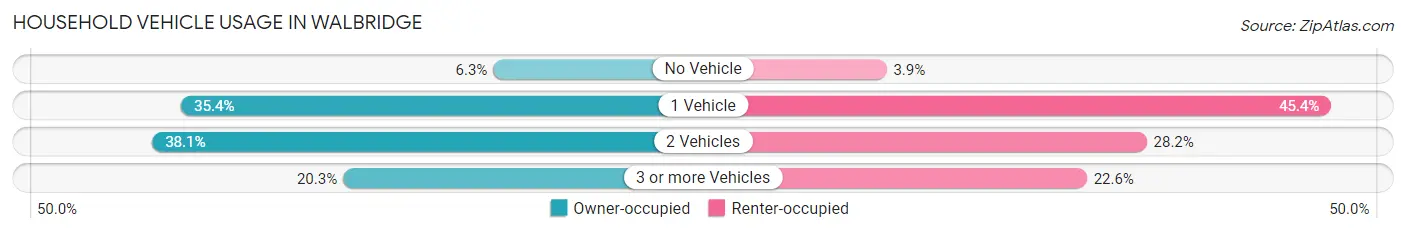
| Vehicles per Household | Owner-occupied | Renter-occupied |
| No Vehicle | 58 (6.3%) | 16 (3.9%) |
| 1 Vehicle | 328 (35.4%) | 187 (45.4%) |
| 2 Vehicles | 353 (38.1%) | 116 (28.2%) |
| 3 or more Vehicles | 188 (20.3%) | 93 (22.6%) |
| Total | 927 (100.0%) | 412 (100.0%) |
Real Estate & Mortgages in Walbridge
Real Estate and Mortgage Overview in Walbridge
| Characteristic | Without Mortgage | With Mortgage |
| Housing Units | 466 | 461 |
| Median Property Value | $90,700 | $131,000 |
| Median Household Income | $34,765 | $0 |
| Monthly Housing Costs | $535 | $0 |
| Real Estate Taxes | $1,173 | $8 |
Property Value by Mortgage Status in Walbridge
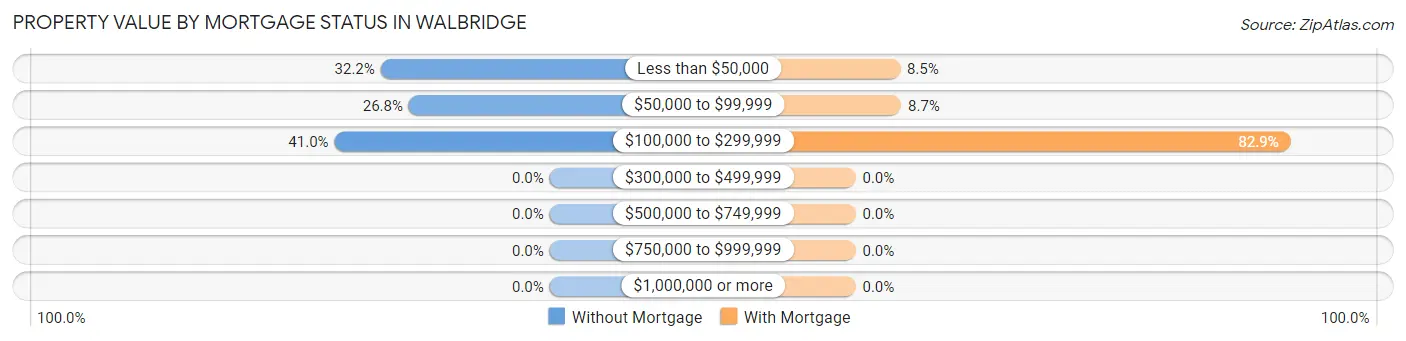
| Property Value | Without Mortgage | With Mortgage |
| Less than $50,000 | 150 (32.2%) | 39 (8.5%) |
| $50,000 to $99,999 | 125 (26.8%) | 40 (8.7%) |
| $100,000 to $299,999 | 191 (41.0%) | 382 (82.9%) |
| $300,000 to $499,999 | 0 (0.0%) | 0 (0.0%) |
| $500,000 to $749,999 | 0 (0.0%) | 0 (0.0%) |
| $750,000 to $999,999 | 0 (0.0%) | 0 (0.0%) |
| $1,000,000 or more | 0 (0.0%) | 0 (0.0%) |
| Total | 466 (100.0%) | 461 (100.0%) |
Household Income by Mortgage Status in Walbridge
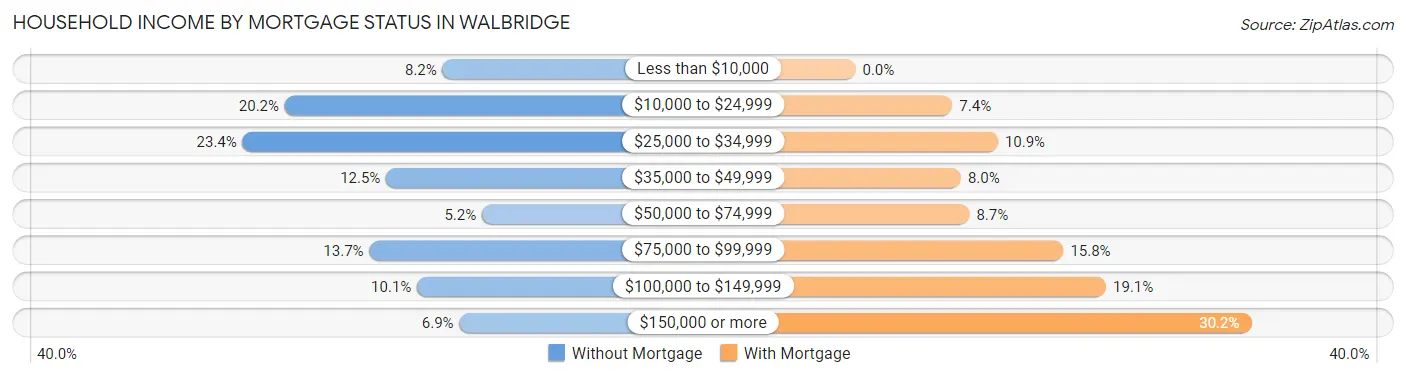
| Household Income | Without Mortgage | With Mortgage |
| Less than $10,000 | 38 (8.2%) | 0 (0.0%) |
| $10,000 to $24,999 | 94 (20.2%) | 34 (7.4%) |
| $25,000 to $34,999 | 109 (23.4%) | 50 (10.8%) |
| $35,000 to $49,999 | 58 (12.4%) | 37 (8.0%) |
| $50,000 to $74,999 | 24 (5.1%) | 40 (8.7%) |
| $75,000 to $99,999 | 64 (13.7%) | 73 (15.8%) |
| $100,000 to $149,999 | 47 (10.1%) | 88 (19.1%) |
| $150,000 or more | 32 (6.9%) | 139 (30.1%) |
| Total | 466 (100.0%) | 461 (100.0%) |
Property Value to Household Income Ratio in Walbridge
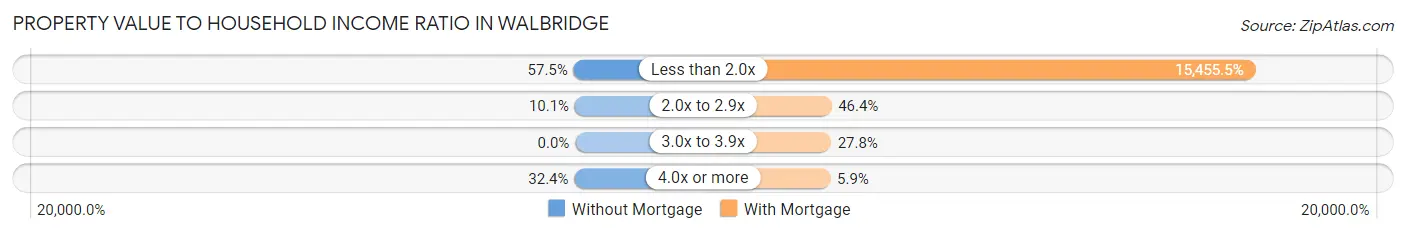
| Value-to-Income Ratio | Without Mortgage | With Mortgage |
| Less than 2.0x | 268 (57.5%) | 71,250 (15,455.5%) |
| 2.0x to 2.9x | 47 (10.1%) | 214 (46.4%) |
| 3.0x to 3.9x | 0 (0.0%) | 128 (27.8%) |
| 4.0x or more | 151 (32.4%) | 27 (5.9%) |
| Total | 466 (100.0%) | 461 (100.0%) |
Real Estate Taxes by Mortgage Status in Walbridge
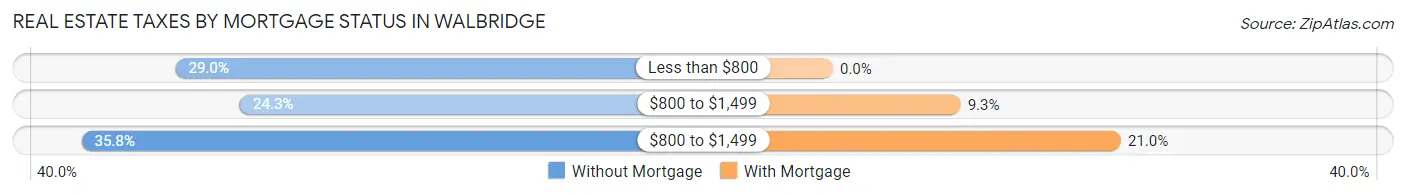
| Property Taxes | Without Mortgage | With Mortgage |
| Less than $800 | 135 (29.0%) | 0 (0.0%) |
| $800 to $1,499 | 113 (24.2%) | 43 (9.3%) |
| $800 to $1,499 | 167 (35.8%) | 97 (21.0%) |
| Total | 466 (100.0%) | 461 (100.0%) |
Health & Disability in Walbridge
Health Insurance Coverage by Age in Walbridge
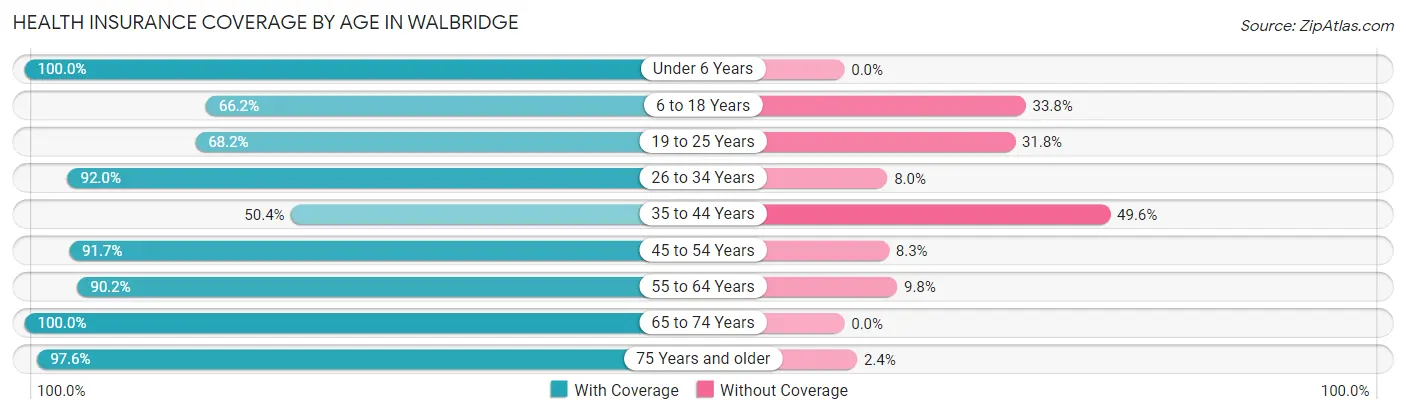
| Age Bracket | With Coverage | Without Coverage |
| Under 6 Years | 256 (100.0%) | 0 (0.0%) |
| 6 to 18 Years | 190 (66.2%) | 97 (33.8%) |
| 19 to 25 Years | 255 (68.2%) | 119 (31.8%) |
| 26 to 34 Years | 310 (92.0%) | 27 (8.0%) |
| 35 to 44 Years | 235 (50.4%) | 231 (49.6%) |
| 45 to 54 Years | 276 (91.7%) | 25 (8.3%) |
| 55 to 64 Years | 284 (90.2%) | 31 (9.8%) |
| 65 to 74 Years | 390 (100.0%) | 0 (0.0%) |
| 75 Years and older | 290 (97.6%) | 7 (2.4%) |
| Total | 2,486 (82.2%) | 537 (17.8%) |
Health Insurance Coverage by Citizenship Status in Walbridge
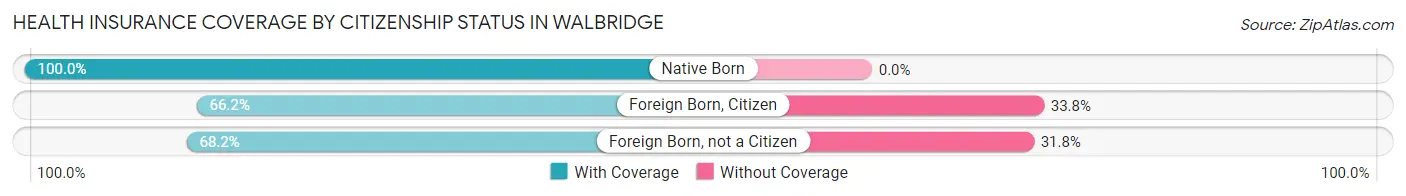
| Citizenship Status | With Coverage | Without Coverage |
| Native Born | 256 (100.0%) | 0 (0.0%) |
| Foreign Born, Citizen | 190 (66.2%) | 97 (33.8%) |
| Foreign Born, not a Citizen | 255 (68.2%) | 119 (31.8%) |
Health Insurance Coverage by Household Income in Walbridge
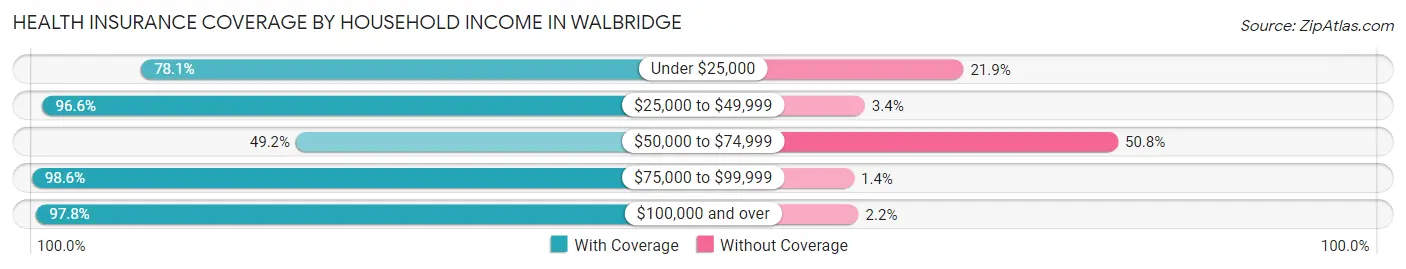
| Household Income | With Coverage | Without Coverage |
| Under $25,000 | 336 (78.1%) | 94 (21.9%) |
| $25,000 to $49,999 | 541 (96.6%) | 19 (3.4%) |
| $50,000 to $74,999 | 388 (49.2%) | 401 (50.8%) |
| $75,000 to $99,999 | 503 (98.6%) | 7 (1.4%) |
| $100,000 and over | 706 (97.8%) | 16 (2.2%) |
Public vs Private Health Insurance Coverage by Age in Walbridge
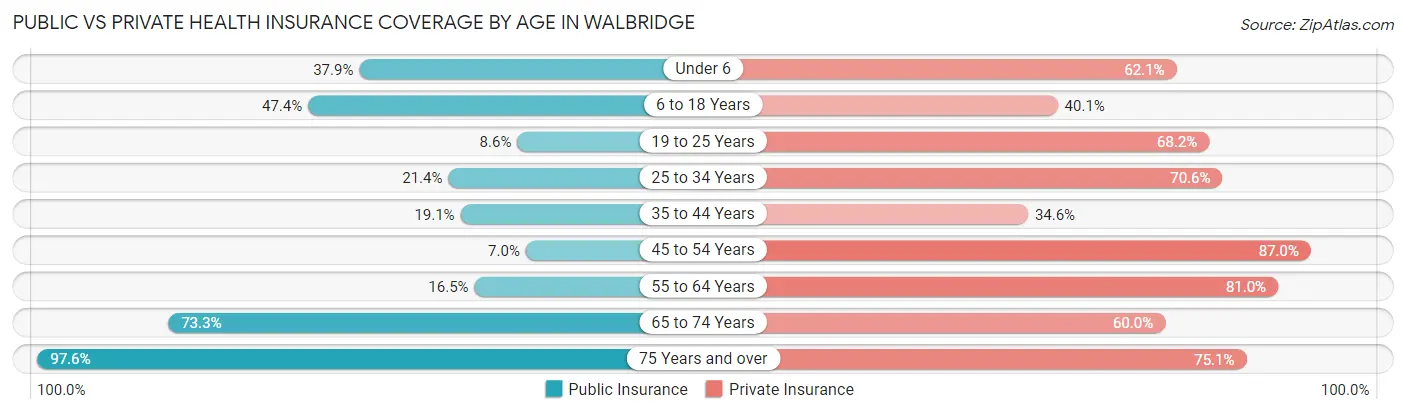
| Age Bracket | Public Insurance | Private Insurance |
| Under 6 | 97 (37.9%) | 159 (62.1%) |
| 6 to 18 Years | 136 (47.4%) | 115 (40.1%) |
| 19 to 25 Years | 32 (8.6%) | 255 (68.2%) |
| 25 to 34 Years | 72 (21.4%) | 238 (70.6%) |
| 35 to 44 Years | 89 (19.1%) | 161 (34.5%) |
| 45 to 54 Years | 21 (7.0%) | 262 (87.0%) |
| 55 to 64 Years | 52 (16.5%) | 255 (80.9%) |
| 65 to 74 Years | 286 (73.3%) | 234 (60.0%) |
| 75 Years and over | 290 (97.6%) | 223 (75.1%) |
| Total | 1,075 (35.6%) | 1,902 (62.9%) |
Disability Status by Sex by Age in Walbridge
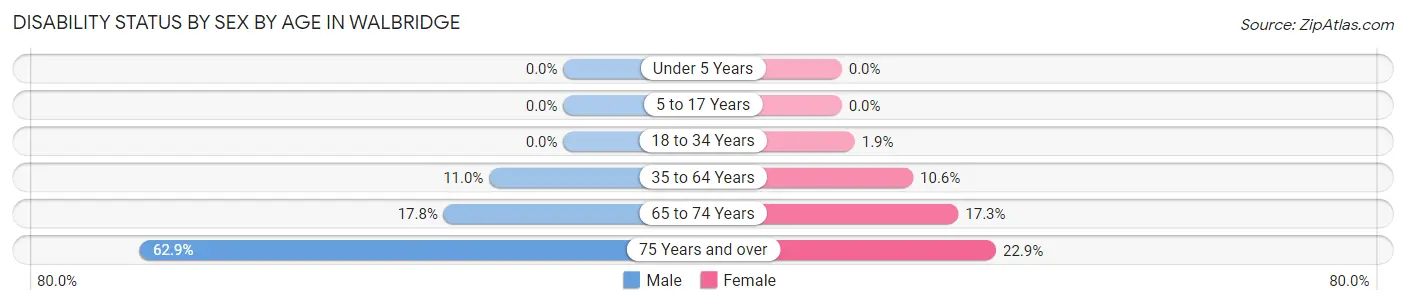
| Age Bracket | Male | Female |
| Under 5 Years | 0 (0.0%) | 0 (0.0%) |
| 5 to 17 Years | 0 (0.0%) | 0 (0.0%) |
| 18 to 34 Years | 0 (0.0%) | 8 (1.9%) |
| 35 to 64 Years | 63 (11.0%) | 54 (10.6%) |
| 65 to 74 Years | 19 (17.8%) | 49 (17.3%) |
| 75 Years and over | 44 (62.9%) | 52 (22.9%) |
Disability Class by Sex by Age in Walbridge
Disability Class: Hearing Difficulty
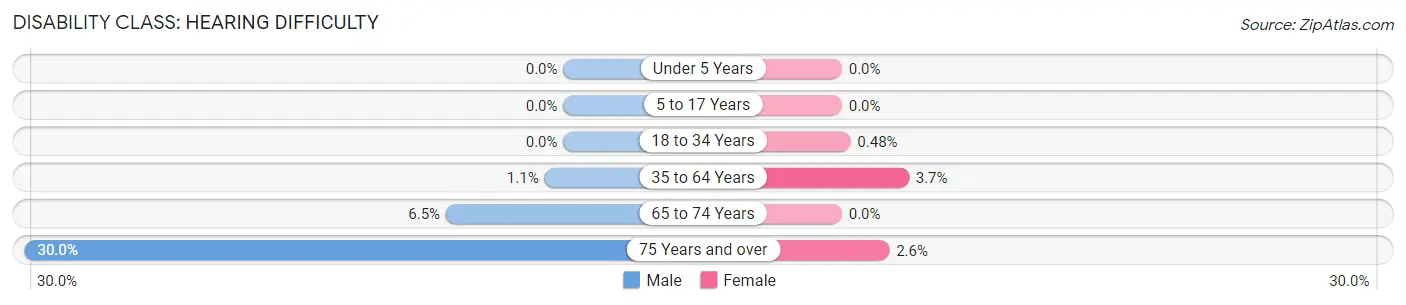
| Age Bracket | Male | Female |
| Under 5 Years | 0 (0.0%) | 0 (0.0%) |
| 5 to 17 Years | 0 (0.0%) | 0 (0.0%) |
| 18 to 34 Years | 0 (0.0%) | 2 (0.5%) |
| 35 to 64 Years | 6 (1.1%) | 19 (3.7%) |
| 65 to 74 Years | 7 (6.5%) | 0 (0.0%) |
| 75 Years and over | 21 (30.0%) | 6 (2.6%) |
Disability Class: Vision Difficulty
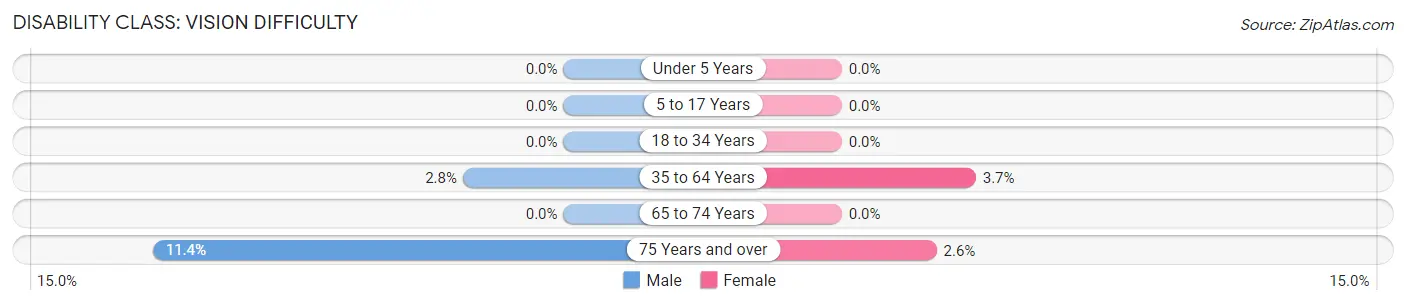
| Age Bracket | Male | Female |
| Under 5 Years | 0 (0.0%) | 0 (0.0%) |
| 5 to 17 Years | 0 (0.0%) | 0 (0.0%) |
| 18 to 34 Years | 0 (0.0%) | 0 (0.0%) |
| 35 to 64 Years | 16 (2.8%) | 19 (3.7%) |
| 65 to 74 Years | 0 (0.0%) | 0 (0.0%) |
| 75 Years and over | 8 (11.4%) | 6 (2.6%) |
Disability Class: Cognitive Difficulty
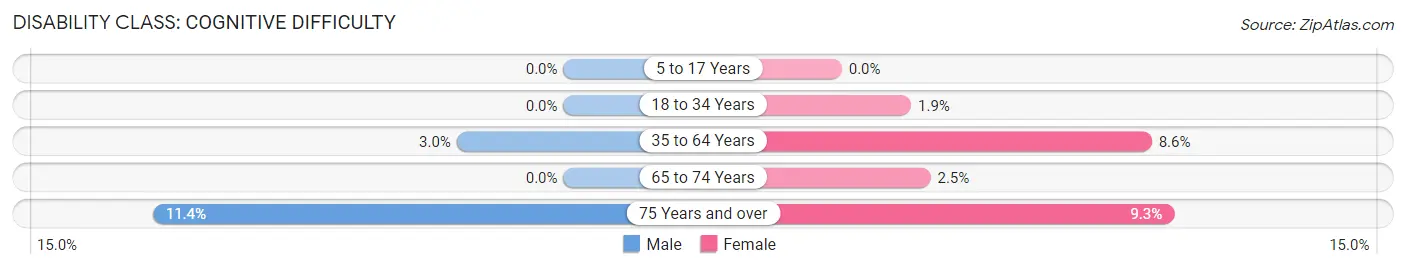
| Age Bracket | Male | Female |
| 5 to 17 Years | 0 (0.0%) | 0 (0.0%) |
| 18 to 34 Years | 0 (0.0%) | 8 (1.9%) |
| 35 to 64 Years | 17 (3.0%) | 44 (8.6%) |
| 65 to 74 Years | 0 (0.0%) | 7 (2.5%) |
| 75 Years and over | 8 (11.4%) | 21 (9.2%) |
Disability Class: Ambulatory Difficulty
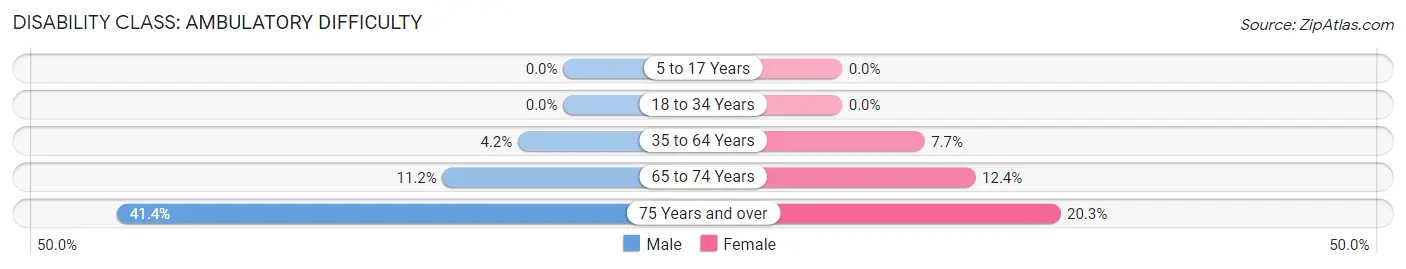
| Age Bracket | Male | Female |
| 5 to 17 Years | 0 (0.0%) | 0 (0.0%) |
| 18 to 34 Years | 0 (0.0%) | 0 (0.0%) |
| 35 to 64 Years | 24 (4.2%) | 39 (7.6%) |
| 65 to 74 Years | 12 (11.2%) | 35 (12.4%) |
| 75 Years and over | 29 (41.4%) | 46 (20.3%) |
Disability Class: Self-Care Difficulty
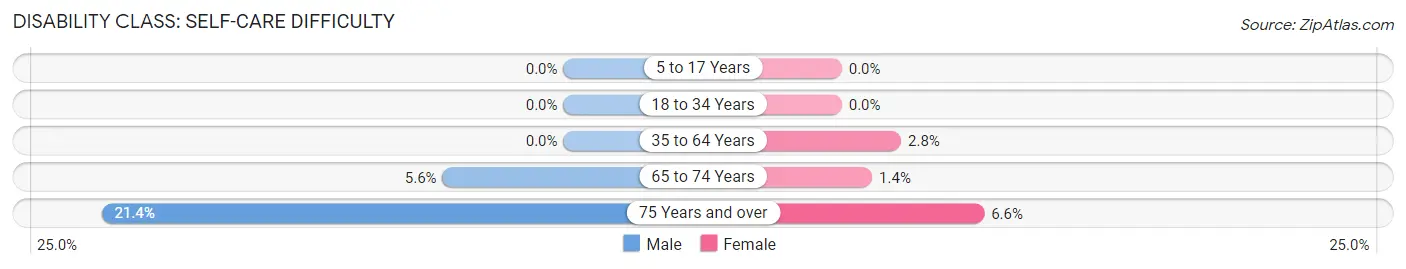
| Age Bracket | Male | Female |
| 5 to 17 Years | 0 (0.0%) | 0 (0.0%) |
| 18 to 34 Years | 0 (0.0%) | 0 (0.0%) |
| 35 to 64 Years | 0 (0.0%) | 14 (2.8%) |
| 65 to 74 Years | 6 (5.6%) | 4 (1.4%) |
| 75 Years and over | 15 (21.4%) | 15 (6.6%) |
Technology Access in Walbridge
Computing Device Access in Walbridge
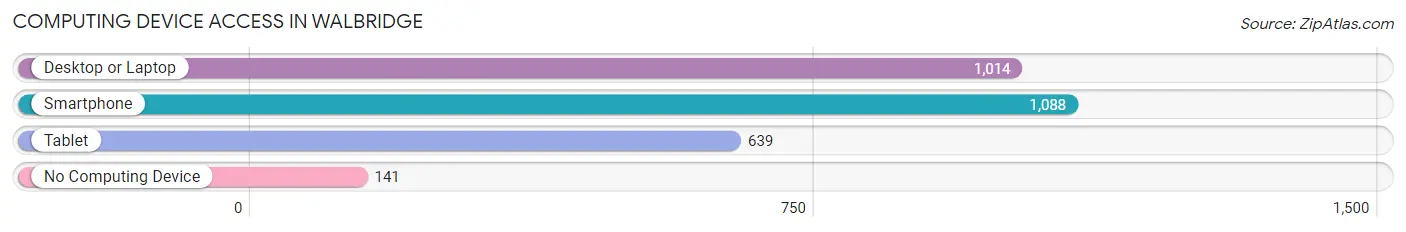
| Device Type | # Households | % Households |
| Desktop or Laptop | 1,014 | 75.7% |
| Smartphone | 1,088 | 81.2% |
| Tablet | 639 | 47.7% |
| No Computing Device | 141 | 10.5% |
| Total | 1,339 | 100.0% |
Internet Access in Walbridge
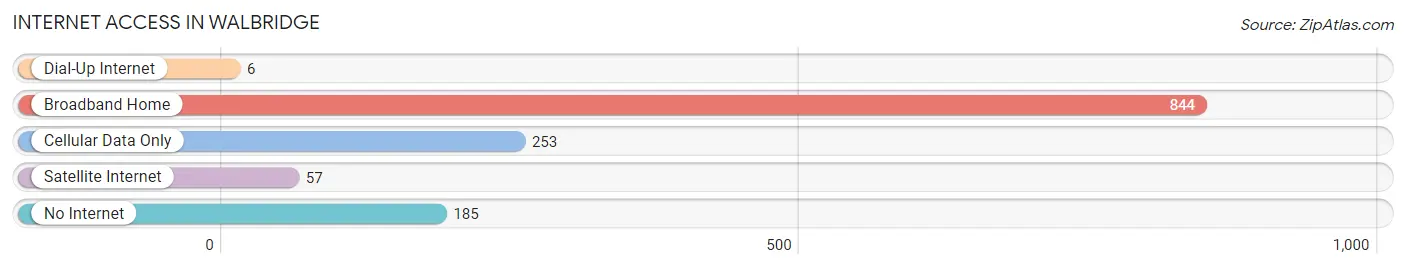
| Internet Type | # Households | % Households |
| Dial-Up Internet | 6 | 0.4% |
| Broadband Home | 844 | 63.0% |
| Cellular Data Only | 253 | 18.9% |
| Satellite Internet | 57 | 4.3% |
| No Internet | 185 | 13.8% |
| Total | 1,339 | 100.0% |
Walbridge Summary
Walbridge, Ohio is a small village located in Wood County, Ohio. It is situated on the banks of the Maumee River, just south of Toledo. The village was founded in 1854 and has a population of approximately 3,000 people.
Walbridge is a small village with a rich history. The village was founded by a group of settlers from Pennsylvania who were looking for a place to settle and start a new life. The settlers chose the area because of its proximity to the Maumee River, which provided them with access to transportation and trade. The village was named after the first settler, John Walbridge, who was a prominent figure in the area.
The village of Walbridge has a long history of industry and commerce. In the late 1800s, the village was home to several factories, including a flour mill, a sawmill, and a brickyard. These factories provided employment for many of the villagers and helped to shape the economy of the village.
The village of Walbridge is located in Wood County, Ohio. The county is home to a variety of industries, including manufacturing, agriculture, and tourism. The county is also home to several state parks, including Maumee State Park and Oak Openings State Park.
The village of Walbridge has a population of approximately 3,000 people. The population is primarily white, with a small percentage of African Americans and Hispanics. The median household income in the village is $45,000, which is slightly lower than the national average. The village has a low unemployment rate, with only 4.2% of the population unemployed.
The village of Walbridge is served by the Toledo Public Schools district. The district has several elementary schools, a middle school, and a high school. The village also has a library, a post office, and several churches.
The village of Walbridge is a small, rural community with a rich history and a strong sense of community. The village is home to a variety of businesses, including restaurants, shops, and services. The village is also home to several parks and recreational areas, including a golf course and a swimming pool. The village is a great place to live and work, and it is a great place to raise a family.
Common Questions
What is Per Capita Income in Walbridge?
Per Capita income in Walbridge is $30,377.
What is the Median Family Income in Walbridge?
Median Family Income in Walbridge is $72,500.
What is the Median Household income in Walbridge?
Median Household Income in Walbridge is $51,563.
What is Income or Wage Gap in Walbridge?
Income or Wage Gap in Walbridge is 38.9%.
Women in Walbridge earn 61.1 cents for every dollar earned by a man.
What is Inequality or Gini Index in Walbridge?
Inequality or Gini Index in Walbridge is 0.39.
What is the Total Population of Walbridge?
Total Population of Walbridge is 3,023.
What is the Total Male Population of Walbridge?
Total Male Population of Walbridge is 1,370.
What is the Total Female Population of Walbridge?
Total Female Population of Walbridge is 1,653.
What is the Ratio of Males per 100 Females in Walbridge?
There are 82.88 Males per 100 Females in Walbridge.
What is the Ratio of Females per 100 Males in Walbridge?
There are 120.66 Females per 100 Males in Walbridge.
What is the Median Population Age in Walbridge?
Median Population Age in Walbridge is 37.0 Years.
What is the Average Family Size in Walbridge
Average Family Size in Walbridge is 3.0 People.
What is the Average Household Size in Walbridge
Average Household Size in Walbridge is 2.2 People.
How Large is the Labor Force in Walbridge?
There are 1,781 People in the Labor Forcein in Walbridge.
What is the Percentage of People in the Labor Force in Walbridge?
70.5% of People are in the Labor Force in Walbridge.
What is the Unemployment Rate in Walbridge?
Unemployment Rate in Walbridge is 7.8%.