Vermilion, OH Map & Demographics
Vermilion Map
Vermilion Overview
$43,479
PER CAPITA INCOME
$88,581
AVG FAMILY INCOME
$73,458
AVG HOUSEHOLD INCOME
44.0%
WAGE / INCOME GAP [ % ]
56.0¢/ $1
WAGE / INCOME GAP [ $ ]
0.47
INEQUALITY / GINI INDEX
10,459
TOTAL POPULATION
5,009
MALE POPULATION
5,450
FEMALE POPULATION
91.91
MALES / 100 FEMALES
108.80
FEMALES / 100 MALES
48.3
MEDIAN AGE
2.9
AVG FAMILY SIZE
2.3
AVG HOUSEHOLD SIZE
5,411
LABOR FORCE [ PEOPLE ]
61.1%
PERCENT IN LABOR FORCE
3.0%
UNEMPLOYMENT RATE
Vermilion Zip Codes
Vermilion Area Codes
Income in Vermilion
Income Overview in Vermilion
Per Capita Income in Vermilion is $43,479, while median incomes of families and households are $88,581 and $73,458 respectively.
| Characteristic | Number | Measure |
| Per Capita Income | 10,459 | $43,479 |
| Median Family Income | 2,845 | $88,581 |
| Mean Family Income | 2,845 | $124,382 |
| Median Household Income | 4,473 | $73,458 |
| Mean Household Income | 4,473 | $101,602 |
| Income Deficit | 2,845 | $0 |
| Wage / Income Gap (%) | 10,459 | 44.00% |
| Wage / Income Gap ($) | 10,459 | 56.00¢ per $1 |
| Gini / Inequality Index | 10,459 | 0.47 |
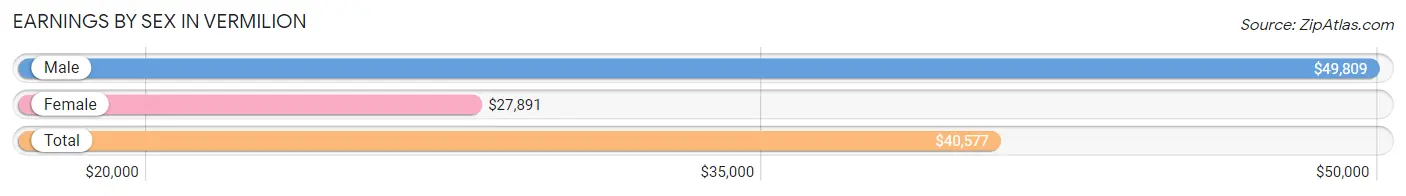
Earnings by Sex in Vermilion
Average Earnings in Vermilion are $40,577, $49,809 for men and $27,891 for women, a difference of 44.0%.
| Sex | Number | Average Earnings |
| Male | 2,967 (51.9%) | $49,809 |
| Female | 2,745 (48.1%) | $27,891 |
| Total | 5,712 (100.0%) | $40,577 |
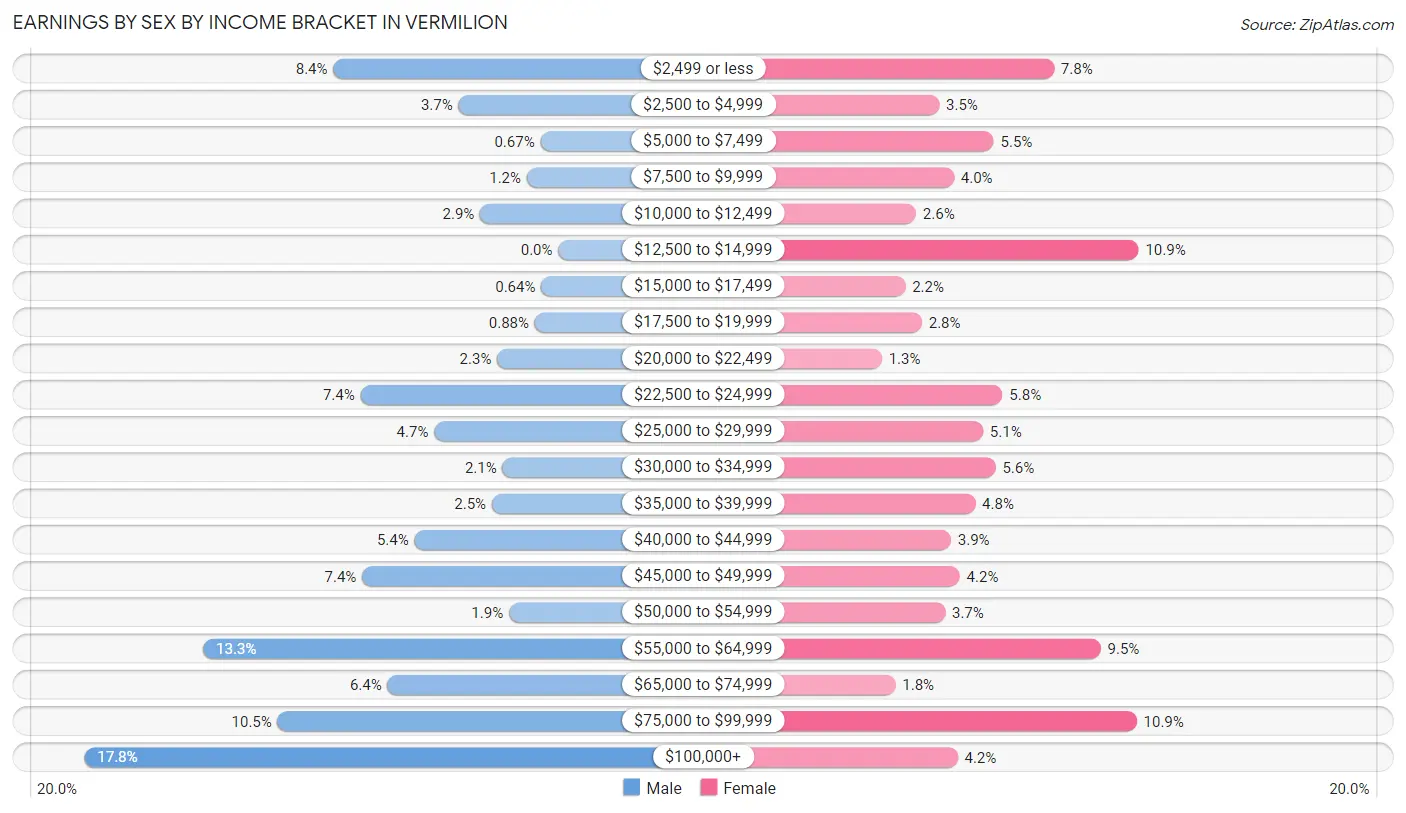
Earnings by Sex by Income Bracket in Vermilion
The most common earnings brackets in Vermilion are $100,000+ for men (527 | 17.8%) and $12,500 to $14,999 for women (300 | 10.9%).
| Income | Male | Female |
| $2,499 or less | 250 (8.4%) | 213 (7.8%) |
| $2,500 to $4,999 | 111 (3.7%) | 95 (3.5%) |
| $5,000 to $7,499 | 20 (0.7%) | 151 (5.5%) |
| $7,500 to $9,999 | 35 (1.2%) | 110 (4.0%) |
| $10,000 to $12,499 | 87 (2.9%) | 71 (2.6%) |
| $12,500 to $14,999 | 0 (0.0%) | 300 (10.9%) |
| $15,000 to $17,499 | 19 (0.6%) | 60 (2.2%) |
| $17,500 to $19,999 | 26 (0.9%) | 77 (2.8%) |
| $20,000 to $22,499 | 68 (2.3%) | 36 (1.3%) |
| $22,500 to $24,999 | 220 (7.4%) | 160 (5.8%) |
| $25,000 to $29,999 | 138 (4.6%) | 140 (5.1%) |
| $30,000 to $34,999 | 62 (2.1%) | 153 (5.6%) |
| $35,000 to $39,999 | 74 (2.5%) | 132 (4.8%) |
| $40,000 to $44,999 | 160 (5.4%) | 107 (3.9%) |
| $45,000 to $49,999 | 218 (7.3%) | 116 (4.2%) |
| $50,000 to $54,999 | 55 (1.8%) | 101 (3.7%) |
| $55,000 to $64,999 | 395 (13.3%) | 261 (9.5%) |
| $65,000 to $74,999 | 190 (6.4%) | 50 (1.8%) |
| $75,000 to $99,999 | 312 (10.5%) | 298 (10.9%) |
| $100,000+ | 527 (17.8%) | 114 (4.2%) |
| Total | 2,967 (100.0%) | 2,745 (100.0%) |
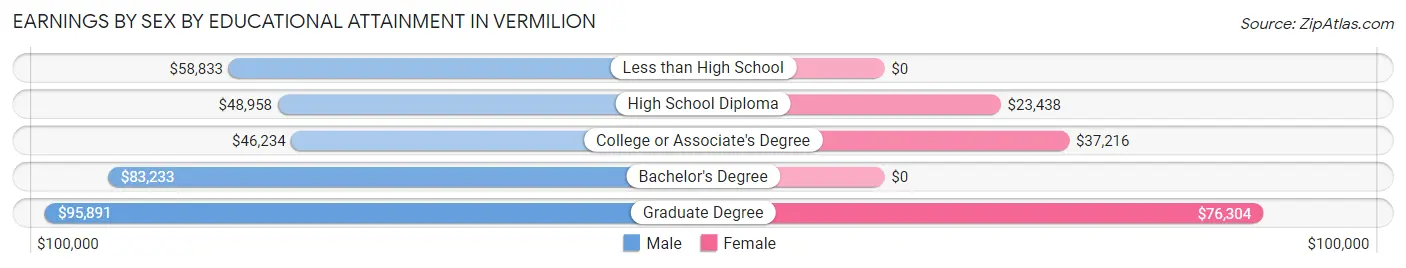
Earnings by Sex by Educational Attainment in Vermilion
Average earnings in Vermilion are $57,854 for men and $31,619 for women, a difference of 45.4%. Men with an educational attainment of graduate degree enjoy the highest average annual earnings of $95,891, while those with college or associate's degree education earn the least with $46,234. Women with an educational attainment of graduate degree earn the most with the average annual earnings of $76,304, while those with high school diploma education have the smallest earnings of $23,438.
| Educational Attainment | Male Income | Female Income |
| Less than High School | $58,833 | $0 |
| High School Diploma | $48,958 | $23,438 |
| College or Associate's Degree | $46,234 | $37,216 |
| Bachelor's Degree | $83,233 | $0 |
| Graduate Degree | $95,891 | $76,304 |
| Total | $57,854 | $31,619 |
Family Income in Vermilion
Family Income Brackets in Vermilion
According to the Vermilion family income data, there are 717 families falling into the $100,000 to $149,999 income range, which is the most common income bracket and makes up 25.2% of all families. Conversely, the less than $10,000 income bracket is the least frequent group with only 14 families (0.5%) belonging to this category.
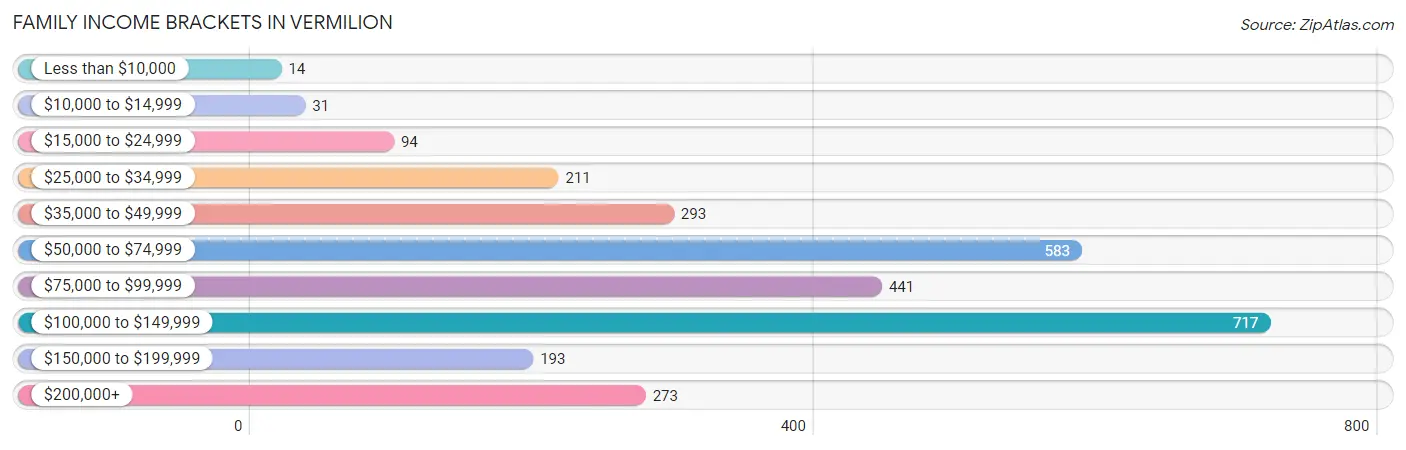
| Income Bracket | # Families | % Families |
| Less than $10,000 | 14 | 0.5% |
| $10,000 to $14,999 | 31 | 1.1% |
| $15,000 to $24,999 | 94 | 3.3% |
| $25,000 to $34,999 | 211 | 7.4% |
| $35,000 to $49,999 | 293 | 10.3% |
| $50,000 to $74,999 | 583 | 20.5% |
| $75,000 to $99,999 | 441 | 15.5% |
| $100,000 to $149,999 | 717 | 25.2% |
| $150,000 to $199,999 | 193 | 6.8% |
| $200,000+ | 273 | 9.6% |
Family Income by Famaliy Size in Vermilion
5-person families (218 | 7.7%) account for the highest median family income in Vermilion with $123,179 per family, while 2-person families (1,473 | 51.8%) have the highest median income of $31,410 per family member.
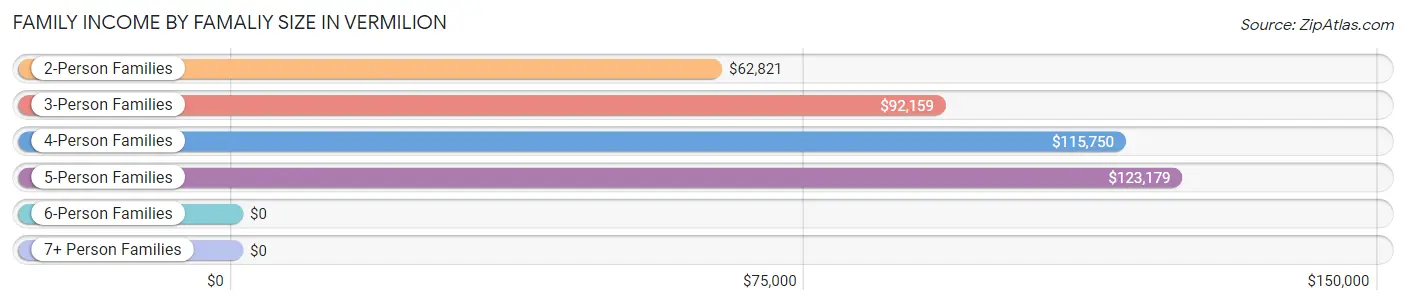
| Income Bracket | # Families | Median Income |
| 2-Person Families | 1,473 (51.8%) | $62,821 |
| 3-Person Families | 735 (25.8%) | $92,159 |
| 4-Person Families | 306 (10.8%) | $115,750 |
| 5-Person Families | 218 (7.7%) | $123,179 |
| 6-Person Families | 70 (2.5%) | $0 |
| 7+ Person Families | 43 (1.5%) | $0 |
| Total | 2,845 (100.0%) | $88,581 |
Family Income by Number of Earners in Vermilion
The median family income in Vermilion is $88,581, with families comprising 3+ earners (319) having the highest median family income of $139,803, while families with no earners (427) have the lowest median family income of $44,297, accounting for 11.2% and 15.0% of families, respectively.
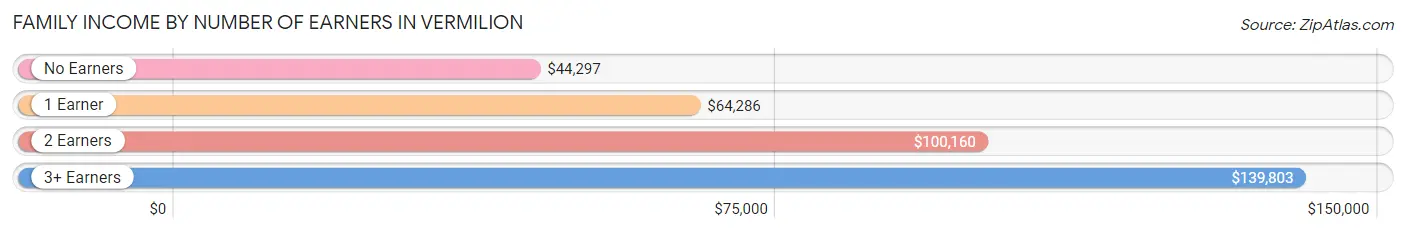
| Number of Earners | # Families | Median Income |
| No Earners | 427 (15.0%) | $44,297 |
| 1 Earner | 966 (34.0%) | $64,286 |
| 2 Earners | 1,133 (39.8%) | $100,160 |
| 3+ Earners | 319 (11.2%) | $139,803 |
| Total | 2,845 (100.0%) | $88,581 |
Household Income in Vermilion
Household Income Brackets in Vermilion
With 984 households falling in the category, the $100,000 to $149,999 income range is the most frequent in Vermilion, accounting for 22.0% of all households. In contrast, only 76 households (1.7%) fall into the $10,000 to $14,999 income bracket, making it the least populous group.
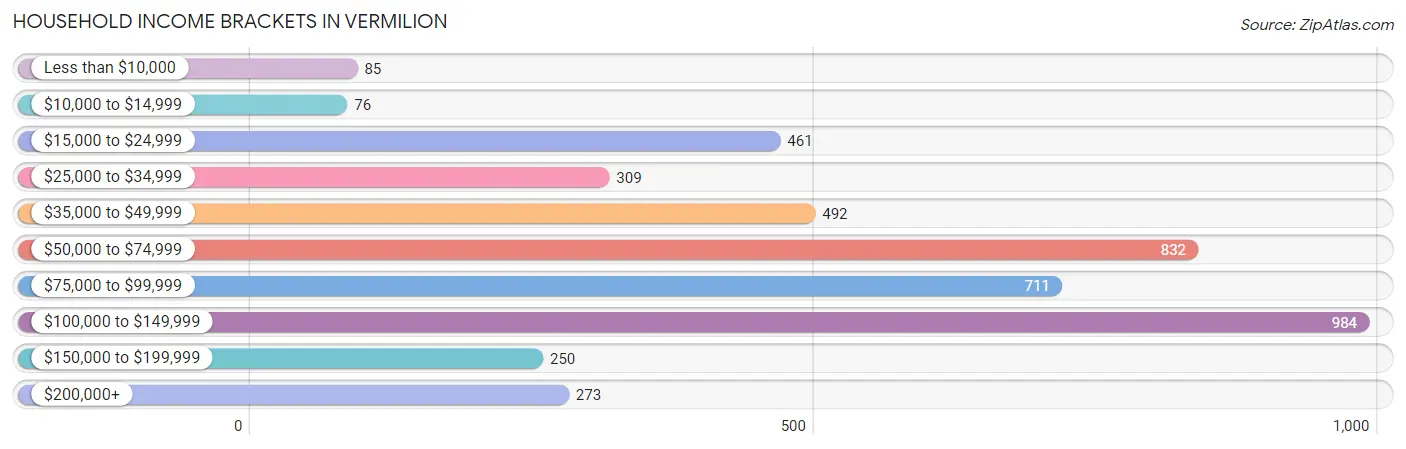
| Income Bracket | # Households | % Households |
| Less than $10,000 | 85 | 1.9% |
| $10,000 to $14,999 | 76 | 1.7% |
| $15,000 to $24,999 | 461 | 10.3% |
| $25,000 to $34,999 | 309 | 6.9% |
| $35,000 to $49,999 | 492 | 11.0% |
| $50,000 to $74,999 | 832 | 18.6% |
| $75,000 to $99,999 | 711 | 15.9% |
| $100,000 to $149,999 | 984 | 22.0% |
| $150,000 to $199,999 | 250 | 5.6% |
| $200,000+ | 273 | 6.1% |
Household Income by Householder Age in Vermilion
The median household income in Vermilion is $73,458, with the highest median household income of $92,431 found in the 25 to 44 years age bracket for the primary householder. A total of 990 households (22.1%) fall into this category. Meanwhile, the 15 to 24 years age bracket for the primary householder has the lowest median household income of $0, with 79 households (1.8%) in this group.
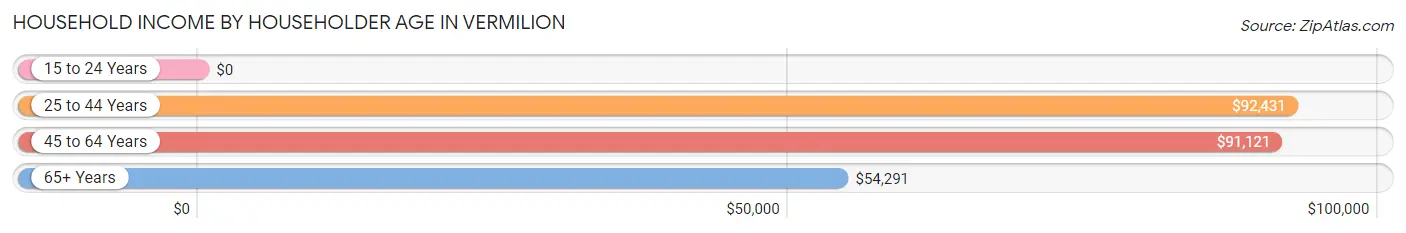
| Income Bracket | # Households | Median Income |
| 15 to 24 Years | 79 (1.8%) | $0 |
| 25 to 44 Years | 990 (22.1%) | $92,431 |
| 45 to 64 Years | 1,814 (40.6%) | $91,121 |
| 65+ Years | 1,590 (35.5%) | $54,291 |
| Total | 4,473 (100.0%) | $73,458 |
Poverty in Vermilion
Income Below Poverty by Sex and Age in Vermilion
With 2.9% poverty level for males and 6.3% for females among the residents of Vermilion, 6 to 11 year old males and 35 to 44 year old females are the most vulnerable to poverty, with 55 males (26.1%) and 66 females (15.8%) in their respective age groups living below the poverty level.
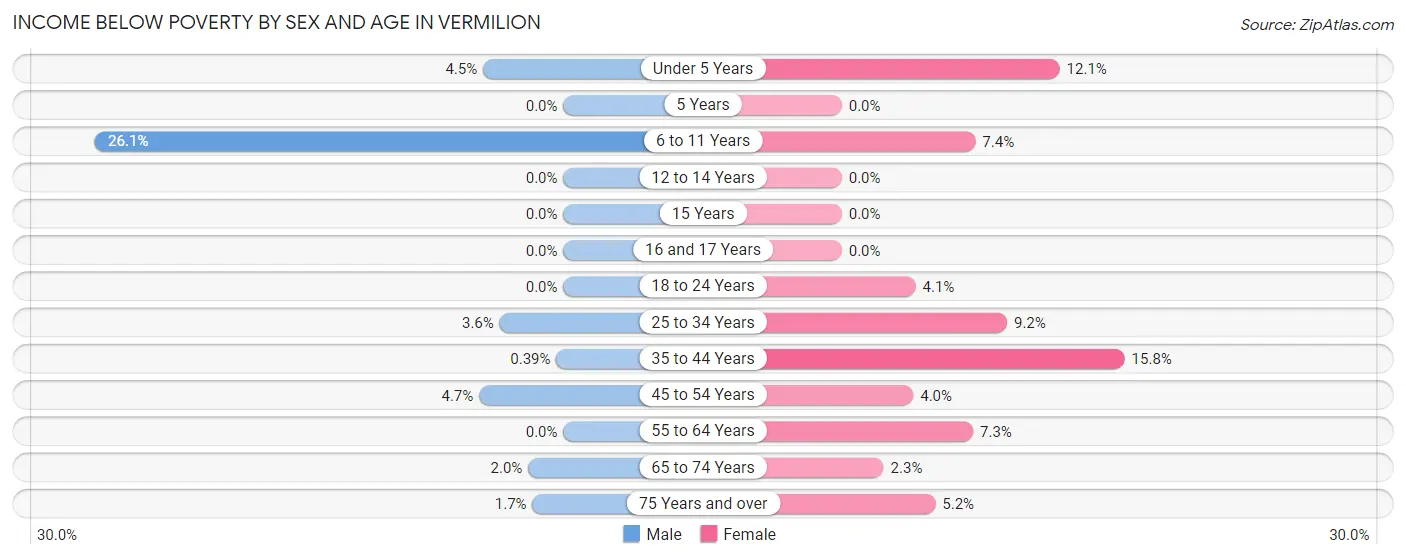
| Age Bracket | Male | Female |
| Under 5 Years | 14 (4.5%) | 29 (12.1%) |
| 5 Years | 0 (0.0%) | 0 (0.0%) |
| 6 to 11 Years | 55 (26.1%) | 27 (7.4%) |
| 12 to 14 Years | 0 (0.0%) | 0 (0.0%) |
| 15 Years | 0 (0.0%) | 0 (0.0%) |
| 16 and 17 Years | 0 (0.0%) | 0 (0.0%) |
| 18 to 24 Years | 0 (0.0%) | 19 (4.1%) |
| 25 to 34 Years | 17 (3.5%) | 53 (9.2%) |
| 35 to 44 Years | 2 (0.4%) | 66 (15.8%) |
| 45 to 54 Years | 33 (4.7%) | 26 (4.0%) |
| 55 to 64 Years | 0 (0.0%) | 68 (7.3%) |
| 65 to 74 Years | 13 (2.0%) | 17 (2.3%) |
| 75 Years and over | 7 (1.7%) | 33 (5.2%) |
| Total | 141 (2.9%) | 338 (6.3%) |
Income Above Poverty by Sex and Age in Vermilion
According to the poverty statistics in Vermilion, males aged 5 years and females aged 5 years are the age groups that are most secure financially, with 100.0% of males and 100.0% of females in these age groups living above the poverty line.
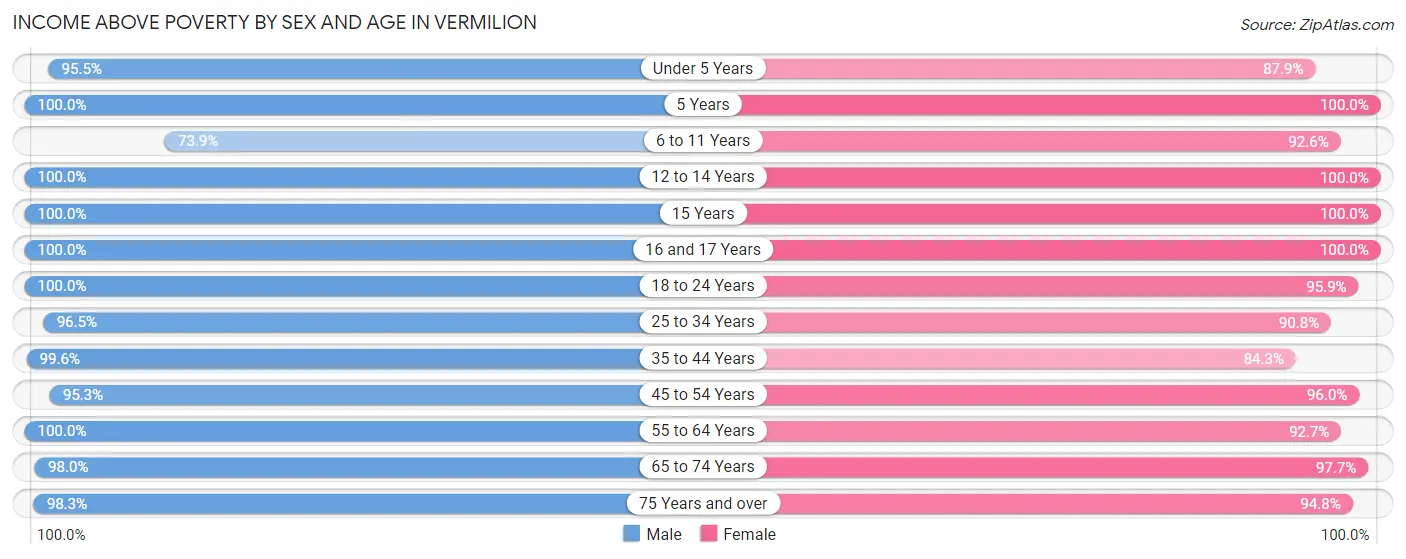
| Age Bracket | Male | Female |
| Under 5 Years | 299 (95.5%) | 210 (87.9%) |
| 5 Years | 68 (100.0%) | 10 (100.0%) |
| 6 to 11 Years | 156 (73.9%) | 336 (92.6%) |
| 12 to 14 Years | 89 (100.0%) | 158 (100.0%) |
| 15 Years | 38 (100.0%) | 114 (100.0%) |
| 16 and 17 Years | 323 (100.0%) | 77 (100.0%) |
| 18 to 24 Years | 257 (100.0%) | 443 (95.9%) |
| 25 to 34 Years | 462 (96.5%) | 523 (90.8%) |
| 35 to 44 Years | 514 (99.6%) | 353 (84.3%) |
| 45 to 54 Years | 670 (95.3%) | 627 (96.0%) |
| 55 to 64 Years | 885 (100.0%) | 862 (92.7%) |
| 65 to 74 Years | 651 (98.0%) | 713 (97.7%) |
| 75 Years and over | 401 (98.3%) | 601 (94.8%) |
| Total | 4,813 (97.2%) | 5,027 (93.7%) |
Income Below Poverty Among Married-Couple Families in Vermilion
The poverty statistics for married-couple families in Vermilion show that 0.6% or 13 of the total 2,230 families live below the poverty line. Families with no children have the highest poverty rate of 1.0%, comprising of 13 families. On the other hand, families with 1 or 2 children have the lowest poverty rate of 0.0%, which includes 0 families.
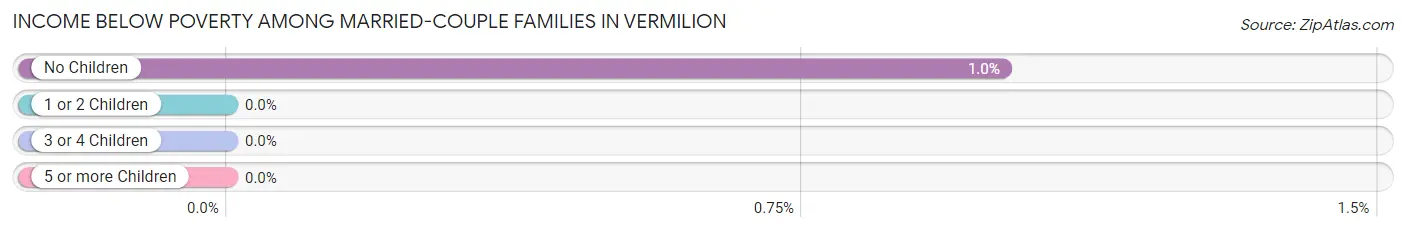
| Children | Above Poverty | Below Poverty |
| No Children | 1,274 (99.0%) | 13 (1.0%) |
| 1 or 2 Children | 679 (100.0%) | 0 (0.0%) |
| 3 or 4 Children | 261 (100.0%) | 0 (0.0%) |
| 5 or more Children | 3 (100.0%) | 0 (0.0%) |
| Total | 2,217 (99.4%) | 13 (0.6%) |
Income Below Poverty Among Single-Parent Households in Vermilion
According to the poverty data in Vermilion, 25.0% or 17 single-father households and 11.9% or 65 single-mother households are living below the poverty line. Among single-father households, those with 1 or 2 children have the highest poverty rate, with 17 households (48.6%) experiencing poverty. Likewise, among single-mother households, those with 3 or 4 children have the highest poverty rate, with 27 households (69.2%) falling below the poverty line.
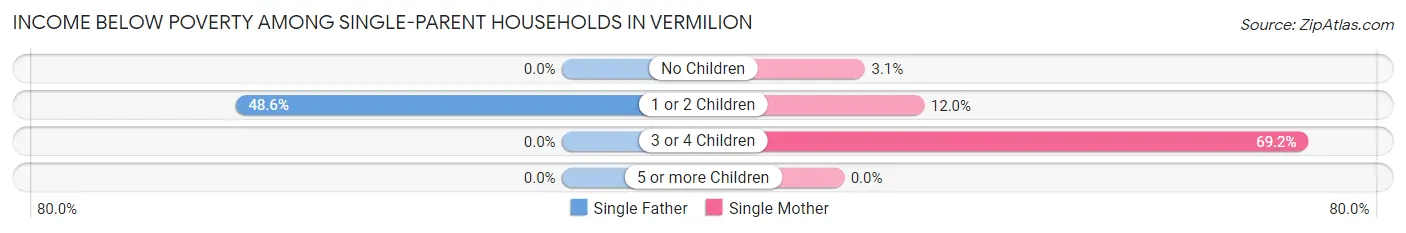
| Children | Single Father | Single Mother |
| No Children | 0 (0.0%) | 8 (3.1%) |
| 1 or 2 Children | 17 (48.6%) | 30 (11.9%) |
| 3 or 4 Children | 0 (0.0%) | 27 (69.2%) |
| 5 or more Children | 0 (0.0%) | 0 (0.0%) |
| Total | 17 (25.0%) | 65 (11.9%) |
Income Below Poverty Among Married-Couple vs Single-Parent Households in Vermilion
The poverty data for Vermilion shows that 13 of the married-couple family households (0.6%) and 82 of the single-parent households (13.3%) are living below the poverty level. Within the married-couple family households, those with no children have the highest poverty rate, with 13 households (1.0%) falling below the poverty line. Among the single-parent households, those with 3 or 4 children have the highest poverty rate, with 27 household (60.0%) living below poverty.
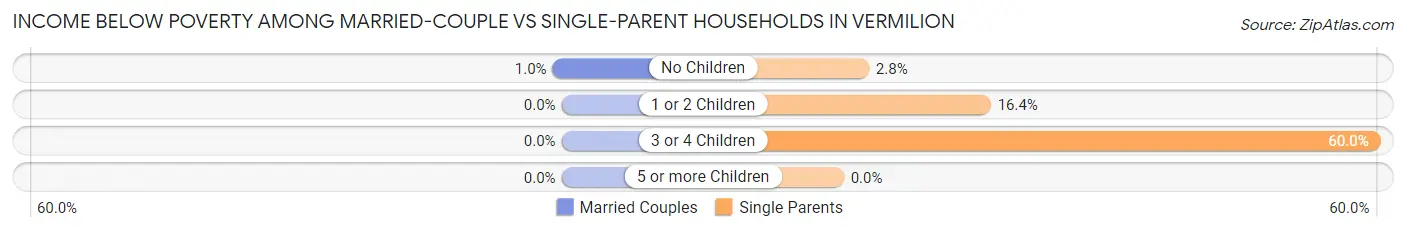
| Children | Married-Couple Families | Single-Parent Households |
| No Children | 13 (1.0%) | 8 (2.8%) |
| 1 or 2 Children | 0 (0.0%) | 47 (16.4%) |
| 3 or 4 Children | 0 (0.0%) | 27 (60.0%) |
| 5 or more Children | 0 (0.0%) | 0 (0.0%) |
| Total | 13 (0.6%) | 82 (13.3%) |
Race in Vermilion
The most populous races in Vermilion are White / Caucasian (9,938 | 95.0%), Hispanic or Latino (539 | 5.1%), and Two or more Races (362 | 3.5%).
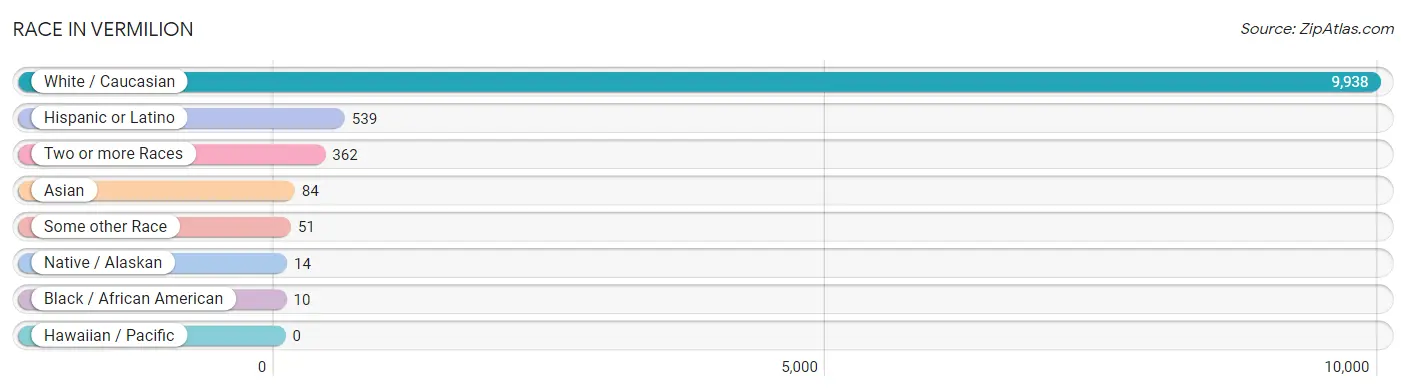
| Race | # Population | % Population |
| Asian | 84 | 0.8% |
| Black / African American | 10 | 0.1% |
| Hawaiian / Pacific | 0 | 0.0% |
| Hispanic or Latino | 539 | 5.1% |
| Native / Alaskan | 14 | 0.1% |
| White / Caucasian | 9,938 | 95.0% |
| Two or more Races | 362 | 3.5% |
| Some other Race | 51 | 0.5% |
| Total | 10,459 | 100.0% |
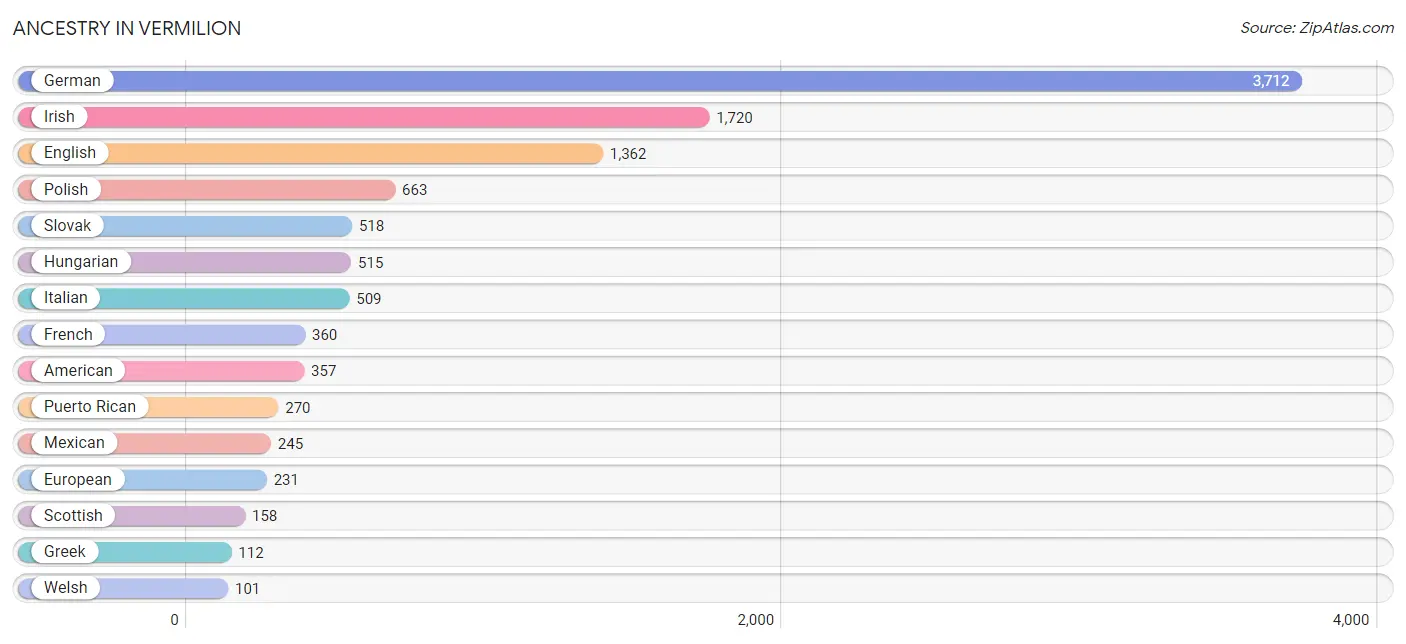
Ancestry in Vermilion
The most populous ancestries reported in Vermilion are German (3,712 | 35.5%), Irish (1,720 | 16.5%), English (1,362 | 13.0%), Polish (663 | 6.3%), and Slovak (518 | 5.0%), together accounting for 76.2% of all Vermilion residents.
| Ancestry | # Population | % Population |
| American | 357 | 3.4% |
| Arab | 28 | 0.3% |
| Austrian | 56 | 0.5% |
| Bhutanese | 19 | 0.2% |
| Blackfeet | 8 | 0.1% |
| British | 18 | 0.2% |
| Bulgarian | 12 | 0.1% |
| Burmese | 91 | 0.9% |
| Celtic | 10 | 0.1% |
| Cherokee | 45 | 0.4% |
| Choctaw | 14 | 0.1% |
| Colombian | 14 | 0.1% |
| Croatian | 14 | 0.1% |
| Cuban | 10 | 0.1% |
| Czech | 97 | 0.9% |
| Dutch | 84 | 0.8% |
| Eastern European | 56 | 0.5% |
| English | 1,362 | 13.0% |
| European | 231 | 2.2% |
| French | 360 | 3.4% |
| German | 3,712 | 35.5% |
| Greek | 112 | 1.1% |
| Hungarian | 515 | 4.9% |
| Indian (Asian) | 19 | 0.2% |
| Irish | 1,720 | 16.5% |
| Italian | 509 | 4.9% |
| Lebanese | 16 | 0.2% |
| Luxembourger | 20 | 0.2% |
| Mexican | 245 | 2.3% |
| Norwegian | 40 | 0.4% |
| Pakistani | 12 | 0.1% |
| Polish | 663 | 6.3% |
| Puerto Rican | 270 | 2.6% |
| Russian | 27 | 0.3% |
| Scotch-Irish | 82 | 0.8% |
| Scottish | 158 | 1.5% |
| Serbian | 46 | 0.4% |
| Slovak | 518 | 5.0% |
| Slovene | 79 | 0.8% |
| South American | 14 | 0.1% |
| Swedish | 31 | 0.3% |
| Swiss | 73 | 0.7% |
| Syrian | 12 | 0.1% |
| Thai | 39 | 0.4% |
| Ukrainian | 66 | 0.6% |
| Welsh | 101 | 1.0% | View All 46 Rows |
Immigrants in Vermilion
The most numerous immigrant groups reported in Vermilion came from Asia (32 | 0.3%), Europe (28 | 0.3%), Netherlands (28 | 0.3%), Western Europe (28 | 0.3%), and Latin America (24 | 0.2%), together accounting for 1.4% of all Vermilion residents.
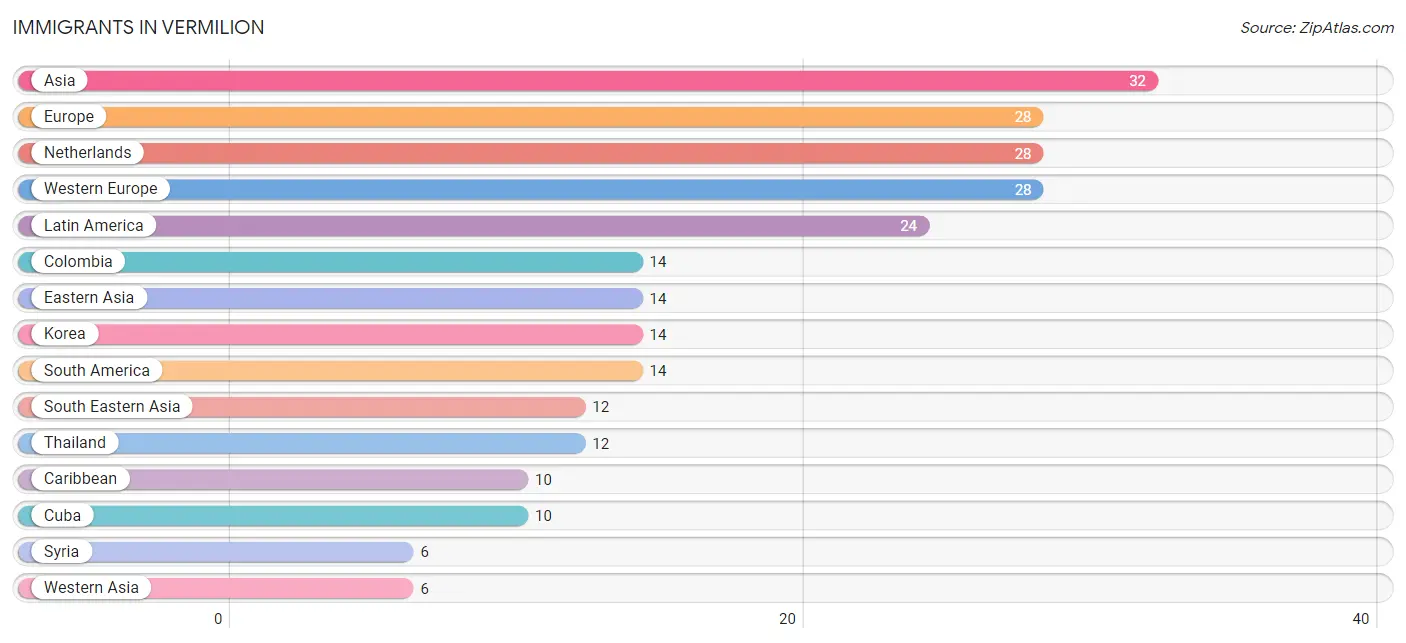
| Immigration Origin | # Population | % Population |
| Asia | 32 | 0.3% |
| Caribbean | 10 | 0.1% |
| Colombia | 14 | 0.1% |
| Cuba | 10 | 0.1% |
| Eastern Asia | 14 | 0.1% |
| Europe | 28 | 0.3% |
| Korea | 14 | 0.1% |
| Latin America | 24 | 0.2% |
| Netherlands | 28 | 0.3% |
| South America | 14 | 0.1% |
| South Eastern Asia | 12 | 0.1% |
| Syria | 6 | 0.1% |
| Thailand | 12 | 0.1% |
| Western Asia | 6 | 0.1% |
| Western Europe | 28 | 0.3% | View All 15 Rows |
Sex and Age in Vermilion
Sex and Age in Vermilion
The most populous age groups in Vermilion are 55 to 59 Years (580 | 11.6%) for men and 55 to 59 Years (485 | 8.9%) for women.
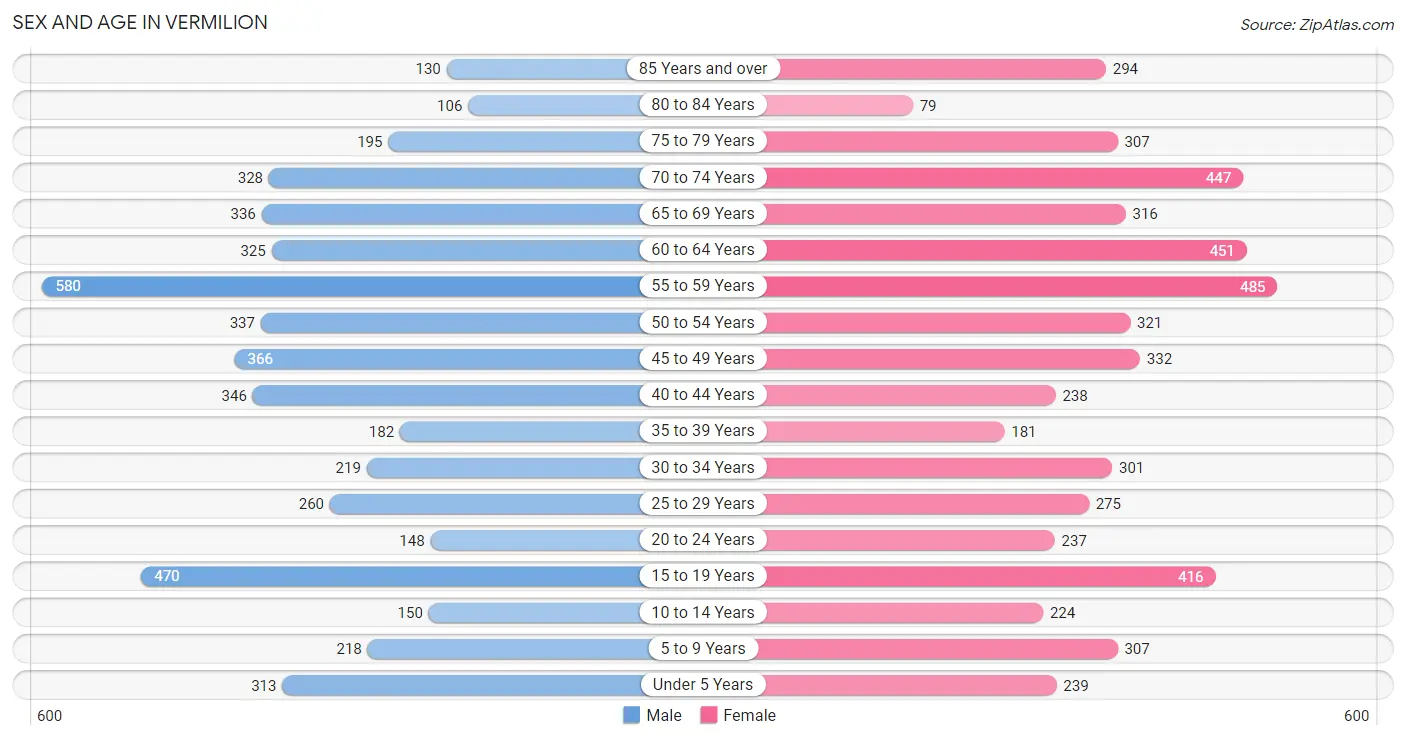
| Age Bracket | Male | Female |
| Under 5 Years | 313 (6.2%) | 239 (4.4%) |
| 5 to 9 Years | 218 (4.3%) | 307 (5.6%) |
| 10 to 14 Years | 150 (3.0%) | 224 (4.1%) |
| 15 to 19 Years | 470 (9.4%) | 416 (7.6%) |
| 20 to 24 Years | 148 (2.9%) | 237 (4.3%) |
| 25 to 29 Years | 260 (5.2%) | 275 (5.1%) |
| 30 to 34 Years | 219 (4.4%) | 301 (5.5%) |
| 35 to 39 Years | 182 (3.6%) | 181 (3.3%) |
| 40 to 44 Years | 346 (6.9%) | 238 (4.4%) |
| 45 to 49 Years | 366 (7.3%) | 332 (6.1%) |
| 50 to 54 Years | 337 (6.7%) | 321 (5.9%) |
| 55 to 59 Years | 580 (11.6%) | 485 (8.9%) |
| 60 to 64 Years | 325 (6.5%) | 451 (8.3%) |
| 65 to 69 Years | 336 (6.7%) | 316 (5.8%) |
| 70 to 74 Years | 328 (6.6%) | 447 (8.2%) |
| 75 to 79 Years | 195 (3.9%) | 307 (5.6%) |
| 80 to 84 Years | 106 (2.1%) | 79 (1.5%) |
| 85 Years and over | 130 (2.6%) | 294 (5.4%) |
| Total | 5,009 (100.0%) | 5,450 (100.0%) |
Families and Households in Vermilion
Median Family Size in Vermilion
The median family size in Vermilion is 2.87 persons per family, with married-couple families (2,230 | 78.4%) accounting for the largest median family size of 2.91 persons per family. On the other hand, single male/father families (68 | 2.4%) represent the smallest median family size with 2.35 persons per family.
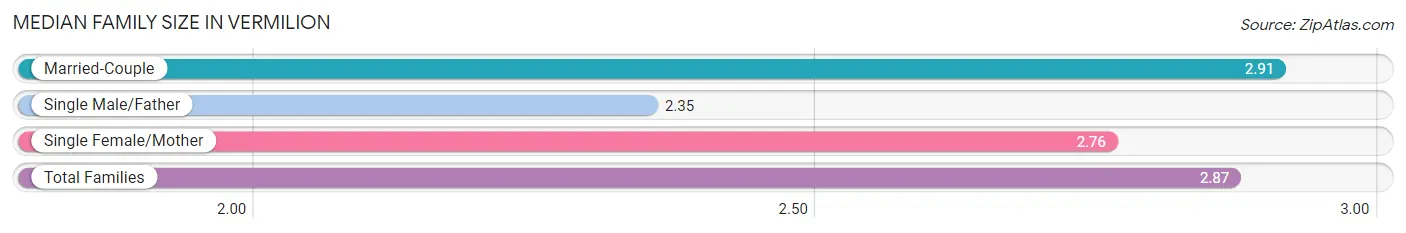
| Family Type | # Families | Family Size |
| Married-Couple | 2,230 (78.4%) | 2.91 |
| Single Male/Father | 68 (2.4%) | 2.35 |
| Single Female/Mother | 547 (19.2%) | 2.76 |
| Total Families | 2,845 (100.0%) | 2.87 |
Median Household Size in Vermilion
The median household size in Vermilion is 2.30 persons per household, with single female/mother households (547 | 12.2%) accounting for the largest median household size of 3.08 persons per household. non-family households (1,628 | 36.4%) represent the smallest median household size with 1.17 persons per household.
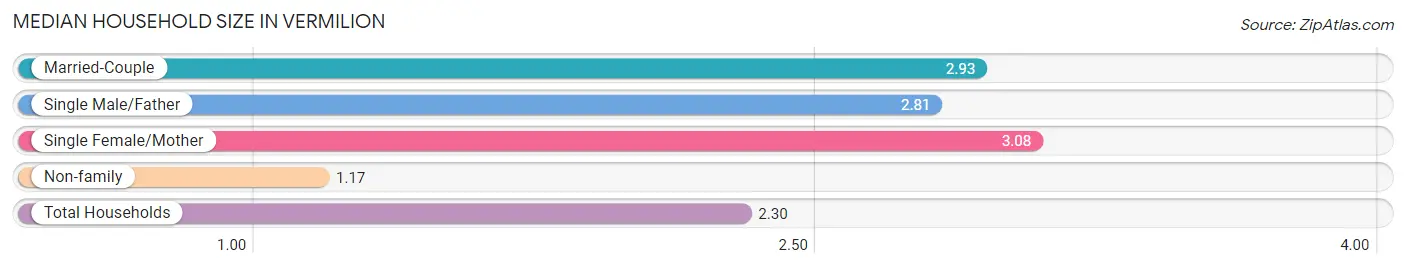
| Household Type | # Households | Household Size |
| Married-Couple | 2,230 (49.8%) | 2.93 |
| Single Male/Father | 68 (1.5%) | 2.81 |
| Single Female/Mother | 547 (12.2%) | 3.08 |
| Non-family | 1,628 (36.4%) | 1.17 |
| Total Households | 4,473 (100.0%) | 2.30 |
Household Size by Marriage Status in Vermilion
Out of a total of 4,473 households in Vermilion, 2,845 (63.6%) are family households, while 1,628 (36.4%) are nonfamily households. The most numerous type of family households are 2-person households, comprising 1,322, and the most common type of nonfamily households are 1-person households, comprising 1,358.
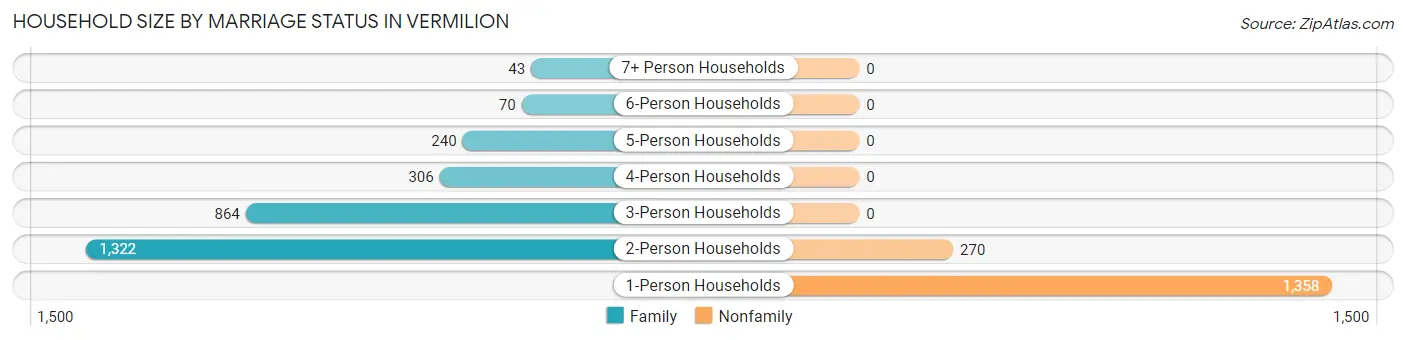
| Household Size | Family Households | Nonfamily Households |
| 1-Person Households | - | 1,358 (30.4%) |
| 2-Person Households | 1,322 (29.6%) | 270 (6.0%) |
| 3-Person Households | 864 (19.3%) | 0 (0.0%) |
| 4-Person Households | 306 (6.8%) | 0 (0.0%) |
| 5-Person Households | 240 (5.4%) | 0 (0.0%) |
| 6-Person Households | 70 (1.6%) | 0 (0.0%) |
| 7+ Person Households | 43 (1.0%) | 0 (0.0%) |
| Total | 2,845 (63.6%) | 1,628 (36.4%) |
Female Fertility in Vermilion
Fertility by Age in Vermilion
Average fertility rate in Vermilion is 64.0 births per 1,000 women. Women in the age bracket of 20 to 34 years have the highest fertility rate with 106.0 births per 1,000 women. Women in the age bracket of 20 to 34 years acount for 64.2% of all women with births.
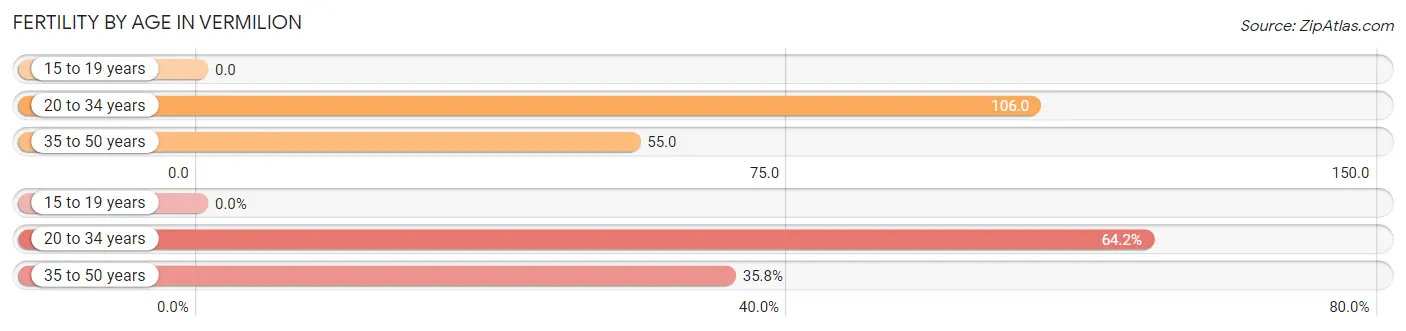
| Age Bracket | Women with Births | Births / 1,000 Women |
| 15 to 19 years | 0 (0.0%) | 0.0 |
| 20 to 34 years | 86 (64.2%) | 106.0 |
| 35 to 50 years | 48 (35.8%) | 55.0 |
| Total | 134 (100.0%) | 64.0 |
Fertility by Age by Marriage Status in Vermilion
35.8% of women with births (134) in Vermilion are married. The highest percentage of unmarried women with births falls into 20 to 34 years age bracket with 100.0% of them unmarried at the time of birth, while the lowest percentage of unmarried women with births belong to 35 to 50 years age bracket with 0.0% of them unmarried.
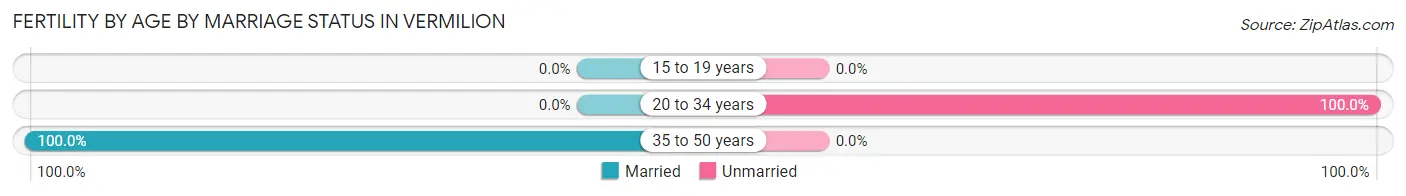
| Age Bracket | Married | Unmarried |
| 15 to 19 years | 0 (0.0%) | 0 (0.0%) |
| 20 to 34 years | 0 (0.0%) | 86 (100.0%) |
| 35 to 50 years | 48 (100.0%) | 0 (0.0%) |
| Total | 48 (35.8%) | 86 (64.2%) |
Fertility by Education in Vermilion
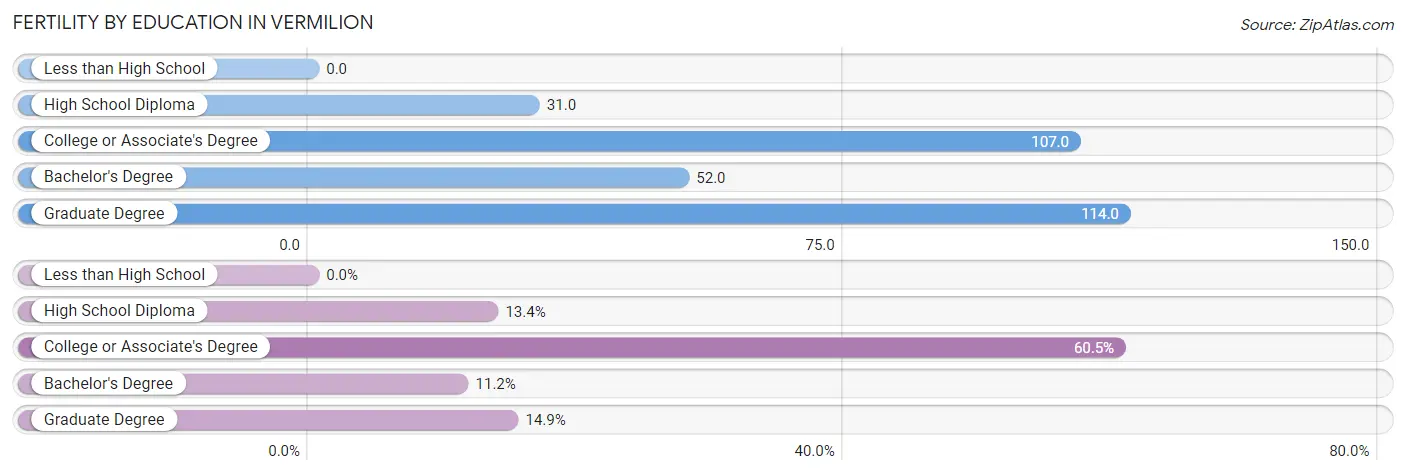
| Educational Attainment | Women with Births | Births / 1,000 Women |
| Less than High School | 0 (0.0%) | 0.0 |
| High School Diploma | 18 (13.4%) | 31.0 |
| College or Associate's Degree | 81 (60.5%) | 107.0 |
| Bachelor's Degree | 15 (11.2%) | 52.0 |
| Graduate Degree | 20 (14.9%) | 114.0 |
| Total | 134 (100.0%) | 64.0 |
Fertility by Education by Marriage Status in Vermilion
64.2% of women with births in Vermilion are unmarried. Women with the educational attainment of graduate degree are most likely to be married with 100.0% of them married at childbirth, while women with the educational attainment of high school diploma are least likely to be married with 100.0% of them unmarried at childbirth.
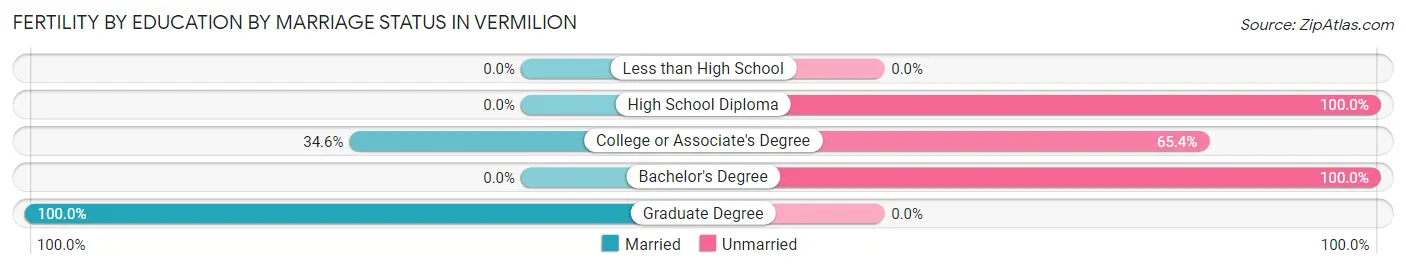
| Educational Attainment | Married | Unmarried |
| Less than High School | 0 (0.0%) | 0 (0.0%) |
| High School Diploma | 0 (0.0%) | 18 (100.0%) |
| College or Associate's Degree | 28 (34.6%) | 53 (65.4%) |
| Bachelor's Degree | 0 (0.0%) | 15 (100.0%) |
| Graduate Degree | 20 (100.0%) | 0 (0.0%) |
| Total | 48 (35.8%) | 86 (64.2%) |
Employment Characteristics in Vermilion
Employment by Class of Employer in Vermilion
Among the 5,074 employed individuals in Vermilion, private company employees (3,310 | 65.2%), not-for-profit organizations (643 | 12.7%), and local government employees (370 | 7.3%) make up the most common classes of employment.
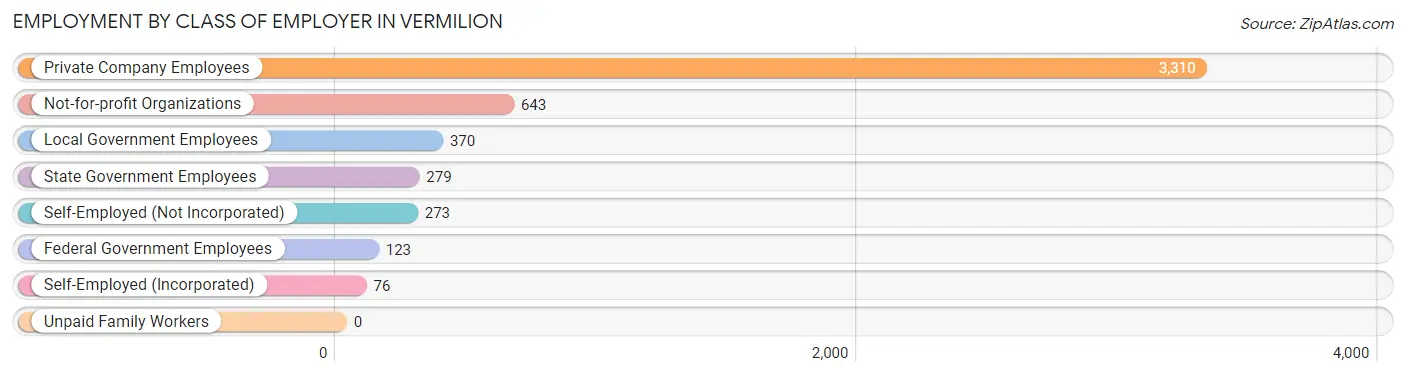
| Employer Class | # Employees | % Employees |
| Private Company Employees | 3,310 | 65.2% |
| Self-Employed (Incorporated) | 76 | 1.5% |
| Self-Employed (Not Incorporated) | 273 | 5.4% |
| Not-for-profit Organizations | 643 | 12.7% |
| Local Government Employees | 370 | 7.3% |
| State Government Employees | 279 | 5.5% |
| Federal Government Employees | 123 | 2.4% |
| Unpaid Family Workers | 0 | 0.0% |
| Total | 5,074 | 100.0% |
Employment Status by Age in Vermilion
According to the labor force statistics for Vermilion, out of the total population over 16 years of age (8,856), 61.1% or 5,411 individuals are in the labor force, with 3.0% or 162 of them unemployed. The age group with the highest labor force participation rate is 30 to 34 years, with 94.4% or 491 individuals in the labor force. Within the labor force, the 60 to 64 years age range has the highest percentage of unemployed individuals, with 8.0% or 36 of them being unemployed.
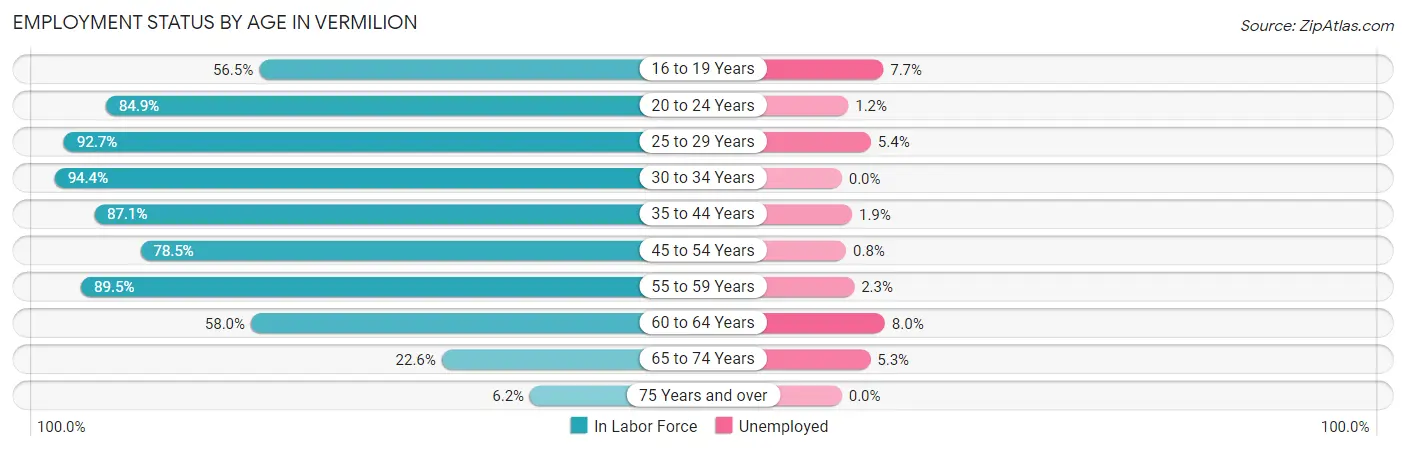
| Age Bracket | In Labor Force | Unemployed |
| 16 to 19 Years | 415 (56.5%) | 32 (7.7%) |
| 20 to 24 Years | 327 (84.9%) | 4 (1.2%) |
| 25 to 29 Years | 496 (92.7%) | 27 (5.4%) |
| 30 to 34 Years | 491 (94.4%) | 0 (0.0%) |
| 35 to 44 Years | 825 (87.1%) | 16 (1.9%) |
| 45 to 54 Years | 1,064 (78.5%) | 9 (0.8%) |
| 55 to 59 Years | 953 (89.5%) | 22 (2.3%) |
| 60 to 64 Years | 450 (58.0%) | 36 (8.0%) |
| 65 to 74 Years | 323 (22.6%) | 17 (5.3%) |
| 75 Years and over | 69 (6.2%) | 0 (0.0%) |
| Total | 5,411 (61.1%) | 162 (3.0%) |
Employment Status by Educational Attainment in Vermilion
According to labor force statistics for Vermilion, 82.3% of individuals (4,279) out of the total population between 25 and 64 years of age (5,199) are in the labor force, with 2.5% or 107 of them being unemployed. The group with the highest labor force participation rate are those with the educational attainment of college / associate degree, with 86.4% or 1,610 individuals in the labor force. Within the labor force, individuals with college / associate degree education have the highest percentage of unemployment, with 3.7% or 60 of them being unemployed.
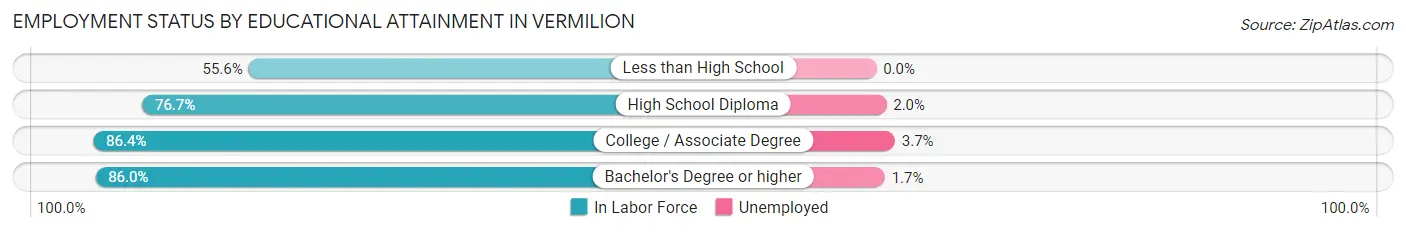
| Educational Attainment | In Labor Force | Unemployed |
| Less than High School | 74 (55.6%) | 0 (0.0%) |
| High School Diploma | 1,319 (76.7%) | 34 (2.0%) |
| College / Associate Degree | 1,610 (86.4%) | 69 (3.7%) |
| Bachelor's Degree or higher | 1,275 (86.0%) | 25 (1.7%) |
| Total | 4,279 (82.3%) | 130 (2.5%) |
Employment Occupations by Sex in Vermilion
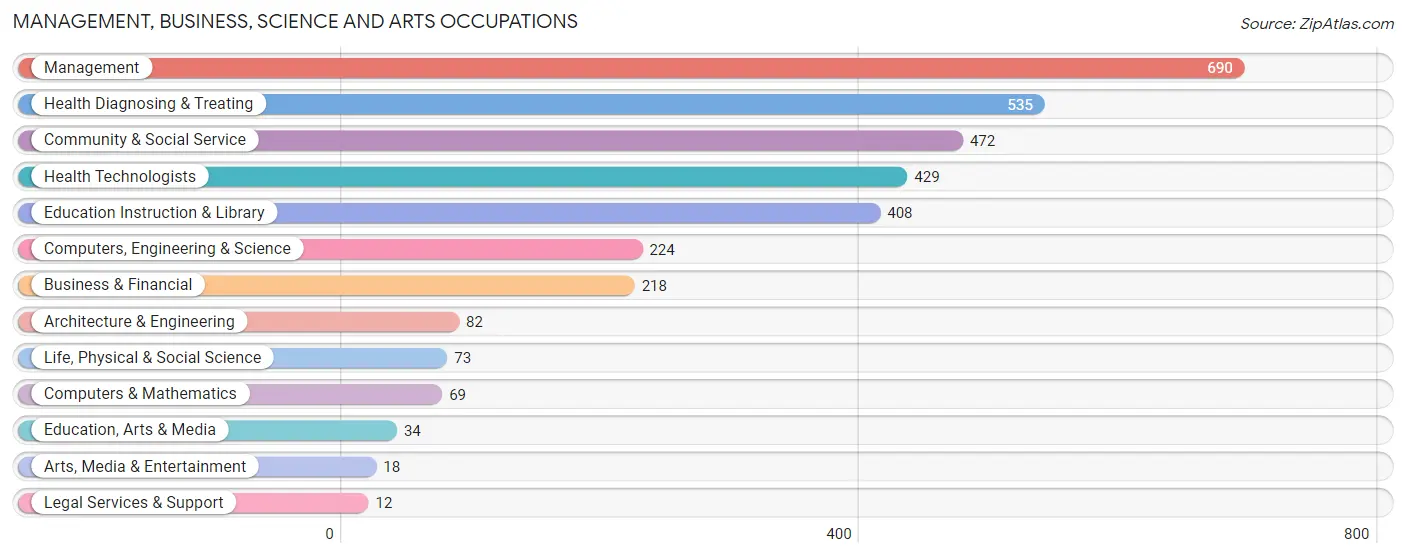
Management, Business, Science and Arts Occupations
The most common Management, Business, Science and Arts occupations in Vermilion are Management (690 | 13.1%), Health Diagnosing & Treating (535 | 10.2%), Community & Social Service (472 | 9.0%), Health Technologists (429 | 8.2%), and Education Instruction & Library (408 | 7.8%).
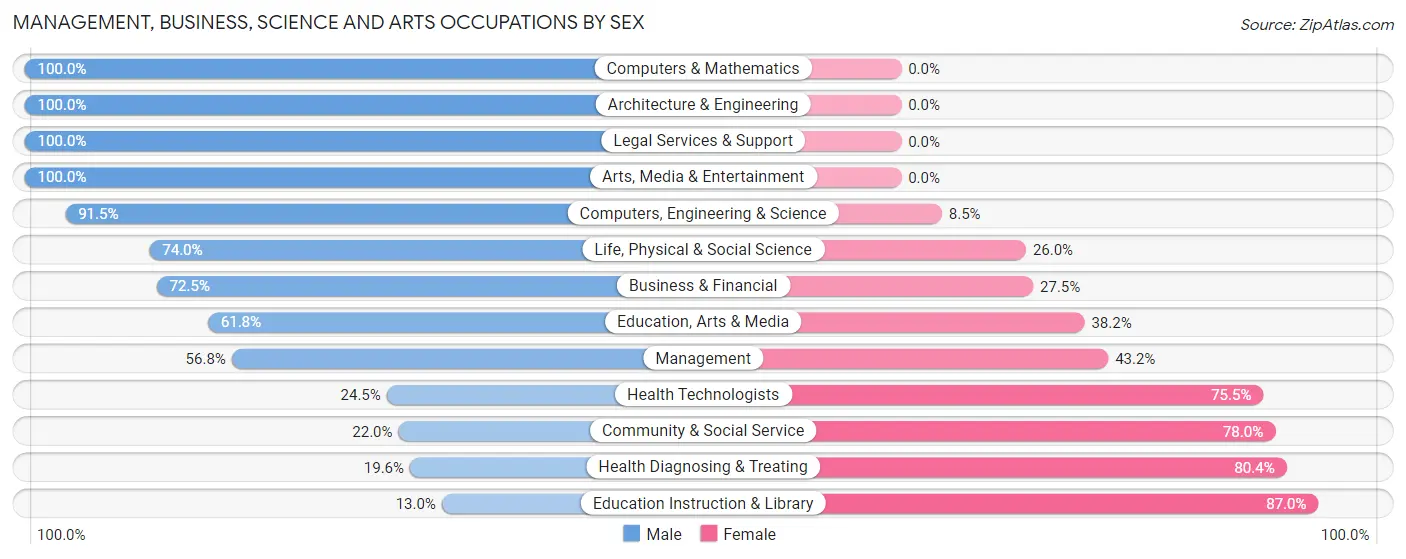
Management, Business, Science and Arts Occupations by Sex
Within the Management, Business, Science and Arts occupations in Vermilion, the most male-oriented occupations are Computers & Mathematics (100.0%), Architecture & Engineering (100.0%), and Legal Services & Support (100.0%), while the most female-oriented occupations are Education Instruction & Library (87.0%), Health Diagnosing & Treating (80.4%), and Community & Social Service (78.0%).
| Occupation | Male | Female |
| Management | 392 (56.8%) | 298 (43.2%) |
| Business & Financial | 158 (72.5%) | 60 (27.5%) |
| Computers, Engineering & Science | 205 (91.5%) | 19 (8.5%) |
| Computers & Mathematics | 69 (100.0%) | 0 (0.0%) |
| Architecture & Engineering | 82 (100.0%) | 0 (0.0%) |
| Life, Physical & Social Science | 54 (74.0%) | 19 (26.0%) |
| Community & Social Service | 104 (22.0%) | 368 (78.0%) |
| Education, Arts & Media | 21 (61.8%) | 13 (38.2%) |
| Legal Services & Support | 12 (100.0%) | 0 (0.0%) |
| Education Instruction & Library | 53 (13.0%) | 355 (87.0%) |
| Arts, Media & Entertainment | 18 (100.0%) | 0 (0.0%) |
| Health Diagnosing & Treating | 105 (19.6%) | 430 (80.4%) |
| Health Technologists | 105 (24.5%) | 324 (75.5%) |
| Total (Category) | 964 (45.1%) | 1,175 (54.9%) |
| Total (Overall) | 2,771 (52.8%) | 2,480 (47.2%) |
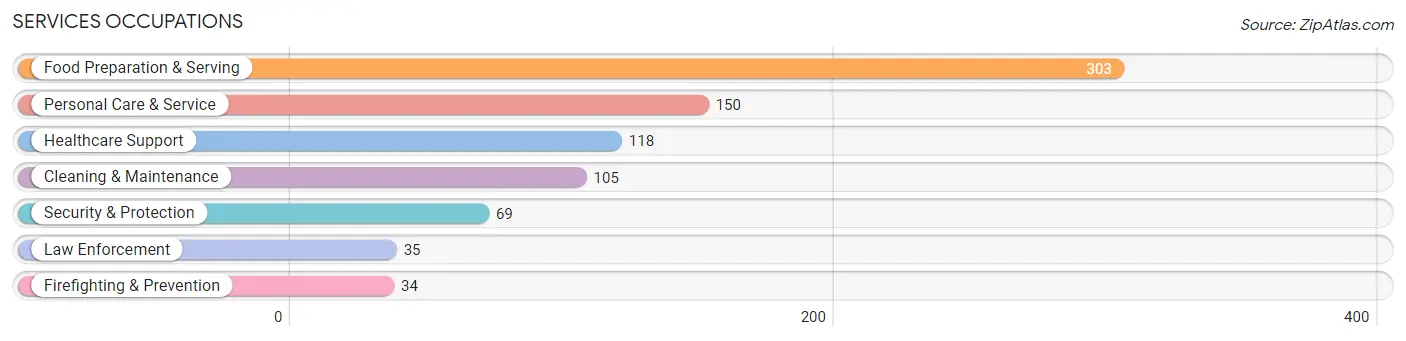
Services Occupations
The most common Services occupations in Vermilion are Food Preparation & Serving (303 | 5.8%), Personal Care & Service (150 | 2.9%), Healthcare Support (118 | 2.2%), Cleaning & Maintenance (105 | 2.0%), and Security & Protection (69 | 1.3%).
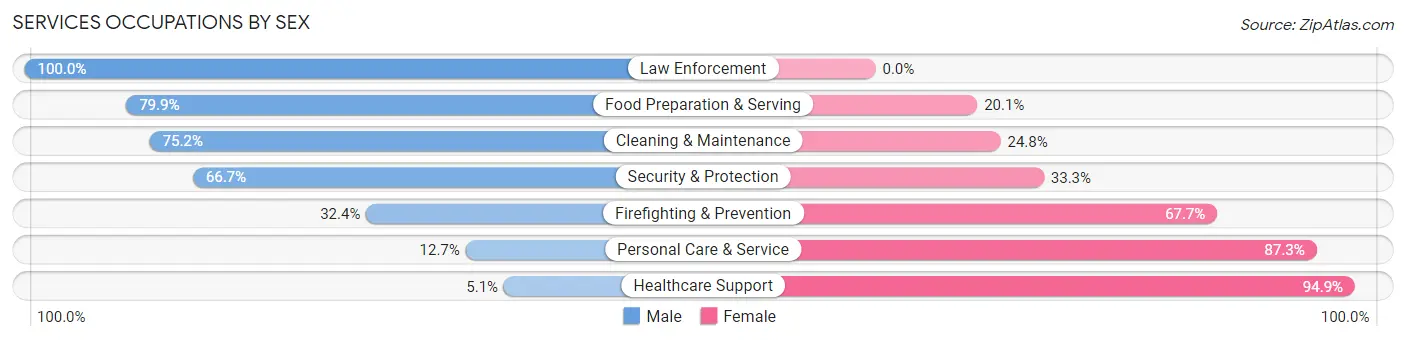
Services Occupations by Sex
Within the Services occupations in Vermilion, the most male-oriented occupations are Law Enforcement (100.0%), Food Preparation & Serving (79.9%), and Cleaning & Maintenance (75.2%), while the most female-oriented occupations are Healthcare Support (94.9%), Personal Care & Service (87.3%), and Firefighting & Prevention (67.6%).
| Occupation | Male | Female |
| Healthcare Support | 6 (5.1%) | 112 (94.9%) |
| Security & Protection | 46 (66.7%) | 23 (33.3%) |
| Firefighting & Prevention | 11 (32.4%) | 23 (67.6%) |
| Law Enforcement | 35 (100.0%) | 0 (0.0%) |
| Food Preparation & Serving | 242 (79.9%) | 61 (20.1%) |
| Cleaning & Maintenance | 79 (75.2%) | 26 (24.8%) |
| Personal Care & Service | 19 (12.7%) | 131 (87.3%) |
| Total (Category) | 392 (52.6%) | 353 (47.4%) |
| Total (Overall) | 2,771 (52.8%) | 2,480 (47.2%) |
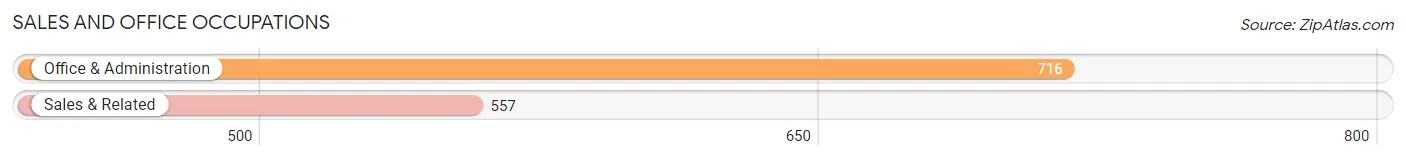
Sales and Office Occupations
The most common Sales and Office occupations in Vermilion are Office & Administration (716 | 13.6%), and Sales & Related (557 | 10.6%).
Sales and Office Occupations by Sex
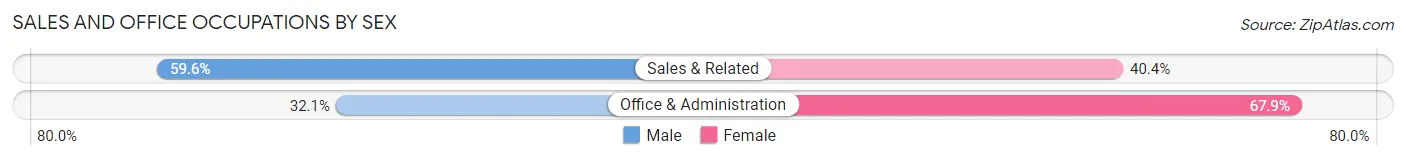
| Occupation | Male | Female |
| Sales & Related | 332 (59.6%) | 225 (40.4%) |
| Office & Administration | 230 (32.1%) | 486 (67.9%) |
| Total (Category) | 562 (44.2%) | 711 (55.8%) |
| Total (Overall) | 2,771 (52.8%) | 2,480 (47.2%) |
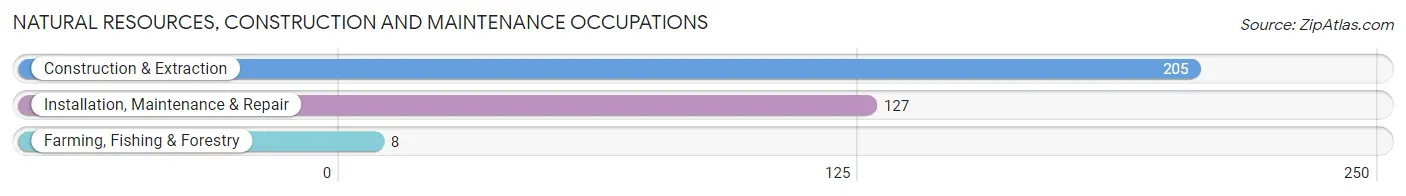
Natural Resources, Construction and Maintenance Occupations
The most common Natural Resources, Construction and Maintenance occupations in Vermilion are Construction & Extraction (205 | 3.9%), Installation, Maintenance & Repair (127 | 2.4%), and Farming, Fishing & Forestry (8 | 0.2%).
Natural Resources, Construction and Maintenance Occupations by Sex
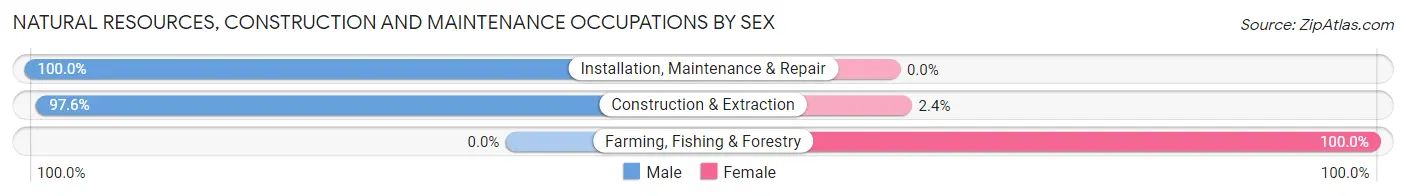
| Occupation | Male | Female |
| Farming, Fishing & Forestry | 0 (0.0%) | 8 (100.0%) |
| Construction & Extraction | 200 (97.6%) | 5 (2.4%) |
| Installation, Maintenance & Repair | 127 (100.0%) | 0 (0.0%) |
| Total (Category) | 327 (96.2%) | 13 (3.8%) |
| Total (Overall) | 2,771 (52.8%) | 2,480 (47.2%) |
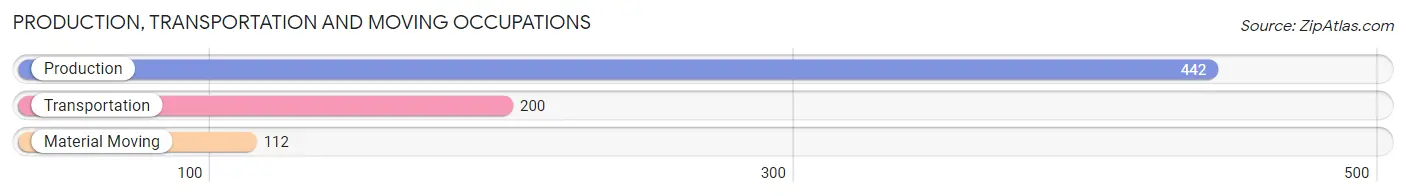
Production, Transportation and Moving Occupations
The most common Production, Transportation and Moving occupations in Vermilion are Production (442 | 8.4%), Transportation (200 | 3.8%), and Material Moving (112 | 2.1%).
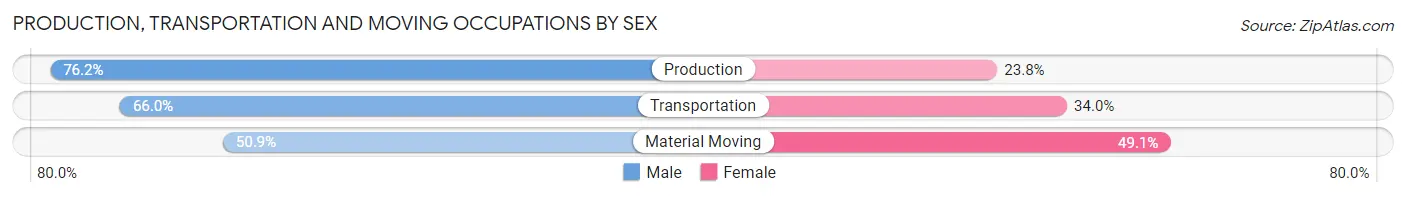
Production, Transportation and Moving Occupations by Sex
| Occupation | Male | Female |
| Production | 337 (76.2%) | 105 (23.8%) |
| Transportation | 132 (66.0%) | 68 (34.0%) |
| Material Moving | 57 (50.9%) | 55 (49.1%) |
| Total (Category) | 526 (69.8%) | 228 (30.2%) |
| Total (Overall) | 2,771 (52.8%) | 2,480 (47.2%) |
Employment Industries by Sex in Vermilion
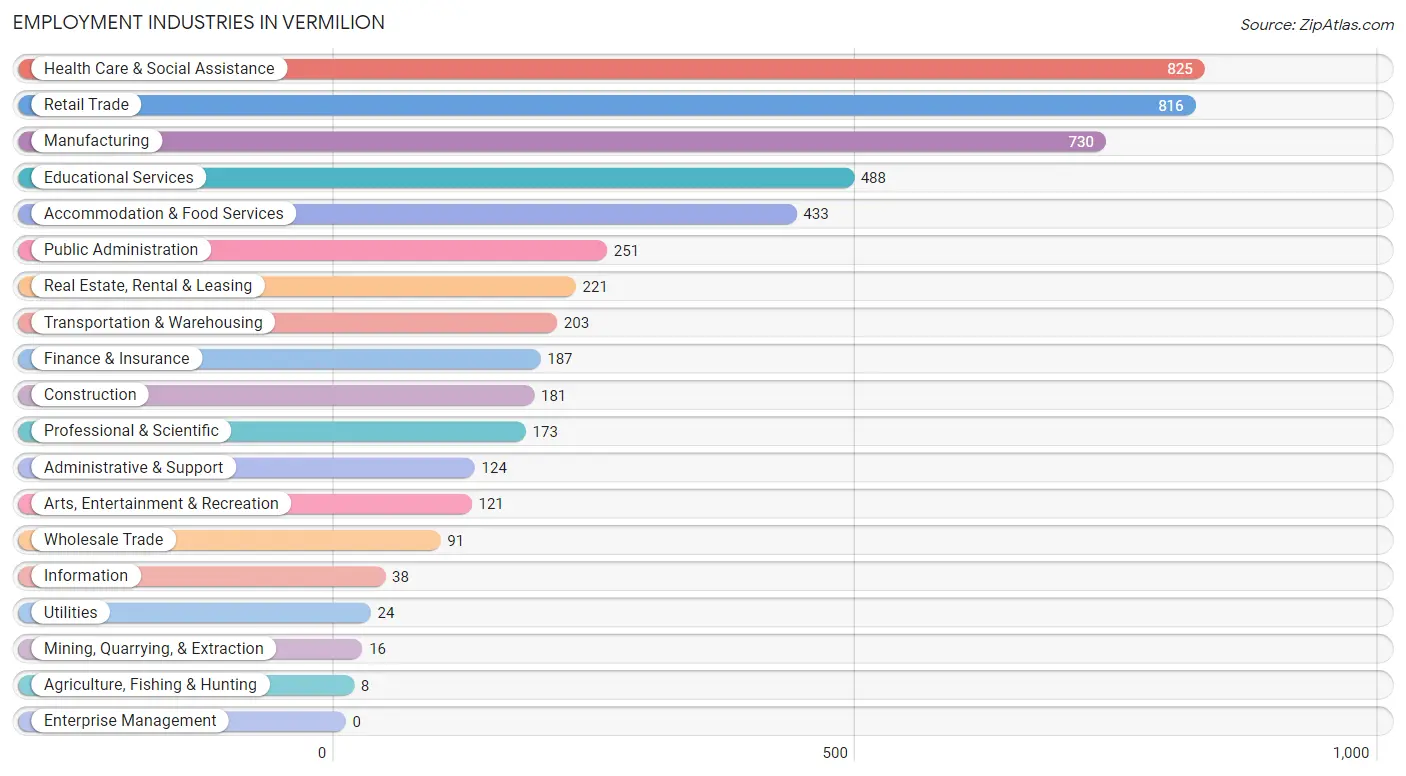
Employment Industries in Vermilion
The major employment industries in Vermilion include Health Care & Social Assistance (825 | 15.7%), Retail Trade (816 | 15.5%), Manufacturing (730 | 13.9%), Educational Services (488 | 9.3%), and Accommodation & Food Services (433 | 8.3%).
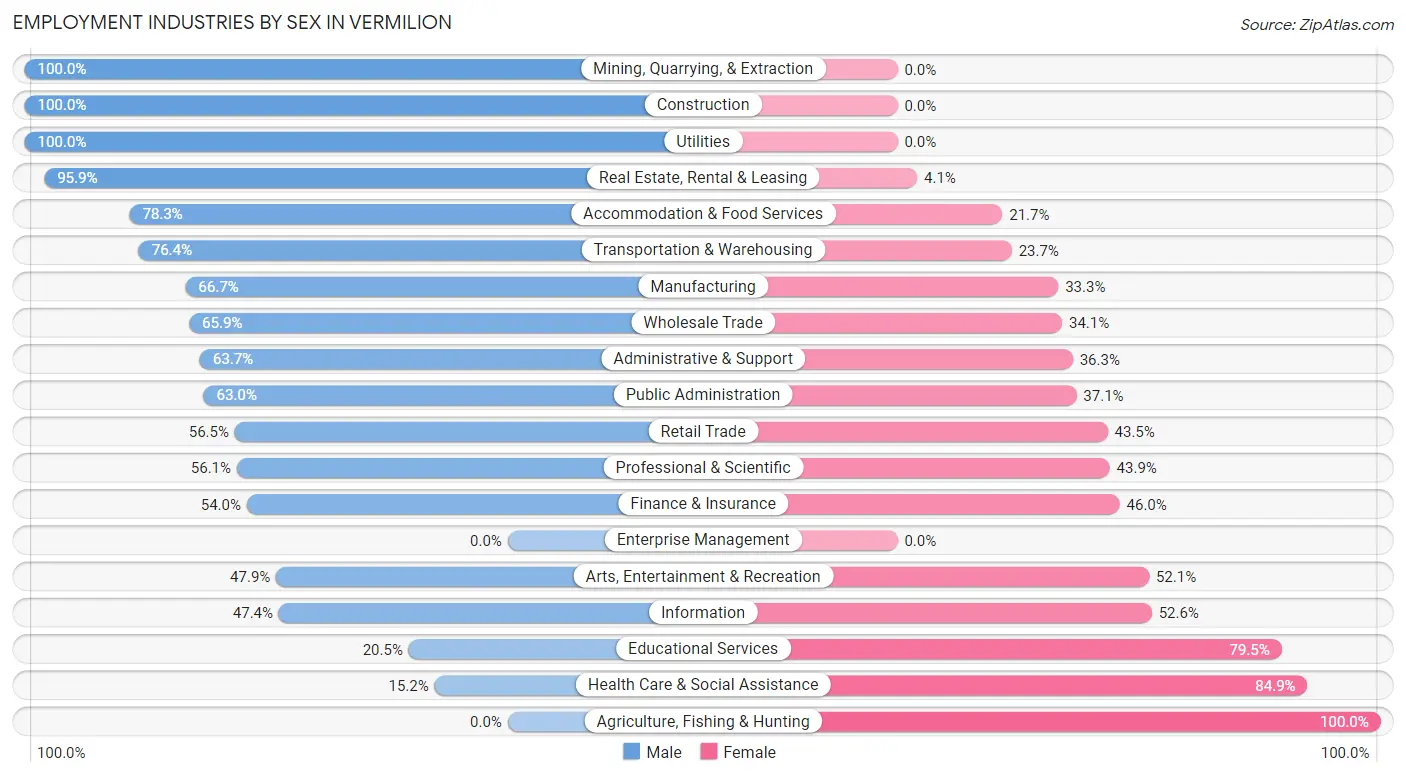
Employment Industries by Sex in Vermilion
The Vermilion industries that see more men than women are Mining, Quarrying, & Extraction (100.0%), Construction (100.0%), and Utilities (100.0%), whereas the industries that tend to have a higher number of women are Agriculture, Fishing & Hunting (100.0%), Health Care & Social Assistance (84.9%), and Educational Services (79.5%).
| Industry | Male | Female |
| Agriculture, Fishing & Hunting | 0 (0.0%) | 8 (100.0%) |
| Mining, Quarrying, & Extraction | 16 (100.0%) | 0 (0.0%) |
| Construction | 181 (100.0%) | 0 (0.0%) |
| Manufacturing | 487 (66.7%) | 243 (33.3%) |
| Wholesale Trade | 60 (65.9%) | 31 (34.1%) |
| Retail Trade | 461 (56.5%) | 355 (43.5%) |
| Transportation & Warehousing | 155 (76.3%) | 48 (23.6%) |
| Utilities | 24 (100.0%) | 0 (0.0%) |
| Information | 18 (47.4%) | 20 (52.6%) |
| Finance & Insurance | 101 (54.0%) | 86 (46.0%) |
| Real Estate, Rental & Leasing | 212 (95.9%) | 9 (4.1%) |
| Professional & Scientific | 97 (56.1%) | 76 (43.9%) |
| Enterprise Management | 0 (0.0%) | 0 (0.0%) |
| Administrative & Support | 79 (63.7%) | 45 (36.3%) |
| Educational Services | 100 (20.5%) | 388 (79.5%) |
| Health Care & Social Assistance | 125 (15.1%) | 700 (84.9%) |
| Arts, Entertainment & Recreation | 58 (47.9%) | 63 (52.1%) |
| Accommodation & Food Services | 339 (78.3%) | 94 (21.7%) |
| Public Administration | 158 (62.9%) | 93 (37.0%) |
| Total | 2,771 (52.8%) | 2,480 (47.2%) |
Education in Vermilion
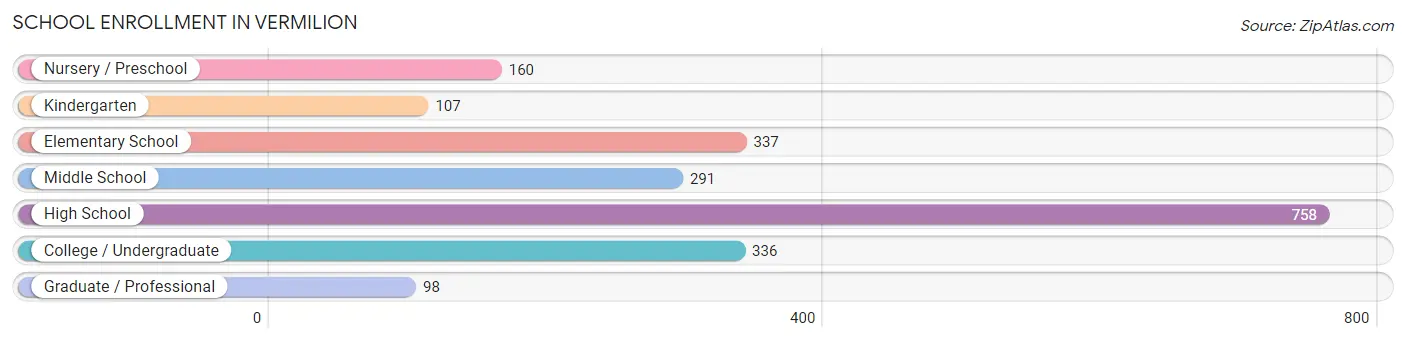
School Enrollment in Vermilion
The most common levels of schooling among the 2,087 students in Vermilion are high school (758 | 36.3%), elementary school (337 | 16.2%), and college / undergraduate (336 | 16.1%).
| School Level | # Students | % Students |
| Nursery / Preschool | 160 | 7.7% |
| Kindergarten | 107 | 5.1% |
| Elementary School | 337 | 16.2% |
| Middle School | 291 | 13.9% |
| High School | 758 | 36.3% |
| College / Undergraduate | 336 | 16.1% |
| Graduate / Professional | 98 | 4.7% |
| Total | 2,087 | 100.0% |
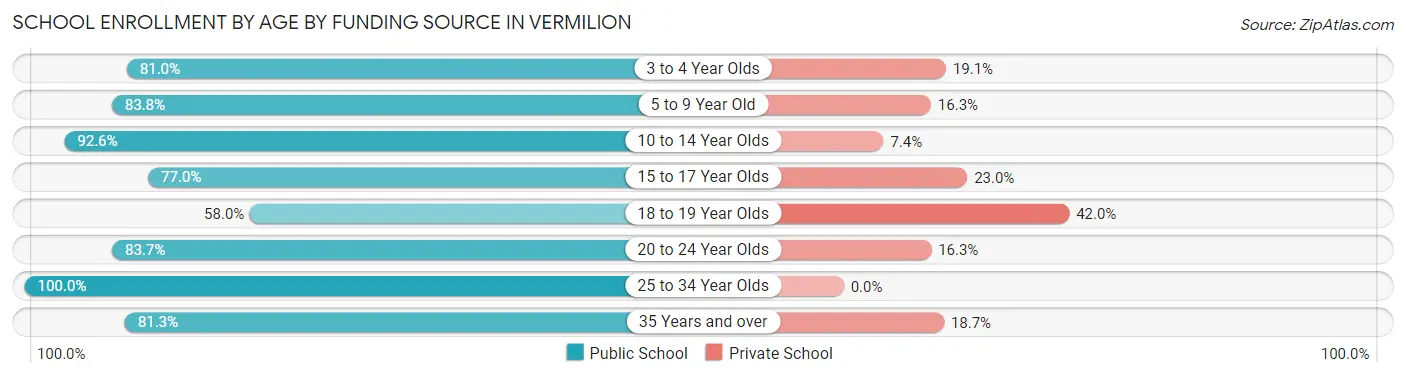
School Enrollment by Age by Funding Source in Vermilion
Out of a total of 2,087 students who are enrolled in schools in Vermilion, 397 (19.0%) attend a private institution, while the remaining 1,690 (81.0%) are enrolled in public schools. The age group of 18 to 19 year olds has the highest likelihood of being enrolled in private schools, with 113 (42.0% in the age bracket) enrolled. Conversely, the age group of 25 to 34 year olds has the lowest likelihood of being enrolled in a private school, with 169 (100.0% in the age bracket) attending a public institution.
| Age Bracket | Public School | Private School |
| 3 to 4 Year Olds | 119 (80.9%) | 28 (19.1%) |
| 5 to 9 Year Old | 371 (83.8%) | 72 (16.3%) |
| 10 to 14 Year Olds | 300 (92.6%) | 24 (7.4%) |
| 15 to 17 Year Olds | 425 (77.0%) | 127 (23.0%) |
| 18 to 19 Year Olds | 156 (58.0%) | 113 (42.0%) |
| 20 to 24 Year Olds | 77 (83.7%) | 15 (16.3%) |
| 25 to 34 Year Olds | 169 (100.0%) | 0 (0.0%) |
| 35 Years and over | 74 (81.3%) | 17 (18.7%) |
| Total | 1,690 (81.0%) | 397 (19.0%) |
Educational Attainment by Field of Study in Vermilion
Education (585 | 23.3%), business (561 | 22.4%), science & technology (472 | 18.8%), bio, nature & agricultural (169 | 6.7%), and arts & humanities (157 | 6.3%) are the most common fields of study among 2,506 individuals in Vermilion who have obtained a bachelor's degree or higher.
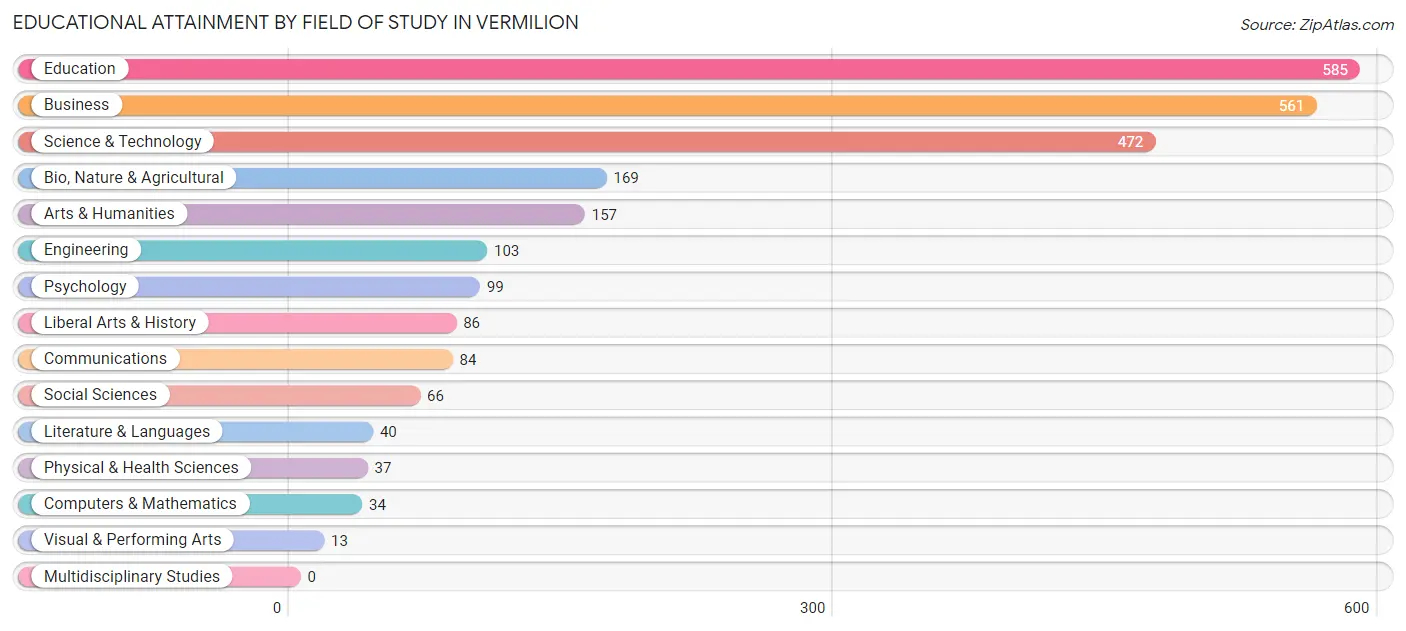
| Field of Study | # Graduates | % Graduates |
| Computers & Mathematics | 34 | 1.4% |
| Bio, Nature & Agricultural | 169 | 6.7% |
| Physical & Health Sciences | 37 | 1.5% |
| Psychology | 99 | 4.0% |
| Social Sciences | 66 | 2.6% |
| Engineering | 103 | 4.1% |
| Multidisciplinary Studies | 0 | 0.0% |
| Science & Technology | 472 | 18.8% |
| Business | 561 | 22.4% |
| Education | 585 | 23.3% |
| Literature & Languages | 40 | 1.6% |
| Liberal Arts & History | 86 | 3.4% |
| Visual & Performing Arts | 13 | 0.5% |
| Communications | 84 | 3.4% |
| Arts & Humanities | 157 | 6.3% |
| Total | 2,506 | 100.0% |
Transportation & Commute in Vermilion
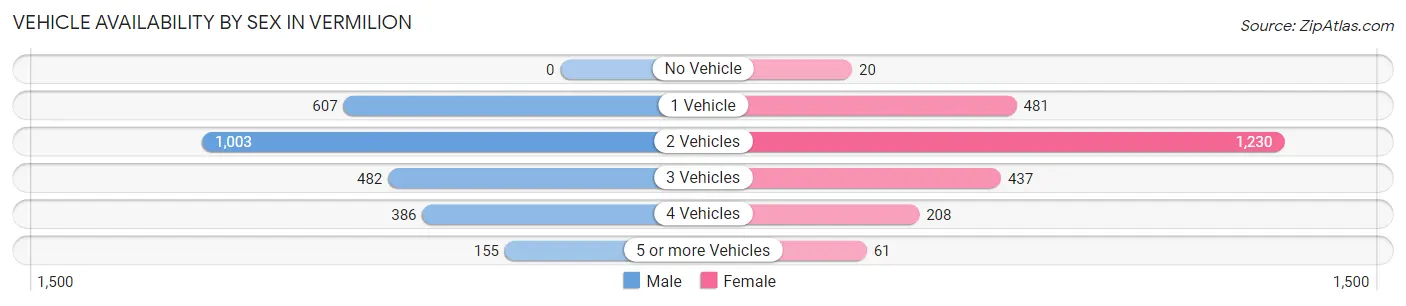
Vehicle Availability by Sex in Vermilion
The most prevalent vehicle ownership categories in Vermilion are males with 2 vehicles (1,003, accounting for 38.1%) and females with 2 vehicles (1,230, making up 41.2%).
| Vehicles Available | Male | Female |
| No Vehicle | 0 (0.0%) | 20 (0.8%) |
| 1 Vehicle | 607 (23.1%) | 481 (19.7%) |
| 2 Vehicles | 1,003 (38.1%) | 1,230 (50.5%) |
| 3 Vehicles | 482 (18.3%) | 437 (17.9%) |
| 4 Vehicles | 386 (14.7%) | 208 (8.5%) |
| 5 or more Vehicles | 155 (5.9%) | 61 (2.5%) |
| Total | 2,633 (100.0%) | 2,437 (100.0%) |
Commute Time in Vermilion
The most frequently occuring commute durations in Vermilion are 20 to 24 minutes (748 commuters, 15.9%), 30 to 34 minutes (710 commuters, 15.1%), and 25 to 29 minutes (602 commuters, 12.8%).
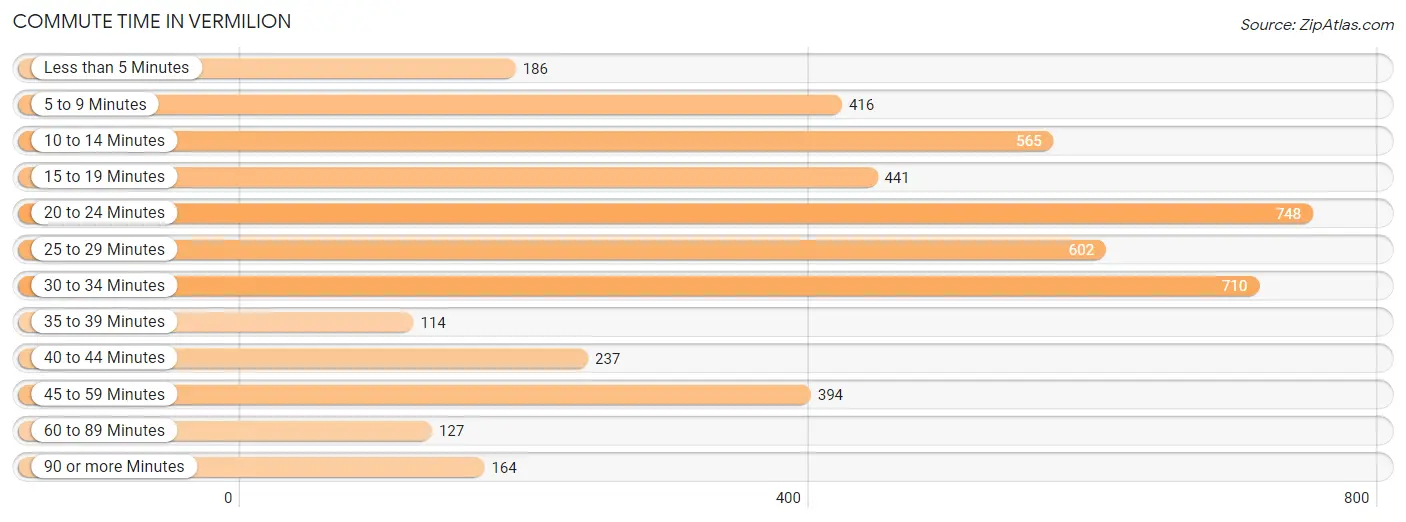
| Commute Time | # Commuters | % Commuters |
| Less than 5 Minutes | 186 | 4.0% |
| 5 to 9 Minutes | 416 | 8.8% |
| 10 to 14 Minutes | 565 | 12.0% |
| 15 to 19 Minutes | 441 | 9.4% |
| 20 to 24 Minutes | 748 | 15.9% |
| 25 to 29 Minutes | 602 | 12.8% |
| 30 to 34 Minutes | 710 | 15.1% |
| 35 to 39 Minutes | 114 | 2.4% |
| 40 to 44 Minutes | 237 | 5.0% |
| 45 to 59 Minutes | 394 | 8.4% |
| 60 to 89 Minutes | 127 | 2.7% |
| 90 or more Minutes | 164 | 3.5% |
Commute Time by Sex in Vermilion
The most common commute times in Vermilion are 20 to 24 minutes (455 commuters, 18.3%) for males and 25 to 29 minutes (302 commuters, 13.6%) for females.
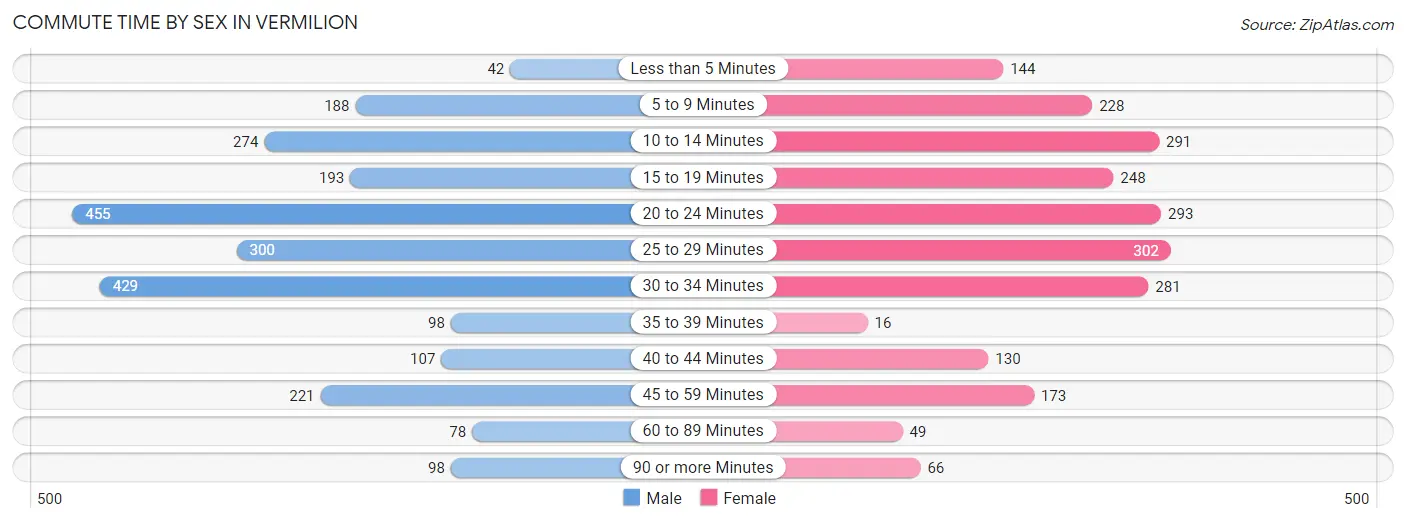
| Commute Time | Male | Female |
| Less than 5 Minutes | 42 (1.7%) | 144 (6.5%) |
| 5 to 9 Minutes | 188 (7.6%) | 228 (10.3%) |
| 10 to 14 Minutes | 274 (11.0%) | 291 (13.1%) |
| 15 to 19 Minutes | 193 (7.8%) | 248 (11.2%) |
| 20 to 24 Minutes | 455 (18.3%) | 293 (13.2%) |
| 25 to 29 Minutes | 300 (12.1%) | 302 (13.6%) |
| 30 to 34 Minutes | 429 (17.3%) | 281 (12.7%) |
| 35 to 39 Minutes | 98 (4.0%) | 16 (0.7%) |
| 40 to 44 Minutes | 107 (4.3%) | 130 (5.9%) |
| 45 to 59 Minutes | 221 (8.9%) | 173 (7.8%) |
| 60 to 89 Minutes | 78 (3.1%) | 49 (2.2%) |
| 90 or more Minutes | 98 (4.0%) | 66 (3.0%) |
Time of Departure to Work by Sex in Vermilion
The most frequent times of departure to work in Vermilion are 7:30 AM to 7:59 AM (434, 17.5%) for males and 8:00 AM to 8:29 AM (446, 20.1%) for females.
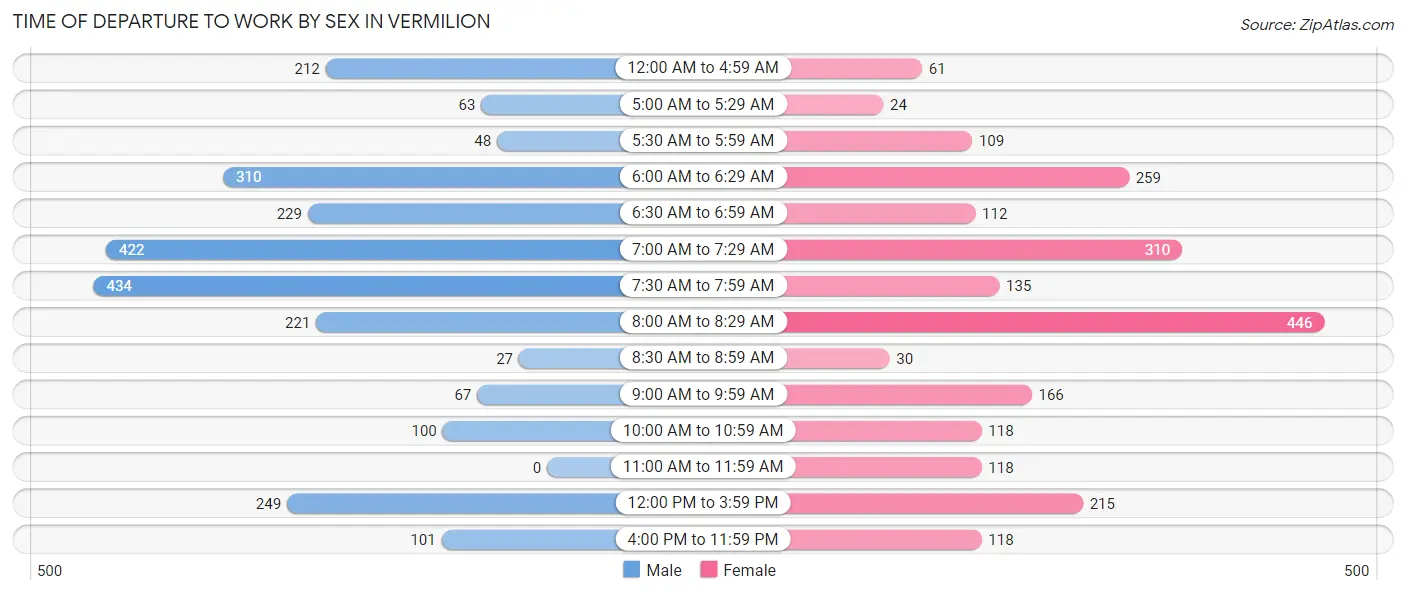
| Time of Departure | Male | Female |
| 12:00 AM to 4:59 AM | 212 (8.5%) | 61 (2.8%) |
| 5:00 AM to 5:29 AM | 63 (2.5%) | 24 (1.1%) |
| 5:30 AM to 5:59 AM | 48 (1.9%) | 109 (4.9%) |
| 6:00 AM to 6:29 AM | 310 (12.5%) | 259 (11.7%) |
| 6:30 AM to 6:59 AM | 229 (9.2%) | 112 (5.0%) |
| 7:00 AM to 7:29 AM | 422 (17.0%) | 310 (14.0%) |
| 7:30 AM to 7:59 AM | 434 (17.5%) | 135 (6.1%) |
| 8:00 AM to 8:29 AM | 221 (8.9%) | 446 (20.1%) |
| 8:30 AM to 8:59 AM | 27 (1.1%) | 30 (1.3%) |
| 9:00 AM to 9:59 AM | 67 (2.7%) | 166 (7.5%) |
| 10:00 AM to 10:59 AM | 100 (4.0%) | 118 (5.3%) |
| 11:00 AM to 11:59 AM | 0 (0.0%) | 118 (5.3%) |
| 12:00 PM to 3:59 PM | 249 (10.0%) | 215 (9.7%) |
| 4:00 PM to 11:59 PM | 101 (4.1%) | 118 (5.3%) |
| Total | 2,483 (100.0%) | 2,221 (100.0%) |
Housing Occupancy in Vermilion
Occupancy by Ownership in Vermilion
Of the total 4,473 dwellings in Vermilion, owner-occupied units account for 3,600 (80.5%), while renter-occupied units make up 873 (19.5%).
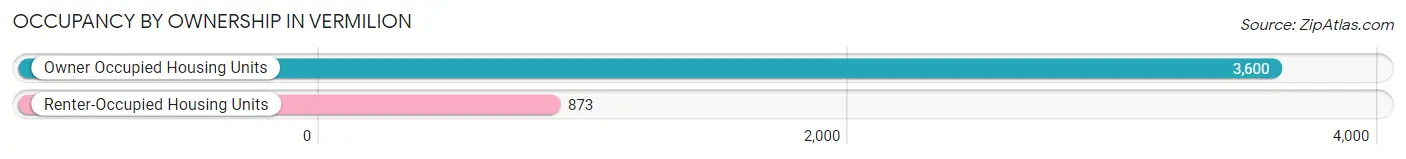
| Occupancy | # Housing Units | % Housing Units |
| Owner Occupied Housing Units | 3,600 | 80.5% |
| Renter-Occupied Housing Units | 873 | 19.5% |
| Total Occupied Housing Units | 4,473 | 100.0% |
Occupancy by Household Size in Vermilion
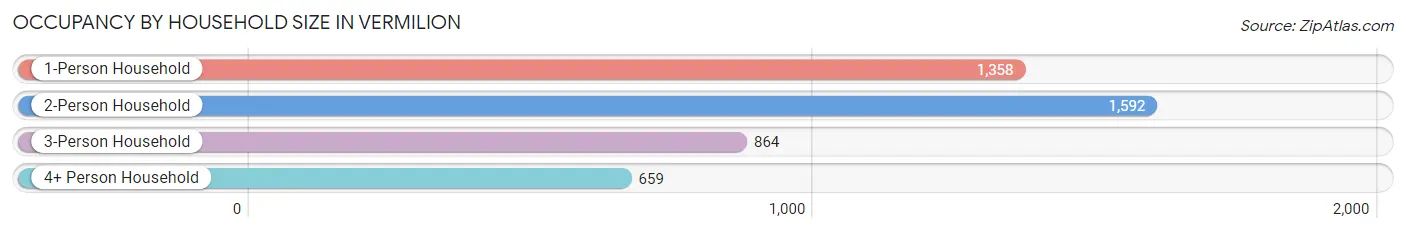
| Household Size | # Housing Units | % Housing Units |
| 1-Person Household | 1,358 | 30.4% |
| 2-Person Household | 1,592 | 35.6% |
| 3-Person Household | 864 | 19.3% |
| 4+ Person Household | 659 | 14.7% |
| Total Housing Units | 4,473 | 100.0% |
Occupancy by Ownership by Household Size in Vermilion
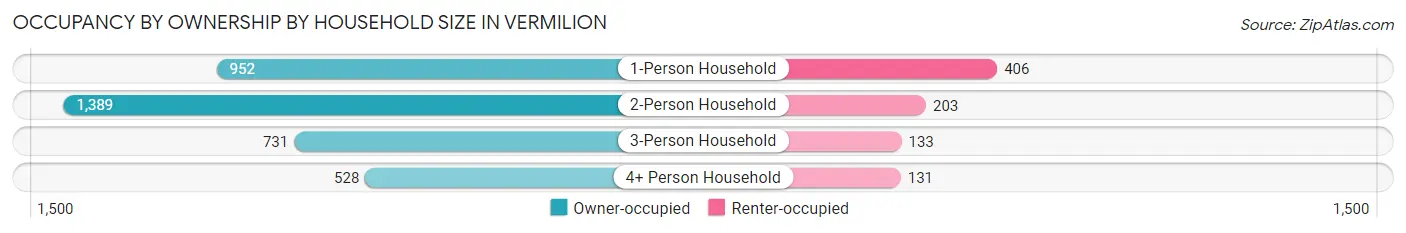
| Household Size | Owner-occupied | Renter-occupied |
| 1-Person Household | 952 (70.1%) | 406 (29.9%) |
| 2-Person Household | 1,389 (87.3%) | 203 (12.8%) |
| 3-Person Household | 731 (84.6%) | 133 (15.4%) |
| 4+ Person Household | 528 (80.1%) | 131 (19.9%) |
| Total Housing Units | 3,600 (80.5%) | 873 (19.5%) |
Occupancy by Educational Attainment in Vermilion
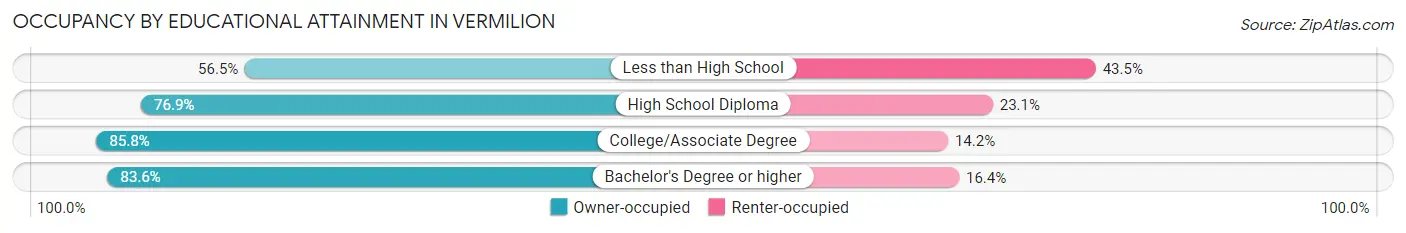
| Household Size | Owner-occupied | Renter-occupied |
| Less than High School | 179 (56.5%) | 138 (43.5%) |
| High School Diploma | 961 (76.9%) | 289 (23.1%) |
| College/Associate Degree | 1,229 (85.8%) | 204 (14.2%) |
| Bachelor's Degree or higher | 1,231 (83.6%) | 242 (16.4%) |
Occupancy by Age of Householder in Vermilion
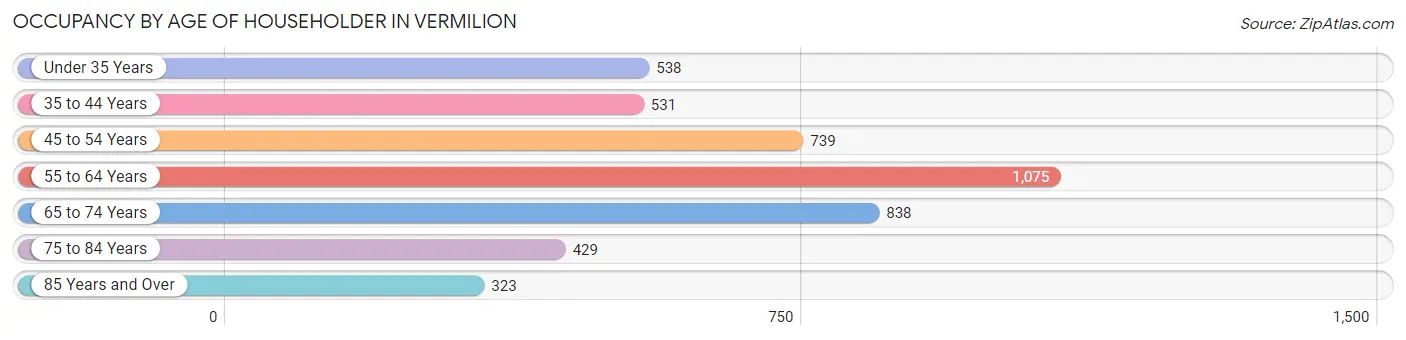
| Age Bracket | # Households | % Households |
| Under 35 Years | 538 | 12.0% |
| 35 to 44 Years | 531 | 11.9% |
| 45 to 54 Years | 739 | 16.5% |
| 55 to 64 Years | 1,075 | 24.0% |
| 65 to 74 Years | 838 | 18.7% |
| 75 to 84 Years | 429 | 9.6% |
| 85 Years and Over | 323 | 7.2% |
| Total | 4,473 | 100.0% |
Housing Finances in Vermilion
Median Income by Occupancy in Vermilion
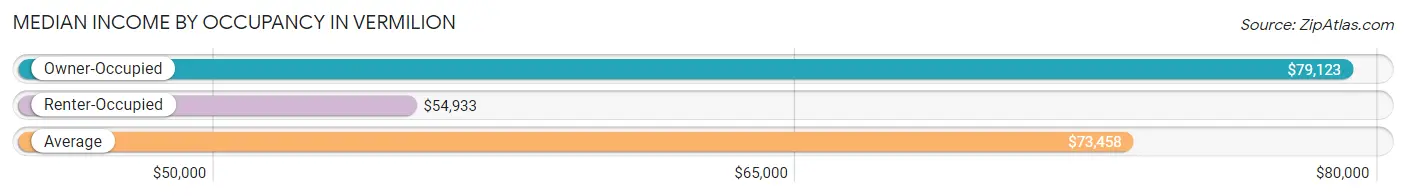
| Occupancy Type | # Households | Median Income |
| Owner-Occupied | 3,600 (80.5%) | $79,123 |
| Renter-Occupied | 873 (19.5%) | $54,933 |
| Average | 4,473 (100.0%) | $73,458 |
Occupancy by Householder Income Bracket in Vermilion
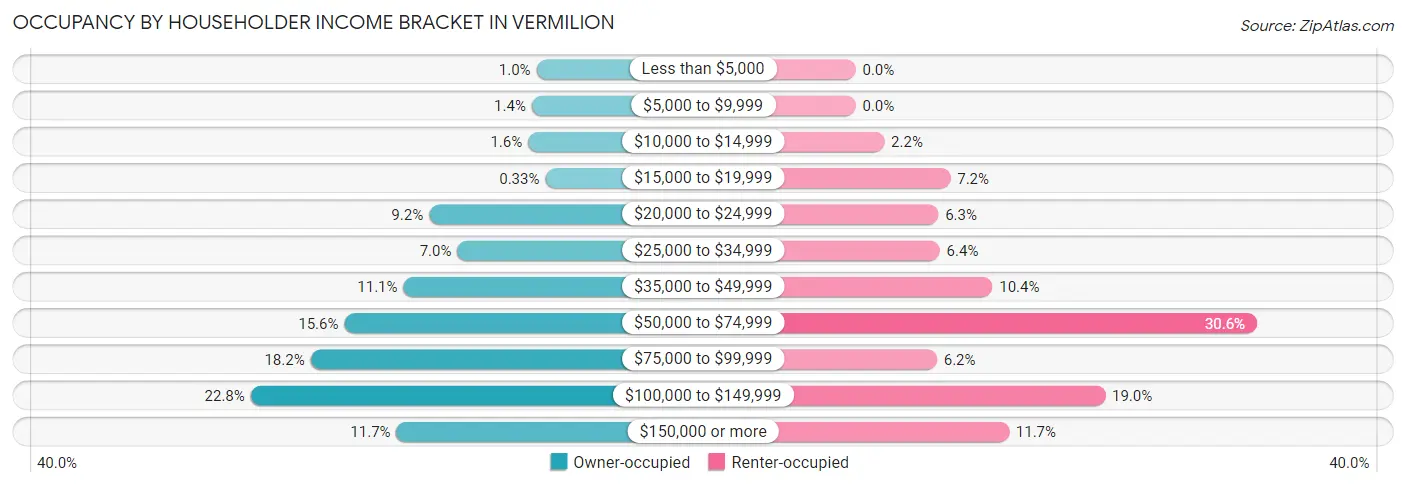
| Income Bracket | Owner-occupied | Renter-occupied |
| Less than $5,000 | 36 (1.0%) | 0 (0.0%) |
| $5,000 to $9,999 | 49 (1.4%) | 0 (0.0%) |
| $10,000 to $14,999 | 59 (1.6%) | 19 (2.2%) |
| $15,000 to $19,999 | 12 (0.3%) | 63 (7.2%) |
| $20,000 to $24,999 | 331 (9.2%) | 55 (6.3%) |
| $25,000 to $34,999 | 253 (7.0%) | 56 (6.4%) |
| $35,000 to $49,999 | 401 (11.1%) | 91 (10.4%) |
| $50,000 to $74,999 | 563 (15.6%) | 267 (30.6%) |
| $75,000 to $99,999 | 656 (18.2%) | 54 (6.2%) |
| $100,000 to $149,999 | 820 (22.8%) | 166 (19.0%) |
| $150,000 or more | 420 (11.7%) | 102 (11.7%) |
| Total | 3,600 (100.0%) | 873 (100.0%) |
Monthly Housing Cost Tiers in Vermilion
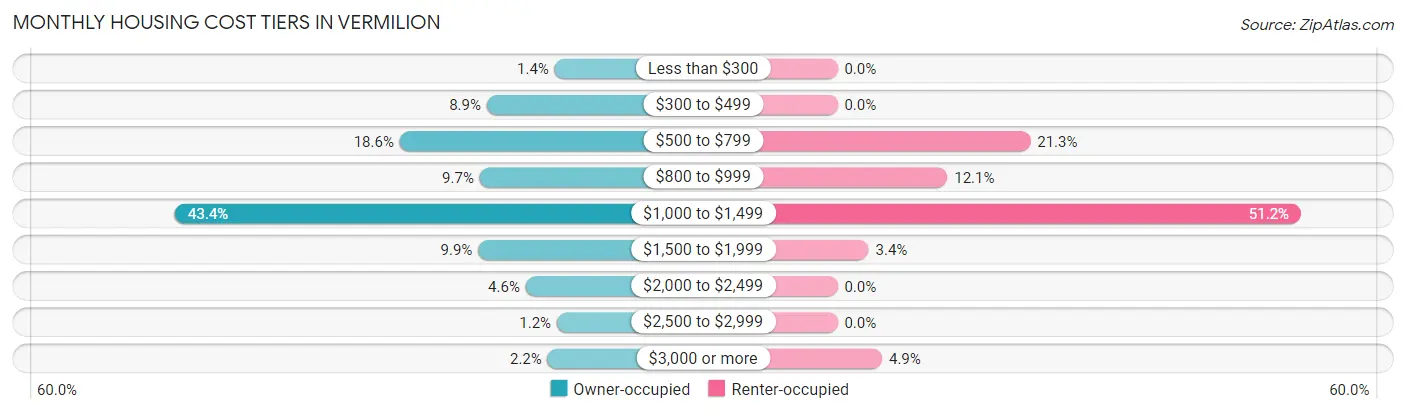
| Monthly Cost | Owner-occupied | Renter-occupied |
| Less than $300 | 52 (1.4%) | 0 (0.0%) |
| $300 to $499 | 322 (8.9%) | 0 (0.0%) |
| $500 to $799 | 668 (18.6%) | 186 (21.3%) |
| $800 to $999 | 350 (9.7%) | 106 (12.1%) |
| $1,000 to $1,499 | 1,562 (43.4%) | 447 (51.2%) |
| $1,500 to $1,999 | 356 (9.9%) | 30 (3.4%) |
| $2,000 to $2,499 | 167 (4.6%) | 0 (0.0%) |
| $2,500 to $2,999 | 43 (1.2%) | 0 (0.0%) |
| $3,000 or more | 80 (2.2%) | 43 (4.9%) |
| Total | 3,600 (100.0%) | 873 (100.0%) |
Physical Housing Characteristics in Vermilion
Housing Structures in Vermilion
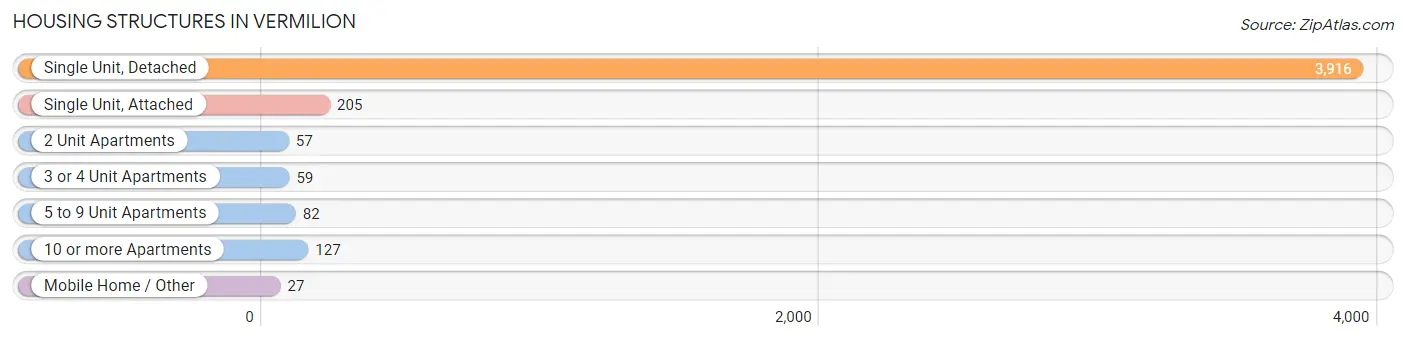
| Structure Type | # Housing Units | % Housing Units |
| Single Unit, Detached | 3,916 | 87.5% |
| Single Unit, Attached | 205 | 4.6% |
| 2 Unit Apartments | 57 | 1.3% |
| 3 or 4 Unit Apartments | 59 | 1.3% |
| 5 to 9 Unit Apartments | 82 | 1.8% |
| 10 or more Apartments | 127 | 2.8% |
| Mobile Home / Other | 27 | 0.6% |
| Total | 4,473 | 100.0% |
Housing Structures by Occupancy in Vermilion
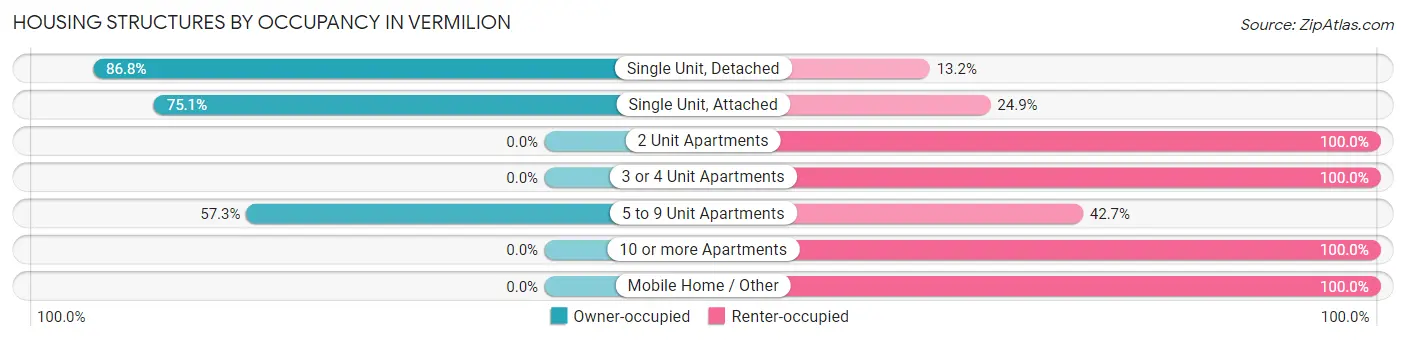
| Structure Type | Owner-occupied | Renter-occupied |
| Single Unit, Detached | 3,399 (86.8%) | 517 (13.2%) |
| Single Unit, Attached | 154 (75.1%) | 51 (24.9%) |
| 2 Unit Apartments | 0 (0.0%) | 57 (100.0%) |
| 3 or 4 Unit Apartments | 0 (0.0%) | 59 (100.0%) |
| 5 to 9 Unit Apartments | 47 (57.3%) | 35 (42.7%) |
| 10 or more Apartments | 0 (0.0%) | 127 (100.0%) |
| Mobile Home / Other | 0 (0.0%) | 27 (100.0%) |
| Total | 3,600 (80.5%) | 873 (19.5%) |
Housing Structures by Number of Rooms in Vermilion
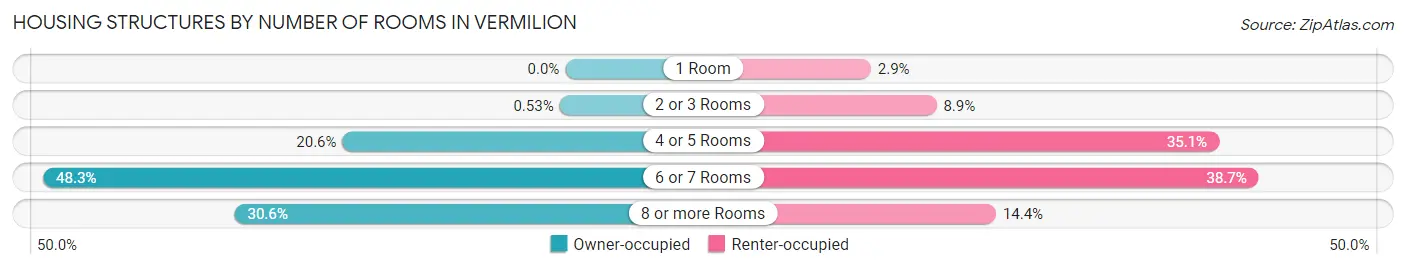
| Number of Rooms | Owner-occupied | Renter-occupied |
| 1 Room | 0 (0.0%) | 25 (2.9%) |
| 2 or 3 Rooms | 19 (0.5%) | 78 (8.9%) |
| 4 or 5 Rooms | 742 (20.6%) | 306 (35.0%) |
| 6 or 7 Rooms | 1,738 (48.3%) | 338 (38.7%) |
| 8 or more Rooms | 1,101 (30.6%) | 126 (14.4%) |
| Total | 3,600 (100.0%) | 873 (100.0%) |
Housing Structure by Heating Type in Vermilion
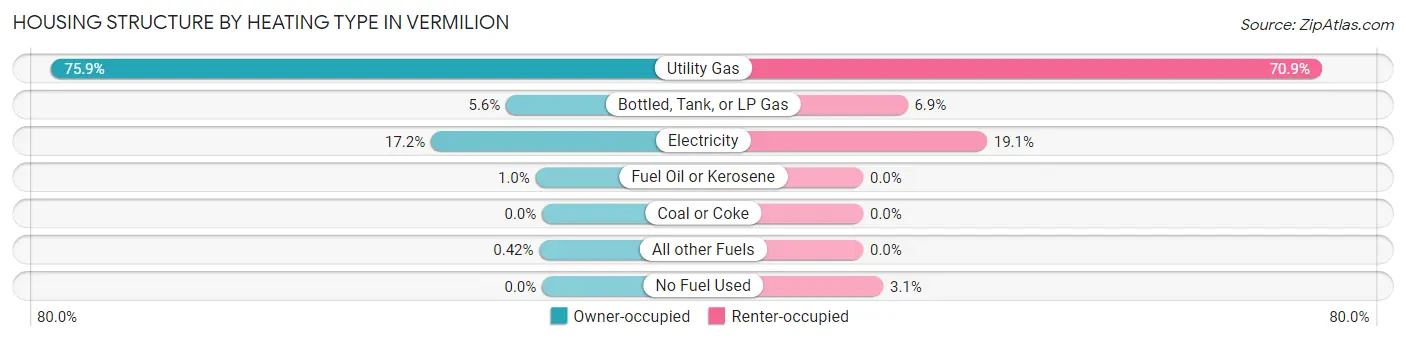
| Heating Type | Owner-occupied | Renter-occupied |
| Utility Gas | 2,731 (75.9%) | 619 (70.9%) |
| Bottled, Tank, or LP Gas | 200 (5.6%) | 60 (6.9%) |
| Electricity | 618 (17.2%) | 167 (19.1%) |
| Fuel Oil or Kerosene | 36 (1.0%) | 0 (0.0%) |
| Coal or Coke | 0 (0.0%) | 0 (0.0%) |
| All other Fuels | 15 (0.4%) | 0 (0.0%) |
| No Fuel Used | 0 (0.0%) | 27 (3.1%) |
| Total | 3,600 (100.0%) | 873 (100.0%) |
Household Vehicle Usage in Vermilion
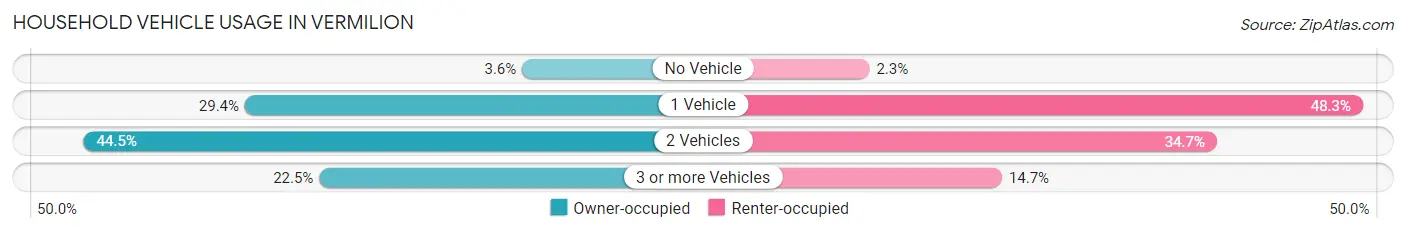
| Vehicles per Household | Owner-occupied | Renter-occupied |
| No Vehicle | 128 (3.6%) | 20 (2.3%) |
| 1 Vehicle | 1,060 (29.4%) | 422 (48.3%) |
| 2 Vehicles | 1,602 (44.5%) | 303 (34.7%) |
| 3 or more Vehicles | 810 (22.5%) | 128 (14.7%) |
| Total | 3,600 (100.0%) | 873 (100.0%) |
Real Estate & Mortgages in Vermilion
Real Estate and Mortgage Overview in Vermilion
| Characteristic | Without Mortgage | With Mortgage |
| Housing Units | 1,235 | 2,365 |
| Median Property Value | $195,300 | $151,400 |
| Median Household Income | $62,608 | $229 |
| Monthly Housing Costs | $686 | $63 |
| Real Estate Taxes | $2,720 | $61 |
Property Value by Mortgage Status in Vermilion
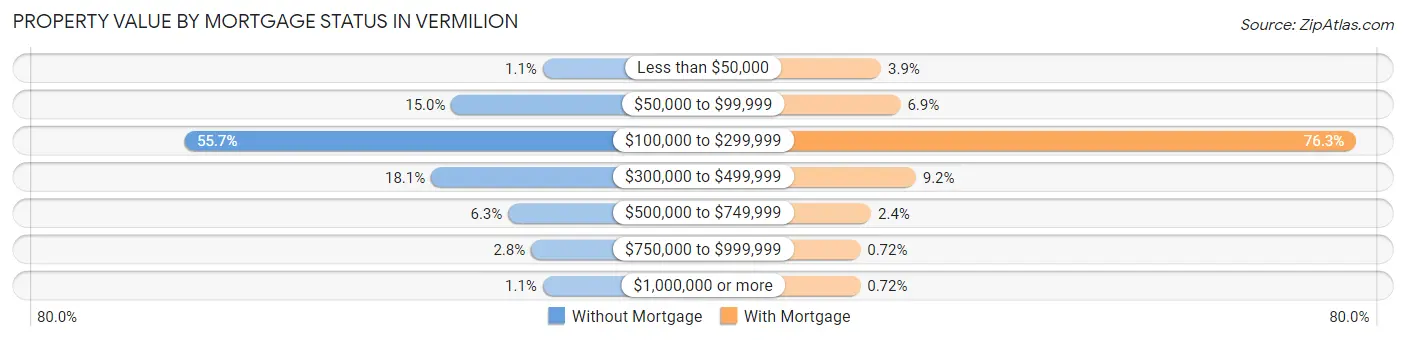
| Property Value | Without Mortgage | With Mortgage |
| Less than $50,000 | 13 (1.1%) | 92 (3.9%) |
| $50,000 to $99,999 | 185 (15.0%) | 162 (6.9%) |
| $100,000 to $299,999 | 688 (55.7%) | 1,804 (76.3%) |
| $300,000 to $499,999 | 223 (18.1%) | 217 (9.2%) |
| $500,000 to $749,999 | 78 (6.3%) | 56 (2.4%) |
| $750,000 to $999,999 | 35 (2.8%) | 17 (0.7%) |
| $1,000,000 or more | 13 (1.1%) | 17 (0.7%) |
| Total | 1,235 (100.0%) | 2,365 (100.0%) |
Household Income by Mortgage Status in Vermilion
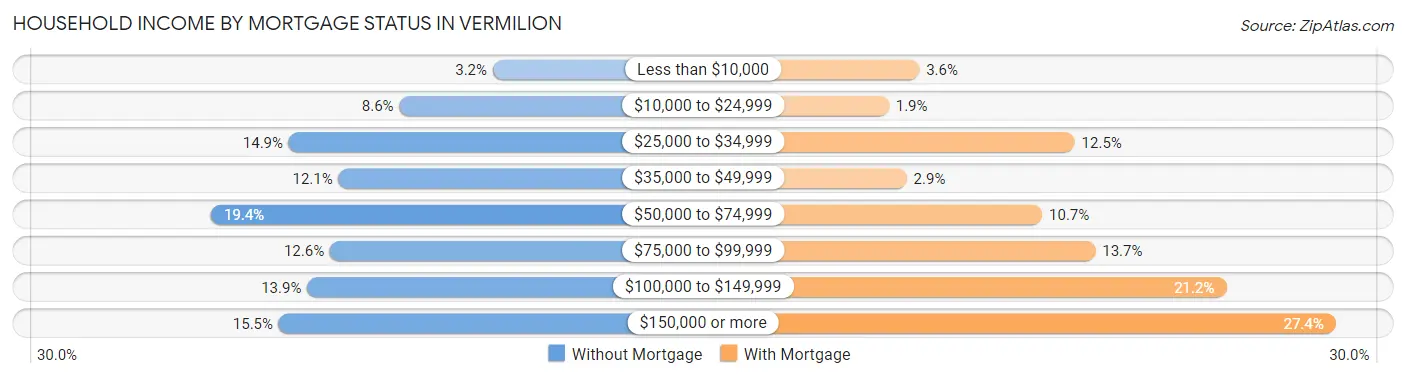
| Household Income | Without Mortgage | With Mortgage |
| Less than $10,000 | 40 (3.2%) | 86 (3.6%) |
| $10,000 to $24,999 | 106 (8.6%) | 45 (1.9%) |
| $25,000 to $34,999 | 184 (14.9%) | 296 (12.5%) |
| $35,000 to $49,999 | 149 (12.1%) | 69 (2.9%) |
| $50,000 to $74,999 | 239 (19.4%) | 252 (10.7%) |
| $75,000 to $99,999 | 155 (12.6%) | 324 (13.7%) |
| $100,000 to $149,999 | 171 (13.9%) | 501 (21.2%) |
| $150,000 or more | 191 (15.5%) | 649 (27.4%) |
| Total | 1,235 (100.0%) | 2,365 (100.0%) |
Property Value to Household Income Ratio in Vermilion
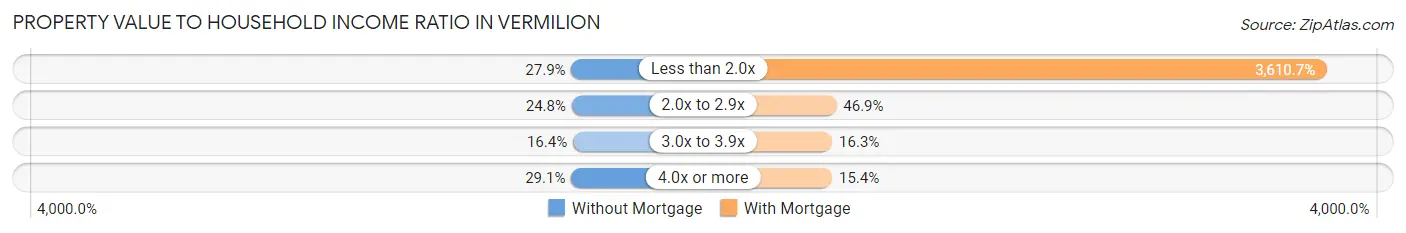
| Value-to-Income Ratio | Without Mortgage | With Mortgage |
| Less than 2.0x | 344 (27.9%) | 85,393 (3,610.7%) |
| 2.0x to 2.9x | 306 (24.8%) | 1,110 (46.9%) |
| 3.0x to 3.9x | 203 (16.4%) | 386 (16.3%) |
| 4.0x or more | 359 (29.1%) | 363 (15.3%) |
| Total | 1,235 (100.0%) | 2,365 (100.0%) |
Real Estate Taxes by Mortgage Status in Vermilion
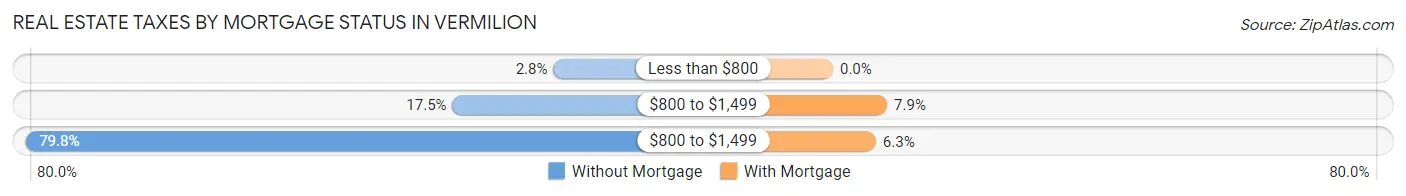
| Property Taxes | Without Mortgage | With Mortgage |
| Less than $800 | 34 (2.8%) | 0 (0.0%) |
| $800 to $1,499 | 216 (17.5%) | 187 (7.9%) |
| $800 to $1,499 | 985 (79.8%) | 148 (6.3%) |
| Total | 1,235 (100.0%) | 2,365 (100.0%) |
Health & Disability in Vermilion
Health Insurance Coverage by Age in Vermilion
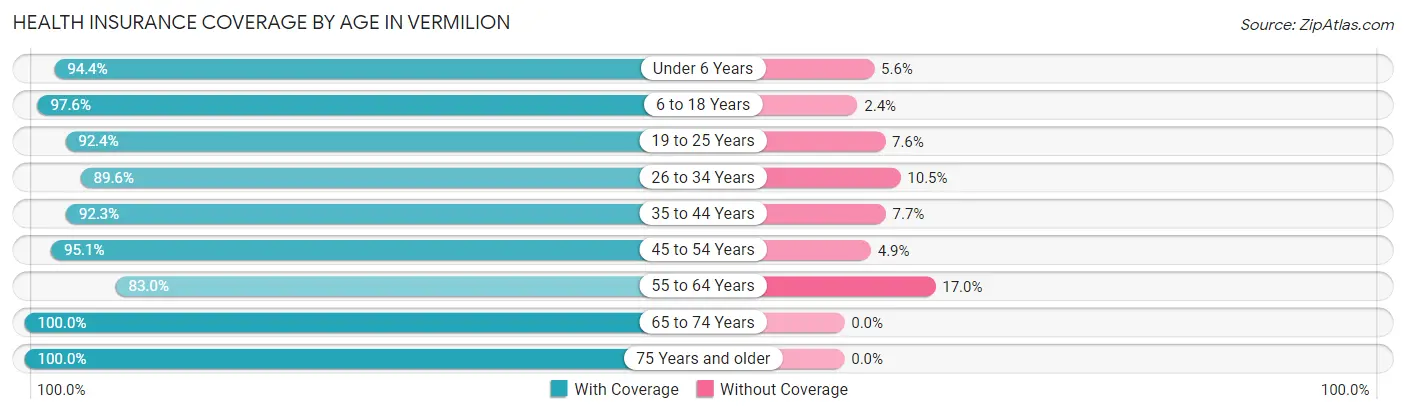
| Age Bracket | With Coverage | Without Coverage |
| Under 6 Years | 595 (94.4%) | 35 (5.6%) |
| 6 to 18 Years | 1,483 (97.6%) | 37 (2.4%) |
| 19 to 25 Years | 778 (92.4%) | 64 (7.6%) |
| 26 to 34 Years | 703 (89.5%) | 82 (10.4%) |
| 35 to 44 Years | 863 (92.3%) | 72 (7.7%) |
| 45 to 54 Years | 1,289 (95.1%) | 67 (4.9%) |
| 55 to 64 Years | 1,507 (83.0%) | 308 (17.0%) |
| 65 to 74 Years | 1,394 (100.0%) | 0 (0.0%) |
| 75 Years and older | 1,042 (100.0%) | 0 (0.0%) |
| Total | 9,654 (93.6%) | 665 (6.4%) |
Health Insurance Coverage by Citizenship Status in Vermilion
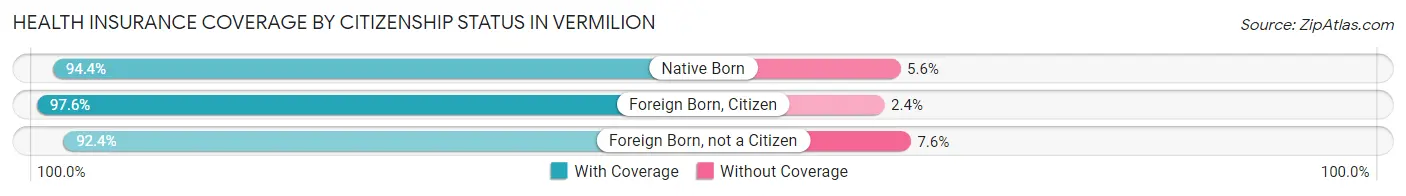
| Citizenship Status | With Coverage | Without Coverage |
| Native Born | 595 (94.4%) | 35 (5.6%) |
| Foreign Born, Citizen | 1,483 (97.6%) | 37 (2.4%) |
| Foreign Born, not a Citizen | 778 (92.4%) | 64 (7.6%) |
Health Insurance Coverage by Household Income in Vermilion
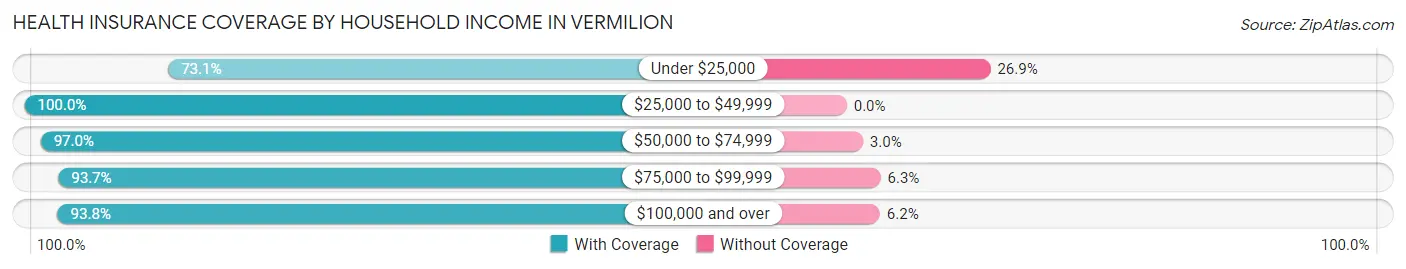
| Household Income | With Coverage | Without Coverage |
| Under $25,000 | 608 (73.1%) | 224 (26.9%) |
| $25,000 to $49,999 | 1,559 (100.0%) | 0 (0.0%) |
| $50,000 to $74,999 | 1,603 (97.0%) | 50 (3.0%) |
| $75,000 to $99,999 | 1,671 (93.7%) | 113 (6.3%) |
| $100,000 and over | 4,203 (93.8%) | 278 (6.2%) |
Public vs Private Health Insurance Coverage by Age in Vermilion
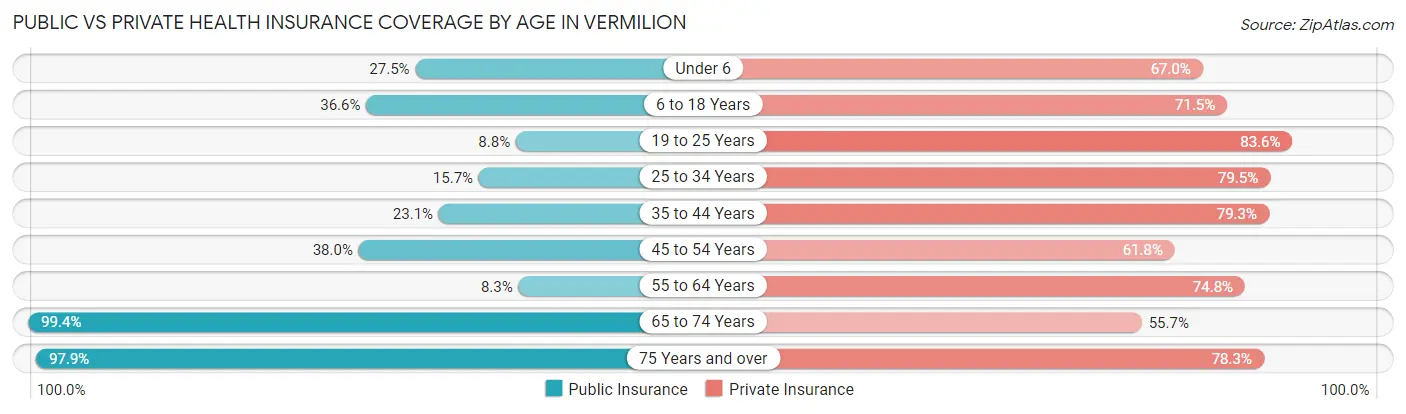
| Age Bracket | Public Insurance | Private Insurance |
| Under 6 | 173 (27.5%) | 422 (67.0%) |
| 6 to 18 Years | 556 (36.6%) | 1,087 (71.5%) |
| 19 to 25 Years | 74 (8.8%) | 704 (83.6%) |
| 25 to 34 Years | 123 (15.7%) | 624 (79.5%) |
| 35 to 44 Years | 216 (23.1%) | 741 (79.2%) |
| 45 to 54 Years | 515 (38.0%) | 838 (61.8%) |
| 55 to 64 Years | 151 (8.3%) | 1,358 (74.8%) |
| 65 to 74 Years | 1,385 (99.4%) | 776 (55.7%) |
| 75 Years and over | 1,020 (97.9%) | 816 (78.3%) |
| Total | 4,213 (40.8%) | 7,366 (71.4%) |
Disability Status by Sex by Age in Vermilion
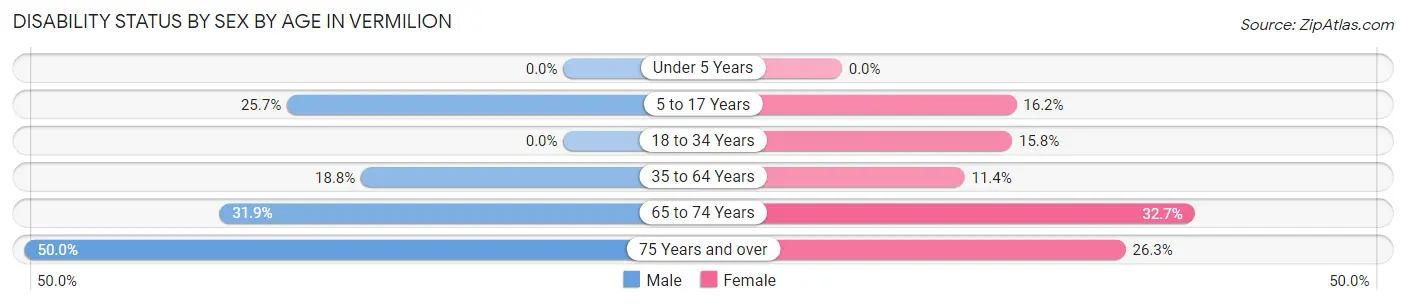
| Age Bracket | Male | Female |
| Under 5 Years | 0 (0.0%) | 0 (0.0%) |
| 5 to 17 Years | 187 (25.7%) | 117 (16.2%) |
| 18 to 34 Years | 0 (0.0%) | 164 (15.8%) |
| 35 to 64 Years | 395 (18.8%) | 228 (11.4%) |
| 65 to 74 Years | 212 (31.9%) | 239 (32.7%) |
| 75 Years and over | 204 (50.0%) | 167 (26.3%) |
Disability Class by Sex by Age in Vermilion
Disability Class: Hearing Difficulty
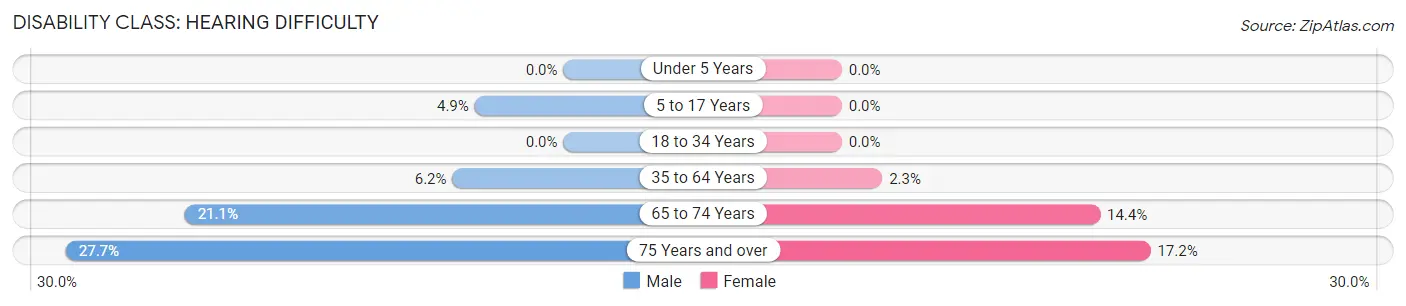
| Age Bracket | Male | Female |
| Under 5 Years | 0 (0.0%) | 0 (0.0%) |
| 5 to 17 Years | 36 (4.9%) | 0 (0.0%) |
| 18 to 34 Years | 0 (0.0%) | 0 (0.0%) |
| 35 to 64 Years | 130 (6.2%) | 45 (2.2%) |
| 65 to 74 Years | 140 (21.1%) | 105 (14.4%) |
| 75 Years and over | 113 (27.7%) | 109 (17.2%) |
Disability Class: Vision Difficulty
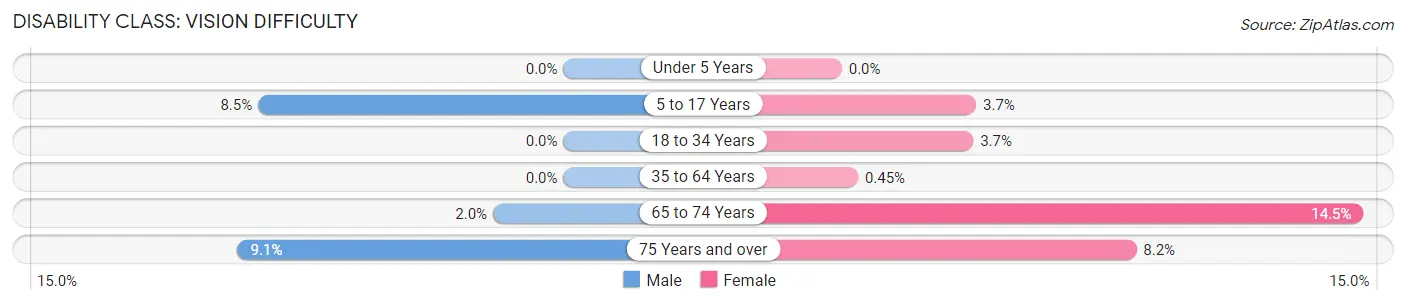
| Age Bracket | Male | Female |
| Under 5 Years | 0 (0.0%) | 0 (0.0%) |
| 5 to 17 Years | 62 (8.5%) | 27 (3.7%) |
| 18 to 34 Years | 0 (0.0%) | 38 (3.7%) |
| 35 to 64 Years | 0 (0.0%) | 9 (0.4%) |
| 65 to 74 Years | 13 (2.0%) | 106 (14.5%) |
| 75 Years and over | 37 (9.1%) | 52 (8.2%) |
Disability Class: Cognitive Difficulty
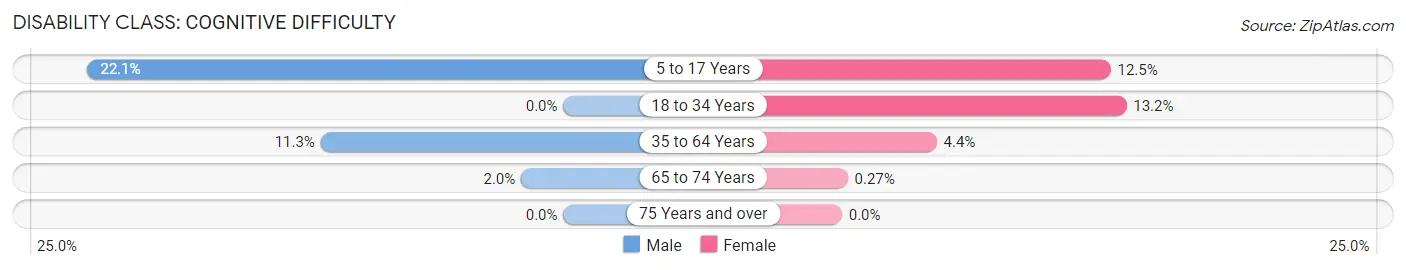
| Age Bracket | Male | Female |
| 5 to 17 Years | 161 (22.1%) | 90 (12.5%) |
| 18 to 34 Years | 0 (0.0%) | 137 (13.2%) |
| 35 to 64 Years | 237 (11.3%) | 88 (4.4%) |
| 65 to 74 Years | 13 (2.0%) | 2 (0.3%) |
| 75 Years and over | 0 (0.0%) | 0 (0.0%) |
Disability Class: Ambulatory Difficulty
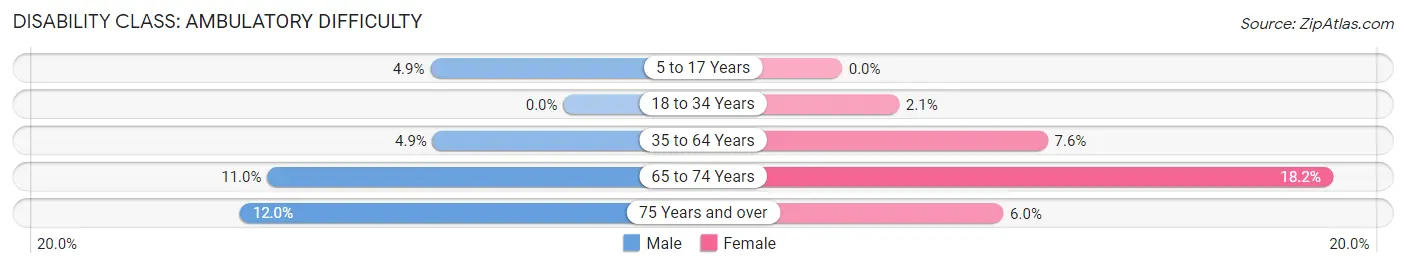
| Age Bracket | Male | Female |
| 5 to 17 Years | 36 (4.9%) | 0 (0.0%) |
| 18 to 34 Years | 0 (0.0%) | 22 (2.1%) |
| 35 to 64 Years | 102 (4.9%) | 153 (7.6%) |
| 65 to 74 Years | 73 (11.0%) | 133 (18.2%) |
| 75 Years and over | 49 (12.0%) | 38 (6.0%) |
Disability Class: Self-Care Difficulty
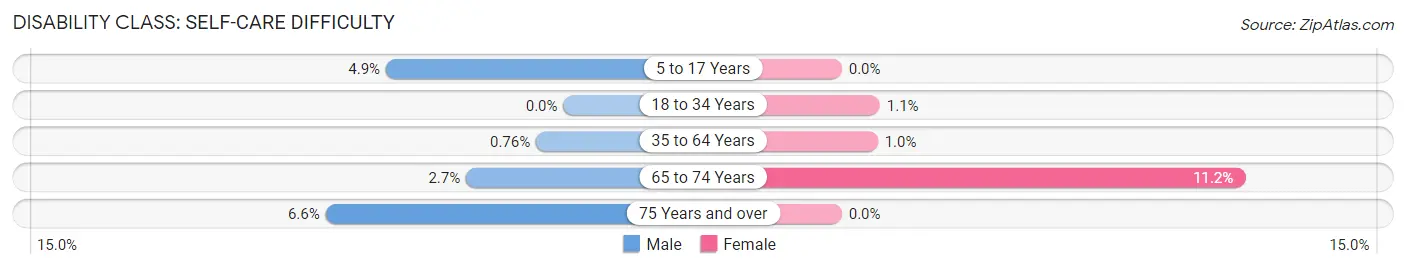
| Age Bracket | Male | Female |
| 5 to 17 Years | 36 (4.9%) | 0 (0.0%) |
| 18 to 34 Years | 0 (0.0%) | 11 (1.1%) |
| 35 to 64 Years | 16 (0.8%) | 20 (1.0%) |
| 65 to 74 Years | 18 (2.7%) | 82 (11.2%) |
| 75 Years and over | 27 (6.6%) | 0 (0.0%) |
Technology Access in Vermilion
Computing Device Access in Vermilion
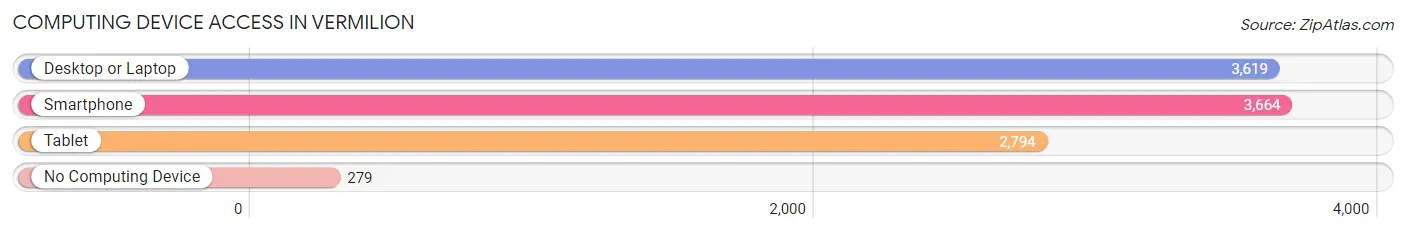
| Device Type | # Households | % Households |
| Desktop or Laptop | 3,619 | 80.9% |
| Smartphone | 3,664 | 81.9% |
| Tablet | 2,794 | 62.5% |
| No Computing Device | 279 | 6.2% |
| Total | 4,473 | 100.0% |
Internet Access in Vermilion
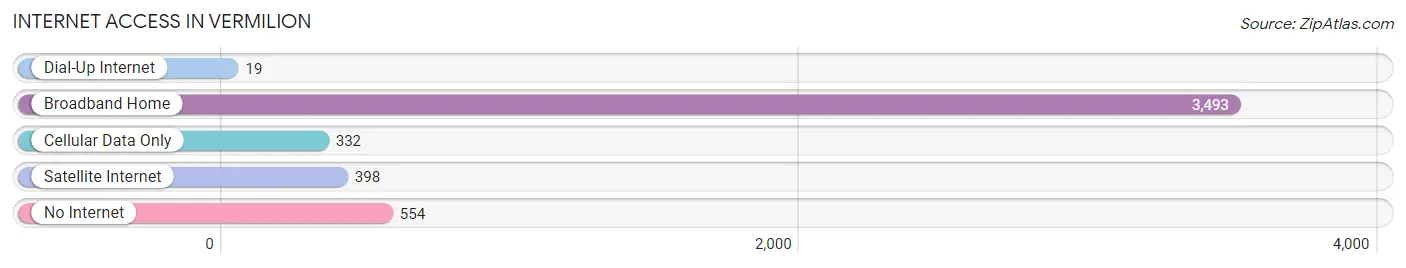
| Internet Type | # Households | % Households |
| Dial-Up Internet | 19 | 0.4% |
| Broadband Home | 3,493 | 78.1% |
| Cellular Data Only | 332 | 7.4% |
| Satellite Internet | 398 | 8.9% |
| No Internet | 554 | 12.4% |
| Total | 4,473 | 100.0% |
Vermilion Summary
Vermilion, Ohio is a small city located in Erie County, Ohio, United States. It is situated on the south shore of Lake Erie, approximately 30 miles west of Cleveland. The city has a population of approximately 10,000 people and is part of the larger metropolitan area of Cleveland.
History
Vermilion was first settled in 1809 by a group of settlers from Connecticut. The town was originally known as "Mouth of the Vermilion River" due to its location at the mouth of the Vermilion River. The town was officially incorporated in 1837 and was named after the river.
In the late 19th century, Vermilion was a popular summer resort destination for wealthy Clevelanders. The town was known for its beautiful beaches and its many resorts. The town also had a thriving fishing industry, which was the main source of income for many of the town's residents.
In the early 20th century, Vermilion began to experience a decline in its popularity as a summer resort destination. This was due to the increasing popularity of other nearby towns such as Sandusky and Put-in-Bay. The town also experienced a decline in its fishing industry due to overfishing and pollution.
Geography
Vermilion is located in Erie County, Ohio, United States. It is situated on the south shore of Lake Erie, approximately 30 miles west of Cleveland. The city has a total area of 4.2 square miles, all of which is land. The Vermilion River runs through the city and is a popular spot for fishing and boating.
The city has a humid continental climate, with hot summers and cold winters. The average temperature in the summer is around 75 degrees Fahrenheit and the average temperature in the winter is around 25 degrees Fahrenheit.
Economy
Vermilion's economy is largely based on tourism and fishing. The city is home to several popular tourist attractions, including the Vermilion Lighthouse, the Vermilion River, and the Vermilion Historical Society. The city also has a thriving fishing industry, with many local businesses specializing in fishing charters and equipment.
The city also has a number of manufacturing and industrial businesses, including a steel mill, a paper mill, and a plastics factory. The city is also home to a number of retail stores, restaurants, and other businesses.
Demographics
As of the 2010 census, the population of Vermilion was 10,149. The racial makeup of the city was 95.3% White, 1.2% African American, 0.3% Native American, 0.7% Asian, 0.1% Pacific Islander, 0.7% from other races, and 1.9% from two or more races. Hispanic or Latino of any race were 2.2% of the population.
The median household income in Vermilion was $45,945, and the median family income was $54,945. The per capita income for the city was $22,945. About 8.3% of families and 10.2% of the population were below the poverty line, including 14.2% of those under age 18 and 6.2% of those age 65 or over.
Common Questions
What is Per Capita Income in Vermilion?
Per Capita income in Vermilion is $43,479.
What is the Median Family Income in Vermilion?
Median Family Income in Vermilion is $88,581.
What is the Median Household income in Vermilion?
Median Household Income in Vermilion is $73,458.
What is Income or Wage Gap in Vermilion?
Income or Wage Gap in Vermilion is 44.0%.
Women in Vermilion earn 56.0 cents for every dollar earned by a man.
What is Inequality or Gini Index in Vermilion?
Inequality or Gini Index in Vermilion is 0.47.
What is the Total Population of Vermilion?
Total Population of Vermilion is 10,459.
What is the Total Male Population of Vermilion?
Total Male Population of Vermilion is 5,009.
What is the Total Female Population of Vermilion?
Total Female Population of Vermilion is 5,450.
What is the Ratio of Males per 100 Females in Vermilion?
There are 91.91 Males per 100 Females in Vermilion.
What is the Ratio of Females per 100 Males in Vermilion?
There are 108.80 Females per 100 Males in Vermilion.
What is the Median Population Age in Vermilion?
Median Population Age in Vermilion is 48.3 Years.
What is the Average Family Size in Vermilion
Average Family Size in Vermilion is 2.9 People.
What is the Average Household Size in Vermilion
Average Household Size in Vermilion is 2.3 People.
How Large is the Labor Force in Vermilion?
There are 5,411 People in the Labor Forcein in Vermilion.
What is the Percentage of People in the Labor Force in Vermilion?
61.1% of People are in the Labor Force in Vermilion.
What is the Unemployment Rate in Vermilion?
Unemployment Rate in Vermilion is 3.0%.