Vanlue, OH Map & Demographics
Vanlue Map
Vanlue Overview
$31,597
PER CAPITA INCOME
$83,125
AVG FAMILY INCOME
$70,750
AVG HOUSEHOLD INCOME
17.3%
WAGE / INCOME GAP [ % ]
82.7¢/ $1
WAGE / INCOME GAP [ $ ]
0.28
INEQUALITY / GINI INDEX
323
TOTAL POPULATION
169
MALE POPULATION
154
FEMALE POPULATION
109.74
MALES / 100 FEMALES
91.12
FEMALES / 100 MALES
35.8
MEDIAN AGE
2.8
AVG FAMILY SIZE
2.4
AVG HOUSEHOLD SIZE
200
LABOR FORCE [ PEOPLE ]
74.3%
PERCENT IN LABOR FORCE
Vanlue Zip Codes
Vanlue Area Codes
Income in Vanlue
Income Overview in Vanlue
Per Capita Income in Vanlue is $31,597, while median incomes of families and households are $83,125 and $70,750 respectively.
| Characteristic | Number | Measure |
| Per Capita Income | 323 | $31,597 |
| Median Family Income | 95 | $83,125 |
| Mean Family Income | 95 | $87,682 |
| Median Household Income | 137 | $70,750 |
| Mean Household Income | 137 | $73,558 |
| Income Deficit | 95 | $0 |
| Wage / Income Gap (%) | 323 | 17.28% |
| Wage / Income Gap ($) | 323 | 82.72¢ per $1 |
| Gini / Inequality Index | 323 | 0.28 |
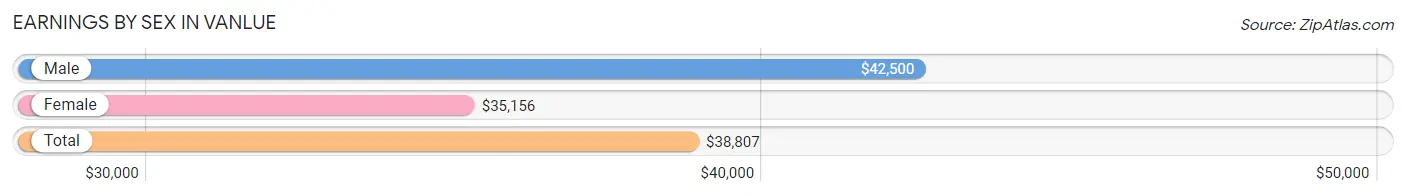
Earnings by Sex in Vanlue
Average Earnings in Vanlue are $38,807, $42,500 for men and $35,156 for women, a difference of 17.3%.
| Sex | Number | Average Earnings |
| Male | 114 (54.5%) | $42,500 |
| Female | 95 (45.5%) | $35,156 |
| Total | 209 (100.0%) | $38,807 |
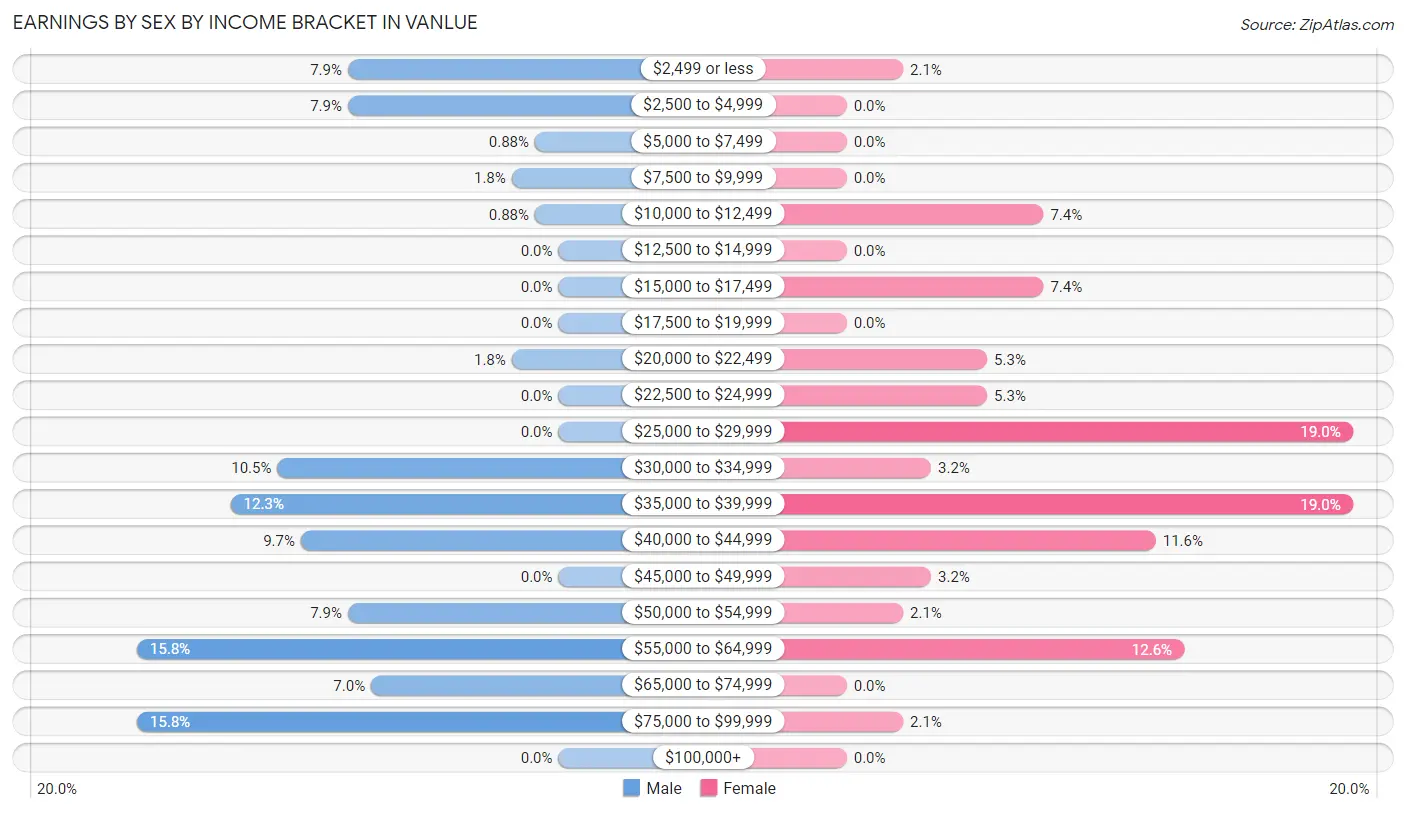
Earnings by Sex by Income Bracket in Vanlue
The most common earnings brackets in Vanlue are $55,000 to $64,999 for men (18 | 15.8%) and $25,000 to $29,999 for women (18 | 19.0%).
| Income | Male | Female |
| $2,499 or less | 9 (7.9%) | 2 (2.1%) |
| $2,500 to $4,999 | 9 (7.9%) | 0 (0.0%) |
| $5,000 to $7,499 | 1 (0.9%) | 0 (0.0%) |
| $7,500 to $9,999 | 2 (1.8%) | 0 (0.0%) |
| $10,000 to $12,499 | 1 (0.9%) | 7 (7.4%) |
| $12,500 to $14,999 | 0 (0.0%) | 0 (0.0%) |
| $15,000 to $17,499 | 0 (0.0%) | 7 (7.4%) |
| $17,500 to $19,999 | 0 (0.0%) | 0 (0.0%) |
| $20,000 to $22,499 | 2 (1.8%) | 5 (5.3%) |
| $22,500 to $24,999 | 0 (0.0%) | 5 (5.3%) |
| $25,000 to $29,999 | 0 (0.0%) | 18 (19.0%) |
| $30,000 to $34,999 | 12 (10.5%) | 3 (3.2%) |
| $35,000 to $39,999 | 14 (12.3%) | 18 (19.0%) |
| $40,000 to $44,999 | 11 (9.7%) | 11 (11.6%) |
| $45,000 to $49,999 | 0 (0.0%) | 3 (3.2%) |
| $50,000 to $54,999 | 9 (7.9%) | 2 (2.1%) |
| $55,000 to $64,999 | 18 (15.8%) | 12 (12.6%) |
| $65,000 to $74,999 | 8 (7.0%) | 0 (0.0%) |
| $75,000 to $99,999 | 18 (15.8%) | 2 (2.1%) |
| $100,000+ | 0 (0.0%) | 0 (0.0%) |
| Total | 114 (100.0%) | 95 (100.0%) |
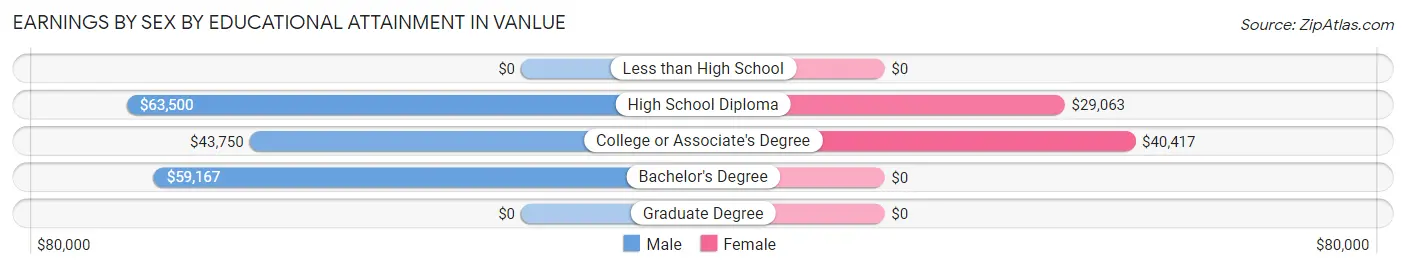
Earnings by Sex by Educational Attainment in Vanlue
Average earnings in Vanlue are $52,321 for men and $36,719 for women, a difference of 29.8%. Men with an educational attainment of high school diploma enjoy the highest average annual earnings of $63,500, while those with college or associate's degree education earn the least with $43,750. Women with an educational attainment of college or associate's degree earn the most with the average annual earnings of $40,417, while those with high school diploma education have the smallest earnings of $29,063.
| Educational Attainment | Male Income | Female Income |
| Less than High School | - | - |
| High School Diploma | $63,500 | $29,063 |
| College or Associate's Degree | $43,750 | $40,417 |
| Bachelor's Degree | $59,167 | $0 |
| Graduate Degree | - | - |
| Total | $52,321 | $36,719 |
Family Income in Vanlue
Family Income Brackets in Vanlue
According to the Vanlue family income data, there are 30 families falling into the $75,000 to $99,999 income range, which is the most common income bracket and makes up 31.6% of all families.
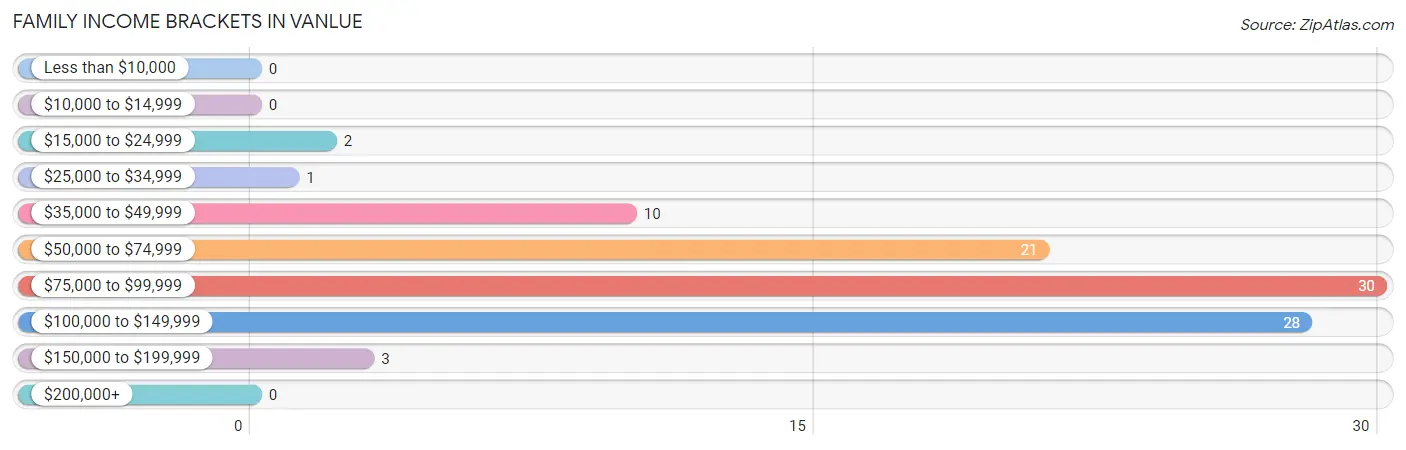
| Income Bracket | # Families | % Families |
| Less than $10,000 | 0 | 0.0% |
| $10,000 to $14,999 | 0 | 0.0% |
| $15,000 to $24,999 | 2 | 2.1% |
| $25,000 to $34,999 | 1 | 1.1% |
| $35,000 to $49,999 | 10 | 10.5% |
| $50,000 to $74,999 | 21 | 22.1% |
| $75,000 to $99,999 | 30 | 31.6% |
| $100,000 to $149,999 | 28 | 29.5% |
| $150,000 to $199,999 | 3 | 3.2% |
| $200,000+ | 0 | 0.0% |
Family Income by Famaliy Size in Vanlue
6-person families (7 | 7.4%) account for the highest median family income in Vanlue with $103,750 per family, while 2-person families (56 | 59.0%) have the highest median income of $38,542 per family member.
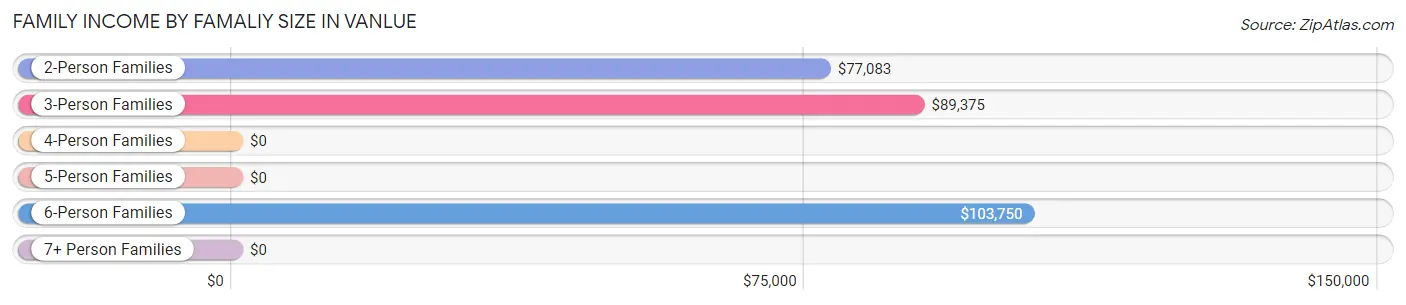
| Income Bracket | # Families | Median Income |
| 2-Person Families | 56 (59.0%) | $77,083 |
| 3-Person Families | 25 (26.3%) | $89,375 |
| 4-Person Families | 7 (7.4%) | $0 |
| 5-Person Families | 0 (0.0%) | $0 |
| 6-Person Families | 7 (7.4%) | $103,750 |
| 7+ Person Families | 0 (0.0%) | $0 |
| Total | 95 (100.0%) | $83,125 |
Family Income by Number of Earners in Vanlue
The median family income in Vanlue is $83,125, with families comprising 3+ earners (4) having the highest median family income of $96,667, while families with no earners (12) have the lowest median family income of $53,750, accounting for 4.2% and 12.6% of families, respectively.
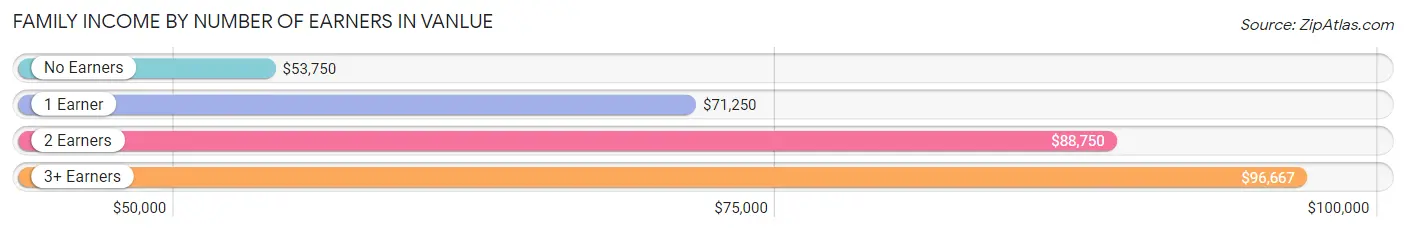
| Number of Earners | # Families | Median Income |
| No Earners | 12 (12.6%) | $53,750 |
| 1 Earner | 15 (15.8%) | $71,250 |
| 2 Earners | 64 (67.4%) | $88,750 |
| 3+ Earners | 4 (4.2%) | $96,667 |
| Total | 95 (100.0%) | $83,125 |
Household Income in Vanlue
Household Income Brackets in Vanlue
With 32 households falling in the category, the $50,000 to $74,999 income range is the most frequent in Vanlue, accounting for 23.4% of all households.
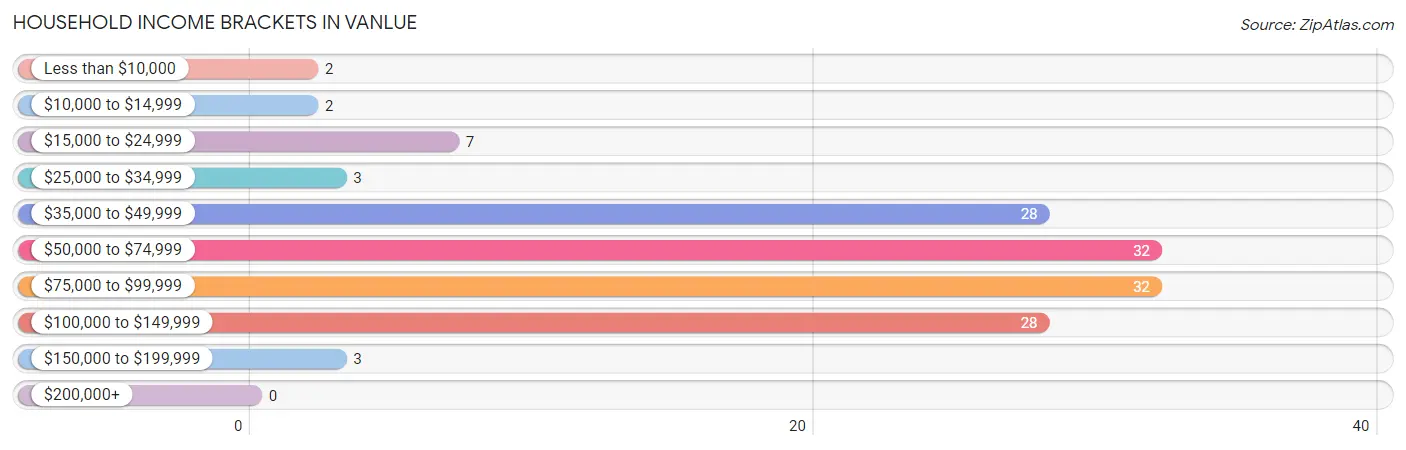
| Income Bracket | # Households | % Households |
| Less than $10,000 | 2 | 1.5% |
| $10,000 to $14,999 | 2 | 1.5% |
| $15,000 to $24,999 | 7 | 5.1% |
| $25,000 to $34,999 | 3 | 2.2% |
| $35,000 to $49,999 | 28 | 20.4% |
| $50,000 to $74,999 | 32 | 23.4% |
| $75,000 to $99,999 | 32 | 23.4% |
| $100,000 to $149,999 | 28 | 20.4% |
| $150,000 to $199,999 | 3 | 2.2% |
| $200,000+ | 0 | 0.0% |
Household Income by Householder Age in Vanlue
The median household income in Vanlue is $70,750, with the highest median household income of $85,357 found in the 45 to 64 years age bracket for the primary householder. A total of 56 households (40.9%) fall into this category. Meanwhile, the 15 to 24 years age bracket for the primary householder has the lowest median household income of $0, with 8 households (5.8%) in this group.
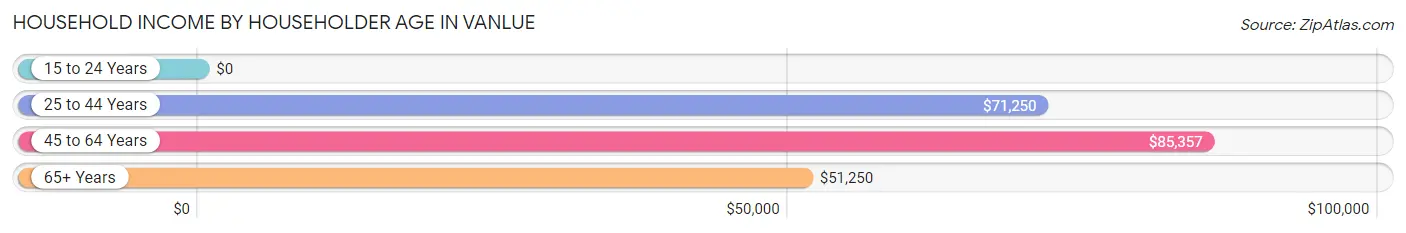
| Income Bracket | # Households | Median Income |
| 15 to 24 Years | 8 (5.8%) | $0 |
| 25 to 44 Years | 43 (31.4%) | $71,250 |
| 45 to 64 Years | 56 (40.9%) | $85,357 |
| 65+ Years | 30 (21.9%) | $51,250 |
| Total | 137 (100.0%) | $70,750 |
Poverty in Vanlue
Income Below Poverty by Sex and Age in Vanlue
With 2.4% poverty level for males and 8.4% for females among the residents of Vanlue, 5 year old males and 25 to 34 year old females are the most vulnerable to poverty, with 2 males (100.0%) and 9 females (26.5%) in their respective age groups living below the poverty level.
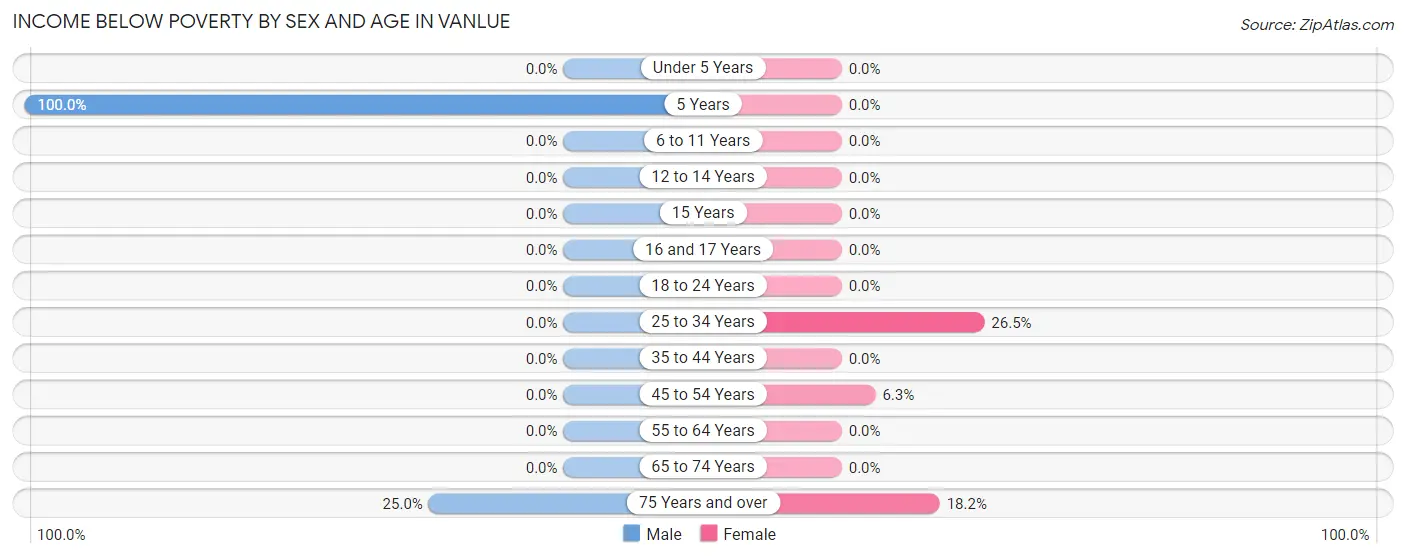
| Age Bracket | Male | Female |
| Under 5 Years | 0 (0.0%) | 0 (0.0%) |
| 5 Years | 2 (100.0%) | 0 (0.0%) |
| 6 to 11 Years | 0 (0.0%) | 0 (0.0%) |
| 12 to 14 Years | 0 (0.0%) | 0 (0.0%) |
| 15 Years | 0 (0.0%) | 0 (0.0%) |
| 16 and 17 Years | 0 (0.0%) | 0 (0.0%) |
| 18 to 24 Years | 0 (0.0%) | 0 (0.0%) |
| 25 to 34 Years | 0 (0.0%) | 9 (26.5%) |
| 35 to 44 Years | 0 (0.0%) | 0 (0.0%) |
| 45 to 54 Years | 0 (0.0%) | 2 (6.2%) |
| 55 to 64 Years | 0 (0.0%) | 0 (0.0%) |
| 65 to 74 Years | 0 (0.0%) | 0 (0.0%) |
| 75 Years and over | 2 (25.0%) | 2 (18.2%) |
| Total | 4 (2.4%) | 13 (8.4%) |
Income Above Poverty by Sex and Age in Vanlue
According to the poverty statistics in Vanlue, males aged under 5 years and females aged under 5 years are the age groups that are most secure financially, with 100.0% of males and 100.0% of females in these age groups living above the poverty line.
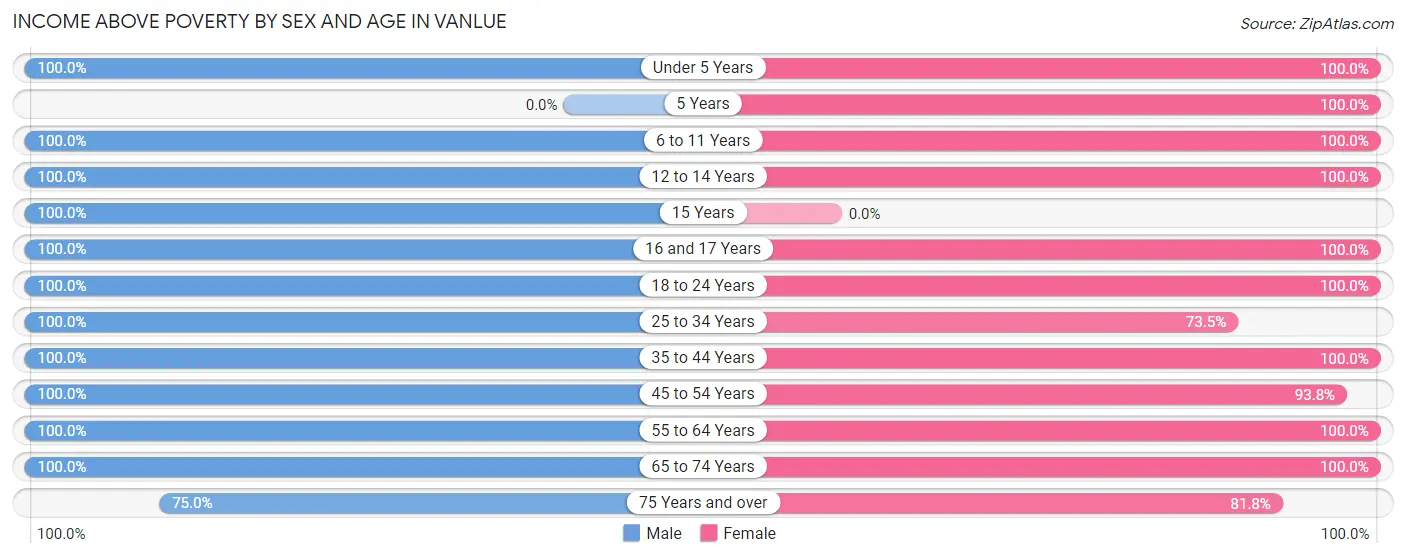
| Age Bracket | Male | Female |
| Under 5 Years | 12 (100.0%) | 4 (100.0%) |
| 5 Years | 0 (0.0%) | 1 (100.0%) |
| 6 to 11 Years | 7 (100.0%) | 18 (100.0%) |
| 12 to 14 Years | 6 (100.0%) | 1 (100.0%) |
| 15 Years | 3 (100.0%) | 0 (0.0%) |
| 16 and 17 Years | 7 (100.0%) | 1 (100.0%) |
| 18 to 24 Years | 14 (100.0%) | 12 (100.0%) |
| 25 to 34 Years | 34 (100.0%) | 25 (73.5%) |
| 35 to 44 Years | 10 (100.0%) | 13 (100.0%) |
| 45 to 54 Years | 28 (100.0%) | 30 (93.8%) |
| 55 to 64 Years | 20 (100.0%) | 16 (100.0%) |
| 65 to 74 Years | 18 (100.0%) | 11 (100.0%) |
| 75 Years and over | 6 (75.0%) | 9 (81.8%) |
| Total | 165 (97.6%) | 141 (91.6%) |
Income Below Poverty Among Married-Couple Families in Vanlue
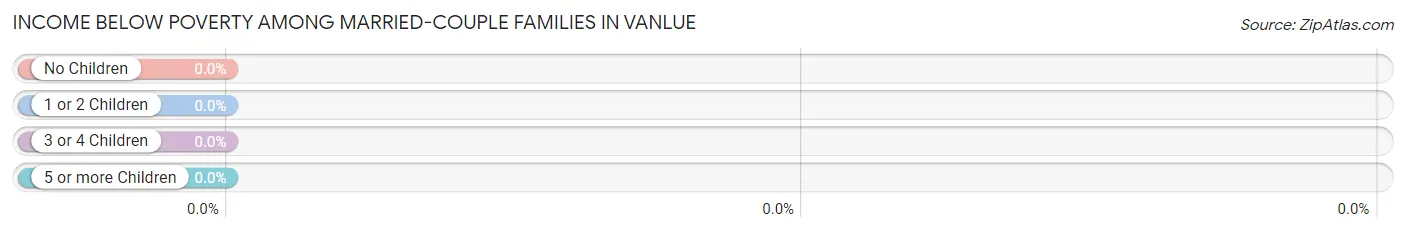
| Children | Above Poverty | Below Poverty |
| No Children | 57 (100.0%) | 0 (0.0%) |
| 1 or 2 Children | 22 (100.0%) | 0 (0.0%) |
| 3 or 4 Children | 7 (100.0%) | 0 (0.0%) |
| 5 or more Children | 0 (0.0%) | 0 (0.0%) |
| Total | 86 (100.0%) | 0 (0.0%) |
Income Below Poverty Among Single-Parent Households in Vanlue
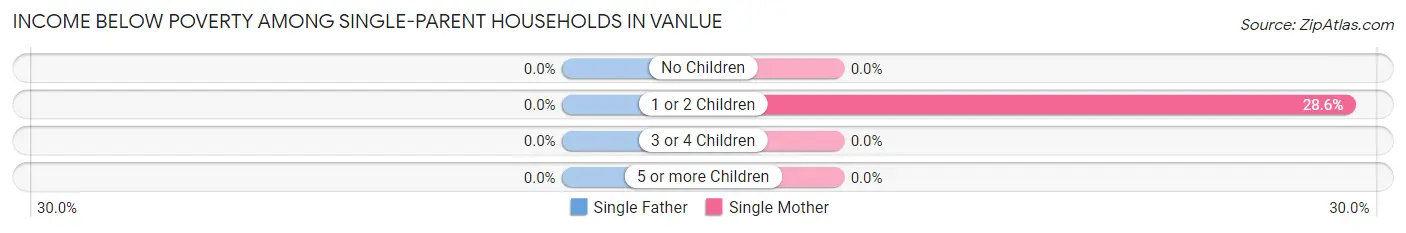
| Children | Single Father | Single Mother |
| No Children | 0 (0.0%) | 0 (0.0%) |
| 1 or 2 Children | 0 (0.0%) | 2 (28.6%) |
| 3 or 4 Children | 0 (0.0%) | 0 (0.0%) |
| 5 or more Children | 0 (0.0%) | 0 (0.0%) |
| Total | 0 (0.0%) | 2 (28.6%) |
Income Below Poverty Among Married-Couple vs Single-Parent Households in Vanlue
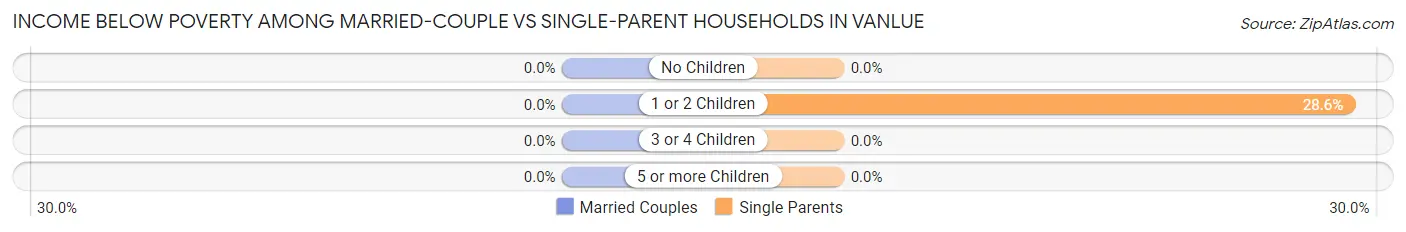
| Children | Married-Couple Families | Single-Parent Households |
| No Children | 0 (0.0%) | 0 (0.0%) |
| 1 or 2 Children | 0 (0.0%) | 2 (28.6%) |
| 3 or 4 Children | 0 (0.0%) | 0 (0.0%) |
| 5 or more Children | 0 (0.0%) | 0 (0.0%) |
| Total | 0 (0.0%) | 2 (22.2%) |
Race in Vanlue
The most populous races in Vanlue are White / Caucasian (306 | 94.7%), Hispanic or Latino (16 | 5.0%), and Two or more Races (9 | 2.8%).
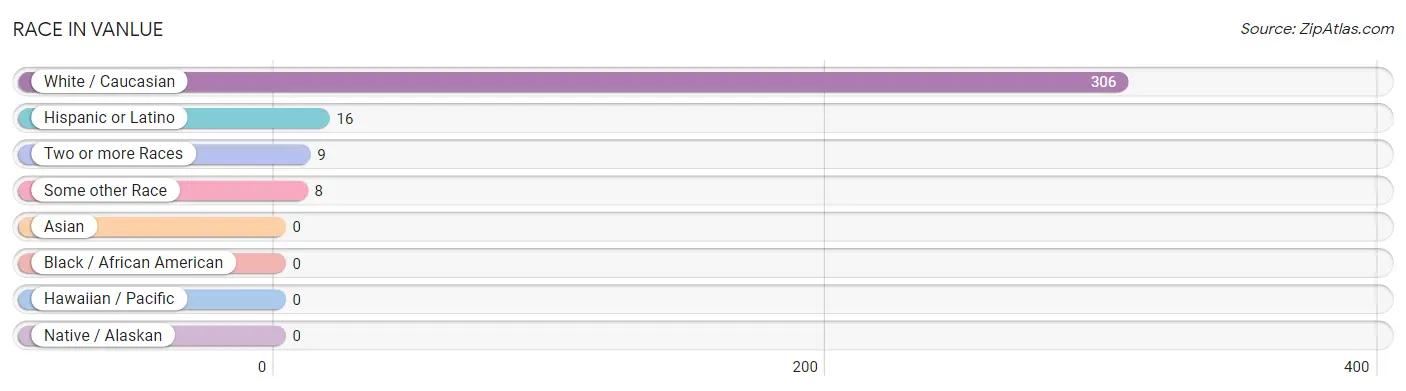
| Race | # Population | % Population |
| Asian | 0 | 0.0% |
| Black / African American | 0 | 0.0% |
| Hawaiian / Pacific | 0 | 0.0% |
| Hispanic or Latino | 16 | 5.0% |
| Native / Alaskan | 0 | 0.0% |
| White / Caucasian | 306 | 94.7% |
| Two or more Races | 9 | 2.8% |
| Some other Race | 8 | 2.5% |
| Total | 323 | 100.0% |
Ancestry in Vanlue
The most populous ancestries reported in Vanlue are German (101 | 31.3%), American (73 | 22.6%), Irish (25 | 7.7%), Mexican (10 | 3.1%), and Pennsylvania German (9 | 2.8%), together accounting for 67.5% of all Vanlue residents.
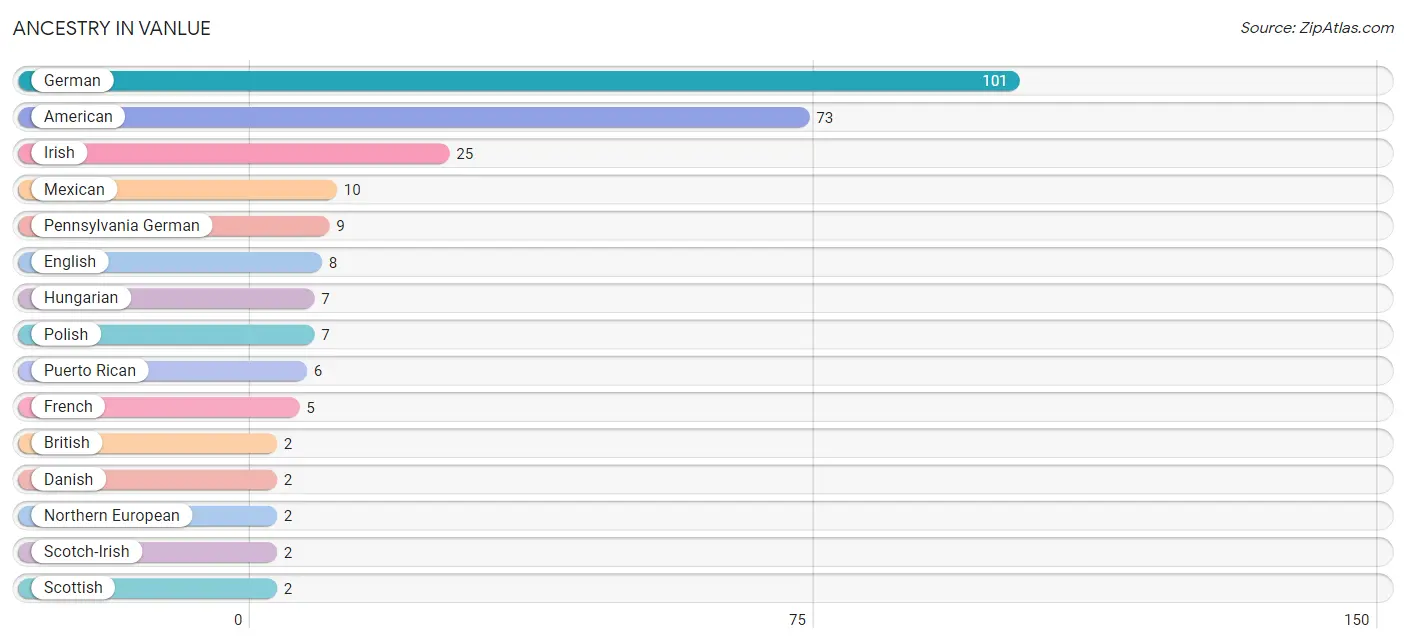
| Ancestry | # Population | % Population |
| American | 73 | 22.6% |
| British | 2 | 0.6% |
| Danish | 2 | 0.6% |
| English | 8 | 2.5% |
| French | 5 | 1.5% |
| German | 101 | 31.3% |
| Hungarian | 7 | 2.2% |
| Irish | 25 | 7.7% |
| Mexican | 10 | 3.1% |
| Northern European | 2 | 0.6% |
| Pennsylvania German | 9 | 2.8% |
| Polish | 7 | 2.2% |
| Puerto Rican | 6 | 1.9% |
| Scotch-Irish | 2 | 0.6% |
| Scottish | 2 | 0.6% |
| Serbian | 2 | 0.6% | View All 16 Rows |
Immigrants in Vanlue

| Immigration Origin | # Population | % Population | View All 0 Rows |
Sex and Age in Vanlue
Sex and Age in Vanlue
The most populous age groups in Vanlue are 15 to 19 Years (21 | 12.4%) for men and 25 to 29 Years (27 | 17.5%) for women.
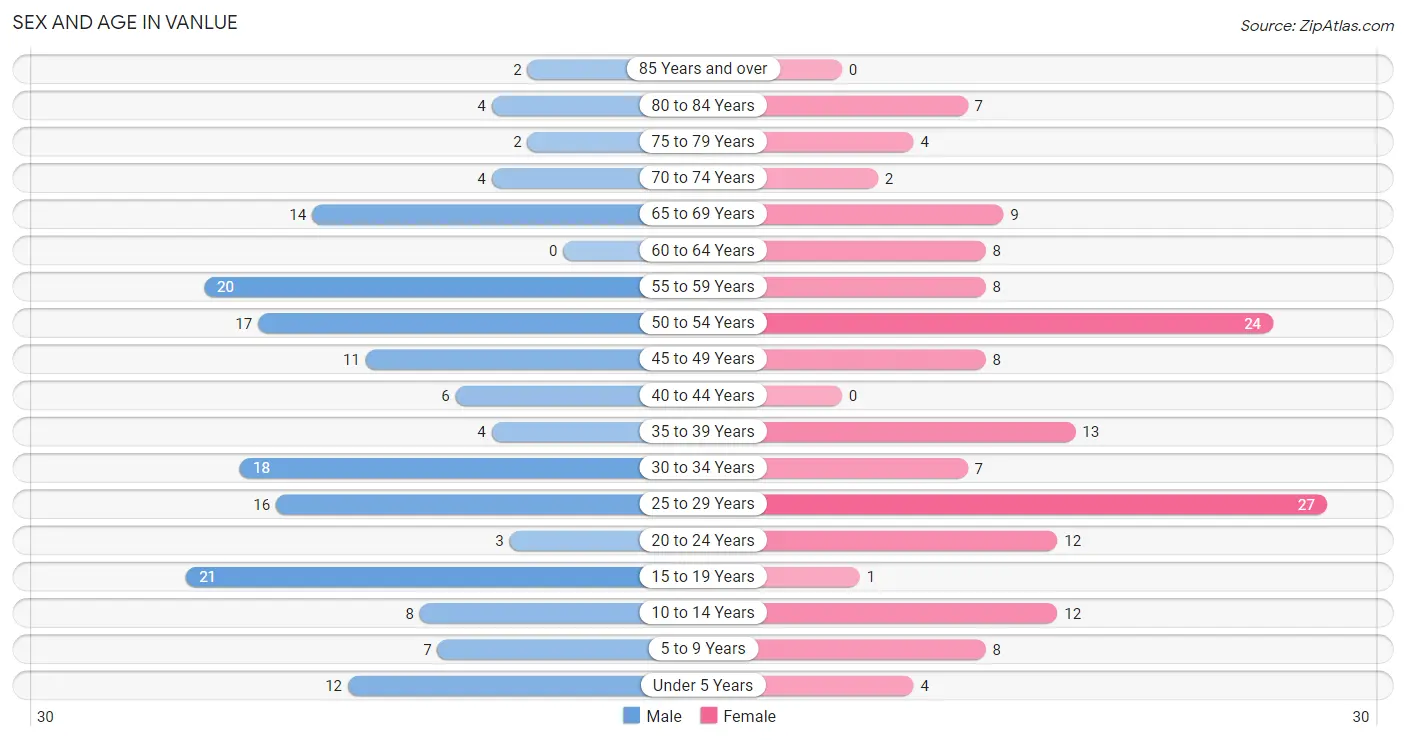
| Age Bracket | Male | Female |
| Under 5 Years | 12 (7.1%) | 4 (2.6%) |
| 5 to 9 Years | 7 (4.1%) | 8 (5.2%) |
| 10 to 14 Years | 8 (4.7%) | 12 (7.8%) |
| 15 to 19 Years | 21 (12.4%) | 1 (0.6%) |
| 20 to 24 Years | 3 (1.8%) | 12 (7.8%) |
| 25 to 29 Years | 16 (9.5%) | 27 (17.5%) |
| 30 to 34 Years | 18 (10.6%) | 7 (4.5%) |
| 35 to 39 Years | 4 (2.4%) | 13 (8.4%) |
| 40 to 44 Years | 6 (3.5%) | 0 (0.0%) |
| 45 to 49 Years | 11 (6.5%) | 8 (5.2%) |
| 50 to 54 Years | 17 (10.1%) | 24 (15.6%) |
| 55 to 59 Years | 20 (11.8%) | 8 (5.2%) |
| 60 to 64 Years | 0 (0.0%) | 8 (5.2%) |
| 65 to 69 Years | 14 (8.3%) | 9 (5.8%) |
| 70 to 74 Years | 4 (2.4%) | 2 (1.3%) |
| 75 to 79 Years | 2 (1.2%) | 4 (2.6%) |
| 80 to 84 Years | 4 (2.4%) | 7 (4.5%) |
| 85 Years and over | 2 (1.2%) | 0 (0.0%) |
| Total | 169 (100.0%) | 154 (100.0%) |
Families and Households in Vanlue
Median Family Size in Vanlue
The median family size in Vanlue is 2.77 persons per family, with married-couple families (86 | 90.5%) accounting for the largest median family size of 2.84 persons per family. On the other hand, single male/father families (2 | 2.1%) represent the smallest median family size with 2.00 persons per family.
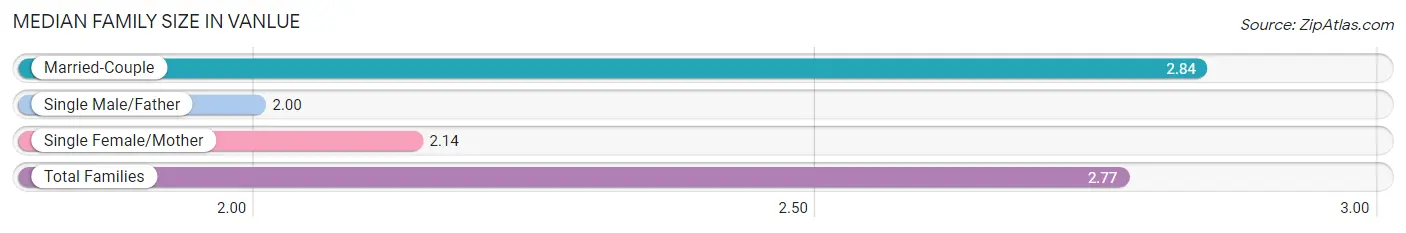
| Family Type | # Families | Family Size |
| Married-Couple | 86 (90.5%) | 2.84 |
| Single Male/Father | 2 (2.1%) | 2.00 |
| Single Female/Mother | 7 (7.4%) | 2.14 |
| Total Families | 95 (100.0%) | 2.77 |
Median Household Size in Vanlue
The median household size in Vanlue is 2.36 persons per household, with married-couple households (86 | 62.8%) accounting for the largest median household size of 2.84 persons per household. non-family households (42 | 30.7%) represent the smallest median household size with 1.43 persons per household.
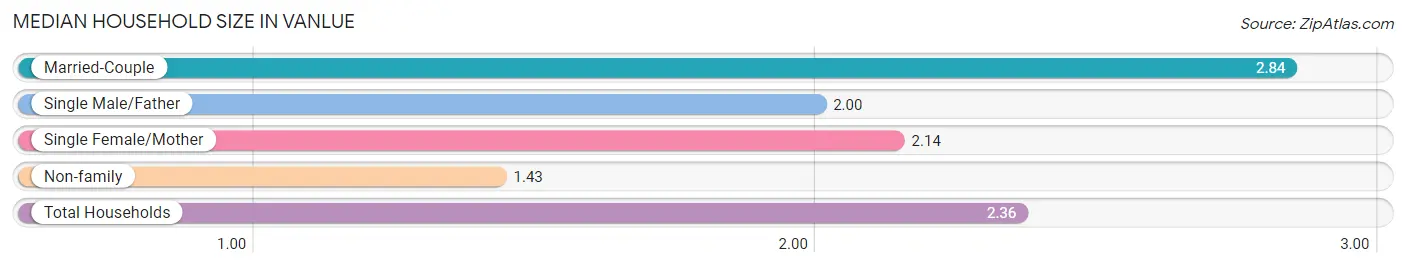
| Household Type | # Households | Household Size |
| Married-Couple | 86 (62.8%) | 2.84 |
| Single Male/Father | 2 (1.5%) | 2.00 |
| Single Female/Mother | 7 (5.1%) | 2.14 |
| Non-family | 42 (30.7%) | 1.43 |
| Total Households | 137 (100.0%) | 2.36 |
Household Size by Marriage Status in Vanlue
Out of a total of 137 households in Vanlue, 95 (69.3%) are family households, while 42 (30.7%) are nonfamily households. The most numerous type of family households are 2-person households, comprising 56, and the most common type of nonfamily households are 1-person households, comprising 26.
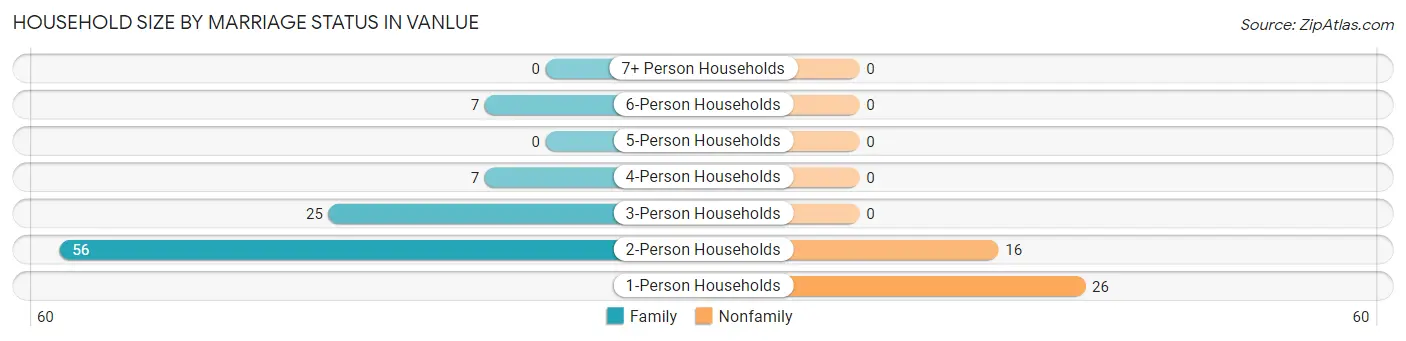
| Household Size | Family Households | Nonfamily Households |
| 1-Person Households | - | 26 (19.0%) |
| 2-Person Households | 56 (40.9%) | 16 (11.7%) |
| 3-Person Households | 25 (18.2%) | 0 (0.0%) |
| 4-Person Households | 7 (5.1%) | 0 (0.0%) |
| 5-Person Households | 0 (0.0%) | 0 (0.0%) |
| 6-Person Households | 7 (5.1%) | 0 (0.0%) |
| 7+ Person Households | 0 (0.0%) | 0 (0.0%) |
| Total | 95 (69.3%) | 42 (30.7%) |
Female Fertility in Vanlue
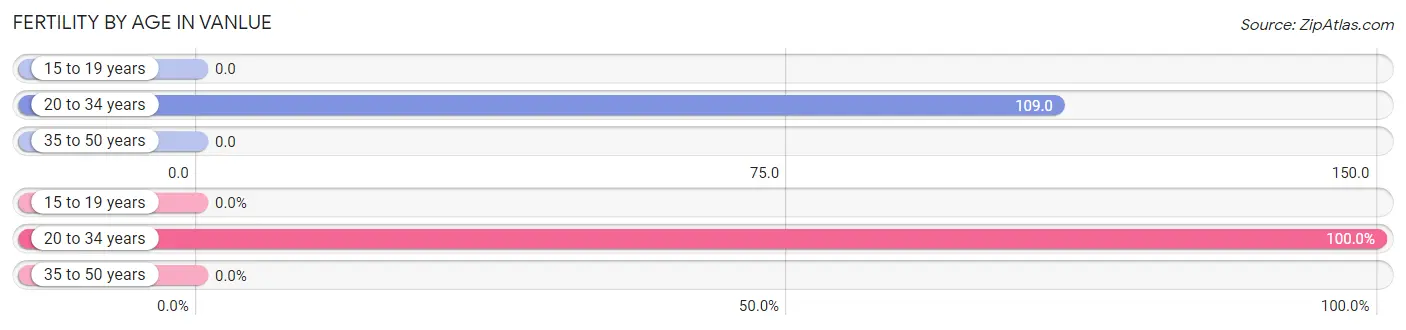
Fertility by Age in Vanlue
Average fertility rate in Vanlue is 74.0 births per 1,000 women. Women in the age bracket of 20 to 34 years have the highest fertility rate with 109.0 births per 1,000 women. Women in the age bracket of 20 to 34 years acount for 100.0% of all women with births.
| Age Bracket | Women with Births | Births / 1,000 Women |
| 15 to 19 years | 0 (0.0%) | 0.0 |
| 20 to 34 years | 5 (100.0%) | 109.0 |
| 35 to 50 years | 0 (0.0%) | 0.0 |
| Total | 5 (100.0%) | 74.0 |
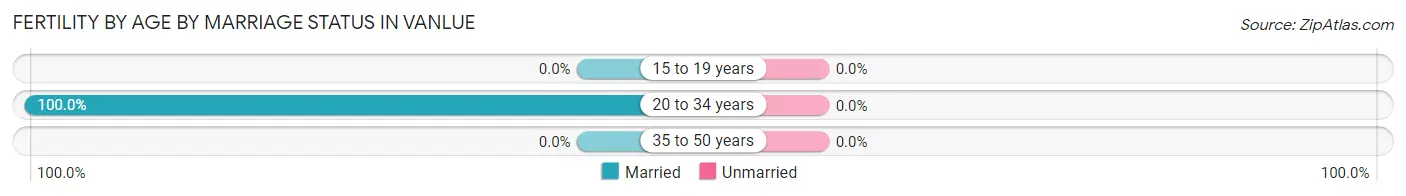
Fertility by Age by Marriage Status in Vanlue
| Age Bracket | Married | Unmarried |
| 15 to 19 years | 0 (0.0%) | 0 (0.0%) |
| 20 to 34 years | 5 (100.0%) | 0 (0.0%) |
| 35 to 50 years | 0 (0.0%) | 0 (0.0%) |
| Total | 5 (100.0%) | 0 (0.0%) |
Fertility by Education in Vanlue

| Educational Attainment | Women with Births | Births / 1,000 Women |
| Less than High School | 0 (0.0%) | 0.0 |
| High School Diploma | 0 (0.0%) | 0.0 |
| College or Associate's Degree | 0 (0.0%) | 0.0 |
| Bachelor's Degree | 0 (0.0%) | 0.0 |
| Graduate Degree | 5 (100.0%) | 500.0 |
| Total | 5 (100.0%) | 74.0 |
Fertility by Education by Marriage Status in Vanlue
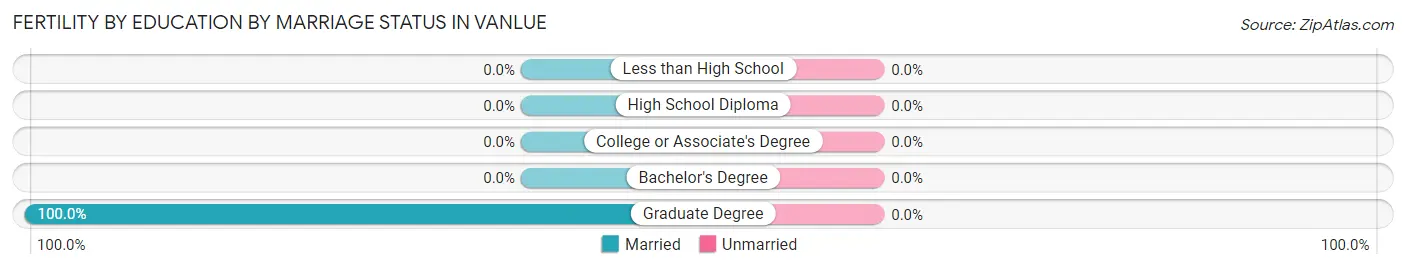
| Educational Attainment | Married | Unmarried |
| Less than High School | 0 (0.0%) | 0 (0.0%) |
| High School Diploma | 0 (0.0%) | 0 (0.0%) |
| College or Associate's Degree | 0 (0.0%) | 0 (0.0%) |
| Bachelor's Degree | 0 (0.0%) | 0 (0.0%) |
| Graduate Degree | 5 (100.0%) | 0 (0.0%) |
| Total | 5 (100.0%) | 0 (0.0%) |
Employment Characteristics in Vanlue
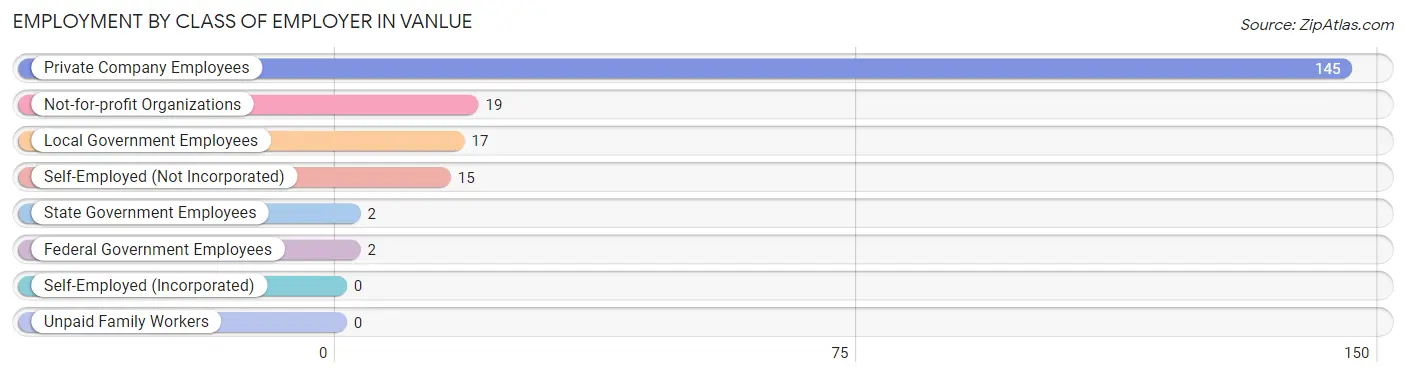
Employment by Class of Employer in Vanlue
Among the 200 employed individuals in Vanlue, private company employees (145 | 72.5%), not-for-profit organizations (19 | 9.5%), and local government employees (17 | 8.5%) make up the most common classes of employment.
| Employer Class | # Employees | % Employees |
| Private Company Employees | 145 | 72.5% |
| Self-Employed (Incorporated) | 0 | 0.0% |
| Self-Employed (Not Incorporated) | 15 | 7.5% |
| Not-for-profit Organizations | 19 | 9.5% |
| Local Government Employees | 17 | 8.5% |
| State Government Employees | 2 | 1.0% |
| Federal Government Employees | 2 | 1.0% |
| Unpaid Family Workers | 0 | 0.0% |
| Total | 200 | 100.0% |
Employment Status by Age in Vanlue
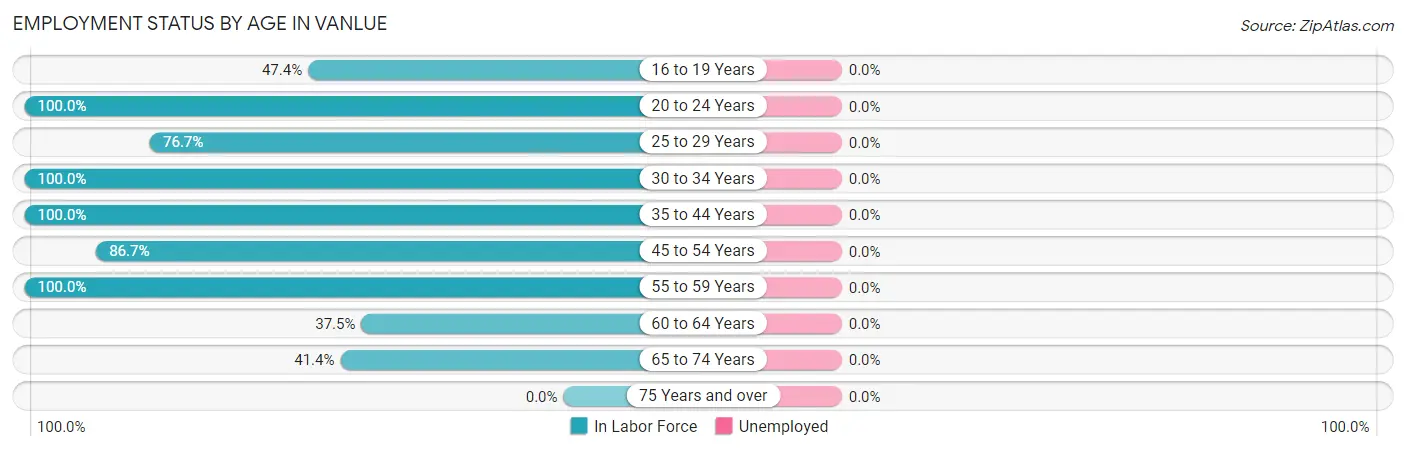
| Age Bracket | In Labor Force | Unemployed |
| 16 to 19 Years | 9 (47.4%) | 0 (0.0%) |
| 20 to 24 Years | 15 (100.0%) | 0 (0.0%) |
| 25 to 29 Years | 33 (76.7%) | 0 (0.0%) |
| 30 to 34 Years | 25 (100.0%) | 0 (0.0%) |
| 35 to 44 Years | 23 (100.0%) | 0 (0.0%) |
| 45 to 54 Years | 52 (86.7%) | 0 (0.0%) |
| 55 to 59 Years | 28 (100.0%) | 0 (0.0%) |
| 60 to 64 Years | 3 (37.5%) | 0 (0.0%) |
| 65 to 74 Years | 12 (41.4%) | 0 (0.0%) |
| 75 Years and over | 0 (0.0%) | 0 (0.0%) |
| Total | 200 (74.3%) | 0 (0.0%) |
Employment Status by Educational Attainment in Vanlue
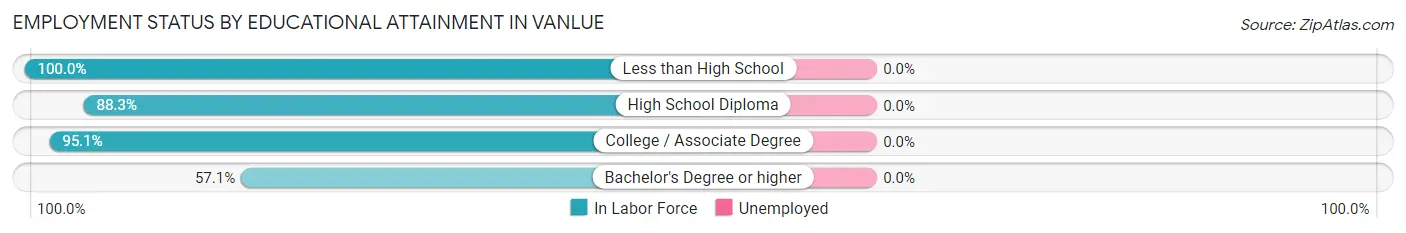
| Educational Attainment | In Labor Force | Unemployed |
| Less than High School | 11 (100.0%) | 0 (0.0%) |
| High School Diploma | 83 (88.3%) | 0 (0.0%) |
| College / Associate Degree | 58 (95.1%) | 0 (0.0%) |
| Bachelor's Degree or higher | 12 (57.1%) | 0 (0.0%) |
| Total | 164 (87.7%) | 0 (0.0%) |
Employment Occupations by Sex in Vanlue
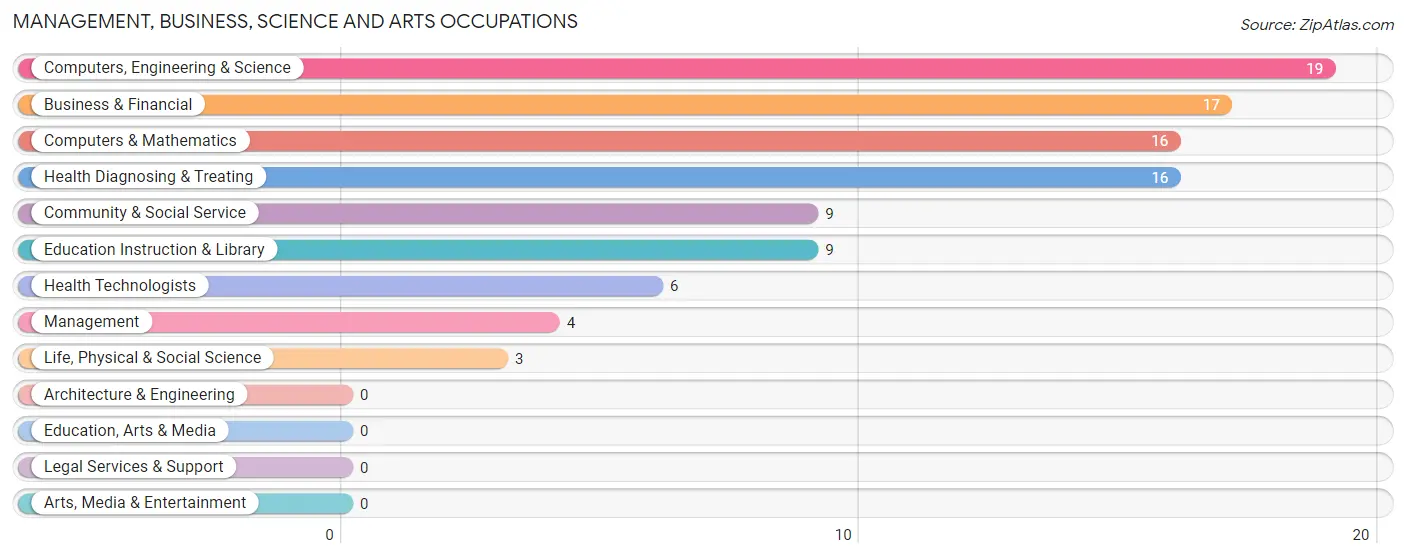
Management, Business, Science and Arts Occupations
The most common Management, Business, Science and Arts occupations in Vanlue are Computers, Engineering & Science (19 | 9.5%), Business & Financial (17 | 8.5%), Computers & Mathematics (16 | 8.0%), Health Diagnosing & Treating (16 | 8.0%), and Community & Social Service (9 | 4.5%).
Management, Business, Science and Arts Occupations by Sex
Within the Management, Business, Science and Arts occupations in Vanlue, the most male-oriented occupations are Management (100.0%), Computers, Engineering & Science (100.0%), and Computers & Mathematics (100.0%), while the most female-oriented occupations are Business & Financial (100.0%), Health Diagnosing & Treating (100.0%), and Health Technologists (100.0%).
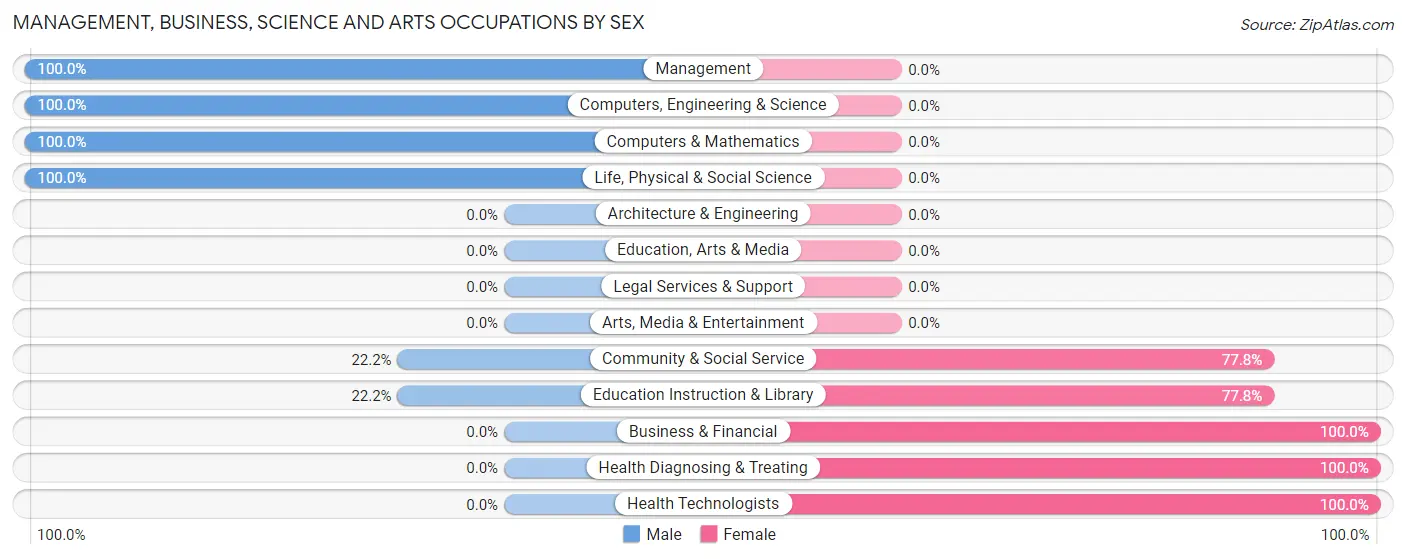
| Occupation | Male | Female |
| Management | 4 (100.0%) | 0 (0.0%) |
| Business & Financial | 0 (0.0%) | 17 (100.0%) |
| Computers, Engineering & Science | 19 (100.0%) | 0 (0.0%) |
| Computers & Mathematics | 16 (100.0%) | 0 (0.0%) |
| Architecture & Engineering | 0 (0.0%) | 0 (0.0%) |
| Life, Physical & Social Science | 3 (100.0%) | 0 (0.0%) |
| Community & Social Service | 2 (22.2%) | 7 (77.8%) |
| Education, Arts & Media | 0 (0.0%) | 0 (0.0%) |
| Legal Services & Support | 0 (0.0%) | 0 (0.0%) |
| Education Instruction & Library | 2 (22.2%) | 7 (77.8%) |
| Arts, Media & Entertainment | 0 (0.0%) | 0 (0.0%) |
| Health Diagnosing & Treating | 0 (0.0%) | 16 (100.0%) |
| Health Technologists | 0 (0.0%) | 6 (100.0%) |
| Total (Category) | 25 (38.5%) | 40 (61.5%) |
| Total (Overall) | 105 (52.5%) | 95 (47.5%) |
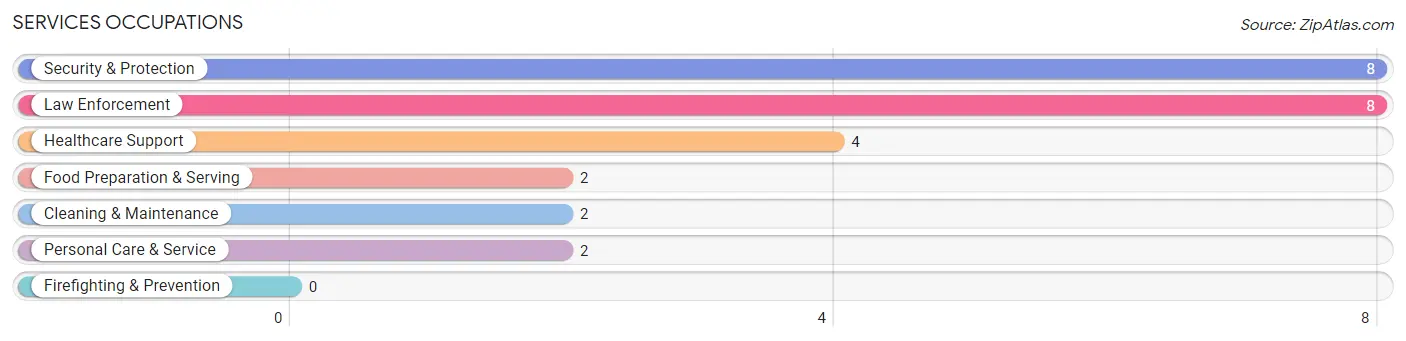
Services Occupations
The most common Services occupations in Vanlue are Security & Protection (8 | 4.0%), Law Enforcement (8 | 4.0%), Healthcare Support (4 | 2.0%), Food Preparation & Serving (2 | 1.0%), and Cleaning & Maintenance (2 | 1.0%).
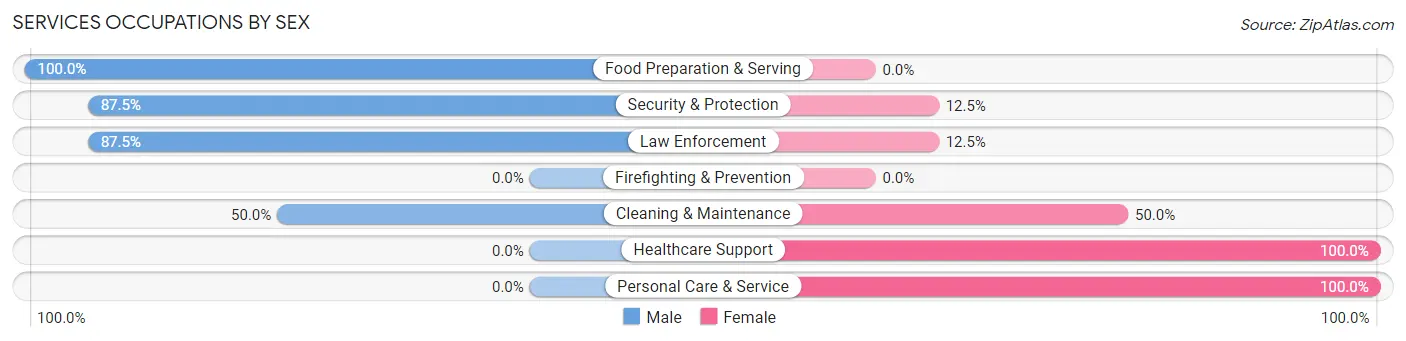
Services Occupations by Sex
Within the Services occupations in Vanlue, the most male-oriented occupations are Food Preparation & Serving (100.0%), Security & Protection (87.5%), and Law Enforcement (87.5%), while the most female-oriented occupations are Healthcare Support (100.0%), Personal Care & Service (100.0%), and Cleaning & Maintenance (50.0%).
| Occupation | Male | Female |
| Healthcare Support | 0 (0.0%) | 4 (100.0%) |
| Security & Protection | 7 (87.5%) | 1 (12.5%) |
| Firefighting & Prevention | 0 (0.0%) | 0 (0.0%) |
| Law Enforcement | 7 (87.5%) | 1 (12.5%) |
| Food Preparation & Serving | 2 (100.0%) | 0 (0.0%) |
| Cleaning & Maintenance | 1 (50.0%) | 1 (50.0%) |
| Personal Care & Service | 0 (0.0%) | 2 (100.0%) |
| Total (Category) | 10 (55.6%) | 8 (44.4%) |
| Total (Overall) | 105 (52.5%) | 95 (47.5%) |
Sales and Office Occupations
The most common Sales and Office occupations in Vanlue are Office & Administration (27 | 13.5%), and Sales & Related (19 | 9.5%).

Sales and Office Occupations by Sex

| Occupation | Male | Female |
| Sales & Related | 12 (63.2%) | 7 (36.8%) |
| Office & Administration | 3 (11.1%) | 24 (88.9%) |
| Total (Category) | 15 (32.6%) | 31 (67.4%) |
| Total (Overall) | 105 (52.5%) | 95 (47.5%) |
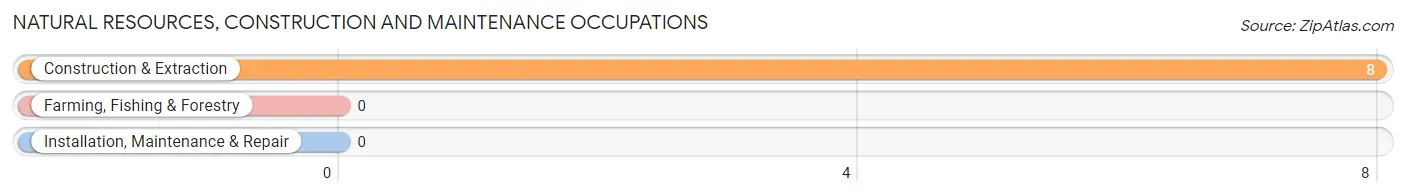
Natural Resources, Construction and Maintenance Occupations
The most common Natural Resources, Construction and Maintenance occupations in Vanlue are , and Construction & Extraction (8 | 4.0%).
Natural Resources, Construction and Maintenance Occupations by Sex

| Occupation | Male | Female |
| Farming, Fishing & Forestry | 0 (0.0%) | 0 (0.0%) |
| Construction & Extraction | 8 (100.0%) | 0 (0.0%) |
| Installation, Maintenance & Repair | 0 (0.0%) | 0 (0.0%) |
| Total (Category) | 8 (100.0%) | 0 (0.0%) |
| Total (Overall) | 105 (52.5%) | 95 (47.5%) |
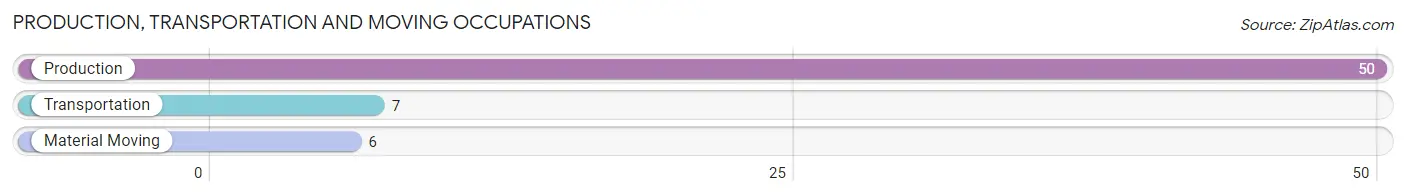
Production, Transportation and Moving Occupations
The most common Production, Transportation and Moving occupations in Vanlue are Production (50 | 25.0%), Transportation (7 | 3.5%), and Material Moving (6 | 3.0%).
Production, Transportation and Moving Occupations by Sex
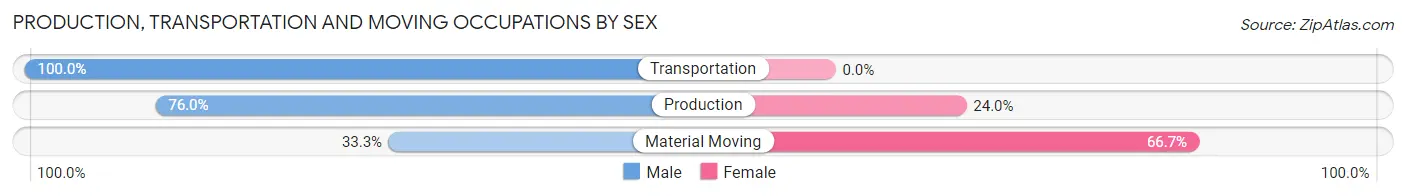
| Occupation | Male | Female |
| Production | 38 (76.0%) | 12 (24.0%) |
| Transportation | 7 (100.0%) | 0 (0.0%) |
| Material Moving | 2 (33.3%) | 4 (66.7%) |
| Total (Category) | 47 (74.6%) | 16 (25.4%) |
| Total (Overall) | 105 (52.5%) | 95 (47.5%) |
Employment Industries by Sex in Vanlue
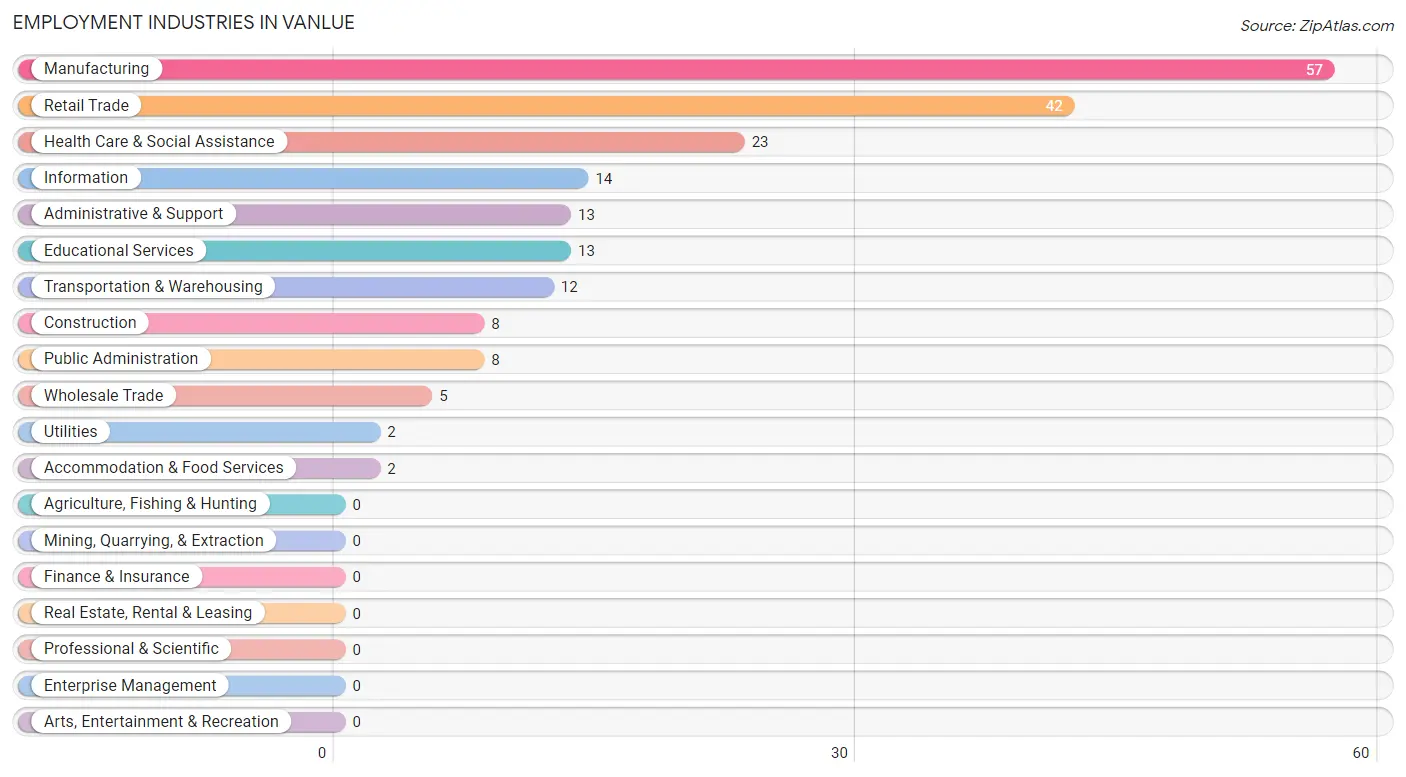
Employment Industries in Vanlue
The major employment industries in Vanlue include Manufacturing (57 | 28.5%), Retail Trade (42 | 21.0%), Health Care & Social Assistance (23 | 11.5%), Information (14 | 7.0%), and Administrative & Support (13 | 6.5%).
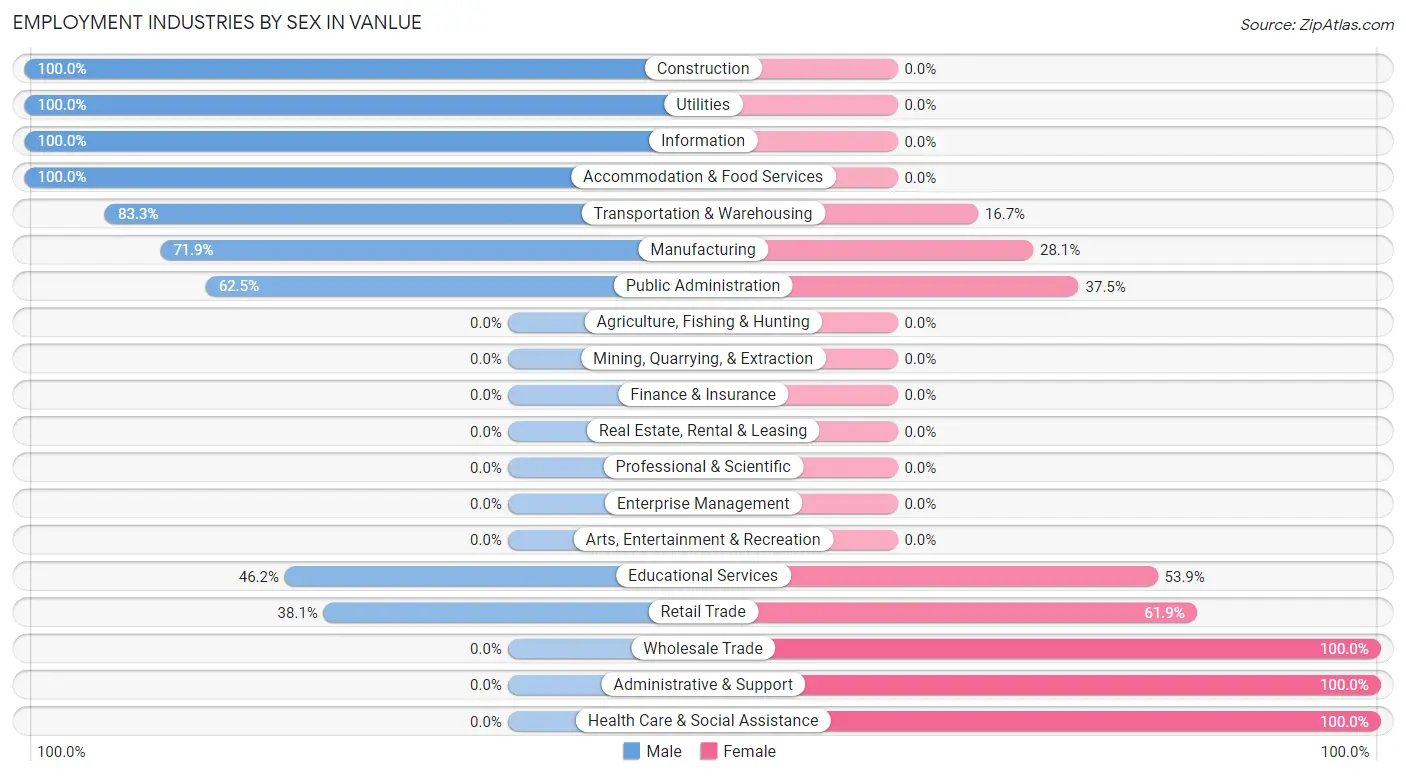
Employment Industries by Sex in Vanlue
The Vanlue industries that see more men than women are Construction (100.0%), Utilities (100.0%), and Information (100.0%), whereas the industries that tend to have a higher number of women are Wholesale Trade (100.0%), Administrative & Support (100.0%), and Health Care & Social Assistance (100.0%).
| Industry | Male | Female |
| Agriculture, Fishing & Hunting | 0 (0.0%) | 0 (0.0%) |
| Mining, Quarrying, & Extraction | 0 (0.0%) | 0 (0.0%) |
| Construction | 8 (100.0%) | 0 (0.0%) |
| Manufacturing | 41 (71.9%) | 16 (28.1%) |
| Wholesale Trade | 0 (0.0%) | 5 (100.0%) |
| Retail Trade | 16 (38.1%) | 26 (61.9%) |
| Transportation & Warehousing | 10 (83.3%) | 2 (16.7%) |
| Utilities | 2 (100.0%) | 0 (0.0%) |
| Information | 14 (100.0%) | 0 (0.0%) |
| Finance & Insurance | 0 (0.0%) | 0 (0.0%) |
| Real Estate, Rental & Leasing | 0 (0.0%) | 0 (0.0%) |
| Professional & Scientific | 0 (0.0%) | 0 (0.0%) |
| Enterprise Management | 0 (0.0%) | 0 (0.0%) |
| Administrative & Support | 0 (0.0%) | 13 (100.0%) |
| Educational Services | 6 (46.2%) | 7 (53.8%) |
| Health Care & Social Assistance | 0 (0.0%) | 23 (100.0%) |
| Arts, Entertainment & Recreation | 0 (0.0%) | 0 (0.0%) |
| Accommodation & Food Services | 2 (100.0%) | 0 (0.0%) |
| Public Administration | 5 (62.5%) | 3 (37.5%) |
| Total | 105 (52.5%) | 95 (47.5%) |
Education in Vanlue
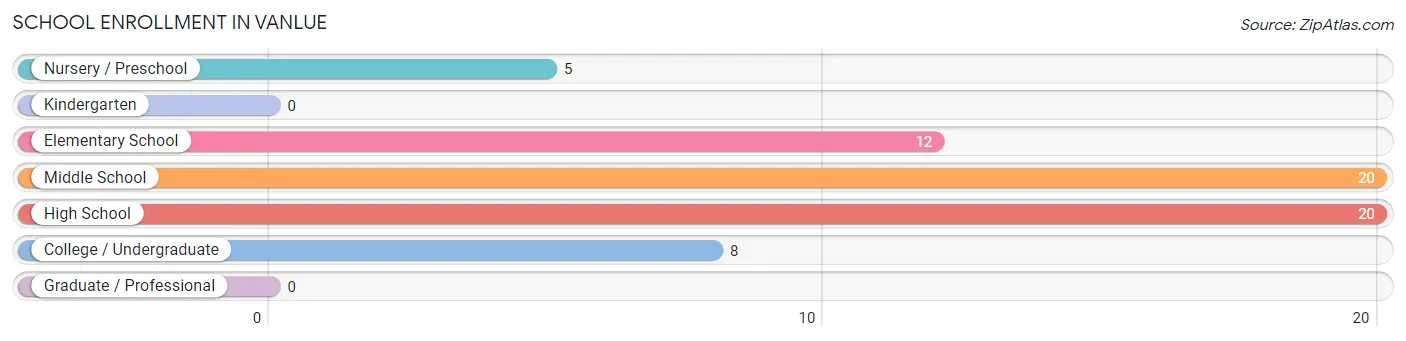
School Enrollment in Vanlue
The most common levels of schooling among the 65 students in Vanlue are middle school (20 | 30.8%), high school (20 | 30.8%), and elementary school (12 | 18.5%).
| School Level | # Students | % Students |
| Nursery / Preschool | 5 | 7.7% |
| Kindergarten | 0 | 0.0% |
| Elementary School | 12 | 18.5% |
| Middle School | 20 | 30.8% |
| High School | 20 | 30.8% |
| College / Undergraduate | 8 | 12.3% |
| Graduate / Professional | 0 | 0.0% |
| Total | 65 | 100.0% |
School Enrollment by Age by Funding Source in Vanlue
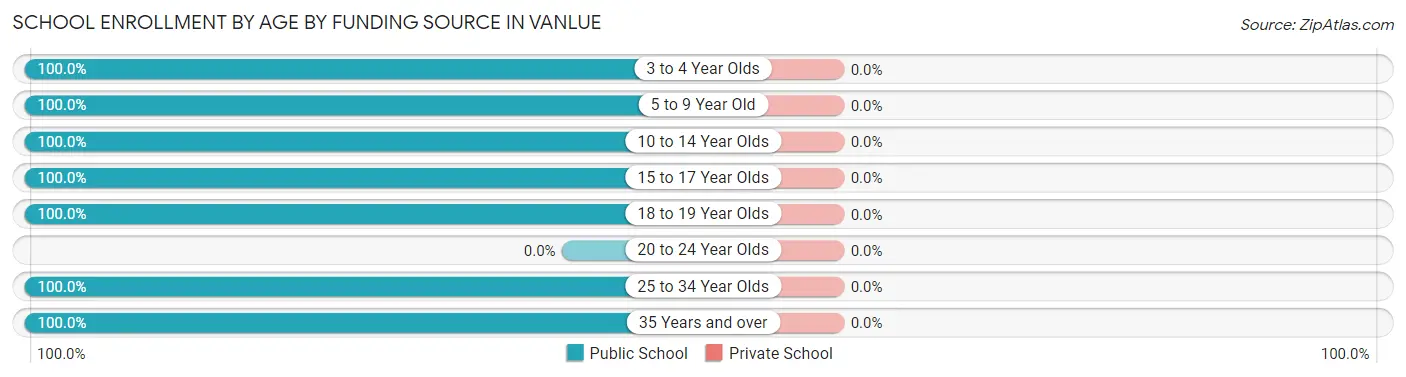
| Age Bracket | Public School | Private School |
| 3 to 4 Year Olds | 4 (100.0%) | 0 (0.0%) |
| 5 to 9 Year Old | 13 (100.0%) | 0 (0.0%) |
| 10 to 14 Year Olds | 20 (100.0%) | 0 (0.0%) |
| 15 to 17 Year Olds | 11 (100.0%) | 0 (0.0%) |
| 18 to 19 Year Olds | 11 (100.0%) | 0 (0.0%) |
| 20 to 24 Year Olds | 0 (0.0%) | 0 (0.0%) |
| 25 to 34 Year Olds | 2 (100.0%) | 0 (0.0%) |
| 35 Years and over | 4 (100.0%) | 0 (0.0%) |
| Total | 65 (100.0%) | 0 (0.0%) |
Educational Attainment by Field of Study in Vanlue
Business (8 | 28.6%), education (8 | 28.6%), science & technology (5 | 17.9%), social sciences (4 | 14.3%), and arts & humanities (2 | 7.1%) are the most common fields of study among 28 individuals in Vanlue who have obtained a bachelor's degree or higher.
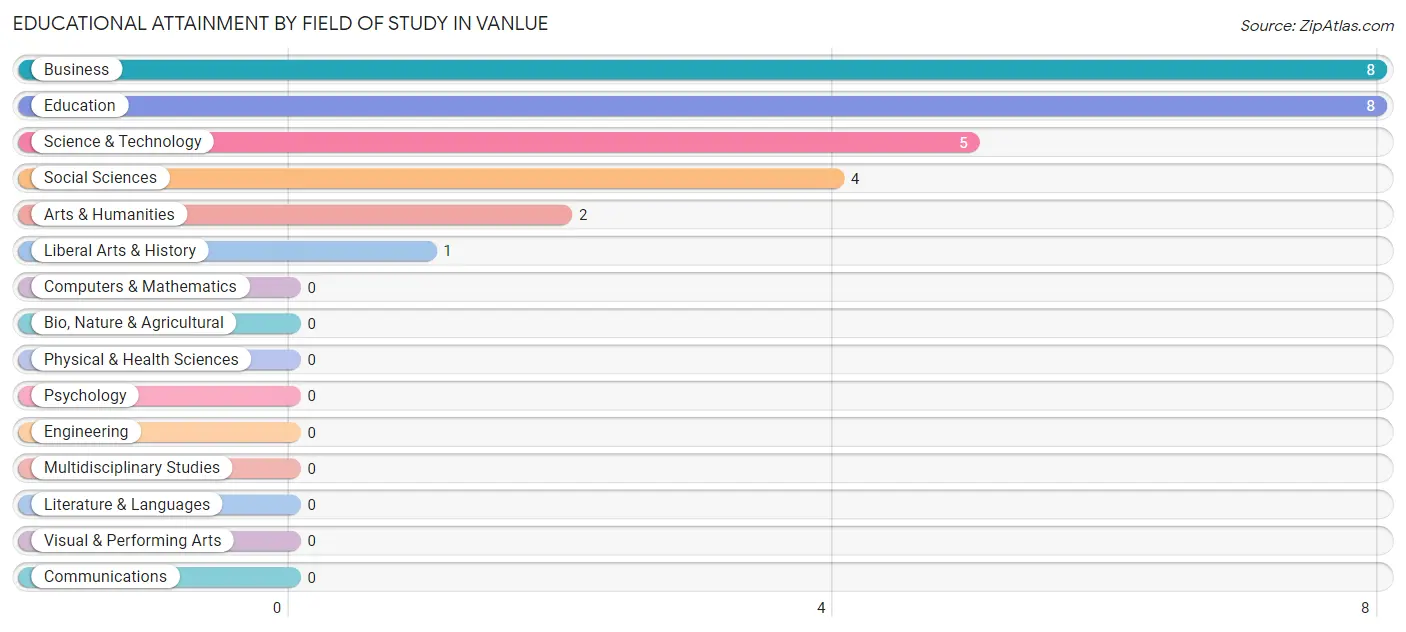
| Field of Study | # Graduates | % Graduates |
| Computers & Mathematics | 0 | 0.0% |
| Bio, Nature & Agricultural | 0 | 0.0% |
| Physical & Health Sciences | 0 | 0.0% |
| Psychology | 0 | 0.0% |
| Social Sciences | 4 | 14.3% |
| Engineering | 0 | 0.0% |
| Multidisciplinary Studies | 0 | 0.0% |
| Science & Technology | 5 | 17.9% |
| Business | 8 | 28.6% |
| Education | 8 | 28.6% |
| Literature & Languages | 0 | 0.0% |
| Liberal Arts & History | 1 | 3.6% |
| Visual & Performing Arts | 0 | 0.0% |
| Communications | 0 | 0.0% |
| Arts & Humanities | 2 | 7.1% |
| Total | 28 | 100.0% |
Transportation & Commute in Vanlue
Vehicle Availability by Sex in Vanlue
The most prevalent vehicle ownership categories in Vanlue are males with 3 vehicles (48, accounting for 45.7%) and females with 3 vehicles (38, making up 50.5%).
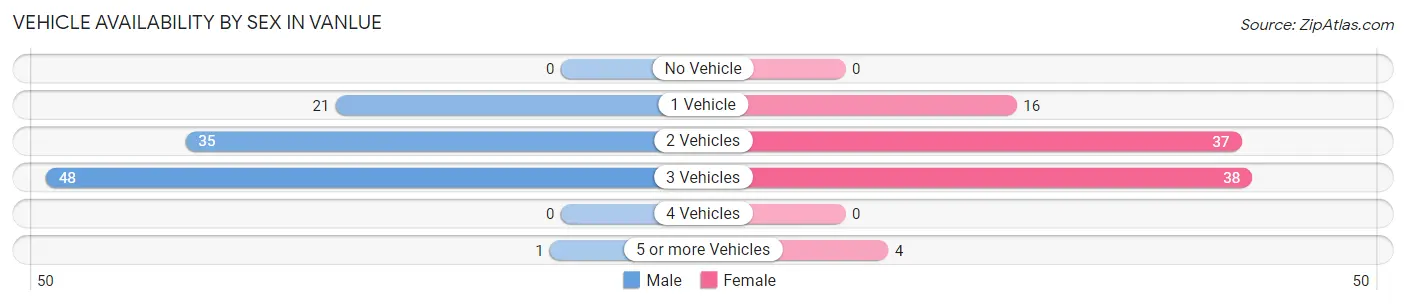
| Vehicles Available | Male | Female |
| No Vehicle | 0 (0.0%) | 0 (0.0%) |
| 1 Vehicle | 21 (20.0%) | 16 (16.8%) |
| 2 Vehicles | 35 (33.3%) | 37 (39.0%) |
| 3 Vehicles | 48 (45.7%) | 38 (40.0%) |
| 4 Vehicles | 0 (0.0%) | 0 (0.0%) |
| 5 or more Vehicles | 1 (0.9%) | 4 (4.2%) |
| Total | 105 (100.0%) | 95 (100.0%) |
Commute Time in Vanlue
The most frequently occuring commute durations in Vanlue are 15 to 19 minutes (58 commuters, 31.7%), 10 to 14 minutes (34 commuters, 18.6%), and 20 to 24 minutes (32 commuters, 17.5%).
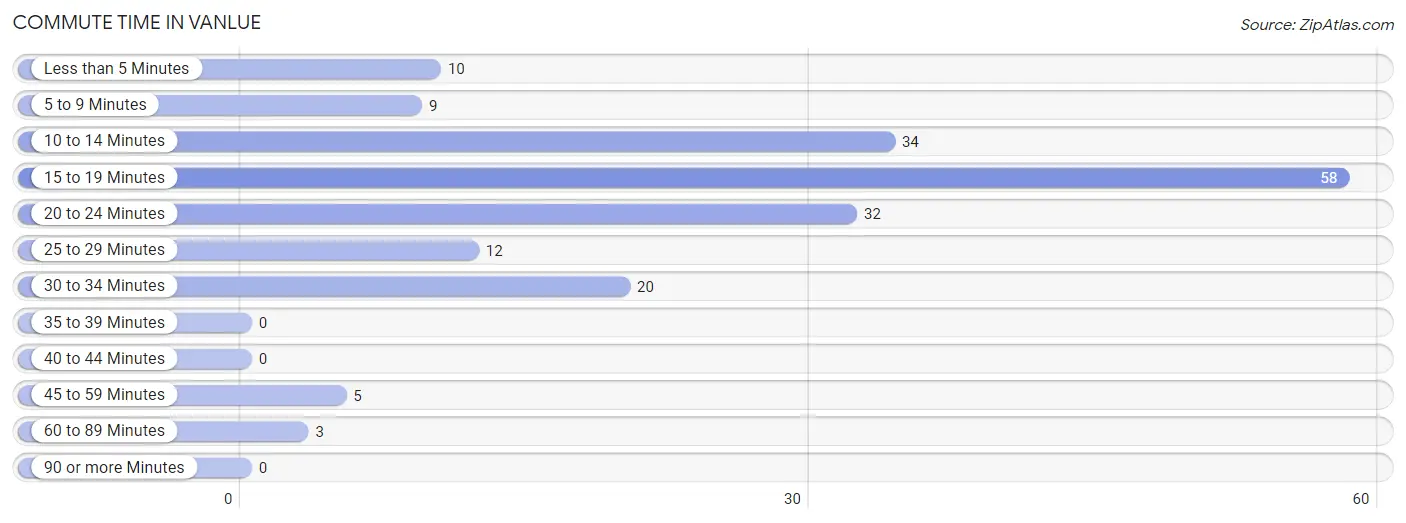
| Commute Time | # Commuters | % Commuters |
| Less than 5 Minutes | 10 | 5.5% |
| 5 to 9 Minutes | 9 | 4.9% |
| 10 to 14 Minutes | 34 | 18.6% |
| 15 to 19 Minutes | 58 | 31.7% |
| 20 to 24 Minutes | 32 | 17.5% |
| 25 to 29 Minutes | 12 | 6.6% |
| 30 to 34 Minutes | 20 | 10.9% |
| 35 to 39 Minutes | 0 | 0.0% |
| 40 to 44 Minutes | 0 | 0.0% |
| 45 to 59 Minutes | 5 | 2.7% |
| 60 to 89 Minutes | 3 | 1.6% |
| 90 or more Minutes | 0 | 0.0% |
Commute Time by Sex in Vanlue
The most common commute times in Vanlue are 10 to 14 minutes (30 commuters, 30.0%) for males and 15 to 19 minutes (30 commuters, 36.1%) for females.
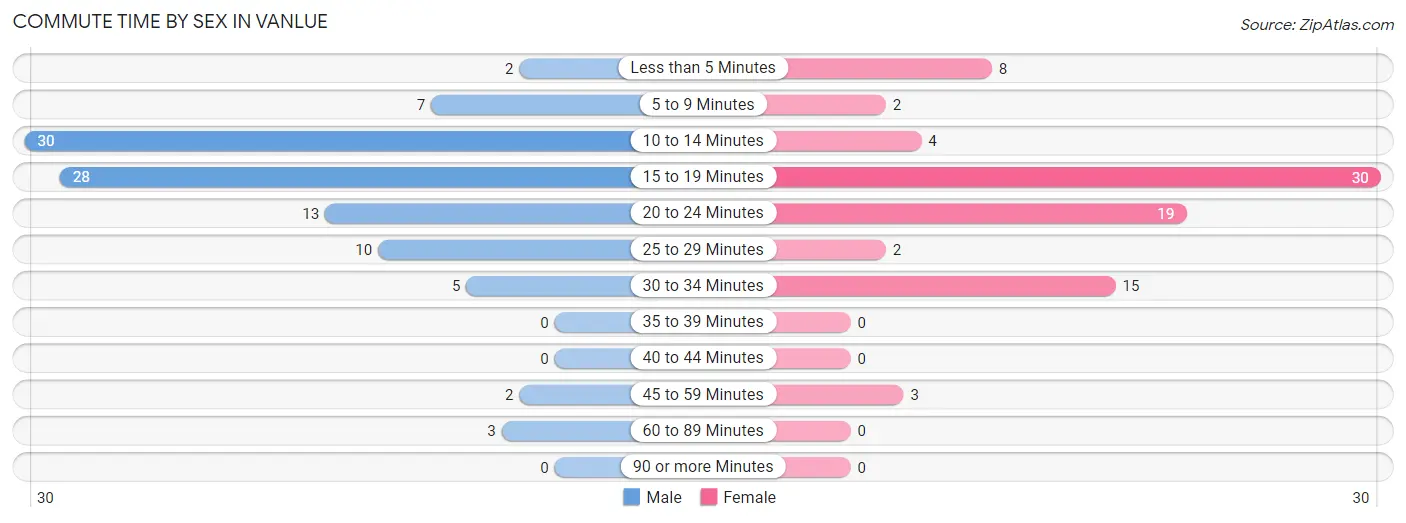
| Commute Time | Male | Female |
| Less than 5 Minutes | 2 (2.0%) | 8 (9.6%) |
| 5 to 9 Minutes | 7 (7.0%) | 2 (2.4%) |
| 10 to 14 Minutes | 30 (30.0%) | 4 (4.8%) |
| 15 to 19 Minutes | 28 (28.0%) | 30 (36.1%) |
| 20 to 24 Minutes | 13 (13.0%) | 19 (22.9%) |
| 25 to 29 Minutes | 10 (10.0%) | 2 (2.4%) |
| 30 to 34 Minutes | 5 (5.0%) | 15 (18.1%) |
| 35 to 39 Minutes | 0 (0.0%) | 0 (0.0%) |
| 40 to 44 Minutes | 0 (0.0%) | 0 (0.0%) |
| 45 to 59 Minutes | 2 (2.0%) | 3 (3.6%) |
| 60 to 89 Minutes | 3 (3.0%) | 0 (0.0%) |
| 90 or more Minutes | 0 (0.0%) | 0 (0.0%) |
Time of Departure to Work by Sex in Vanlue
The most frequent times of departure to work in Vanlue are 12:00 PM to 3:59 PM (32, 32.0%) for males and 5:30 AM to 5:59 AM (14, 16.9%) for females.
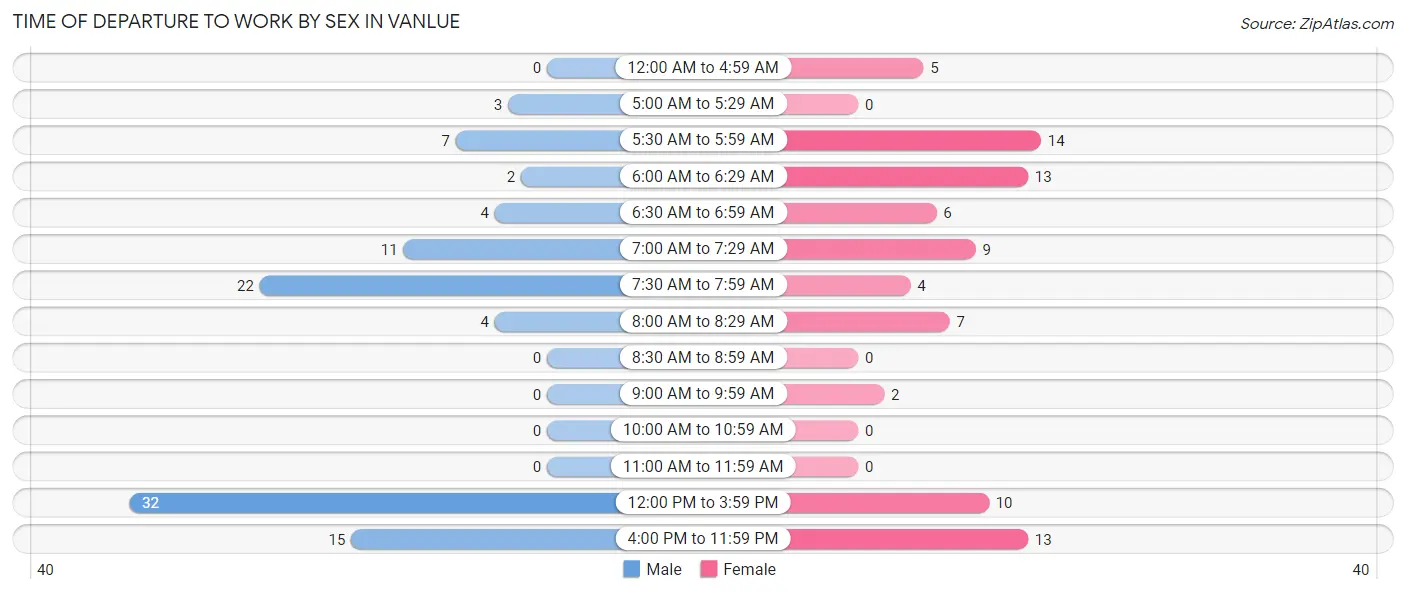
| Time of Departure | Male | Female |
| 12:00 AM to 4:59 AM | 0 (0.0%) | 5 (6.0%) |
| 5:00 AM to 5:29 AM | 3 (3.0%) | 0 (0.0%) |
| 5:30 AM to 5:59 AM | 7 (7.0%) | 14 (16.9%) |
| 6:00 AM to 6:29 AM | 2 (2.0%) | 13 (15.7%) |
| 6:30 AM to 6:59 AM | 4 (4.0%) | 6 (7.2%) |
| 7:00 AM to 7:29 AM | 11 (11.0%) | 9 (10.8%) |
| 7:30 AM to 7:59 AM | 22 (22.0%) | 4 (4.8%) |
| 8:00 AM to 8:29 AM | 4 (4.0%) | 7 (8.4%) |
| 8:30 AM to 8:59 AM | 0 (0.0%) | 0 (0.0%) |
| 9:00 AM to 9:59 AM | 0 (0.0%) | 2 (2.4%) |
| 10:00 AM to 10:59 AM | 0 (0.0%) | 0 (0.0%) |
| 11:00 AM to 11:59 AM | 0 (0.0%) | 0 (0.0%) |
| 12:00 PM to 3:59 PM | 32 (32.0%) | 10 (12.0%) |
| 4:00 PM to 11:59 PM | 15 (15.0%) | 13 (15.7%) |
| Total | 100 (100.0%) | 83 (100.0%) |
Housing Occupancy in Vanlue
Occupancy by Ownership in Vanlue
Of the total 137 dwellings in Vanlue, owner-occupied units account for 98 (71.5%), while renter-occupied units make up 39 (28.5%).
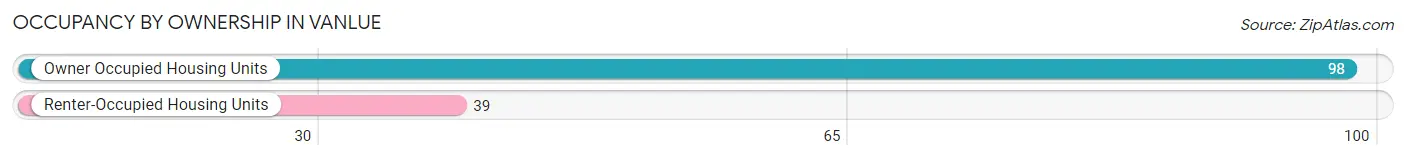
| Occupancy | # Housing Units | % Housing Units |
| Owner Occupied Housing Units | 98 | 71.5% |
| Renter-Occupied Housing Units | 39 | 28.5% |
| Total Occupied Housing Units | 137 | 100.0% |
Occupancy by Household Size in Vanlue
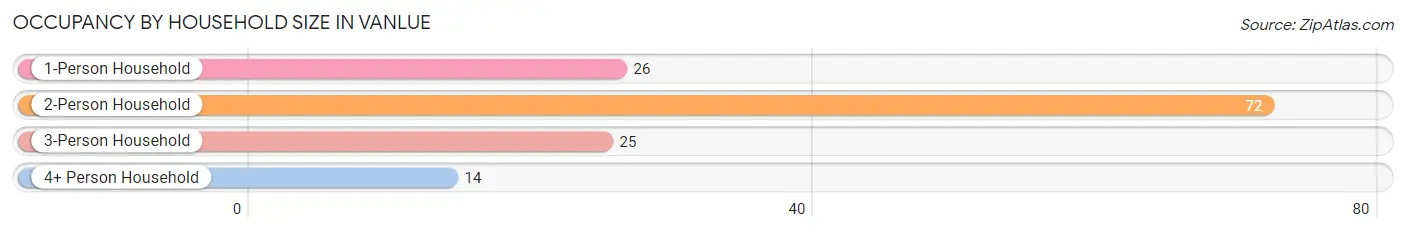
| Household Size | # Housing Units | % Housing Units |
| 1-Person Household | 26 | 19.0% |
| 2-Person Household | 72 | 52.5% |
| 3-Person Household | 25 | 18.2% |
| 4+ Person Household | 14 | 10.2% |
| Total Housing Units | 137 | 100.0% |
Occupancy by Ownership by Household Size in Vanlue
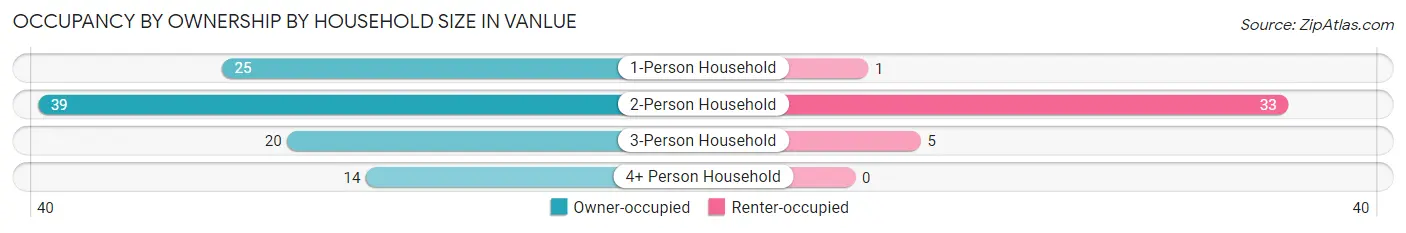
| Household Size | Owner-occupied | Renter-occupied |
| 1-Person Household | 25 (96.2%) | 1 (3.8%) |
| 2-Person Household | 39 (54.2%) | 33 (45.8%) |
| 3-Person Household | 20 (80.0%) | 5 (20.0%) |
| 4+ Person Household | 14 (100.0%) | 0 (0.0%) |
| Total Housing Units | 98 (71.5%) | 39 (28.5%) |
Occupancy by Educational Attainment in Vanlue
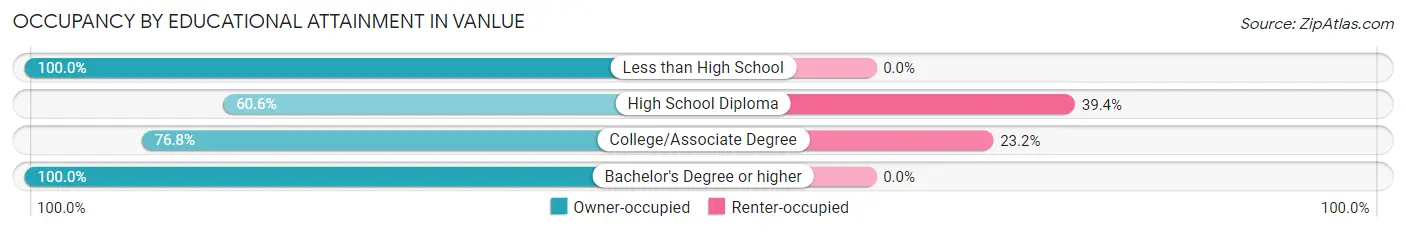
| Household Size | Owner-occupied | Renter-occupied |
| Less than High School | 4 (100.0%) | 0 (0.0%) |
| High School Diploma | 40 (60.6%) | 26 (39.4%) |
| College/Associate Degree | 43 (76.8%) | 13 (23.2%) |
| Bachelor's Degree or higher | 11 (100.0%) | 0 (0.0%) |
Occupancy by Age of Householder in Vanlue
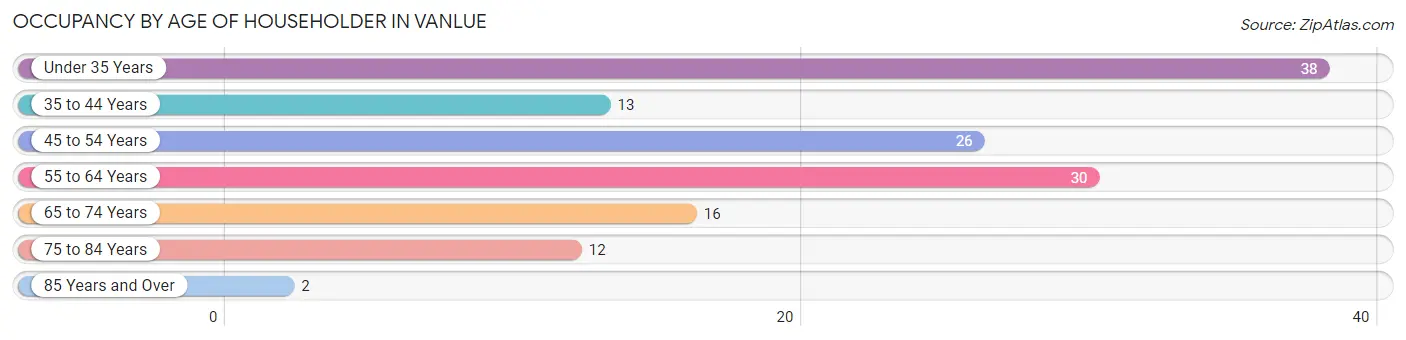
| Age Bracket | # Households | % Households |
| Under 35 Years | 38 | 27.7% |
| 35 to 44 Years | 13 | 9.5% |
| 45 to 54 Years | 26 | 19.0% |
| 55 to 64 Years | 30 | 21.9% |
| 65 to 74 Years | 16 | 11.7% |
| 75 to 84 Years | 12 | 8.8% |
| 85 Years and Over | 2 | 1.5% |
| Total | 137 | 100.0% |
Housing Finances in Vanlue
Median Income by Occupancy in Vanlue
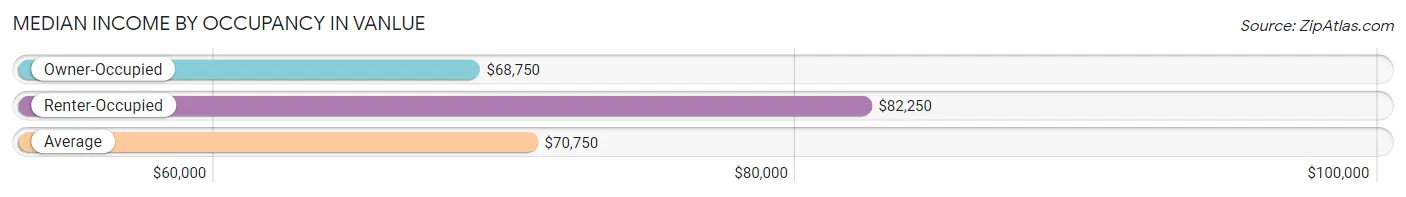
| Occupancy Type | # Households | Median Income |
| Owner-Occupied | 98 (71.5%) | $68,750 |
| Renter-Occupied | 39 (28.5%) | $82,250 |
| Average | 137 (100.0%) | $70,750 |
Occupancy by Householder Income Bracket in Vanlue
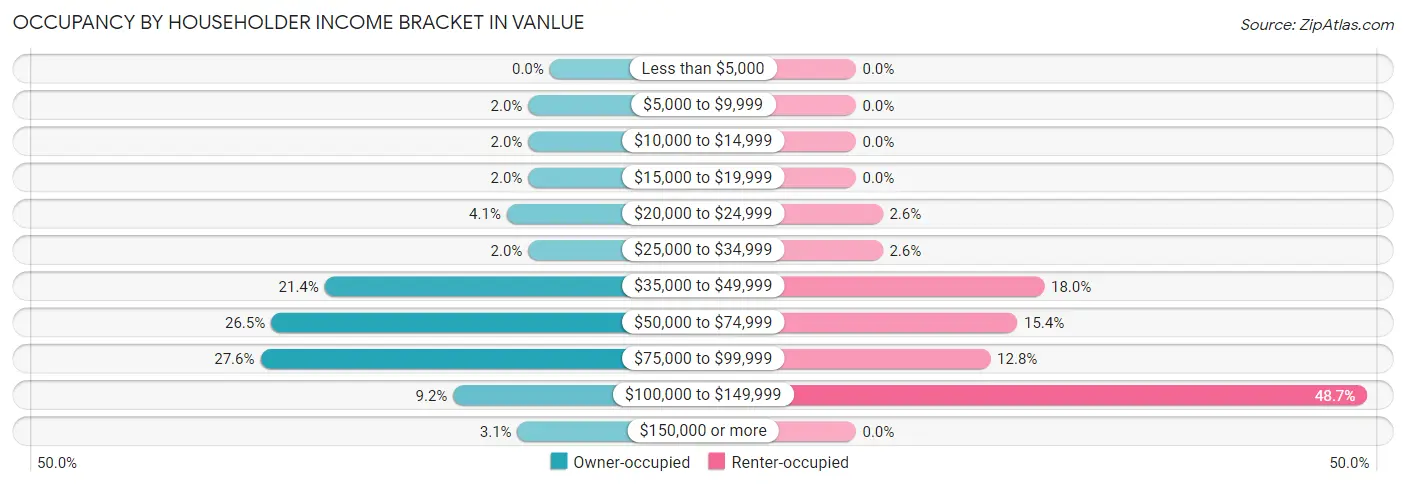
| Income Bracket | Owner-occupied | Renter-occupied |
| Less than $5,000 | 0 (0.0%) | 0 (0.0%) |
| $5,000 to $9,999 | 2 (2.0%) | 0 (0.0%) |
| $10,000 to $14,999 | 2 (2.0%) | 0 (0.0%) |
| $15,000 to $19,999 | 2 (2.0%) | 0 (0.0%) |
| $20,000 to $24,999 | 4 (4.1%) | 1 (2.6%) |
| $25,000 to $34,999 | 2 (2.0%) | 1 (2.6%) |
| $35,000 to $49,999 | 21 (21.4%) | 7 (17.9%) |
| $50,000 to $74,999 | 26 (26.5%) | 6 (15.4%) |
| $75,000 to $99,999 | 27 (27.6%) | 5 (12.8%) |
| $100,000 to $149,999 | 9 (9.2%) | 19 (48.7%) |
| $150,000 or more | 3 (3.1%) | 0 (0.0%) |
| Total | 98 (100.0%) | 39 (100.0%) |
Monthly Housing Cost Tiers in Vanlue
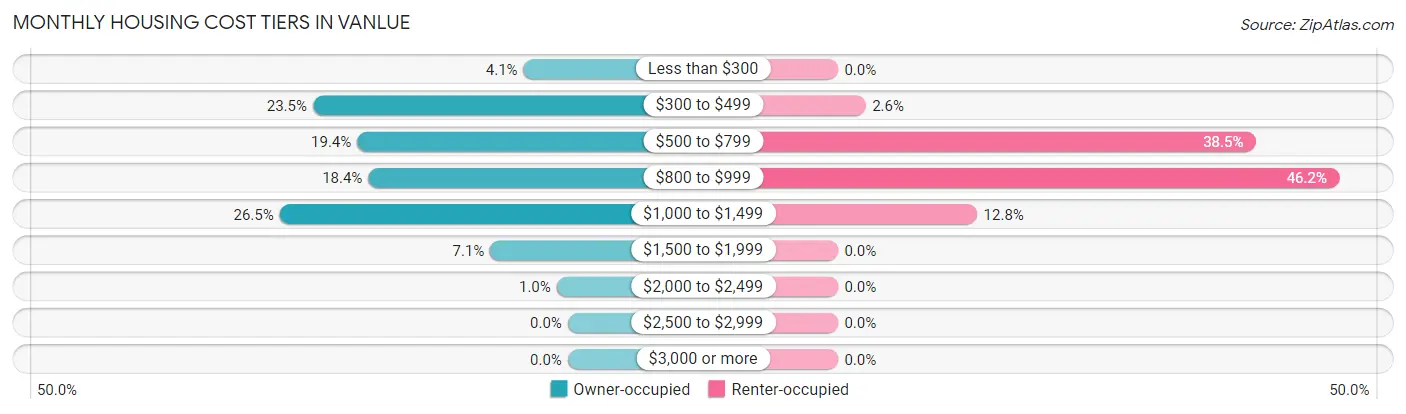
| Monthly Cost | Owner-occupied | Renter-occupied |
| Less than $300 | 4 (4.1%) | 0 (0.0%) |
| $300 to $499 | 23 (23.5%) | 1 (2.6%) |
| $500 to $799 | 19 (19.4%) | 15 (38.5%) |
| $800 to $999 | 18 (18.4%) | 18 (46.2%) |
| $1,000 to $1,499 | 26 (26.5%) | 5 (12.8%) |
| $1,500 to $1,999 | 7 (7.1%) | 0 (0.0%) |
| $2,000 to $2,499 | 1 (1.0%) | 0 (0.0%) |
| $2,500 to $2,999 | 0 (0.0%) | 0 (0.0%) |
| $3,000 or more | 0 (0.0%) | 0 (0.0%) |
| Total | 98 (100.0%) | 39 (100.0%) |
Physical Housing Characteristics in Vanlue
Housing Structures in Vanlue
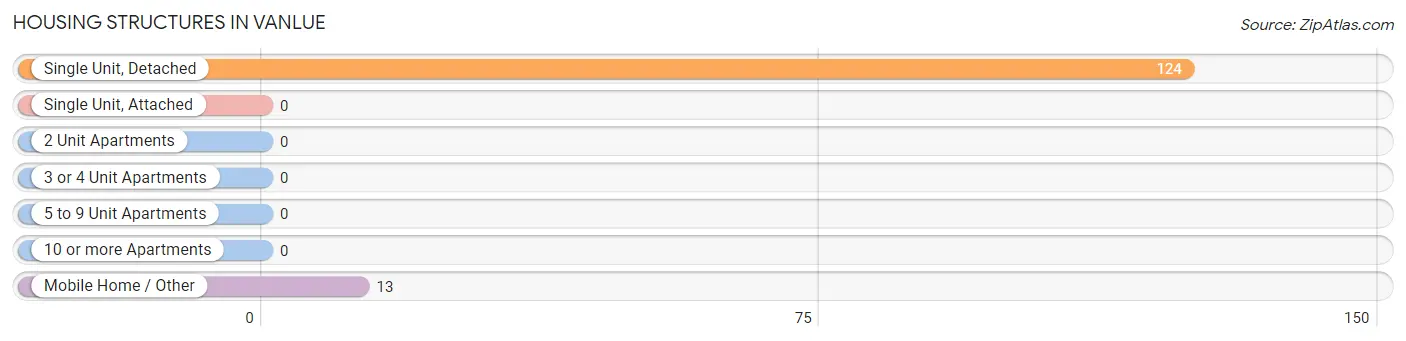
| Structure Type | # Housing Units | % Housing Units |
| Single Unit, Detached | 124 | 90.5% |
| Single Unit, Attached | 0 | 0.0% |
| 2 Unit Apartments | 0 | 0.0% |
| 3 or 4 Unit Apartments | 0 | 0.0% |
| 5 to 9 Unit Apartments | 0 | 0.0% |
| 10 or more Apartments | 0 | 0.0% |
| Mobile Home / Other | 13 | 9.5% |
| Total | 137 | 100.0% |
Housing Structures by Occupancy in Vanlue
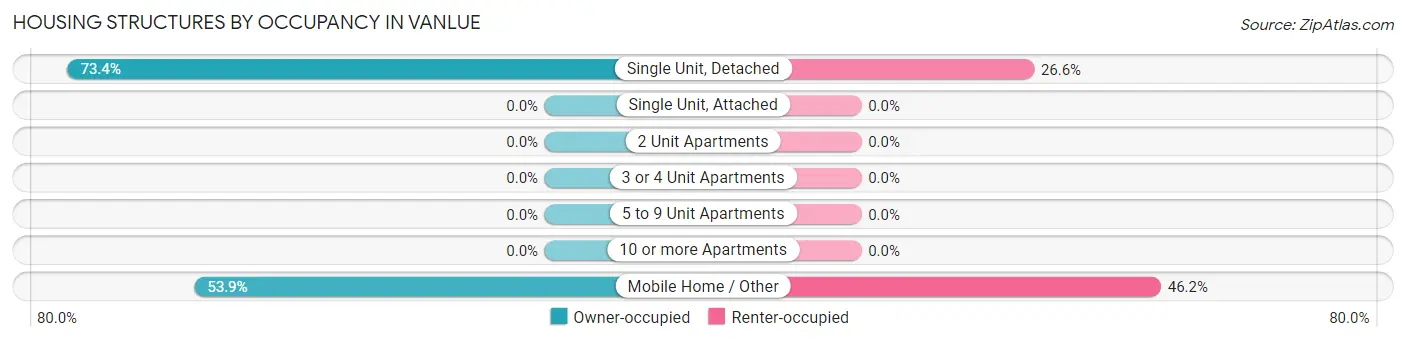
| Structure Type | Owner-occupied | Renter-occupied |
| Single Unit, Detached | 91 (73.4%) | 33 (26.6%) |
| Single Unit, Attached | 0 (0.0%) | 0 (0.0%) |
| 2 Unit Apartments | 0 (0.0%) | 0 (0.0%) |
| 3 or 4 Unit Apartments | 0 (0.0%) | 0 (0.0%) |
| 5 to 9 Unit Apartments | 0 (0.0%) | 0 (0.0%) |
| 10 or more Apartments | 0 (0.0%) | 0 (0.0%) |
| Mobile Home / Other | 7 (53.8%) | 6 (46.2%) |
| Total | 98 (71.5%) | 39 (28.5%) |
Housing Structures by Number of Rooms in Vanlue
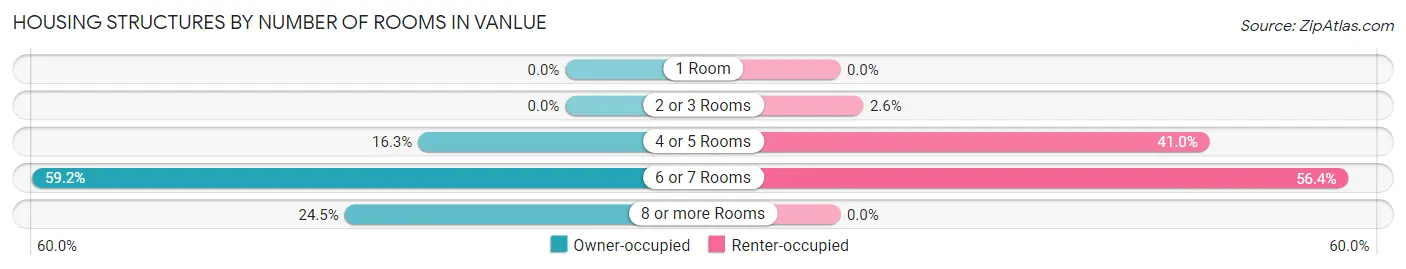
| Number of Rooms | Owner-occupied | Renter-occupied |
| 1 Room | 0 (0.0%) | 0 (0.0%) |
| 2 or 3 Rooms | 0 (0.0%) | 1 (2.6%) |
| 4 or 5 Rooms | 16 (16.3%) | 16 (41.0%) |
| 6 or 7 Rooms | 58 (59.2%) | 22 (56.4%) |
| 8 or more Rooms | 24 (24.5%) | 0 (0.0%) |
| Total | 98 (100.0%) | 39 (100.0%) |
Housing Structure by Heating Type in Vanlue
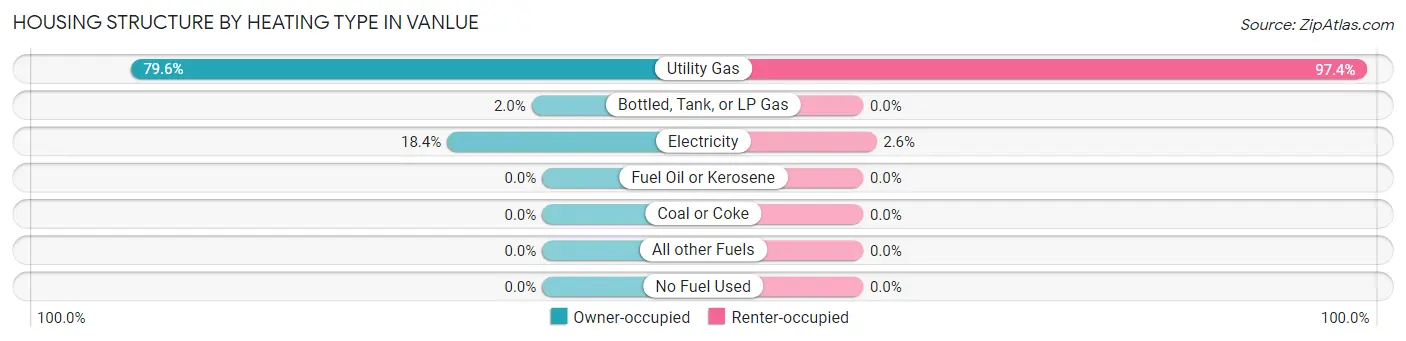
| Heating Type | Owner-occupied | Renter-occupied |
| Utility Gas | 78 (79.6%) | 38 (97.4%) |
| Bottled, Tank, or LP Gas | 2 (2.0%) | 0 (0.0%) |
| Electricity | 18 (18.4%) | 1 (2.6%) |
| Fuel Oil or Kerosene | 0 (0.0%) | 0 (0.0%) |
| Coal or Coke | 0 (0.0%) | 0 (0.0%) |
| All other Fuels | 0 (0.0%) | 0 (0.0%) |
| No Fuel Used | 0 (0.0%) | 0 (0.0%) |
| Total | 98 (100.0%) | 39 (100.0%) |
Household Vehicle Usage in Vanlue
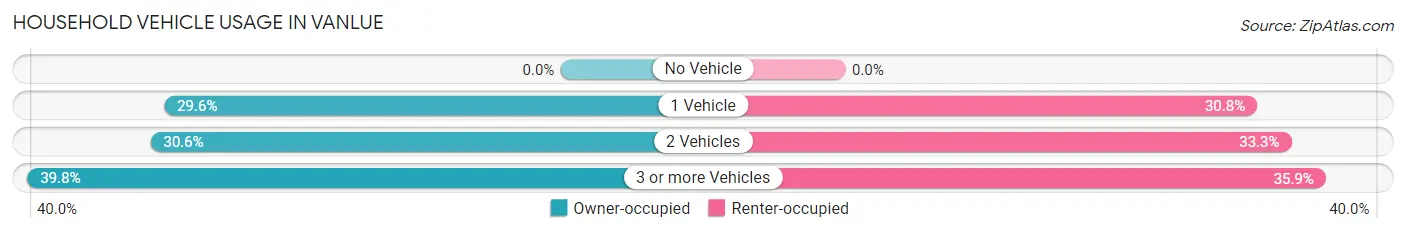
| Vehicles per Household | Owner-occupied | Renter-occupied |
| No Vehicle | 0 (0.0%) | 0 (0.0%) |
| 1 Vehicle | 29 (29.6%) | 12 (30.8%) |
| 2 Vehicles | 30 (30.6%) | 13 (33.3%) |
| 3 or more Vehicles | 39 (39.8%) | 14 (35.9%) |
| Total | 98 (100.0%) | 39 (100.0%) |
Real Estate & Mortgages in Vanlue
Real Estate and Mortgage Overview in Vanlue
| Characteristic | Without Mortgage | With Mortgage |
| Housing Units | 36 | 62 |
| Median Property Value | $130,000 | $95,000 |
| Median Household Income | $47,500 | $3 |
| Monthly Housing Costs | $410 | $0 |
| Real Estate Taxes | $943 | $0 |
Property Value by Mortgage Status in Vanlue
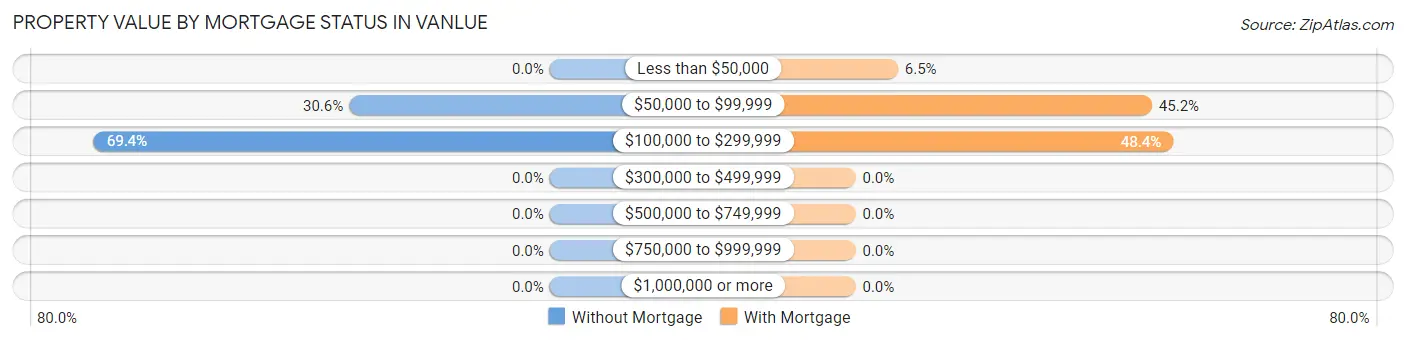
| Property Value | Without Mortgage | With Mortgage |
| Less than $50,000 | 0 (0.0%) | 4 (6.5%) |
| $50,000 to $99,999 | 11 (30.6%) | 28 (45.2%) |
| $100,000 to $299,999 | 25 (69.4%) | 30 (48.4%) |
| $300,000 to $499,999 | 0 (0.0%) | 0 (0.0%) |
| $500,000 to $749,999 | 0 (0.0%) | 0 (0.0%) |
| $750,000 to $999,999 | 0 (0.0%) | 0 (0.0%) |
| $1,000,000 or more | 0 (0.0%) | 0 (0.0%) |
| Total | 36 (100.0%) | 62 (100.0%) |
Household Income by Mortgage Status in Vanlue
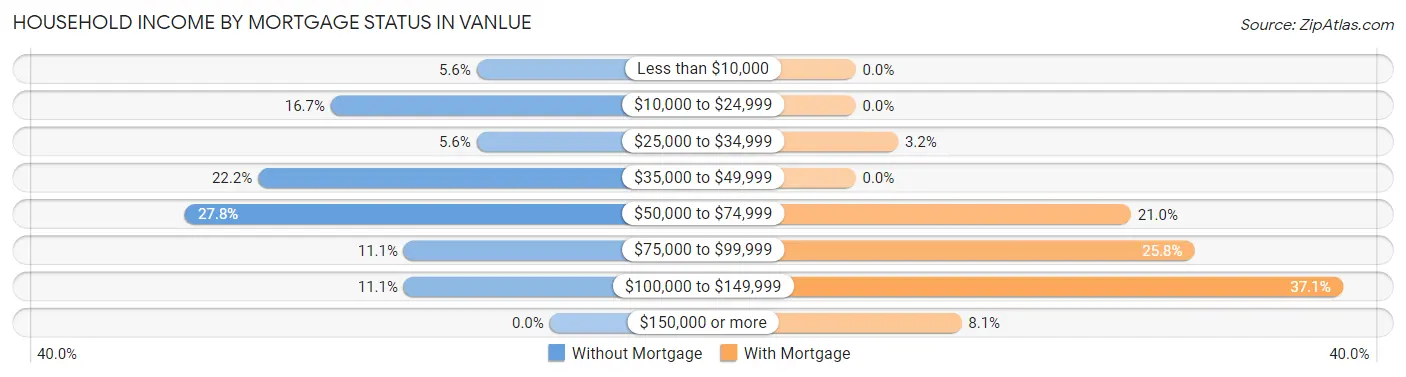
| Household Income | Without Mortgage | With Mortgage |
| Less than $10,000 | 2 (5.6%) | 0 (0.0%) |
| $10,000 to $24,999 | 6 (16.7%) | 0 (0.0%) |
| $25,000 to $34,999 | 2 (5.6%) | 2 (3.2%) |
| $35,000 to $49,999 | 8 (22.2%) | 0 (0.0%) |
| $50,000 to $74,999 | 10 (27.8%) | 13 (21.0%) |
| $75,000 to $99,999 | 4 (11.1%) | 16 (25.8%) |
| $100,000 to $149,999 | 4 (11.1%) | 23 (37.1%) |
| $150,000 or more | 0 (0.0%) | 5 (8.1%) |
| Total | 36 (100.0%) | 62 (100.0%) |
Property Value to Household Income Ratio in Vanlue
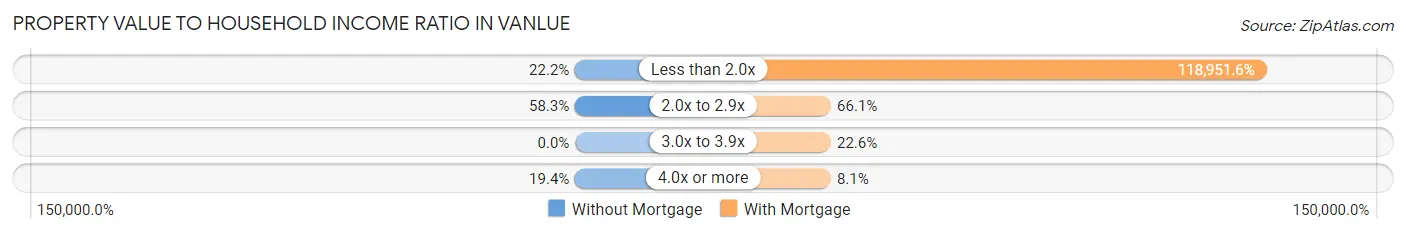
| Value-to-Income Ratio | Without Mortgage | With Mortgage |
| Less than 2.0x | 8 (22.2%) | 73,750 (118,951.6%) |
| 2.0x to 2.9x | 21 (58.3%) | 41 (66.1%) |
| 3.0x to 3.9x | 0 (0.0%) | 14 (22.6%) |
| 4.0x or more | 7 (19.4%) | 5 (8.1%) |
| Total | 36 (100.0%) | 62 (100.0%) |
Real Estate Taxes by Mortgage Status in Vanlue
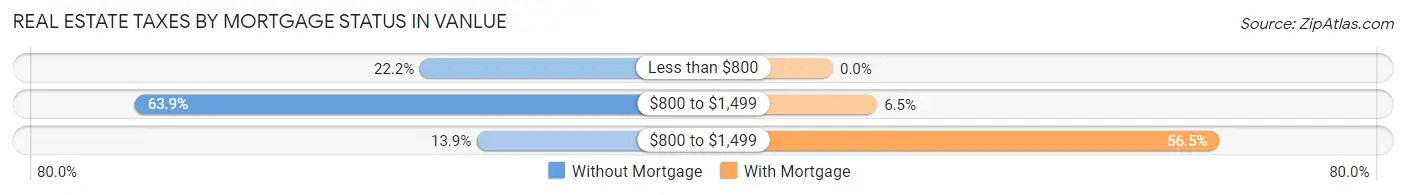
| Property Taxes | Without Mortgage | With Mortgage |
| Less than $800 | 8 (22.2%) | 0 (0.0%) |
| $800 to $1,499 | 23 (63.9%) | 4 (6.5%) |
| $800 to $1,499 | 5 (13.9%) | 35 (56.5%) |
| Total | 36 (100.0%) | 62 (100.0%) |
Health & Disability in Vanlue
Health Insurance Coverage by Age in Vanlue
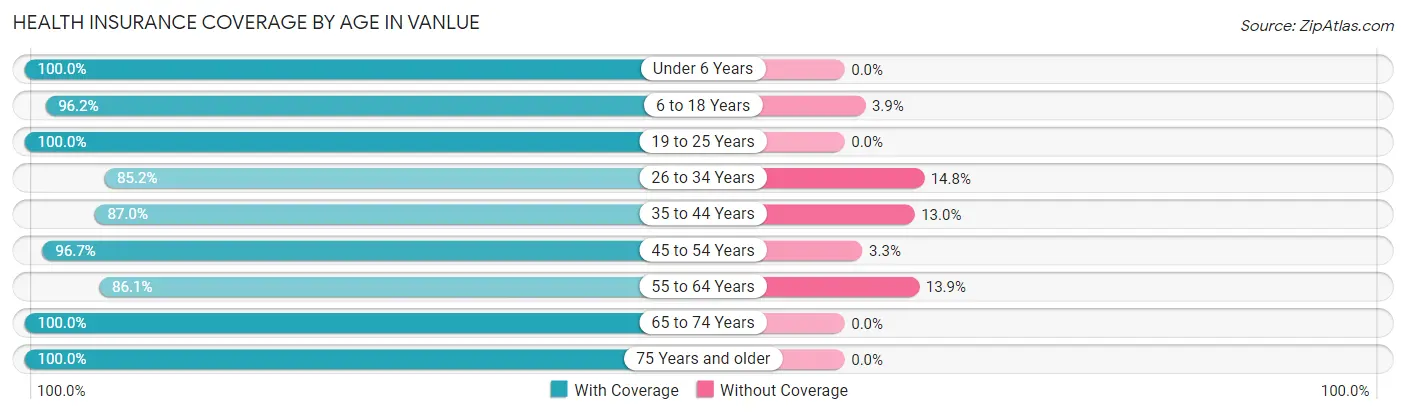
| Age Bracket | With Coverage | Without Coverage |
| Under 6 Years | 19 (100.0%) | 0 (0.0%) |
| 6 to 18 Years | 50 (96.2%) | 2 (3.8%) |
| 19 to 25 Years | 31 (100.0%) | 0 (0.0%) |
| 26 to 34 Years | 46 (85.2%) | 8 (14.8%) |
| 35 to 44 Years | 20 (87.0%) | 3 (13.0%) |
| 45 to 54 Years | 58 (96.7%) | 2 (3.3%) |
| 55 to 64 Years | 31 (86.1%) | 5 (13.9%) |
| 65 to 74 Years | 29 (100.0%) | 0 (0.0%) |
| 75 Years and older | 19 (100.0%) | 0 (0.0%) |
| Total | 303 (93.8%) | 20 (6.2%) |
Health Insurance Coverage by Citizenship Status in Vanlue
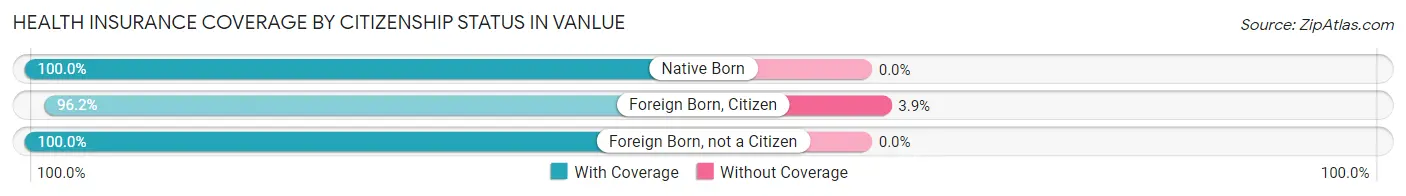
| Citizenship Status | With Coverage | Without Coverage |
| Native Born | 19 (100.0%) | 0 (0.0%) |
| Foreign Born, Citizen | 50 (96.2%) | 2 (3.8%) |
| Foreign Born, not a Citizen | 31 (100.0%) | 0 (0.0%) |
Health Insurance Coverage by Household Income in Vanlue
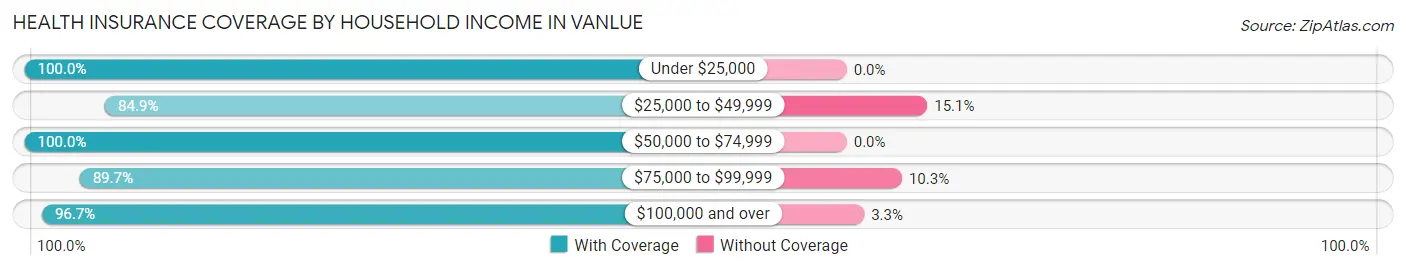
| Household Income | With Coverage | Without Coverage |
| Under $25,000 | 13 (100.0%) | 0 (0.0%) |
| $25,000 to $49,999 | 45 (84.9%) | 8 (15.1%) |
| $50,000 to $74,999 | 78 (100.0%) | 0 (0.0%) |
| $75,000 to $99,999 | 78 (89.7%) | 9 (10.3%) |
| $100,000 and over | 89 (96.7%) | 3 (3.3%) |
Public vs Private Health Insurance Coverage by Age in Vanlue
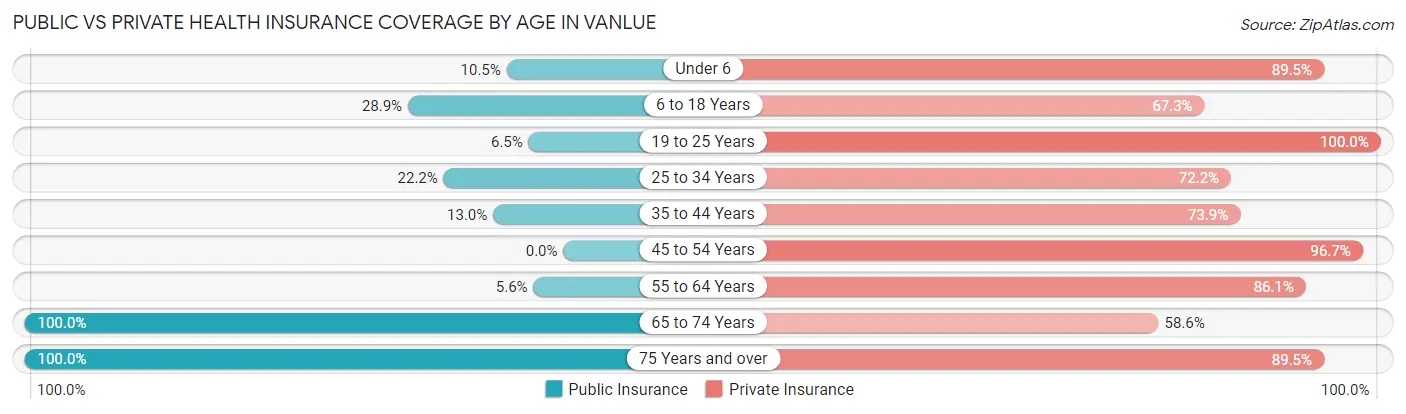
| Age Bracket | Public Insurance | Private Insurance |
| Under 6 | 2 (10.5%) | 17 (89.5%) |
| 6 to 18 Years | 15 (28.8%) | 35 (67.3%) |
| 19 to 25 Years | 2 (6.5%) | 31 (100.0%) |
| 25 to 34 Years | 12 (22.2%) | 39 (72.2%) |
| 35 to 44 Years | 3 (13.0%) | 17 (73.9%) |
| 45 to 54 Years | 0 (0.0%) | 58 (96.7%) |
| 55 to 64 Years | 2 (5.6%) | 31 (86.1%) |
| 65 to 74 Years | 29 (100.0%) | 17 (58.6%) |
| 75 Years and over | 19 (100.0%) | 17 (89.5%) |
| Total | 84 (26.0%) | 262 (81.1%) |
Disability Status by Sex by Age in Vanlue
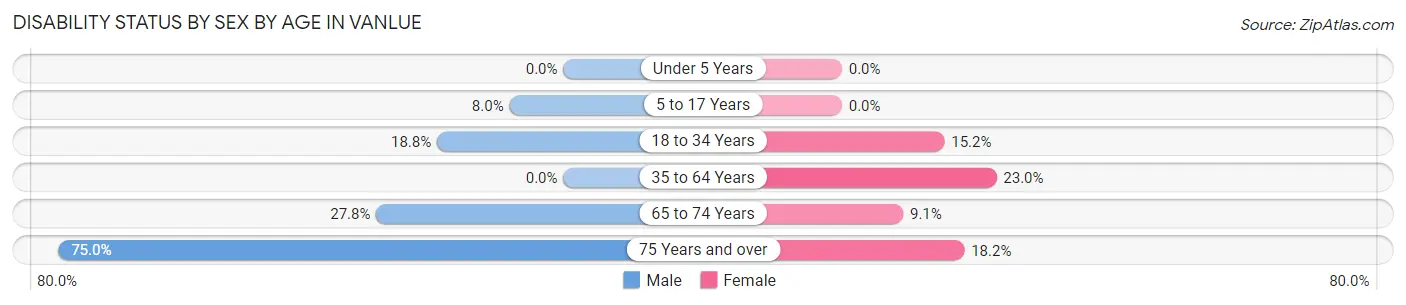
| Age Bracket | Male | Female |
| Under 5 Years | 0 (0.0%) | 0 (0.0%) |
| 5 to 17 Years | 2 (8.0%) | 0 (0.0%) |
| 18 to 34 Years | 9 (18.8%) | 7 (15.2%) |
| 35 to 64 Years | 0 (0.0%) | 14 (23.0%) |
| 65 to 74 Years | 5 (27.8%) | 1 (9.1%) |
| 75 Years and over | 6 (75.0%) | 2 (18.2%) |
Disability Class by Sex by Age in Vanlue
Disability Class: Hearing Difficulty
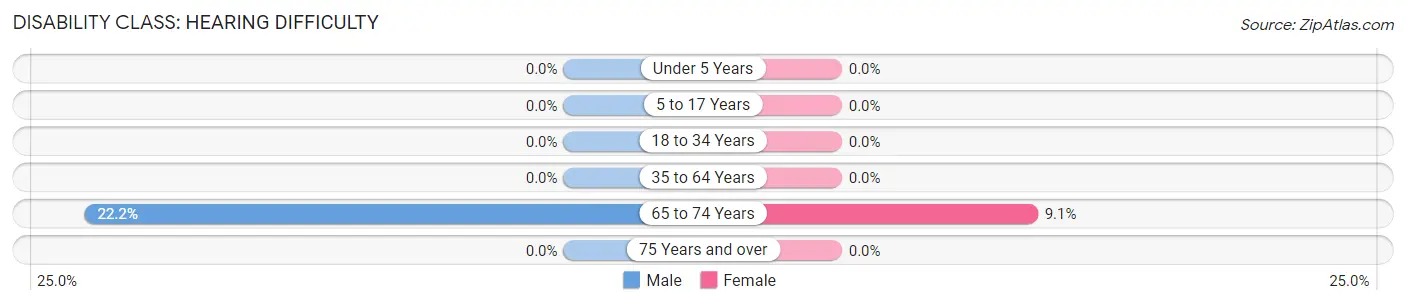
| Age Bracket | Male | Female |
| Under 5 Years | 0 (0.0%) | 0 (0.0%) |
| 5 to 17 Years | 0 (0.0%) | 0 (0.0%) |
| 18 to 34 Years | 0 (0.0%) | 0 (0.0%) |
| 35 to 64 Years | 0 (0.0%) | 0 (0.0%) |
| 65 to 74 Years | 4 (22.2%) | 1 (9.1%) |
| 75 Years and over | 0 (0.0%) | 0 (0.0%) |
Disability Class: Vision Difficulty
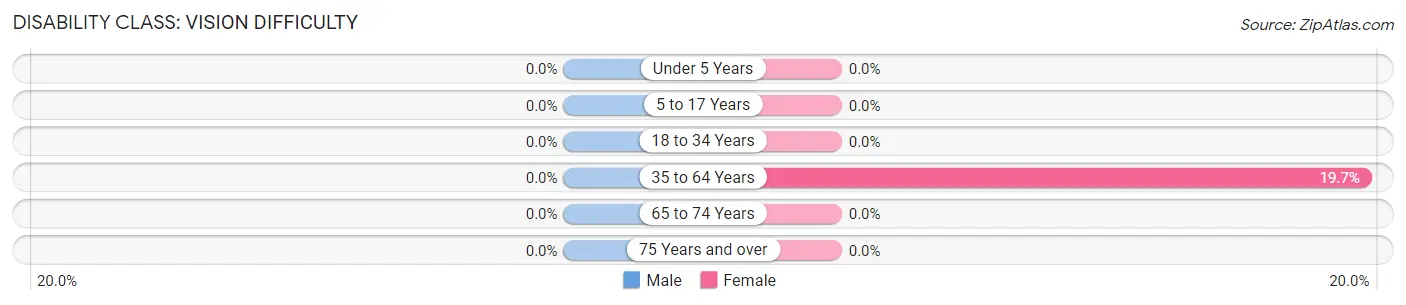
| Age Bracket | Male | Female |
| Under 5 Years | 0 (0.0%) | 0 (0.0%) |
| 5 to 17 Years | 0 (0.0%) | 0 (0.0%) |
| 18 to 34 Years | 0 (0.0%) | 0 (0.0%) |
| 35 to 64 Years | 0 (0.0%) | 12 (19.7%) |
| 65 to 74 Years | 0 (0.0%) | 0 (0.0%) |
| 75 Years and over | 0 (0.0%) | 0 (0.0%) |
Disability Class: Cognitive Difficulty
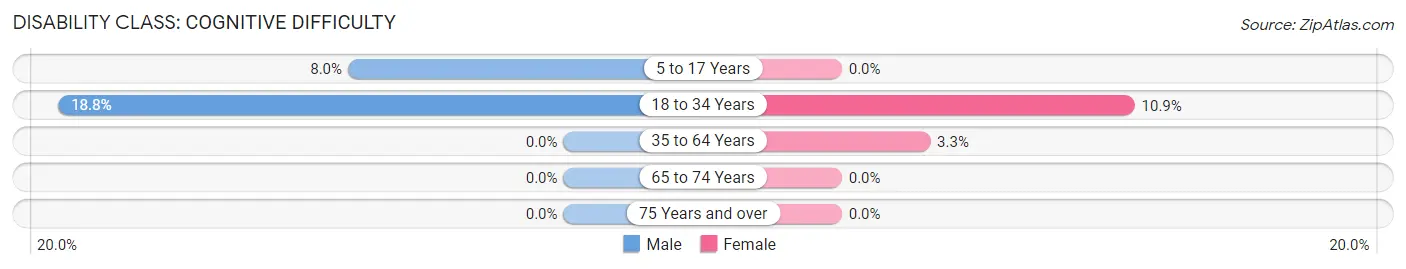
| Age Bracket | Male | Female |
| 5 to 17 Years | 2 (8.0%) | 0 (0.0%) |
| 18 to 34 Years | 9 (18.8%) | 5 (10.9%) |
| 35 to 64 Years | 0 (0.0%) | 2 (3.3%) |
| 65 to 74 Years | 0 (0.0%) | 0 (0.0%) |
| 75 Years and over | 0 (0.0%) | 0 (0.0%) |
Disability Class: Ambulatory Difficulty
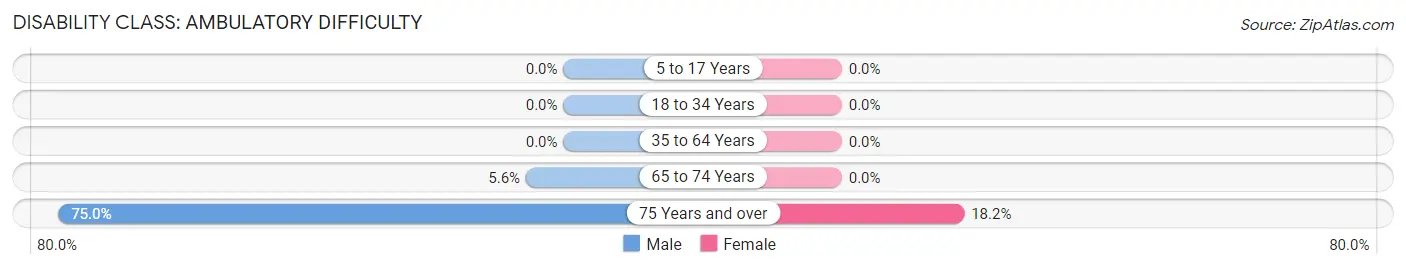
| Age Bracket | Male | Female |
| 5 to 17 Years | 0 (0.0%) | 0 (0.0%) |
| 18 to 34 Years | 0 (0.0%) | 0 (0.0%) |
| 35 to 64 Years | 0 (0.0%) | 0 (0.0%) |
| 65 to 74 Years | 1 (5.6%) | 0 (0.0%) |
| 75 Years and over | 6 (75.0%) | 2 (18.2%) |
Disability Class: Self-Care Difficulty
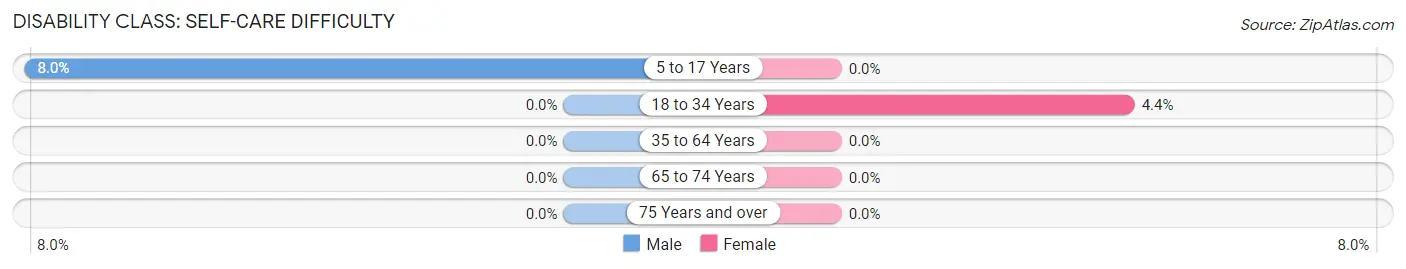
| Age Bracket | Male | Female |
| 5 to 17 Years | 2 (8.0%) | 0 (0.0%) |
| 18 to 34 Years | 0 (0.0%) | 2 (4.3%) |
| 35 to 64 Years | 0 (0.0%) | 0 (0.0%) |
| 65 to 74 Years | 0 (0.0%) | 0 (0.0%) |
| 75 Years and over | 0 (0.0%) | 0 (0.0%) |
Technology Access in Vanlue
Computing Device Access in Vanlue
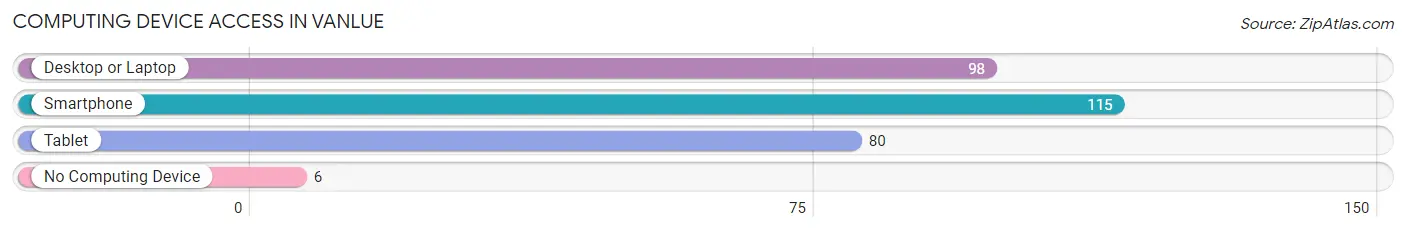
| Device Type | # Households | % Households |
| Desktop or Laptop | 98 | 71.5% |
| Smartphone | 115 | 83.9% |
| Tablet | 80 | 58.4% |
| No Computing Device | 6 | 4.4% |
| Total | 137 | 100.0% |
Internet Access in Vanlue
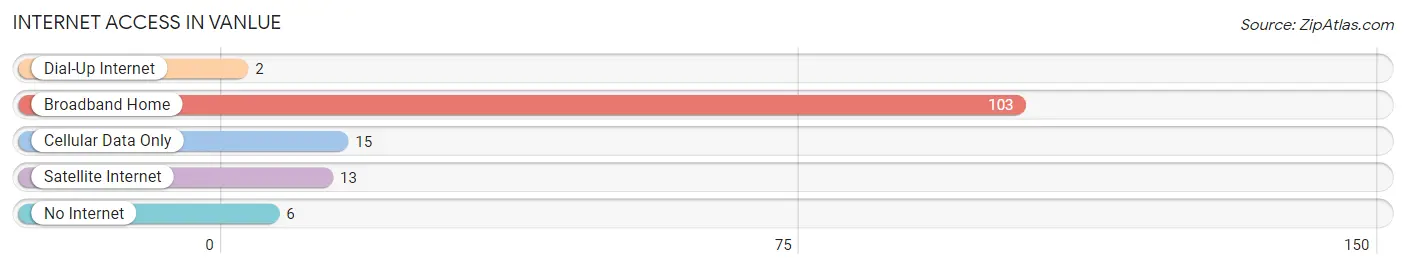
| Internet Type | # Households | % Households |
| Dial-Up Internet | 2 | 1.5% |
| Broadband Home | 103 | 75.2% |
| Cellular Data Only | 15 | 11.0% |
| Satellite Internet | 13 | 9.5% |
| No Internet | 6 | 4.4% |
| Total | 137 | 100.0% |
Vanlue Summary
Vanlue is a small village located in Hancock County, Ohio, United States. The population was estimated to be 517 in the 2010 census. The village is located in the northwest corner of Hancock County, near the border of Putnam and Wood counties.
History
Vanlue was founded in 1837 by John Vanlue, a Revolutionary War veteran. The village was originally known as Vanlue Station, and was a stop on the Toledo, Norwalk and Cleveland Railroad. The village was incorporated in 1875.
In the late 19th century, Vanlue was a thriving agricultural community. The village was home to several businesses, including a sawmill, a grist mill, a blacksmith shop, a general store, and a hotel.
Geography
Vanlue is located at 40°48'45" North, 83°37'45" West (40.812500, -83.629167). The village is situated in the northwest corner of Hancock County, near the border of Putnam and Wood counties.
The village is located in the Blanchard River watershed. The Blanchard River flows through the village, and is a tributary of the Auglaize River.
The village is located in the Western Lake Erie Basin and is part of the Great Black Swamp region
Economy
The economy of Vanlue is largely based on agriculture. The village is home to several farms, and the surrounding area is known for its production of corn, soybeans, and wheat.
The village is also home to several small businesses, including a hardware store, a grocery store, a restaurant, and a gas station.
Demographics
As of the 2010 census, the population of Vanlue was 517. The racial makeup of the village was 97.3% White, 0.6% African American, 0.2% Native American, 0.2% Asian, 0.2% from other races, and 1.5% from two or more races. Hispanic or Latino of any race were 0.8% of the population.
The median household income in Vanlue was $41,250, and the median family income was $45,000. The per capita income for the village was $17,845. About 11.2% of families and 13.2% of the population were below the poverty line, including 16.7% of those under age 18 and 8.3% of those age 65 or over.
The village is served by the Vanlue Local School District. The district consists of one elementary school, one middle school, and one high school. The district has an enrollment of approximately 500 students.
Common Questions
What is Per Capita Income in Vanlue?
Per Capita income in Vanlue is $31,597.
What is the Median Family Income in Vanlue?
Median Family Income in Vanlue is $83,125.
What is the Median Household income in Vanlue?
Median Household Income in Vanlue is $70,750.
What is Income or Wage Gap in Vanlue?
Income or Wage Gap in Vanlue is 17.3%.
Women in Vanlue earn 82.7 cents for every dollar earned by a man.
What is Inequality or Gini Index in Vanlue?
Inequality or Gini Index in Vanlue is 0.28.
What is the Total Population of Vanlue?
Total Population of Vanlue is 323.
What is the Total Male Population of Vanlue?
Total Male Population of Vanlue is 169.
What is the Total Female Population of Vanlue?
Total Female Population of Vanlue is 154.
What is the Ratio of Males per 100 Females in Vanlue?
There are 109.74 Males per 100 Females in Vanlue.
What is the Ratio of Females per 100 Males in Vanlue?
There are 91.12 Females per 100 Males in Vanlue.
What is the Median Population Age in Vanlue?
Median Population Age in Vanlue is 35.8 Years.
What is the Average Family Size in Vanlue
Average Family Size in Vanlue is 2.8 People.
What is the Average Household Size in Vanlue
Average Household Size in Vanlue is 2.4 People.
How Large is the Labor Force in Vanlue?
There are 200 People in the Labor Forcein in Vanlue.
What is the Percentage of People in the Labor Force in Vanlue?
74.3% of People are in the Labor Force in Vanlue.