Tuscarawas, OH Map & Demographics
Tuscarawas Map
Tuscarawas Overview
$26,506
PER CAPITA INCOME
$90,227
AVG FAMILY INCOME
$67,321
AVG HOUSEHOLD INCOME
21.8%
WAGE / INCOME GAP [ % ]
78.2¢/ $1
WAGE / INCOME GAP [ $ ]
0.34
INEQUALITY / GINI INDEX
1,296
TOTAL POPULATION
632
MALE POPULATION
664
FEMALE POPULATION
95.18
MALES / 100 FEMALES
105.06
FEMALES / 100 MALES
41.7
MEDIAN AGE
3.0
AVG FAMILY SIZE
2.7
AVG HOUSEHOLD SIZE
677
LABOR FORCE [ PEOPLE ]
70.3%
PERCENT IN LABOR FORCE
3.0%
UNEMPLOYMENT RATE
Tuscarawas Zip Codes
Income in Tuscarawas
Income Overview in Tuscarawas
Per Capita Income in Tuscarawas is $26,506, while median incomes of families and households are $90,227 and $67,321 respectively.
| Characteristic | Number | Measure |
| Per Capita Income | 1,296 | $26,506 |
| Median Family Income | 384 | $90,227 |
| Mean Family Income | 384 | $79,896 |
| Median Household Income | 487 | $67,321 |
| Mean Household Income | 487 | $69,837 |
| Income Deficit | 384 | $0 |
| Wage / Income Gap (%) | 1,296 | 21.81% |
| Wage / Income Gap ($) | 1,296 | 78.19¢ per $1 |
| Gini / Inequality Index | 1,296 | 0.34 |
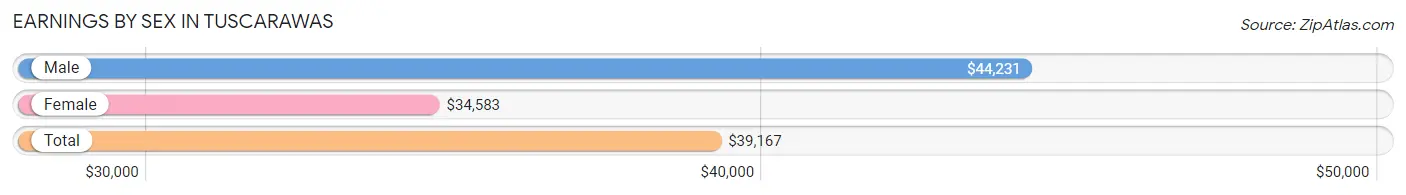
Earnings by Sex in Tuscarawas
Average Earnings in Tuscarawas are $39,167, $44,231 for men and $34,583 for women, a difference of 21.8%.
| Sex | Number | Average Earnings |
| Male | 380 (53.5%) | $44,231 |
| Female | 330 (46.5%) | $34,583 |
| Total | 710 (100.0%) | $39,167 |
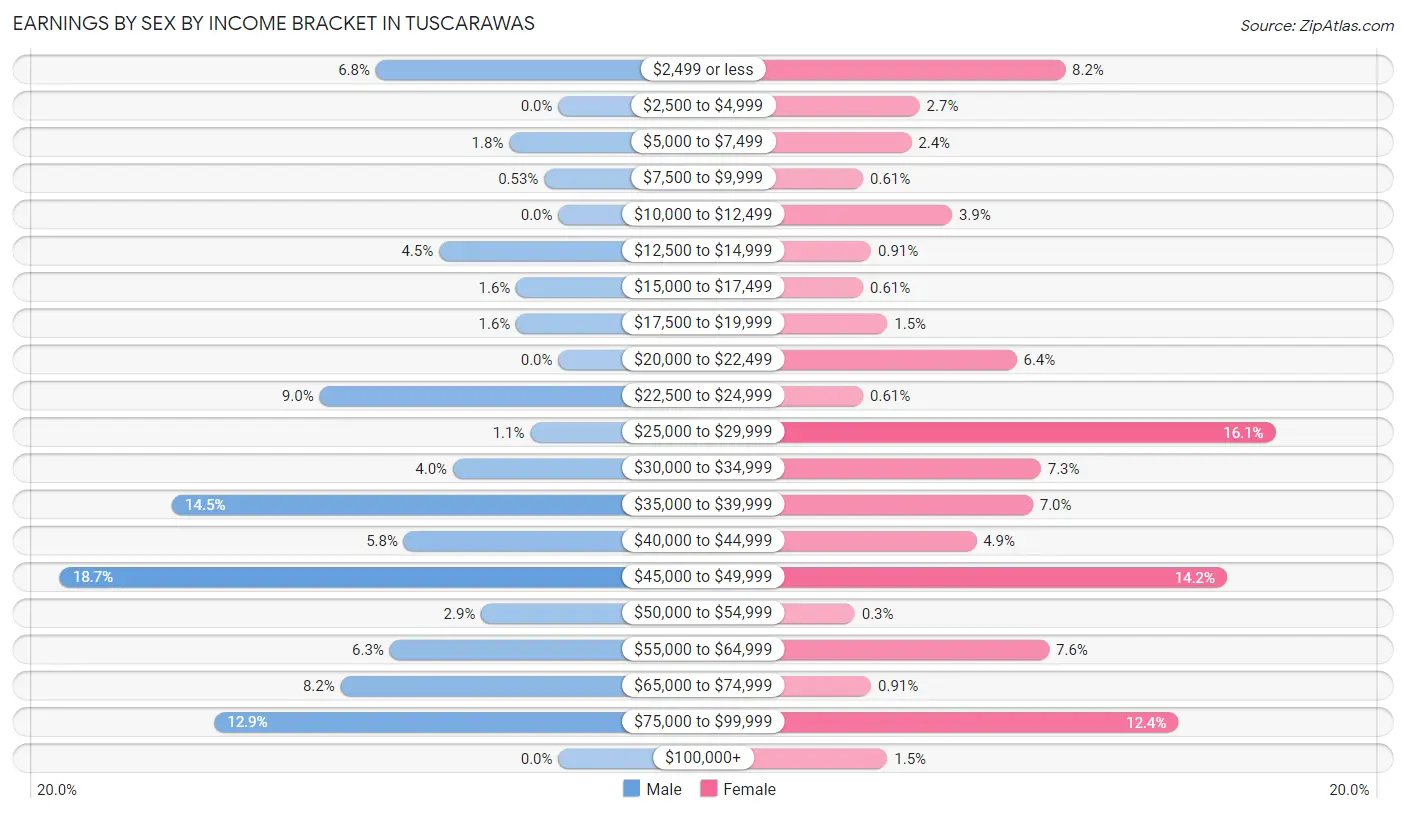
Earnings by Sex by Income Bracket in Tuscarawas
The most common earnings brackets in Tuscarawas are $45,000 to $49,999 for men (71 | 18.7%) and $25,000 to $29,999 for women (53 | 16.1%).
| Income | Male | Female |
| $2,499 or less | 26 (6.8%) | 27 (8.2%) |
| $2,500 to $4,999 | 0 (0.0%) | 9 (2.7%) |
| $5,000 to $7,499 | 7 (1.8%) | 8 (2.4%) |
| $7,500 to $9,999 | 2 (0.5%) | 2 (0.6%) |
| $10,000 to $12,499 | 0 (0.0%) | 13 (3.9%) |
| $12,500 to $14,999 | 17 (4.5%) | 3 (0.9%) |
| $15,000 to $17,499 | 6 (1.6%) | 2 (0.6%) |
| $17,500 to $19,999 | 6 (1.6%) | 5 (1.5%) |
| $20,000 to $22,499 | 0 (0.0%) | 21 (6.4%) |
| $22,500 to $24,999 | 34 (8.9%) | 2 (0.6%) |
| $25,000 to $29,999 | 4 (1.1%) | 53 (16.1%) |
| $30,000 to $34,999 | 15 (4.0%) | 24 (7.3%) |
| $35,000 to $39,999 | 55 (14.5%) | 23 (7.0%) |
| $40,000 to $44,999 | 22 (5.8%) | 16 (4.9%) |
| $45,000 to $49,999 | 71 (18.7%) | 47 (14.2%) |
| $50,000 to $54,999 | 11 (2.9%) | 1 (0.3%) |
| $55,000 to $64,999 | 24 (6.3%) | 25 (7.6%) |
| $65,000 to $74,999 | 31 (8.2%) | 3 (0.9%) |
| $75,000 to $99,999 | 49 (12.9%) | 41 (12.4%) |
| $100,000+ | 0 (0.0%) | 5 (1.5%) |
| Total | 380 (100.0%) | 330 (100.0%) |
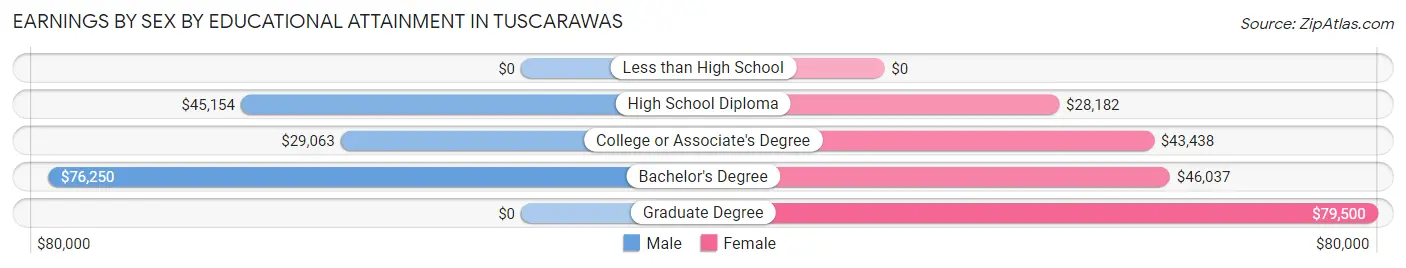
Earnings by Sex by Educational Attainment in Tuscarawas
Average earnings in Tuscarawas are $45,288 for men and $35,809 for women, a difference of 20.9%. Men with an educational attainment of bachelor's degree enjoy the highest average annual earnings of $76,250, while those with college or associate's degree education earn the least with $29,063. Women with an educational attainment of graduate degree earn the most with the average annual earnings of $79,500, while those with high school diploma education have the smallest earnings of $28,182.
| Educational Attainment | Male Income | Female Income |
| Less than High School | - | - |
| High School Diploma | $45,154 | $28,182 |
| College or Associate's Degree | $29,063 | $43,438 |
| Bachelor's Degree | $76,250 | $46,037 |
| Graduate Degree | - | - |
| Total | $45,288 | $35,809 |
Family Income in Tuscarawas
Family Income Brackets in Tuscarawas
According to the Tuscarawas family income data, there are 108 families falling into the $75,000 to $99,999 income range, which is the most common income bracket and makes up 28.1% of all families.
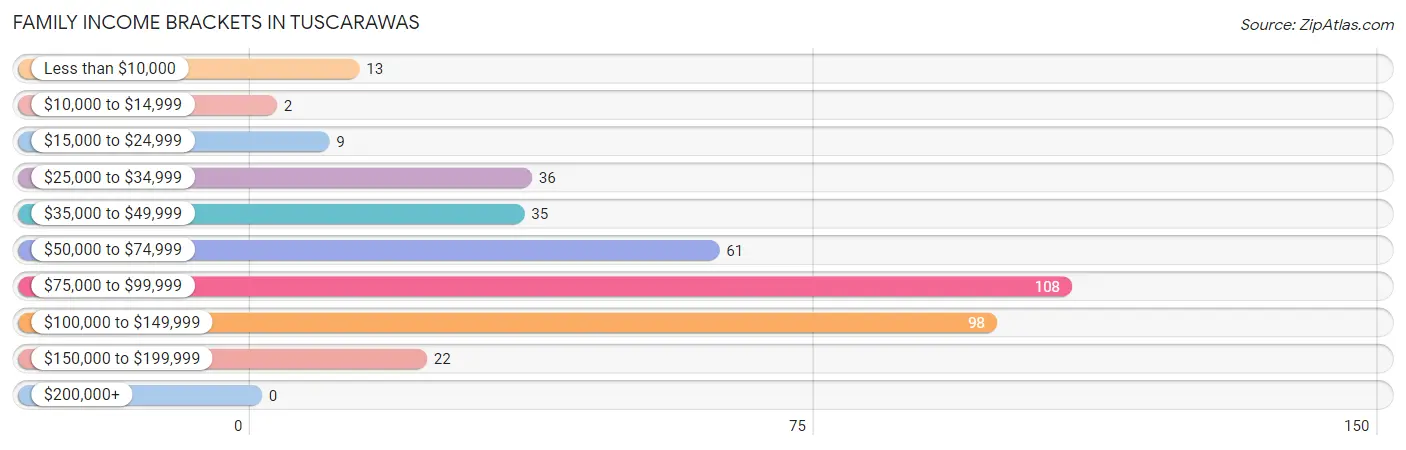
| Income Bracket | # Families | % Families |
| Less than $10,000 | 13 | 3.4% |
| $10,000 to $14,999 | 2 | 0.5% |
| $15,000 to $24,999 | 9 | 2.3% |
| $25,000 to $34,999 | 36 | 9.4% |
| $35,000 to $49,999 | 35 | 9.1% |
| $50,000 to $74,999 | 61 | 15.9% |
| $75,000 to $99,999 | 108 | 28.1% |
| $100,000 to $149,999 | 98 | 25.5% |
| $150,000 to $199,999 | 22 | 5.7% |
| $200,000+ | 0 | 0.0% |
Family Income by Famaliy Size in Tuscarawas
6-person families (13 | 3.4%) account for the highest median family income in Tuscarawas with $101,375 per family, while 2-person families (206 | 53.6%) have the highest median income of $39,185 per family member.
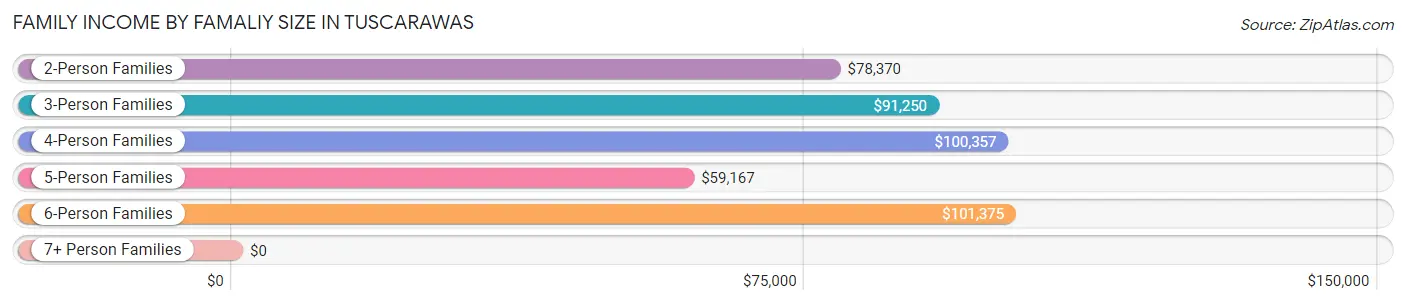
| Income Bracket | # Families | Median Income |
| 2-Person Families | 206 (53.6%) | $78,370 |
| 3-Person Families | 105 (27.3%) | $91,250 |
| 4-Person Families | 38 (9.9%) | $100,357 |
| 5-Person Families | 22 (5.7%) | $59,167 |
| 6-Person Families | 13 (3.4%) | $101,375 |
| 7+ Person Families | 0 (0.0%) | $0 |
| Total | 384 (100.0%) | $90,227 |
Family Income by Number of Earners in Tuscarawas
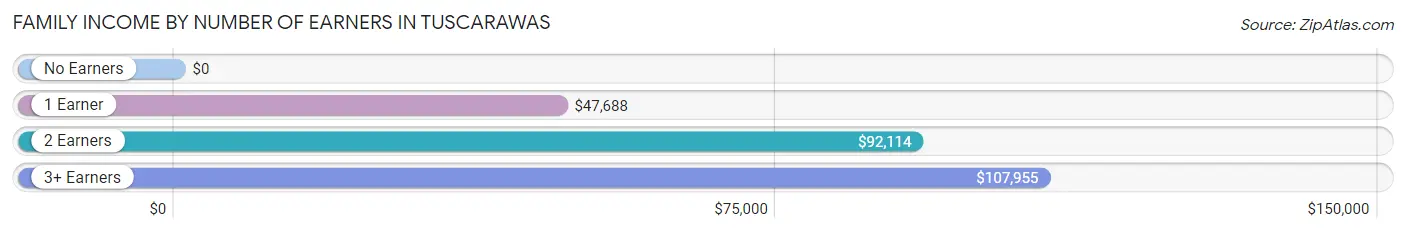
| Number of Earners | # Families | Median Income |
| No Earners | 30 (7.8%) | $0 |
| 1 Earner | 91 (23.7%) | $47,688 |
| 2 Earners | 245 (63.8%) | $92,114 |
| 3+ Earners | 18 (4.7%) | $107,955 |
| Total | 384 (100.0%) | $90,227 |
Household Income in Tuscarawas
Household Income Brackets in Tuscarawas
With 106 households falling in the category, the $75,000 to $99,999 income range is the most frequent in Tuscarawas, accounting for 21.8% of all households.
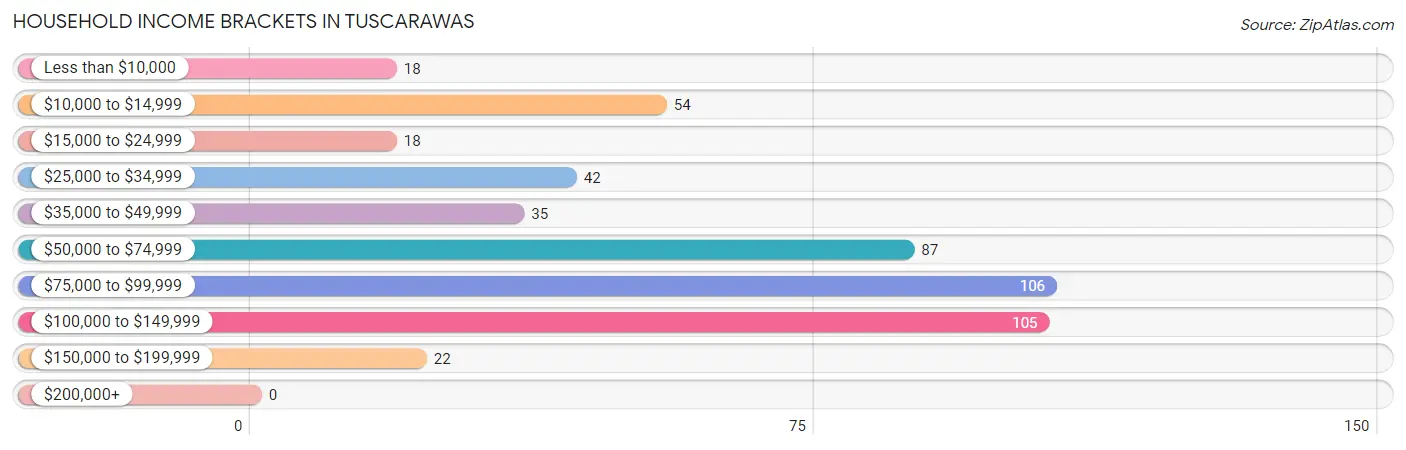
| Income Bracket | # Households | % Households |
| Less than $10,000 | 18 | 3.7% |
| $10,000 to $14,999 | 54 | 11.1% |
| $15,000 to $24,999 | 18 | 3.7% |
| $25,000 to $34,999 | 42 | 8.6% |
| $35,000 to $49,999 | 35 | 7.2% |
| $50,000 to $74,999 | 87 | 17.9% |
| $75,000 to $99,999 | 106 | 21.8% |
| $100,000 to $149,999 | 105 | 21.6% |
| $150,000 to $199,999 | 22 | 4.5% |
| $200,000+ | 0 | 0.0% |
Household Income by Householder Age in Tuscarawas
The median household income in Tuscarawas is $67,321, with the highest median household income of $90,665 found in the 45 to 64 years age bracket for the primary householder. A total of 217 households (44.6%) fall into this category. Meanwhile, the 15 to 24 years age bracket for the primary householder has the lowest median household income of $0, with 9 households (1.8%) in this group.
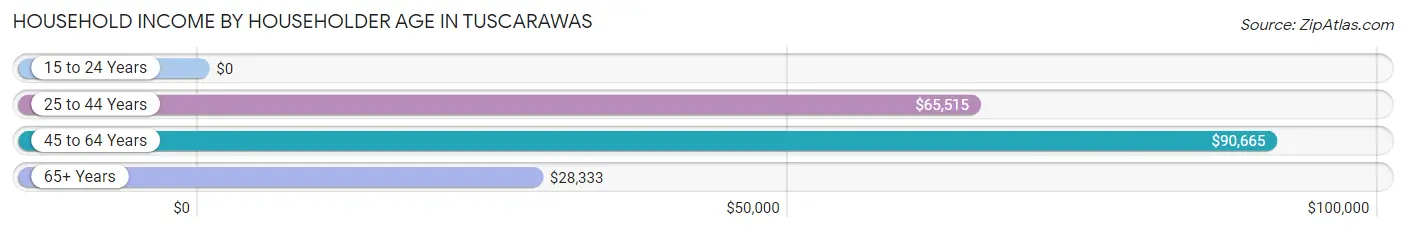
| Income Bracket | # Households | Median Income |
| 15 to 24 Years | 9 (1.8%) | $0 |
| 25 to 44 Years | 179 (36.8%) | $65,515 |
| 45 to 64 Years | 217 (44.6%) | $90,665 |
| 65+ Years | 82 (16.8%) | $28,333 |
| Total | 487 (100.0%) | $67,321 |
Poverty in Tuscarawas
Income Below Poverty by Sex and Age in Tuscarawas
With 8.3% poverty level for males and 18.1% for females among the residents of Tuscarawas, 75 year old and over males and 75 year old and over females are the most vulnerable to poverty, with 9 males (81.8%) and 9 females (47.4%) in their respective age groups living below the poverty level.
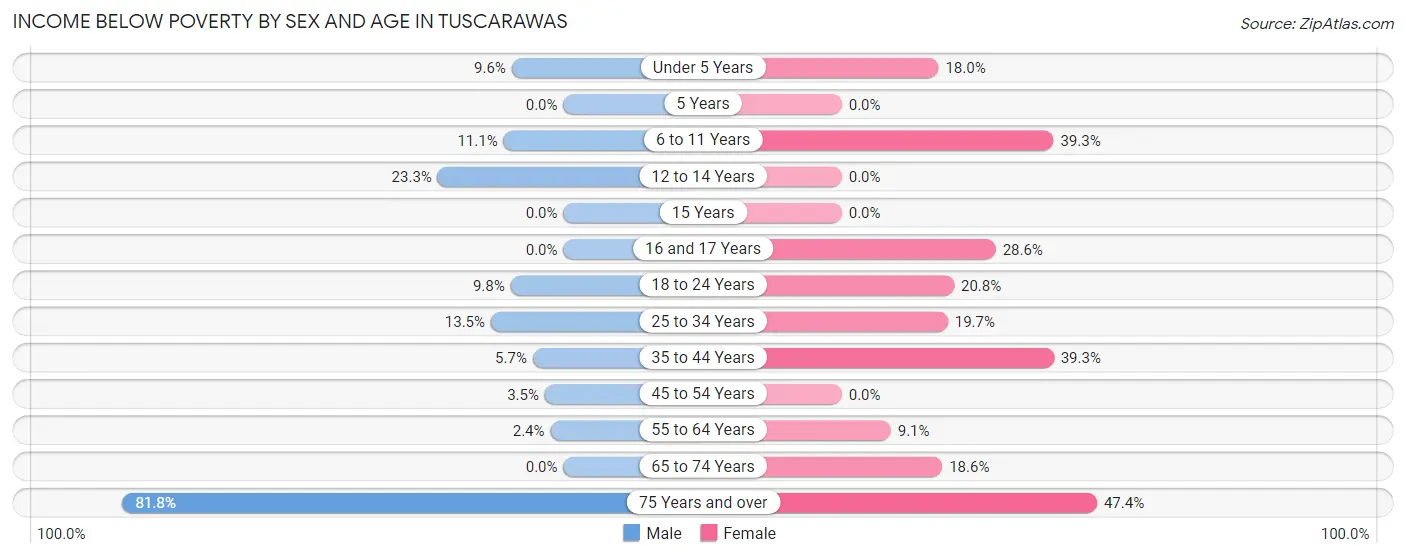
| Age Bracket | Male | Female |
| Under 5 Years | 7 (9.6%) | 7 (17.9%) |
| 5 Years | 0 (0.0%) | 0 (0.0%) |
| 6 to 11 Years | 6 (11.1%) | 11 (39.3%) |
| 12 to 14 Years | 7 (23.3%) | 0 (0.0%) |
| 15 Years | 0 (0.0%) | 0 (0.0%) |
| 16 and 17 Years | 0 (0.0%) | 6 (28.6%) |
| 18 to 24 Years | 5 (9.8%) | 5 (20.8%) |
| 25 to 34 Years | 7 (13.5%) | 12 (19.7%) |
| 35 to 44 Years | 5 (5.7%) | 48 (39.3%) |
| 45 to 54 Years | 4 (3.5%) | 0 (0.0%) |
| 55 to 64 Years | 2 (2.4%) | 10 (9.1%) |
| 65 to 74 Years | 0 (0.0%) | 11 (18.6%) |
| 75 Years and over | 9 (81.8%) | 9 (47.4%) |
| Total | 52 (8.3%) | 119 (18.1%) |
Income Above Poverty by Sex and Age in Tuscarawas
According to the poverty statistics in Tuscarawas, males aged 5 years and females aged 12 to 14 years are the age groups that are most secure financially, with 100.0% of males and 100.0% of females in these age groups living above the poverty line.
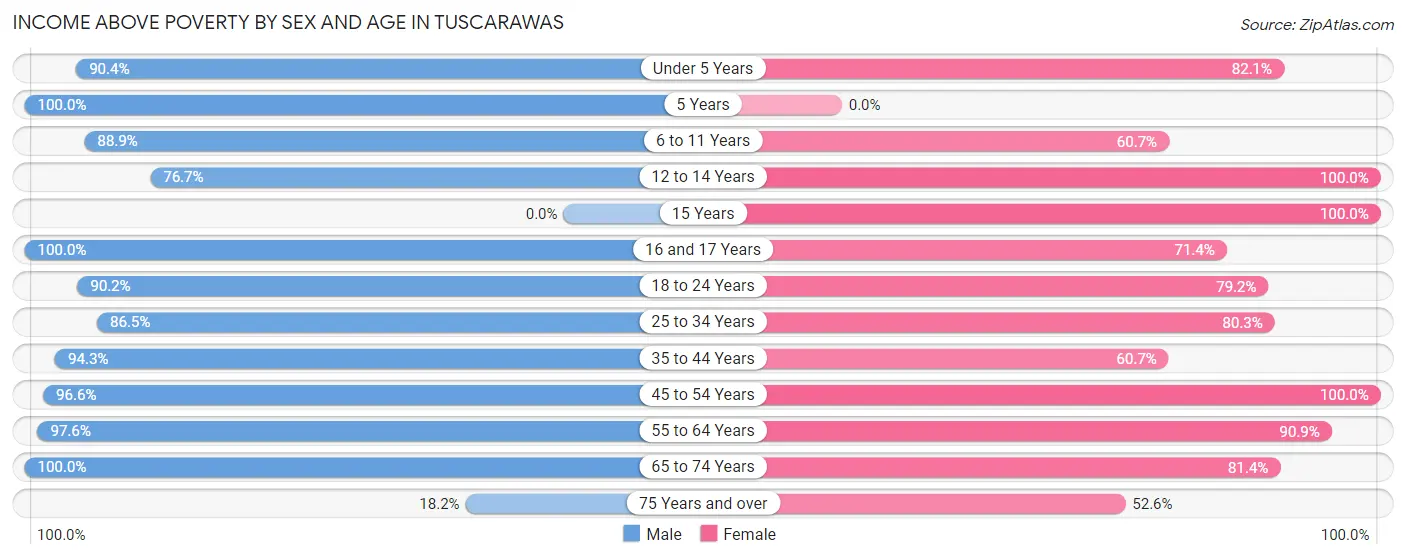
| Age Bracket | Male | Female |
| Under 5 Years | 66 (90.4%) | 32 (82.1%) |
| 5 Years | 7 (100.0%) | 0 (0.0%) |
| 6 to 11 Years | 48 (88.9%) | 17 (60.7%) |
| 12 to 14 Years | 23 (76.7%) | 7 (100.0%) |
| 15 Years | 0 (0.0%) | 83 (100.0%) |
| 16 and 17 Years | 7 (100.0%) | 15 (71.4%) |
| 18 to 24 Years | 46 (90.2%) | 19 (79.2%) |
| 25 to 34 Years | 45 (86.5%) | 49 (80.3%) |
| 35 to 44 Years | 83 (94.3%) | 74 (60.7%) |
| 45 to 54 Years | 112 (96.6%) | 85 (100.0%) |
| 55 to 64 Years | 81 (97.6%) | 100 (90.9%) |
| 65 to 74 Years | 54 (100.0%) | 48 (81.4%) |
| 75 Years and over | 2 (18.2%) | 10 (52.6%) |
| Total | 574 (91.7%) | 539 (81.9%) |
Income Below Poverty Among Married-Couple Families in Tuscarawas
The poverty statistics for married-couple families in Tuscarawas show that 6.4% or 21 of the total 328 families live below the poverty line. Families with 3 or 4 children have the highest poverty rate of 27.8%, comprising of 5 families. On the other hand, families with no children have the lowest poverty rate of 5.1%, which includes 9 families.
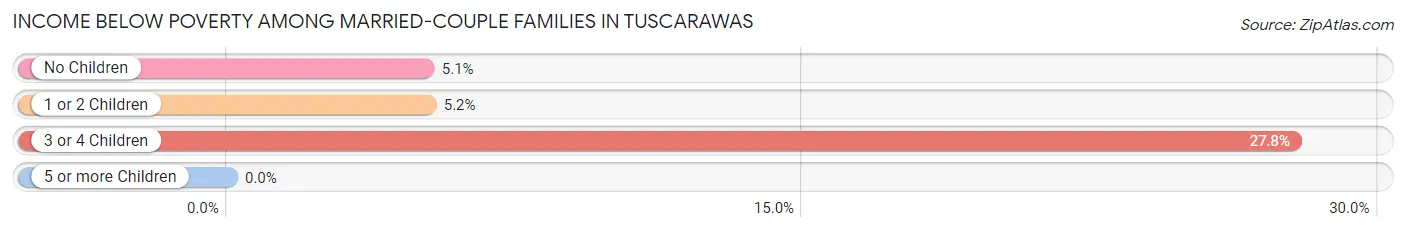
| Children | Above Poverty | Below Poverty |
| No Children | 166 (94.9%) | 9 (5.1%) |
| 1 or 2 Children | 128 (94.8%) | 7 (5.2%) |
| 3 or 4 Children | 13 (72.2%) | 5 (27.8%) |
| 5 or more Children | 0 (0.0%) | 0 (0.0%) |
| Total | 307 (93.6%) | 21 (6.4%) |
Income Below Poverty Among Single-Parent Households in Tuscarawas
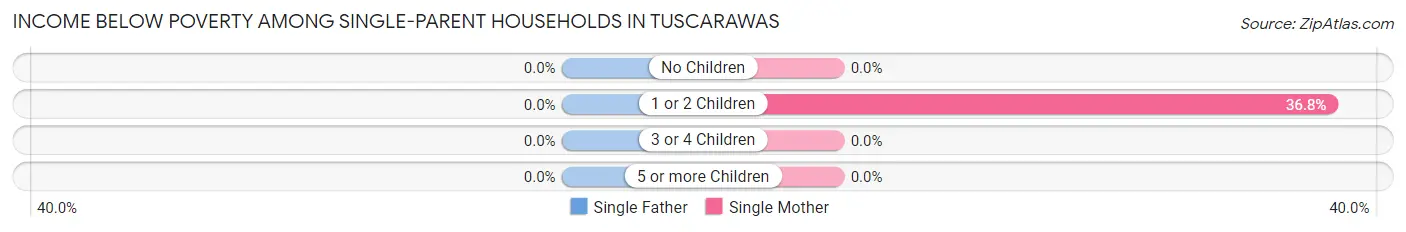
| Children | Single Father | Single Mother |
| No Children | 0 (0.0%) | 0 (0.0%) |
| 1 or 2 Children | 0 (0.0%) | 7 (36.8%) |
| 3 or 4 Children | 0 (0.0%) | 0 (0.0%) |
| 5 or more Children | 0 (0.0%) | 0 (0.0%) |
| Total | 0 (0.0%) | 7 (31.8%) |
Income Below Poverty Among Married-Couple vs Single-Parent Households in Tuscarawas
The poverty data for Tuscarawas shows that 21 of the married-couple family households (6.4%) and 7 of the single-parent households (12.5%) are living below the poverty level. Within the married-couple family households, those with 3 or 4 children have the highest poverty rate, with 5 households (27.8%) falling below the poverty line. Among the single-parent households, those with 1 or 2 children have the highest poverty rate, with 7 household (20.0%) living below poverty.
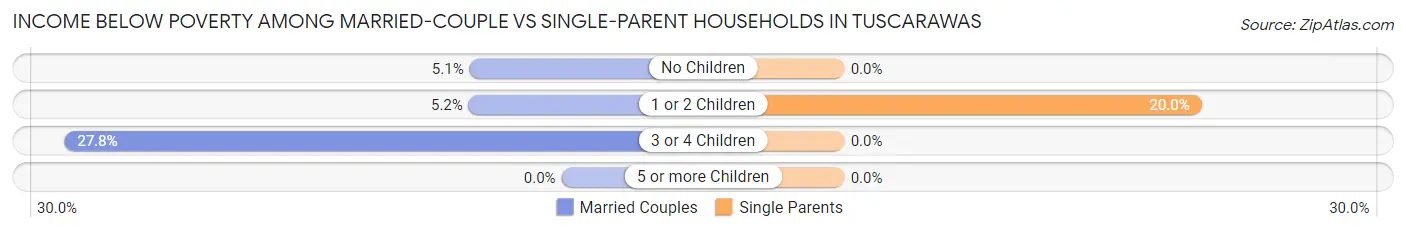
| Children | Married-Couple Families | Single-Parent Households |
| No Children | 9 (5.1%) | 0 (0.0%) |
| 1 or 2 Children | 7 (5.2%) | 7 (20.0%) |
| 3 or 4 Children | 5 (27.8%) | 0 (0.0%) |
| 5 or more Children | 0 (0.0%) | 0 (0.0%) |
| Total | 21 (6.4%) | 7 (12.5%) |
Race in Tuscarawas
The most populous races in Tuscarawas are White / Caucasian (1,242 | 95.8%), Some other Race (35 | 2.7%), and Two or more Races (19 | 1.5%).
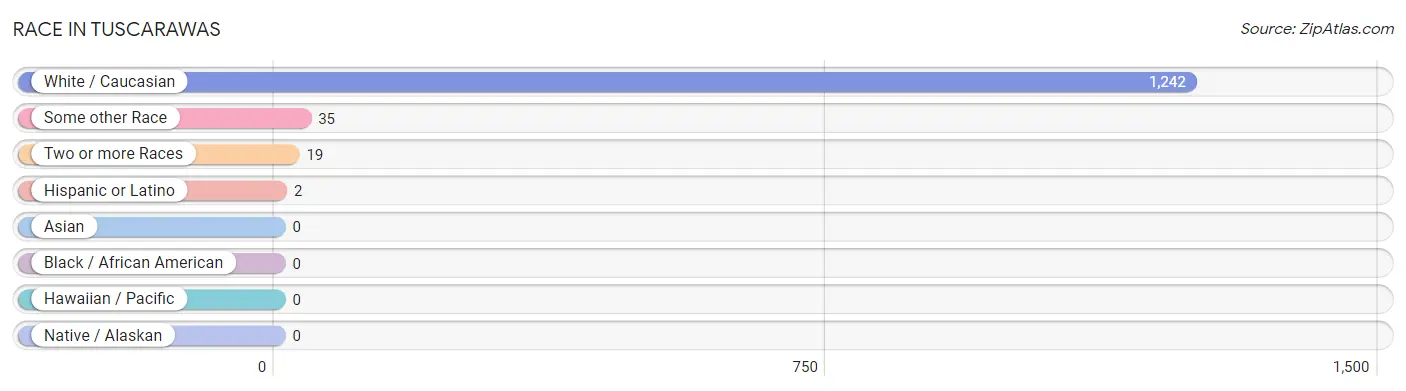
| Race | # Population | % Population |
| Asian | 0 | 0.0% |
| Black / African American | 0 | 0.0% |
| Hawaiian / Pacific | 0 | 0.0% |
| Hispanic or Latino | 2 | 0.2% |
| Native / Alaskan | 0 | 0.0% |
| White / Caucasian | 1,242 | 95.8% |
| Two or more Races | 19 | 1.5% |
| Some other Race | 35 | 2.7% |
| Total | 1,296 | 100.0% |
Ancestry in Tuscarawas
The most populous ancestries reported in Tuscarawas are German (408 | 31.5%), Italian (184 | 14.2%), Scottish (170 | 13.1%), Irish (124 | 9.6%), and English (86 | 6.6%), together accounting for 75.0% of all Tuscarawas residents.
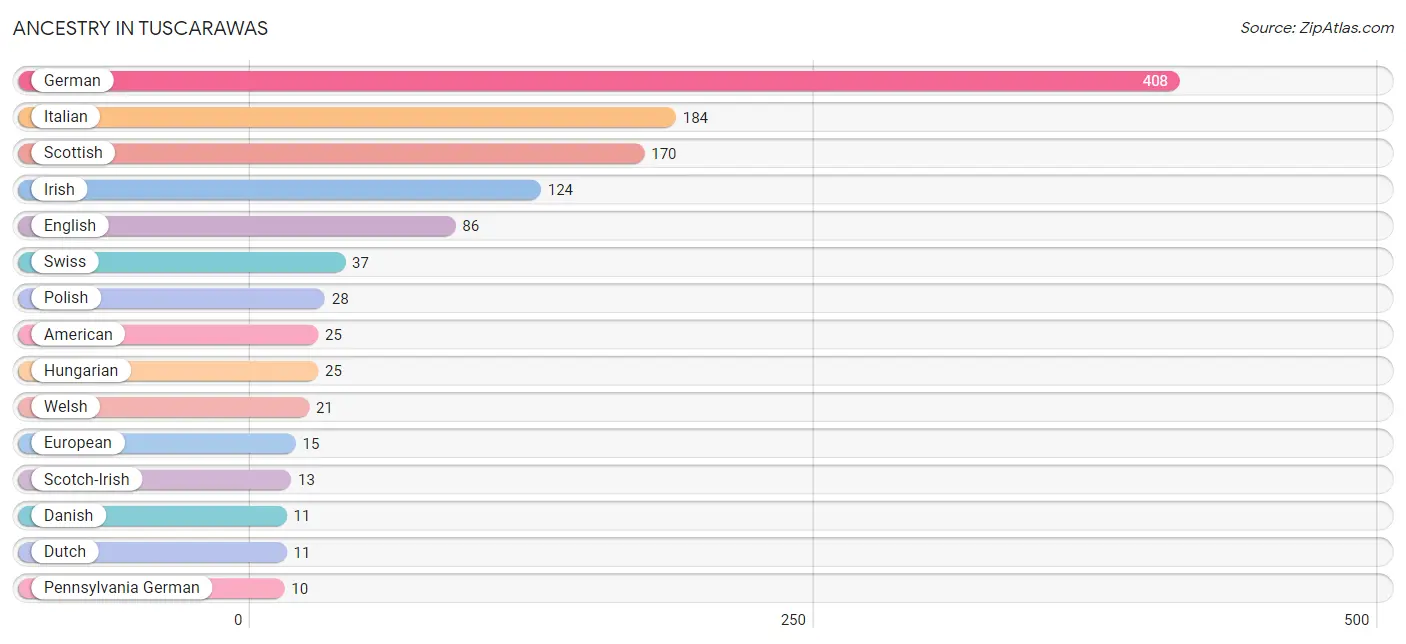
| Ancestry | # Population | % Population |
| American | 25 | 1.9% |
| Colombian | 2 | 0.2% |
| Danish | 11 | 0.9% |
| Dutch | 11 | 0.9% |
| English | 86 | 6.6% |
| European | 15 | 1.2% |
| French | 3 | 0.2% |
| German | 408 | 31.5% |
| Hungarian | 25 | 1.9% |
| Irish | 124 | 9.6% |
| Italian | 184 | 14.2% |
| Pennsylvania German | 10 | 0.8% |
| Polish | 28 | 2.2% |
| Scotch-Irish | 13 | 1.0% |
| Scottish | 170 | 13.1% |
| South American | 2 | 0.2% |
| Swedish | 1 | 0.1% |
| Swiss | 37 | 2.9% |
| Welsh | 21 | 1.6% | View All 19 Rows |
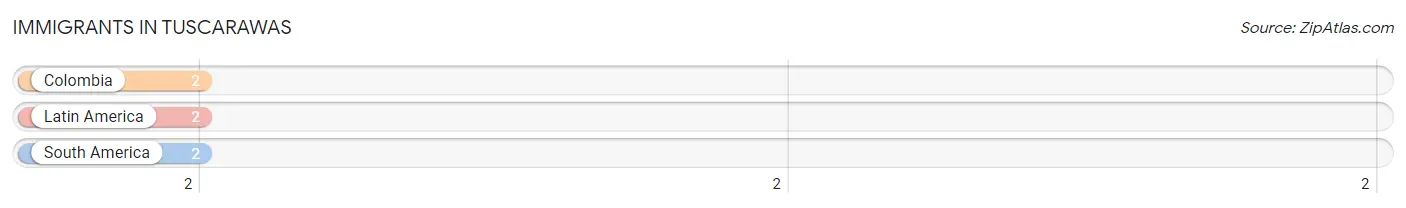
Immigrants in Tuscarawas
The most numerous immigrant groups reported in Tuscarawas came from Colombia (2 | 0.2%), Latin America (2 | 0.2%), and South America (2 | 0.2%), together accounting for 0.5% of all Tuscarawas residents.
| Immigration Origin | # Population | % Population |
| Colombia | 2 | 0.2% |
| Latin America | 2 | 0.2% |
| South America | 2 | 0.2% | View All 3 Rows |
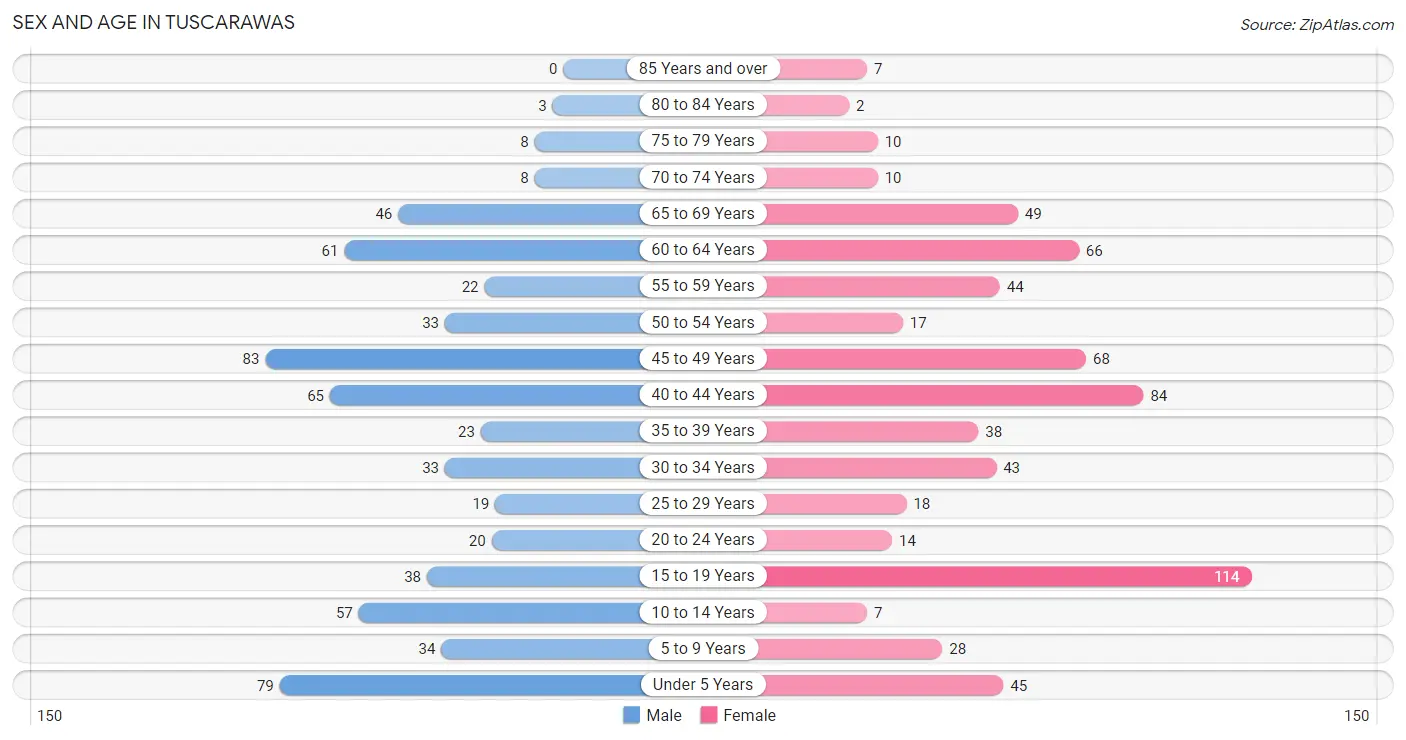
Sex and Age in Tuscarawas
Sex and Age in Tuscarawas
The most populous age groups in Tuscarawas are 45 to 49 Years (83 | 13.1%) for men and 15 to 19 Years (114 | 17.2%) for women.
| Age Bracket | Male | Female |
| Under 5 Years | 79 (12.5%) | 45 (6.8%) |
| 5 to 9 Years | 34 (5.4%) | 28 (4.2%) |
| 10 to 14 Years | 57 (9.0%) | 7 (1.1%) |
| 15 to 19 Years | 38 (6.0%) | 114 (17.2%) |
| 20 to 24 Years | 20 (3.2%) | 14 (2.1%) |
| 25 to 29 Years | 19 (3.0%) | 18 (2.7%) |
| 30 to 34 Years | 33 (5.2%) | 43 (6.5%) |
| 35 to 39 Years | 23 (3.6%) | 38 (5.7%) |
| 40 to 44 Years | 65 (10.3%) | 84 (12.7%) |
| 45 to 49 Years | 83 (13.1%) | 68 (10.2%) |
| 50 to 54 Years | 33 (5.2%) | 17 (2.6%) |
| 55 to 59 Years | 22 (3.5%) | 44 (6.6%) |
| 60 to 64 Years | 61 (9.7%) | 66 (9.9%) |
| 65 to 69 Years | 46 (7.3%) | 49 (7.4%) |
| 70 to 74 Years | 8 (1.3%) | 10 (1.5%) |
| 75 to 79 Years | 8 (1.3%) | 10 (1.5%) |
| 80 to 84 Years | 3 (0.5%) | 2 (0.3%) |
| 85 Years and over | 0 (0.0%) | 7 (1.1%) |
| Total | 632 (100.0%) | 664 (100.0%) |
Families and Households in Tuscarawas
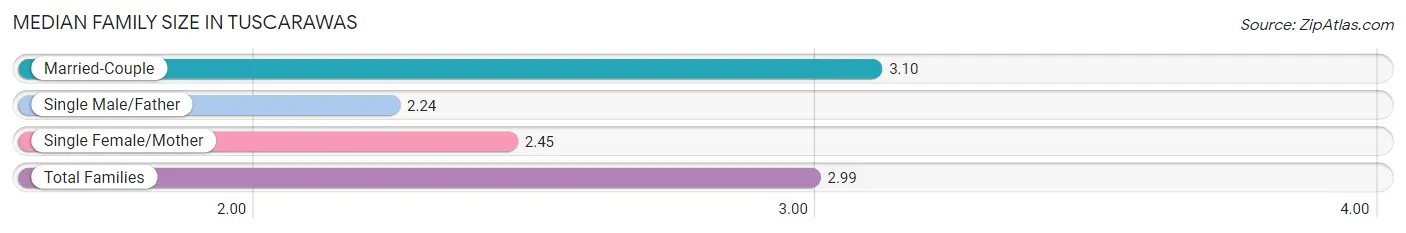
Median Family Size in Tuscarawas
The median family size in Tuscarawas is 2.99 persons per family, with married-couple families (328 | 85.4%) accounting for the largest median family size of 3.1 persons per family. On the other hand, single male/father families (34 | 8.8%) represent the smallest median family size with 2.24 persons per family.
| Family Type | # Families | Family Size |
| Married-Couple | 328 (85.4%) | 3.10 |
| Single Male/Father | 34 (8.8%) | 2.24 |
| Single Female/Mother | 22 (5.7%) | 2.45 |
| Total Families | 384 (100.0%) | 2.99 |
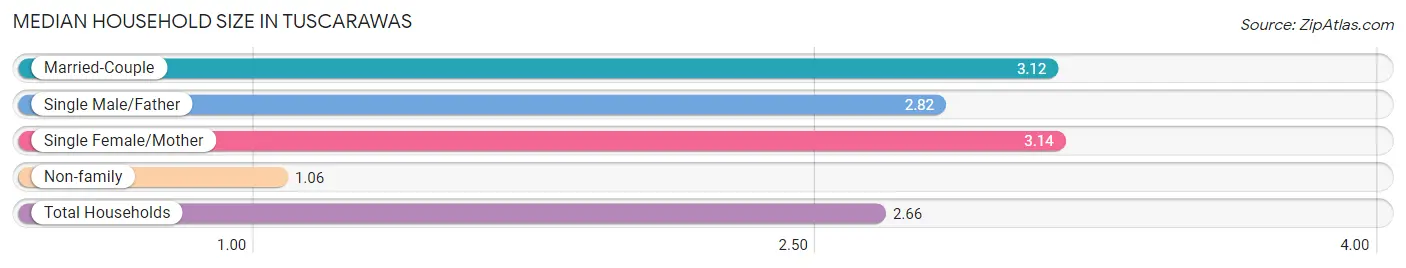
Median Household Size in Tuscarawas
The median household size in Tuscarawas is 2.66 persons per household, with single female/mother households (22 | 4.5%) accounting for the largest median household size of 3.14 persons per household. non-family households (103 | 21.1%) represent the smallest median household size with 1.06 persons per household.
| Household Type | # Households | Household Size |
| Married-Couple | 328 (67.3%) | 3.12 |
| Single Male/Father | 34 (7.0%) | 2.82 |
| Single Female/Mother | 22 (4.5%) | 3.14 |
| Non-family | 103 (21.1%) | 1.06 |
| Total Households | 487 (100.0%) | 2.66 |
Household Size by Marriage Status in Tuscarawas
Out of a total of 487 households in Tuscarawas, 384 (78.8%) are family households, while 103 (21.1%) are nonfamily households. The most numerous type of family households are 2-person households, comprising 192, and the most common type of nonfamily households are 1-person households, comprising 96.
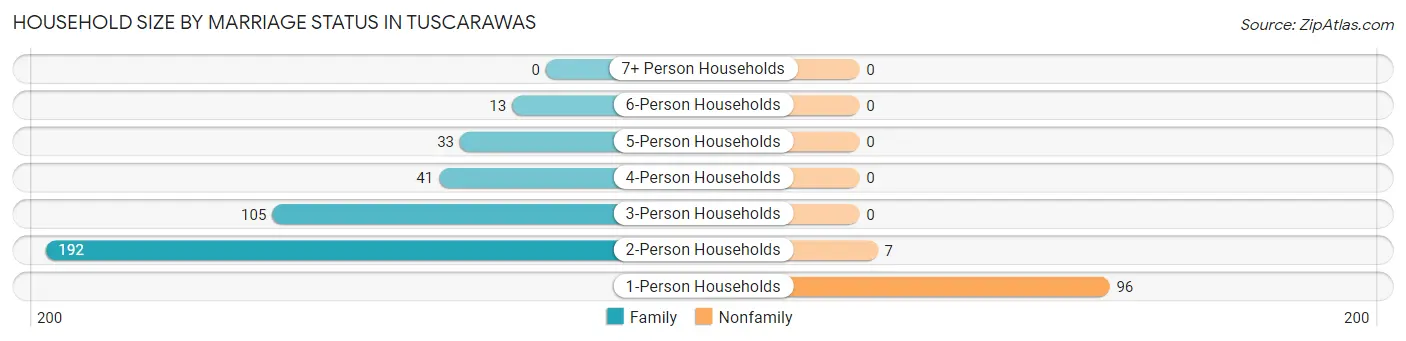
| Household Size | Family Households | Nonfamily Households |
| 1-Person Households | - | 96 (19.7%) |
| 2-Person Households | 192 (39.4%) | 7 (1.4%) |
| 3-Person Households | 105 (21.6%) | 0 (0.0%) |
| 4-Person Households | 41 (8.4%) | 0 (0.0%) |
| 5-Person Households | 33 (6.8%) | 0 (0.0%) |
| 6-Person Households | 13 (2.7%) | 0 (0.0%) |
| 7+ Person Households | 0 (0.0%) | 0 (0.0%) |
| Total | 384 (78.8%) | 103 (21.1%) |
Female Fertility in Tuscarawas
Fertility by Age in Tuscarawas
Average fertility rate in Tuscarawas is 20.0 births per 1,000 women. Women in the age bracket of 20 to 34 years have the highest fertility rate with 80.0 births per 1,000 women. Women in the age bracket of 20 to 34 years acount for 75.0% of all women with births.

| Age Bracket | Women with Births | Births / 1,000 Women |
| 15 to 19 years | 2 (25.0%) | 18.0 |
| 20 to 34 years | 6 (75.0%) | 80.0 |
| 35 to 50 years | 0 (0.0%) | 0.0 |
| Total | 8 (100.0%) | 20.0 |
Fertility by Age by Marriage Status in Tuscarawas
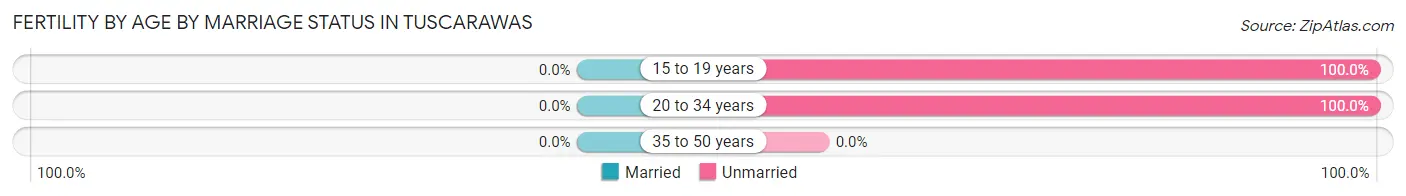
| Age Bracket | Married | Unmarried |
| 15 to 19 years | 0 (0.0%) | 2 (100.0%) |
| 20 to 34 years | 0 (0.0%) | 6 (100.0%) |
| 35 to 50 years | 0 (0.0%) | 0 (0.0%) |
| Total | 0 (0.0%) | 8 (100.0%) |
Fertility by Education in Tuscarawas
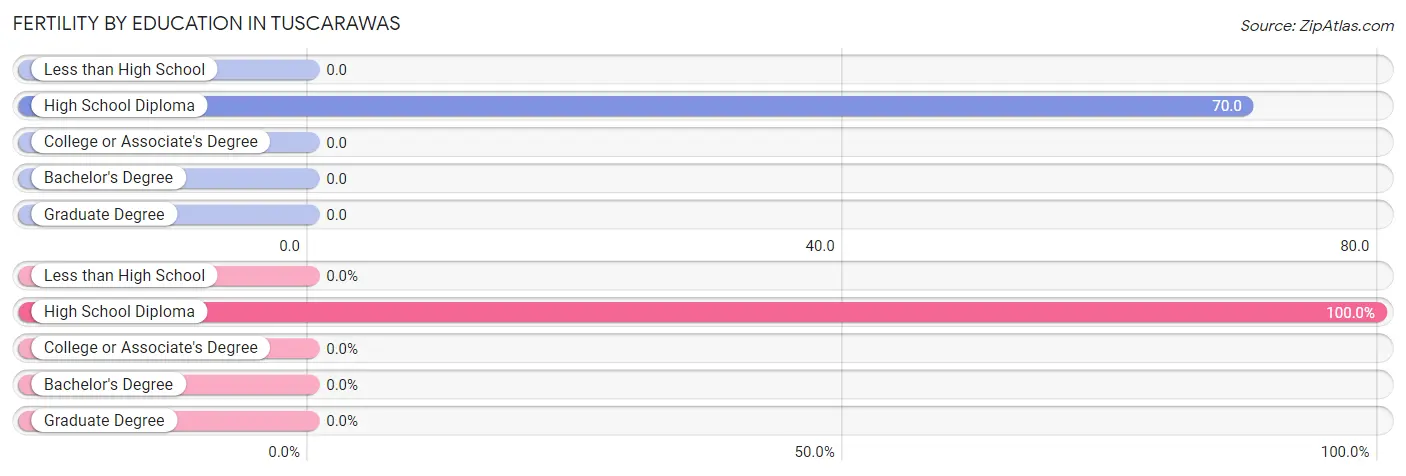
| Educational Attainment | Women with Births | Births / 1,000 Women |
| Less than High School | 0 (0.0%) | 0.0 |
| High School Diploma | 8 (100.0%) | 70.0 |
| College or Associate's Degree | 0 (0.0%) | 0.0 |
| Bachelor's Degree | 0 (0.0%) | 0.0 |
| Graduate Degree | 0 (0.0%) | 0.0 |
| Total | 8 (100.0%) | 20.0 |
Fertility by Education by Marriage Status in Tuscarawas
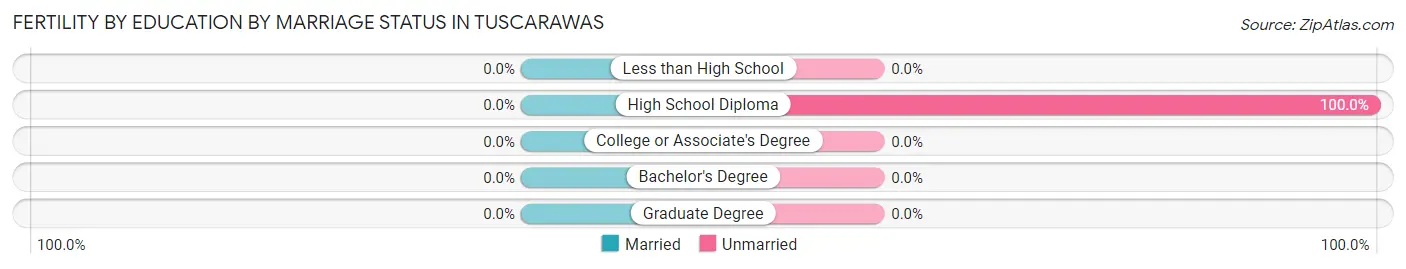
| Educational Attainment | Married | Unmarried |
| Less than High School | 0 (0.0%) | 0 (0.0%) |
| High School Diploma | 0 (0.0%) | 8 (100.0%) |
| College or Associate's Degree | 0 (0.0%) | 0 (0.0%) |
| Bachelor's Degree | 0 (0.0%) | 0 (0.0%) |
| Graduate Degree | 0 (0.0%) | 0 (0.0%) |
| Total | 0 (0.0%) | 8 (100.0%) |
Employment Characteristics in Tuscarawas
Employment by Class of Employer in Tuscarawas
Among the 634 employed individuals in Tuscarawas, private company employees (466 | 73.5%), local government employees (58 | 9.1%), and not-for-profit organizations (57 | 9.0%) make up the most common classes of employment.
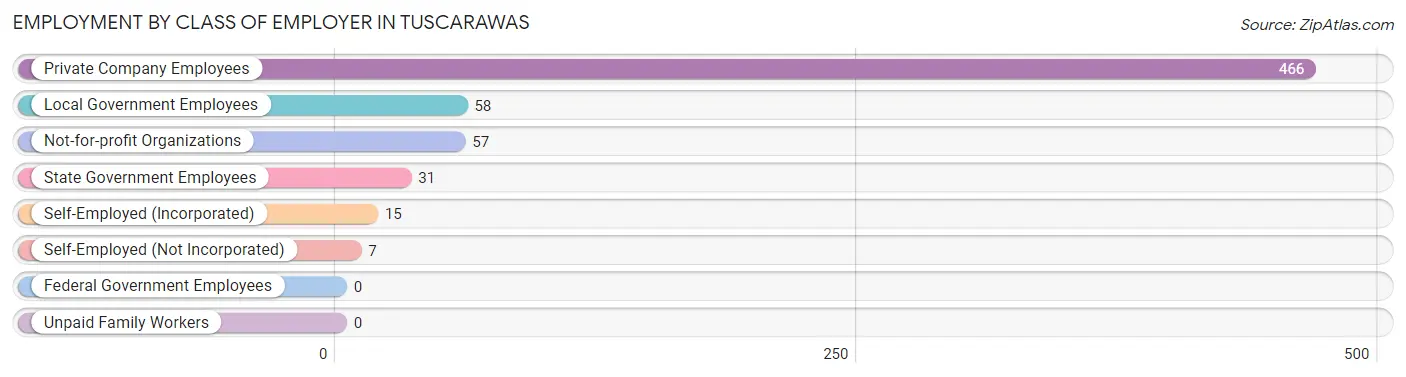
| Employer Class | # Employees | % Employees |
| Private Company Employees | 466 | 73.5% |
| Self-Employed (Incorporated) | 15 | 2.4% |
| Self-Employed (Not Incorporated) | 7 | 1.1% |
| Not-for-profit Organizations | 57 | 9.0% |
| Local Government Employees | 58 | 9.1% |
| State Government Employees | 31 | 4.9% |
| Federal Government Employees | 0 | 0.0% |
| Unpaid Family Workers | 0 | 0.0% |
| Total | 634 | 100.0% |
Employment Status by Age in Tuscarawas
According to the labor force statistics for Tuscarawas, out of the total population over 16 years of age (963), 70.3% or 677 individuals are in the labor force, with 3.0% or 20 of them unemployed. The age group with the highest labor force participation rate is 20 to 24 years, with 100.0% or 34 individuals in the labor force. Within the labor force, the 16 to 19 years age range has the highest percentage of unemployed individuals, with 25.0% or 6 of them being unemployed.
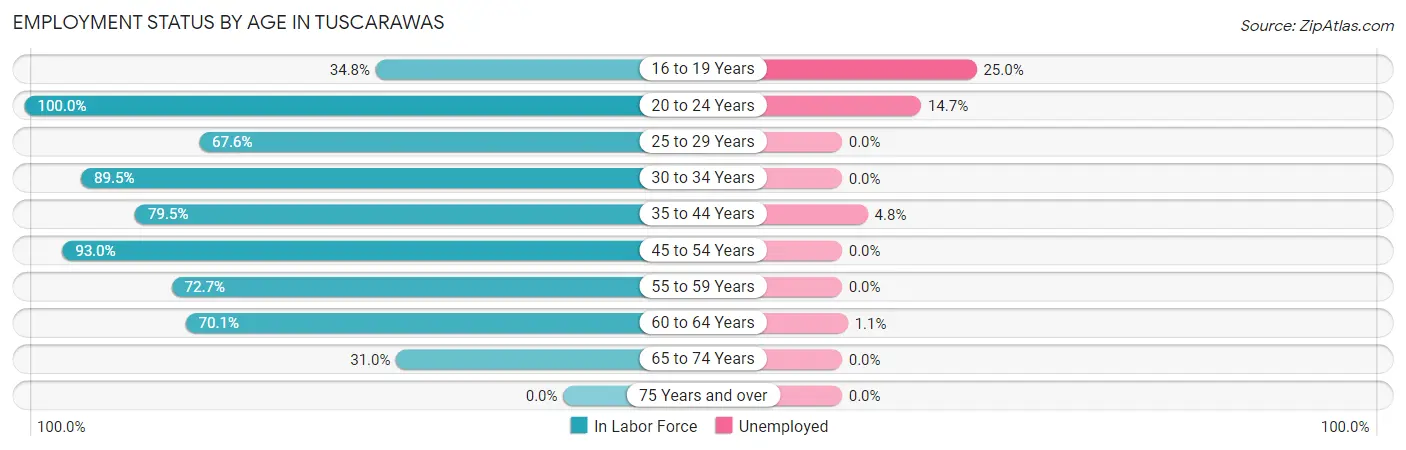
| Age Bracket | In Labor Force | Unemployed |
| 16 to 19 Years | 24 (34.8%) | 6 (25.0%) |
| 20 to 24 Years | 34 (100.0%) | 5 (14.7%) |
| 25 to 29 Years | 25 (67.6%) | 0 (0.0%) |
| 30 to 34 Years | 68 (89.5%) | 0 (0.0%) |
| 35 to 44 Years | 167 (79.5%) | 8 (4.8%) |
| 45 to 54 Years | 187 (93.0%) | 0 (0.0%) |
| 55 to 59 Years | 48 (72.7%) | 0 (0.0%) |
| 60 to 64 Years | 89 (70.1%) | 1 (1.1%) |
| 65 to 74 Years | 35 (31.0%) | 0 (0.0%) |
| 75 Years and over | 0 (0.0%) | 0 (0.0%) |
| Total | 677 (70.3%) | 20 (3.0%) |
Employment Status by Educational Attainment in Tuscarawas
According to labor force statistics for Tuscarawas, 81.5% of individuals (584) out of the total population between 25 and 64 years of age (717) are in the labor force, with 1.5% or 9 of them being unemployed. The group with the highest labor force participation rate are those with the educational attainment of bachelor's degree or higher, with 100.0% or 110 individuals in the labor force. Within the labor force, individuals with less than high school education have the highest percentage of unemployment, with 60.0% or 6 of them being unemployed.
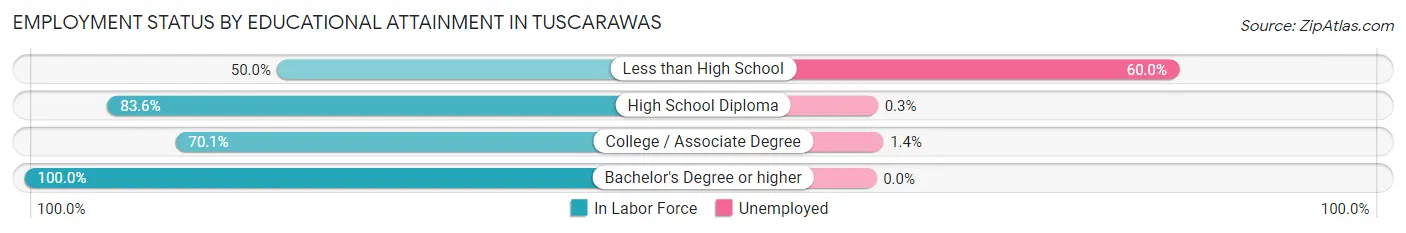
| Educational Attainment | In Labor Force | Unemployed |
| Less than High School | 10 (50.0%) | 12 (60.0%) |
| High School Diploma | 326 (83.6%) | 1 (0.3%) |
| College / Associate Degree | 138 (70.1%) | 3 (1.4%) |
| Bachelor's Degree or higher | 110 (100.0%) | 0 (0.0%) |
| Total | 584 (81.5%) | 11 (1.5%) |
Employment Occupations by Sex in Tuscarawas
Management, Business, Science and Arts Occupations
The most common Management, Business, Science and Arts occupations in Tuscarawas are Health Diagnosing & Treating (75 | 11.4%), Health Technologists (59 | 9.0%), Management (50 | 7.6%), Community & Social Service (42 | 6.4%), and Education Instruction & Library (34 | 5.2%).
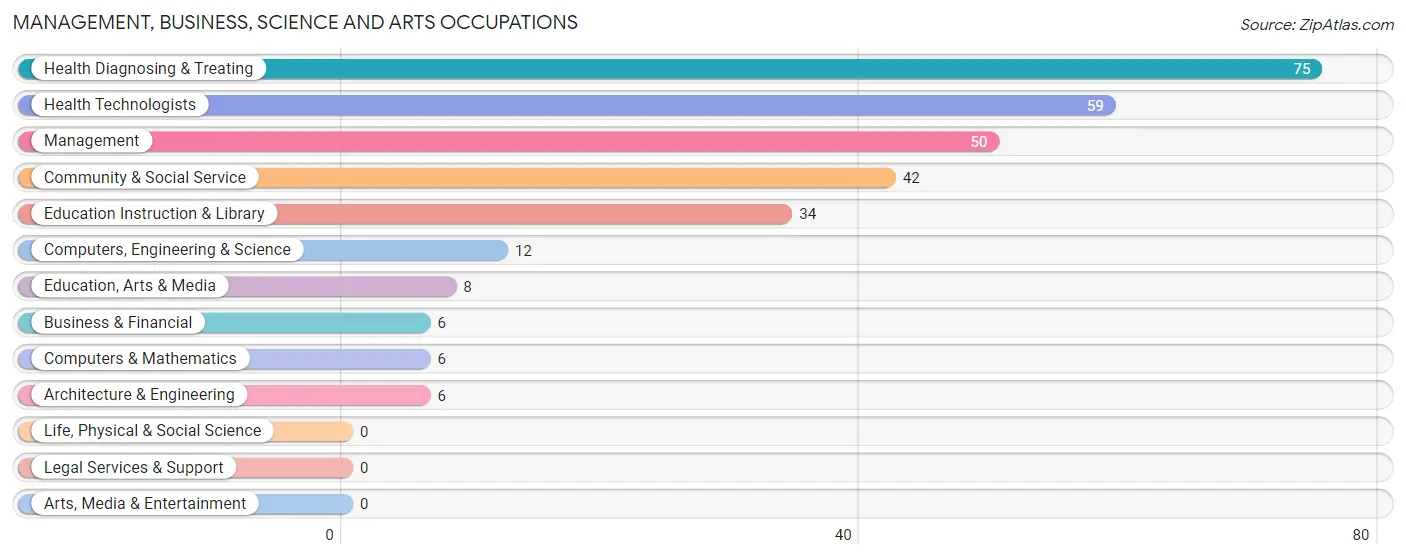
Management, Business, Science and Arts Occupations by Sex
Within the Management, Business, Science and Arts occupations in Tuscarawas, the most male-oriented occupations are Computers & Mathematics (100.0%), Computers, Engineering & Science (58.3%), and Health Diagnosing & Treating (18.7%), while the most female-oriented occupations are Business & Financial (100.0%), Education, Arts & Media (100.0%), and Health Technologists (100.0%).
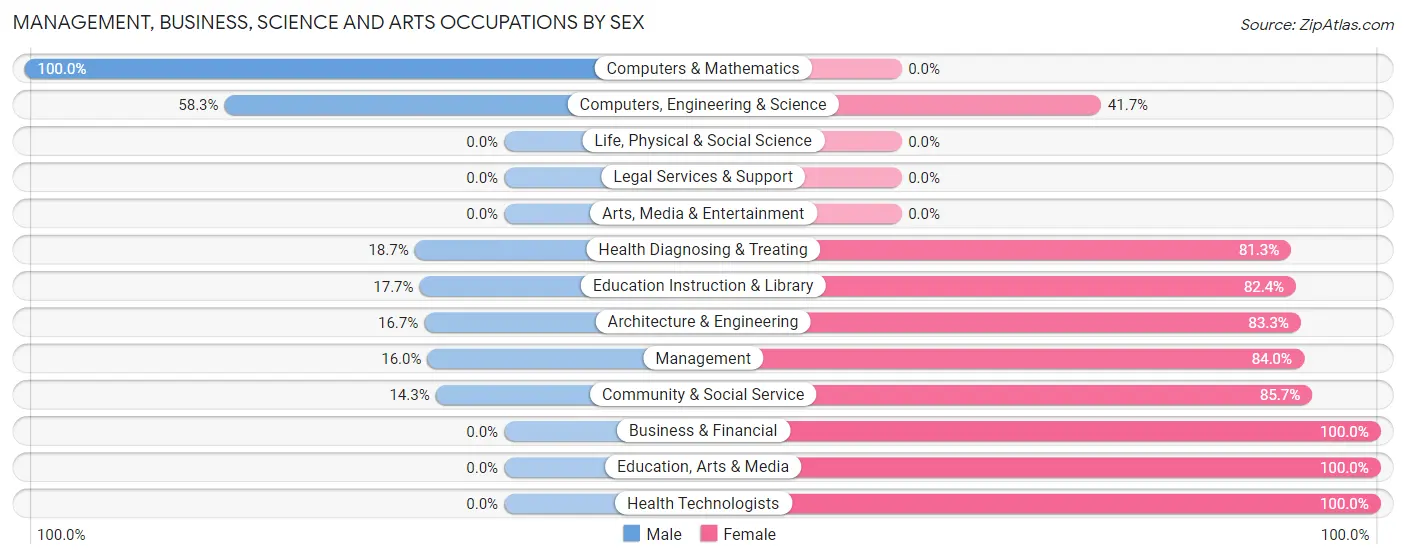
| Occupation | Male | Female |
| Management | 8 (16.0%) | 42 (84.0%) |
| Business & Financial | 0 (0.0%) | 6 (100.0%) |
| Computers, Engineering & Science | 7 (58.3%) | 5 (41.7%) |
| Computers & Mathematics | 6 (100.0%) | 0 (0.0%) |
| Architecture & Engineering | 1 (16.7%) | 5 (83.3%) |
| Life, Physical & Social Science | 0 (0.0%) | 0 (0.0%) |
| Community & Social Service | 6 (14.3%) | 36 (85.7%) |
| Education, Arts & Media | 0 (0.0%) | 8 (100.0%) |
| Legal Services & Support | 0 (0.0%) | 0 (0.0%) |
| Education Instruction & Library | 6 (17.6%) | 28 (82.4%) |
| Arts, Media & Entertainment | 0 (0.0%) | 0 (0.0%) |
| Health Diagnosing & Treating | 14 (18.7%) | 61 (81.3%) |
| Health Technologists | 0 (0.0%) | 59 (100.0%) |
| Total (Category) | 35 (18.9%) | 150 (81.1%) |
| Total (Overall) | 356 (54.2%) | 301 (45.8%) |
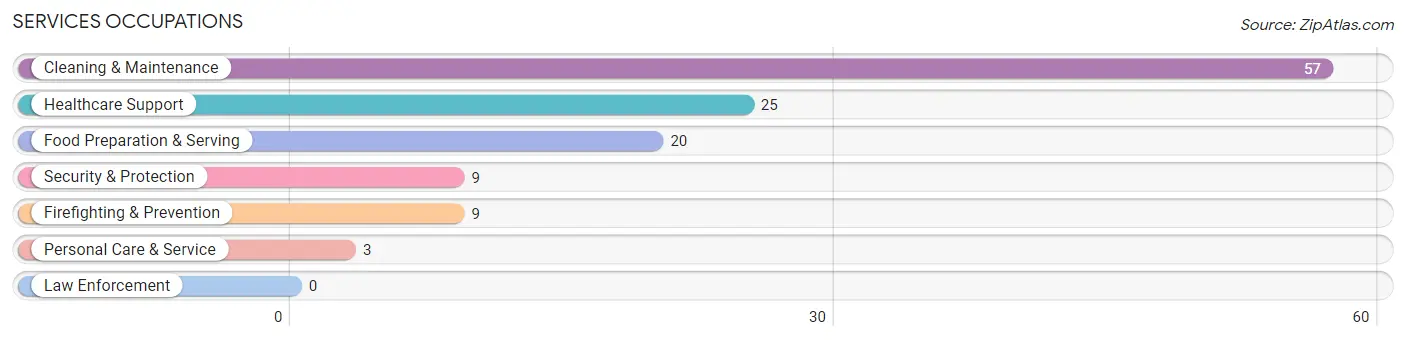
Services Occupations
The most common Services occupations in Tuscarawas are Cleaning & Maintenance (57 | 8.7%), Healthcare Support (25 | 3.8%), Food Preparation & Serving (20 | 3.0%), Security & Protection (9 | 1.4%), and Firefighting & Prevention (9 | 1.4%).
Services Occupations by Sex
Within the Services occupations in Tuscarawas, the most male-oriented occupations are Security & Protection (100.0%), Firefighting & Prevention (100.0%), and Cleaning & Maintenance (100.0%), while the most female-oriented occupations are Personal Care & Service (100.0%), Food Preparation & Serving (80.0%), and Healthcare Support (60.0%).
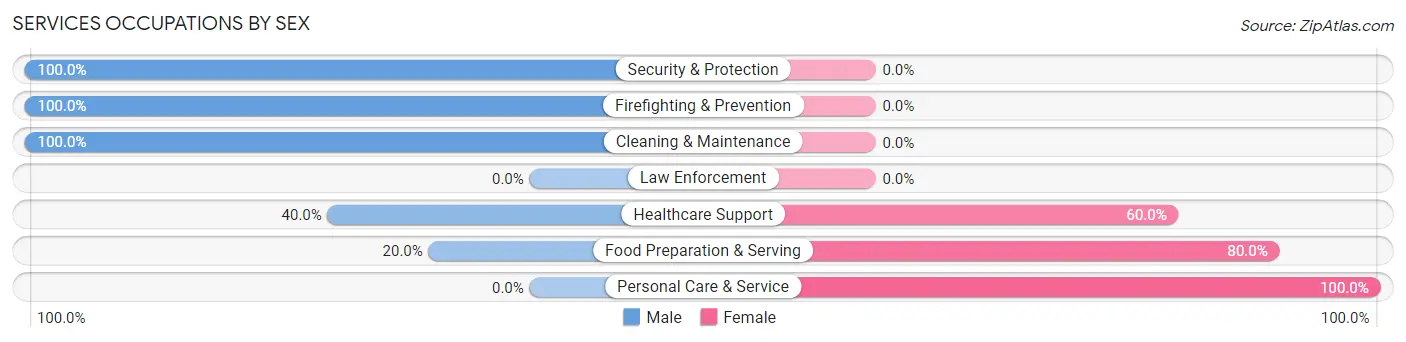
| Occupation | Male | Female |
| Healthcare Support | 10 (40.0%) | 15 (60.0%) |
| Security & Protection | 9 (100.0%) | 0 (0.0%) |
| Firefighting & Prevention | 9 (100.0%) | 0 (0.0%) |
| Law Enforcement | 0 (0.0%) | 0 (0.0%) |
| Food Preparation & Serving | 4 (20.0%) | 16 (80.0%) |
| Cleaning & Maintenance | 57 (100.0%) | 0 (0.0%) |
| Personal Care & Service | 0 (0.0%) | 3 (100.0%) |
| Total (Category) | 80 (70.2%) | 34 (29.8%) |
| Total (Overall) | 356 (54.2%) | 301 (45.8%) |
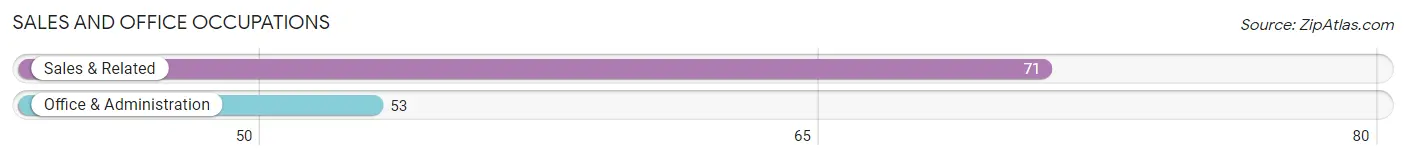
Sales and Office Occupations
The most common Sales and Office occupations in Tuscarawas are Sales & Related (71 | 10.8%), and Office & Administration (53 | 8.1%).
Sales and Office Occupations by Sex
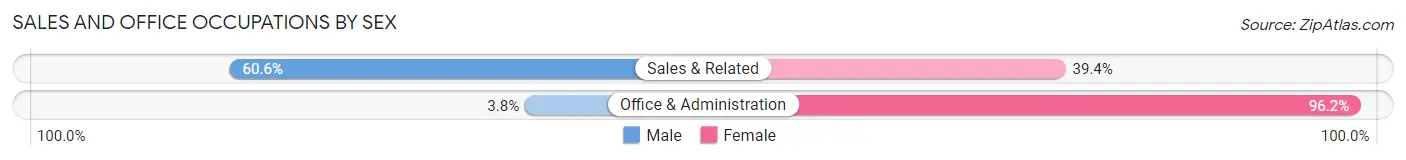
| Occupation | Male | Female |
| Sales & Related | 43 (60.6%) | 28 (39.4%) |
| Office & Administration | 2 (3.8%) | 51 (96.2%) |
| Total (Category) | 45 (36.3%) | 79 (63.7%) |
| Total (Overall) | 356 (54.2%) | 301 (45.8%) |
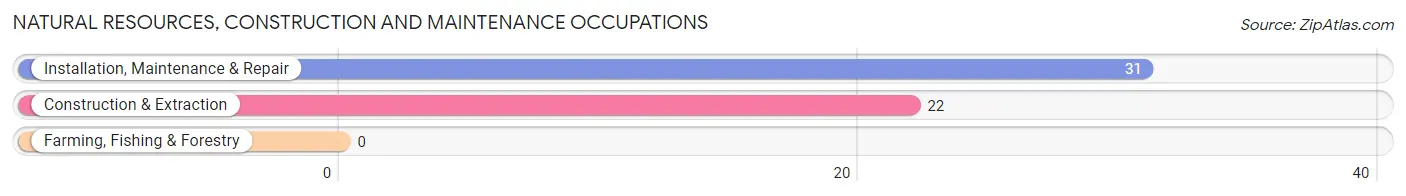
Natural Resources, Construction and Maintenance Occupations
The most common Natural Resources, Construction and Maintenance occupations in Tuscarawas are Installation, Maintenance & Repair (31 | 4.7%), and Construction & Extraction (22 | 3.4%).
Natural Resources, Construction and Maintenance Occupations by Sex
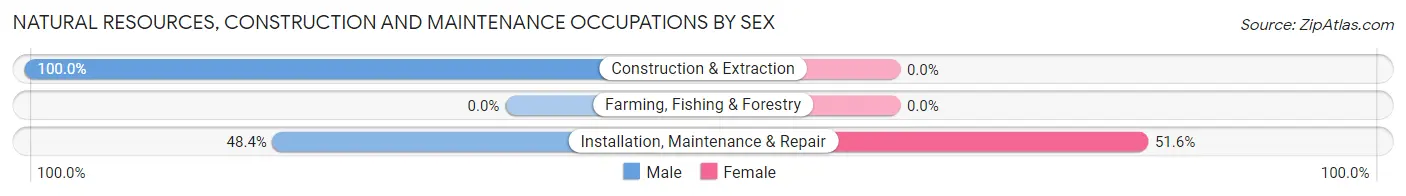
| Occupation | Male | Female |
| Farming, Fishing & Forestry | 0 (0.0%) | 0 (0.0%) |
| Construction & Extraction | 22 (100.0%) | 0 (0.0%) |
| Installation, Maintenance & Repair | 15 (48.4%) | 16 (51.6%) |
| Total (Category) | 37 (69.8%) | 16 (30.2%) |
| Total (Overall) | 356 (54.2%) | 301 (45.8%) |
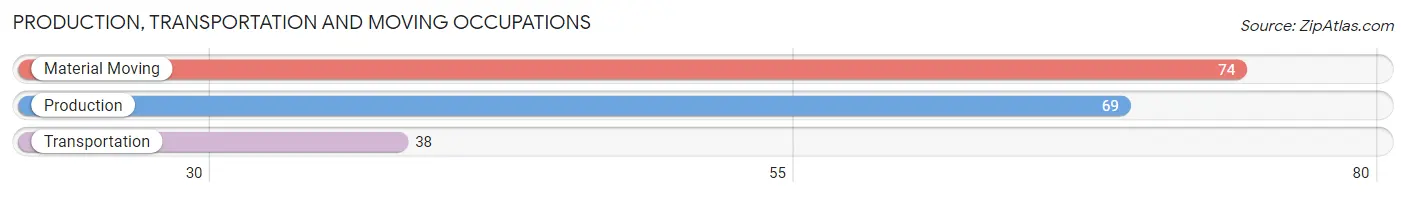
Production, Transportation and Moving Occupations
The most common Production, Transportation and Moving occupations in Tuscarawas are Material Moving (74 | 11.3%), Production (69 | 10.5%), and Transportation (38 | 5.8%).
Production, Transportation and Moving Occupations by Sex
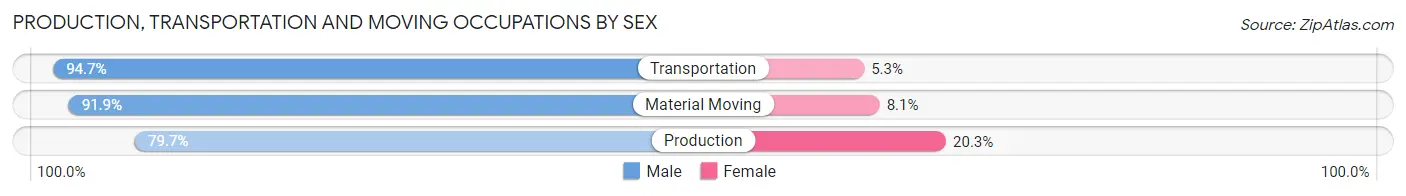
| Occupation | Male | Female |
| Production | 55 (79.7%) | 14 (20.3%) |
| Transportation | 36 (94.7%) | 2 (5.3%) |
| Material Moving | 68 (91.9%) | 6 (8.1%) |
| Total (Category) | 159 (87.8%) | 22 (12.1%) |
| Total (Overall) | 356 (54.2%) | 301 (45.8%) |
Employment Industries by Sex in Tuscarawas
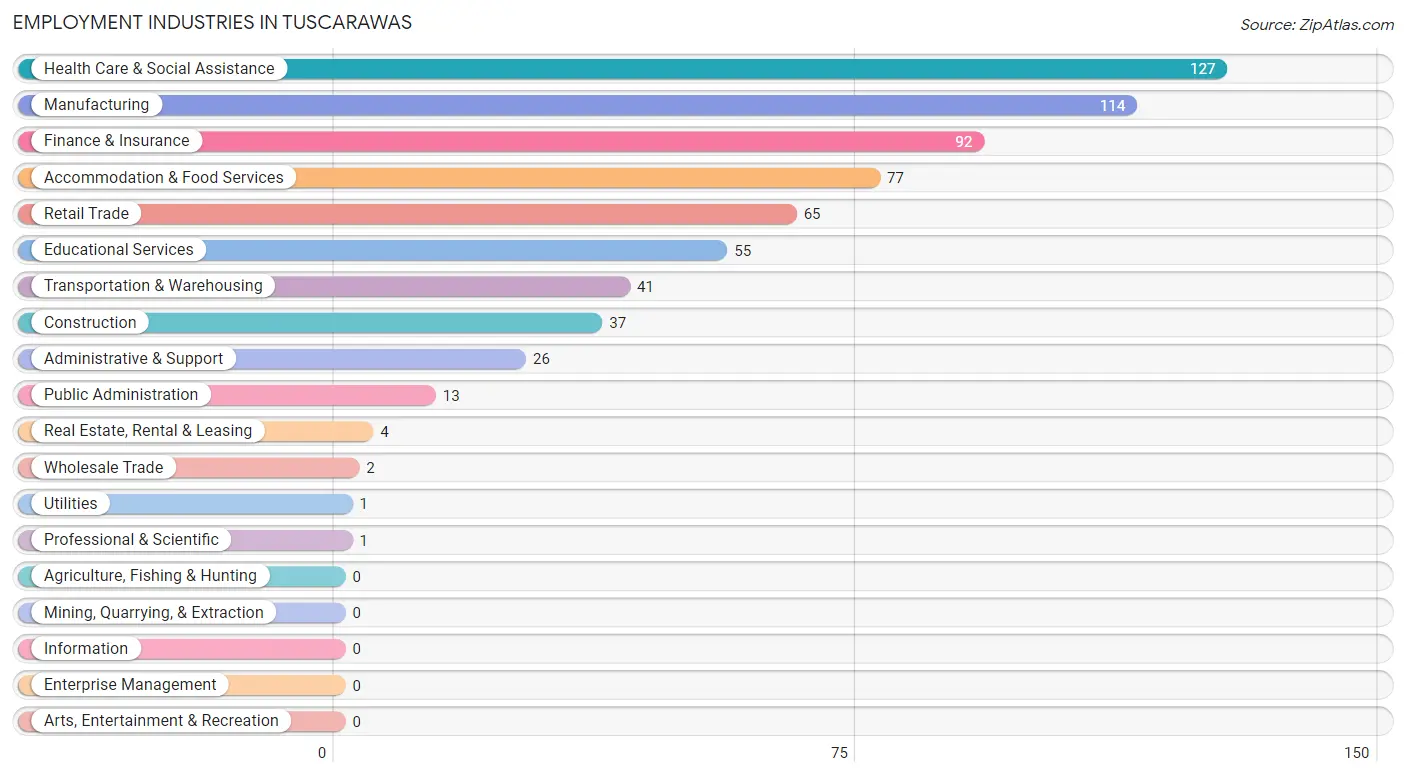
Employment Industries in Tuscarawas
The major employment industries in Tuscarawas include Health Care & Social Assistance (127 | 19.3%), Manufacturing (114 | 17.3%), Finance & Insurance (92 | 14.0%), Accommodation & Food Services (77 | 11.7%), and Retail Trade (65 | 9.9%).
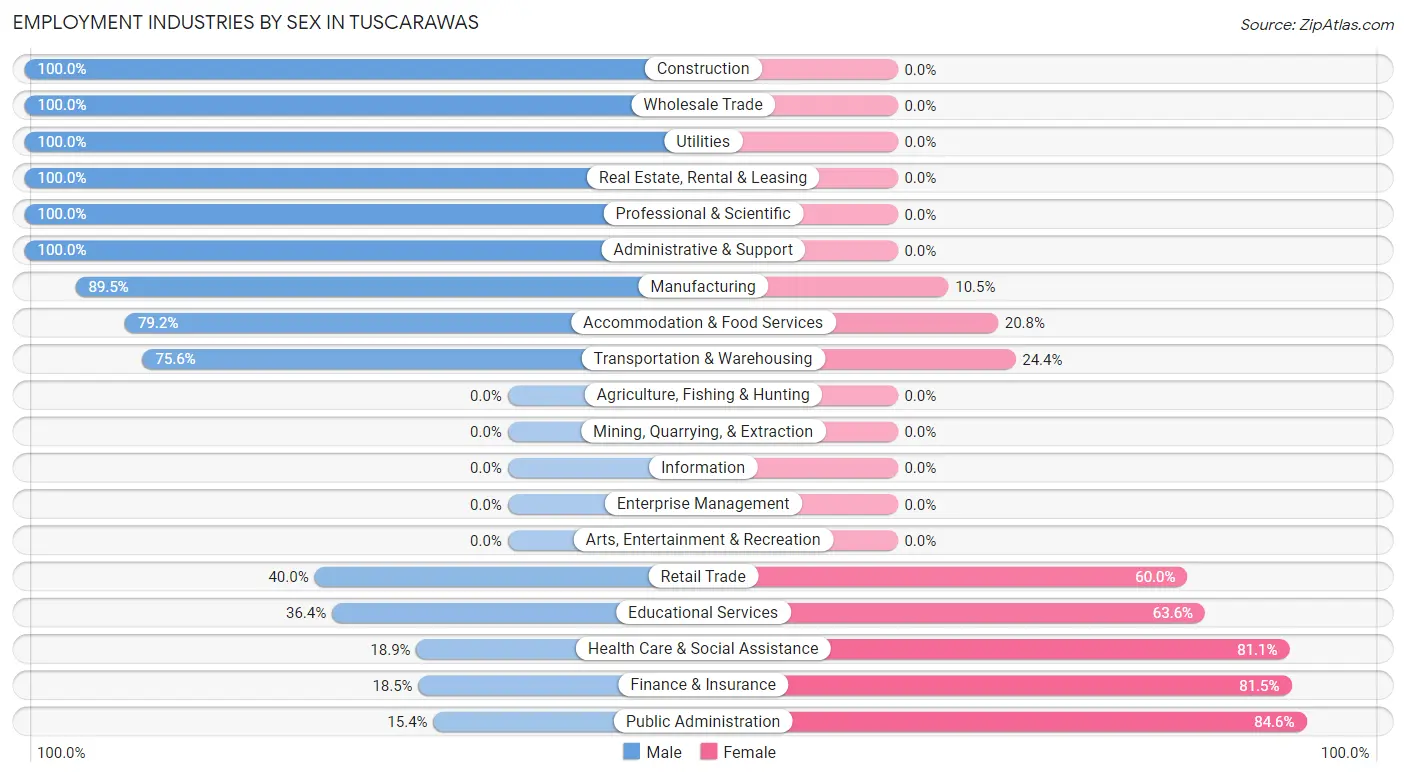
Employment Industries by Sex in Tuscarawas
The Tuscarawas industries that see more men than women are Construction (100.0%), Wholesale Trade (100.0%), and Utilities (100.0%), whereas the industries that tend to have a higher number of women are Public Administration (84.6%), Finance & Insurance (81.5%), and Health Care & Social Assistance (81.1%).
| Industry | Male | Female |
| Agriculture, Fishing & Hunting | 0 (0.0%) | 0 (0.0%) |
| Mining, Quarrying, & Extraction | 0 (0.0%) | 0 (0.0%) |
| Construction | 37 (100.0%) | 0 (0.0%) |
| Manufacturing | 102 (89.5%) | 12 (10.5%) |
| Wholesale Trade | 2 (100.0%) | 0 (0.0%) |
| Retail Trade | 26 (40.0%) | 39 (60.0%) |
| Transportation & Warehousing | 31 (75.6%) | 10 (24.4%) |
| Utilities | 1 (100.0%) | 0 (0.0%) |
| Information | 0 (0.0%) | 0 (0.0%) |
| Finance & Insurance | 17 (18.5%) | 75 (81.5%) |
| Real Estate, Rental & Leasing | 4 (100.0%) | 0 (0.0%) |
| Professional & Scientific | 1 (100.0%) | 0 (0.0%) |
| Enterprise Management | 0 (0.0%) | 0 (0.0%) |
| Administrative & Support | 26 (100.0%) | 0 (0.0%) |
| Educational Services | 20 (36.4%) | 35 (63.6%) |
| Health Care & Social Assistance | 24 (18.9%) | 103 (81.1%) |
| Arts, Entertainment & Recreation | 0 (0.0%) | 0 (0.0%) |
| Accommodation & Food Services | 61 (79.2%) | 16 (20.8%) |
| Public Administration | 2 (15.4%) | 11 (84.6%) |
| Total | 356 (54.2%) | 301 (45.8%) |
Education in Tuscarawas
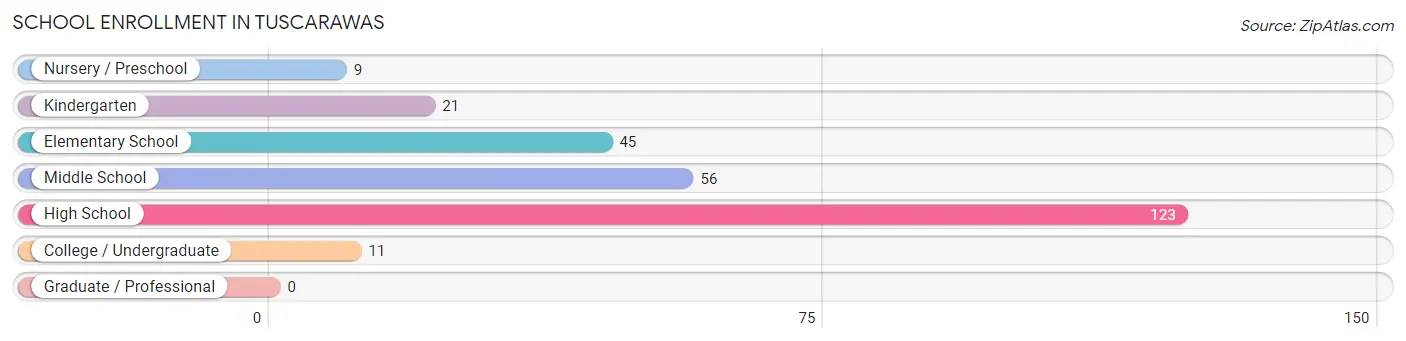
School Enrollment in Tuscarawas
The most common levels of schooling among the 265 students in Tuscarawas are high school (123 | 46.4%), middle school (56 | 21.1%), and elementary school (45 | 17.0%).
| School Level | # Students | % Students |
| Nursery / Preschool | 9 | 3.4% |
| Kindergarten | 21 | 7.9% |
| Elementary School | 45 | 17.0% |
| Middle School | 56 | 21.1% |
| High School | 123 | 46.4% |
| College / Undergraduate | 11 | 4.2% |
| Graduate / Professional | 0 | 0.0% |
| Total | 265 | 100.0% |
School Enrollment by Age by Funding Source in Tuscarawas
Out of a total of 265 students who are enrolled in schools in Tuscarawas, 10 (3.8%) attend a private institution, while the remaining 255 (96.2%) are enrolled in public schools. The age group of 3 to 4 year olds has the highest likelihood of being enrolled in private schools, with 4 (44.4% in the age bracket) enrolled. Conversely, the age group of 10 to 14 year olds has the lowest likelihood of being enrolled in a private school, with 64 (100.0% in the age bracket) attending a public institution.
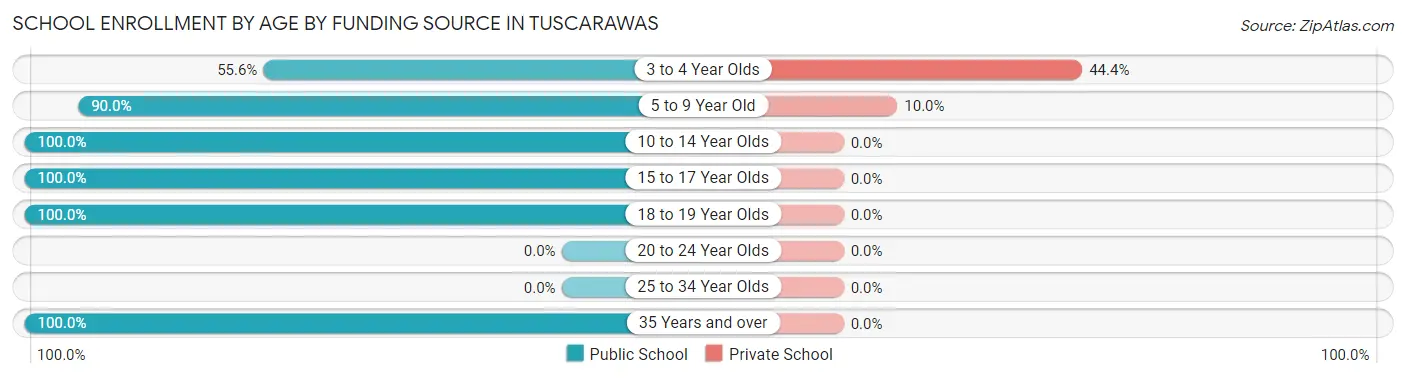
| Age Bracket | Public School | Private School |
| 3 to 4 Year Olds | 5 (55.6%) | 4 (44.4%) |
| 5 to 9 Year Old | 54 (90.0%) | 6 (10.0%) |
| 10 to 14 Year Olds | 64 (100.0%) | 0 (0.0%) |
| 15 to 17 Year Olds | 111 (100.0%) | 0 (0.0%) |
| 18 to 19 Year Olds | 18 (100.0%) | 0 (0.0%) |
| 20 to 24 Year Olds | 0 (0.0%) | 0 (0.0%) |
| 25 to 34 Year Olds | 0 (0.0%) | 0 (0.0%) |
| 35 Years and over | 3 (100.0%) | 0 (0.0%) |
| Total | 255 (96.2%) | 10 (3.8%) |
Educational Attainment by Field of Study in Tuscarawas
Science & technology (57 | 42.5%), education (46 | 34.3%), business (13 | 9.7%), computers & mathematics (8 | 6.0%), and engineering (6 | 4.5%) are the most common fields of study among 134 individuals in Tuscarawas who have obtained a bachelor's degree or higher.
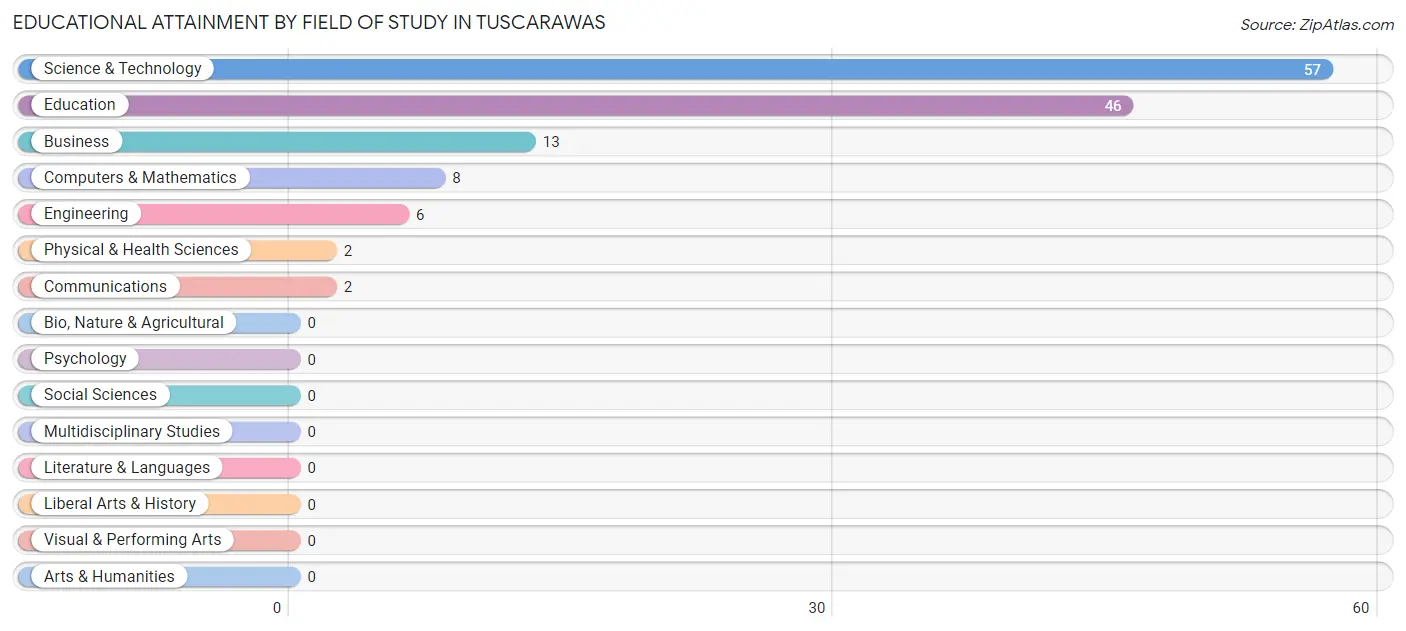
| Field of Study | # Graduates | % Graduates |
| Computers & Mathematics | 8 | 6.0% |
| Bio, Nature & Agricultural | 0 | 0.0% |
| Physical & Health Sciences | 2 | 1.5% |
| Psychology | 0 | 0.0% |
| Social Sciences | 0 | 0.0% |
| Engineering | 6 | 4.5% |
| Multidisciplinary Studies | 0 | 0.0% |
| Science & Technology | 57 | 42.5% |
| Business | 13 | 9.7% |
| Education | 46 | 34.3% |
| Literature & Languages | 0 | 0.0% |
| Liberal Arts & History | 0 | 0.0% |
| Visual & Performing Arts | 0 | 0.0% |
| Communications | 2 | 1.5% |
| Arts & Humanities | 0 | 0.0% |
| Total | 134 | 100.0% |
Transportation & Commute in Tuscarawas
Vehicle Availability by Sex in Tuscarawas
The most prevalent vehicle ownership categories in Tuscarawas are males with 2 vehicles (212, accounting for 62.5%) and females with 2 vehicles (191, making up 71.9%).
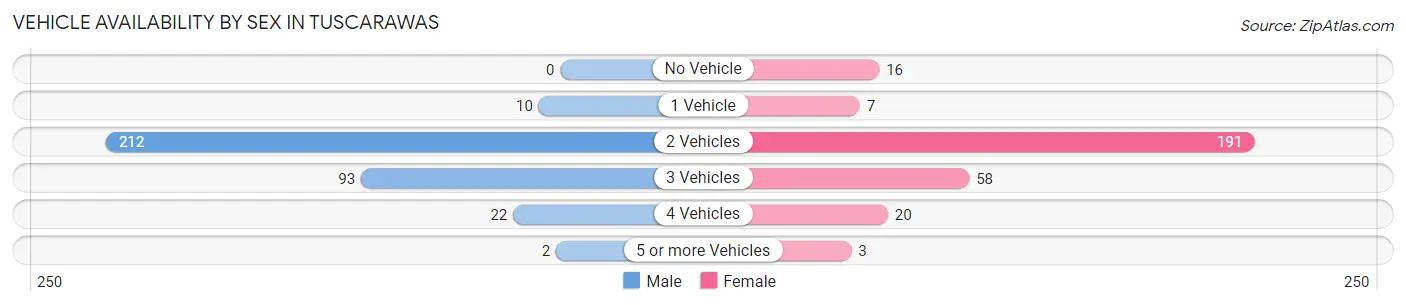
| Vehicles Available | Male | Female |
| No Vehicle | 0 (0.0%) | 16 (5.4%) |
| 1 Vehicle | 10 (2.9%) | 7 (2.4%) |
| 2 Vehicles | 212 (62.5%) | 191 (64.7%) |
| 3 Vehicles | 93 (27.4%) | 58 (19.7%) |
| 4 Vehicles | 22 (6.5%) | 20 (6.8%) |
| 5 or more Vehicles | 2 (0.6%) | 3 (1.0%) |
| Total | 339 (100.0%) | 295 (100.0%) |
Commute Time in Tuscarawas
The most frequently occuring commute durations in Tuscarawas are 15 to 19 minutes (198 commuters, 32.8%), 20 to 24 minutes (86 commuters, 14.2%), and 10 to 14 minutes (85 commuters, 14.1%).
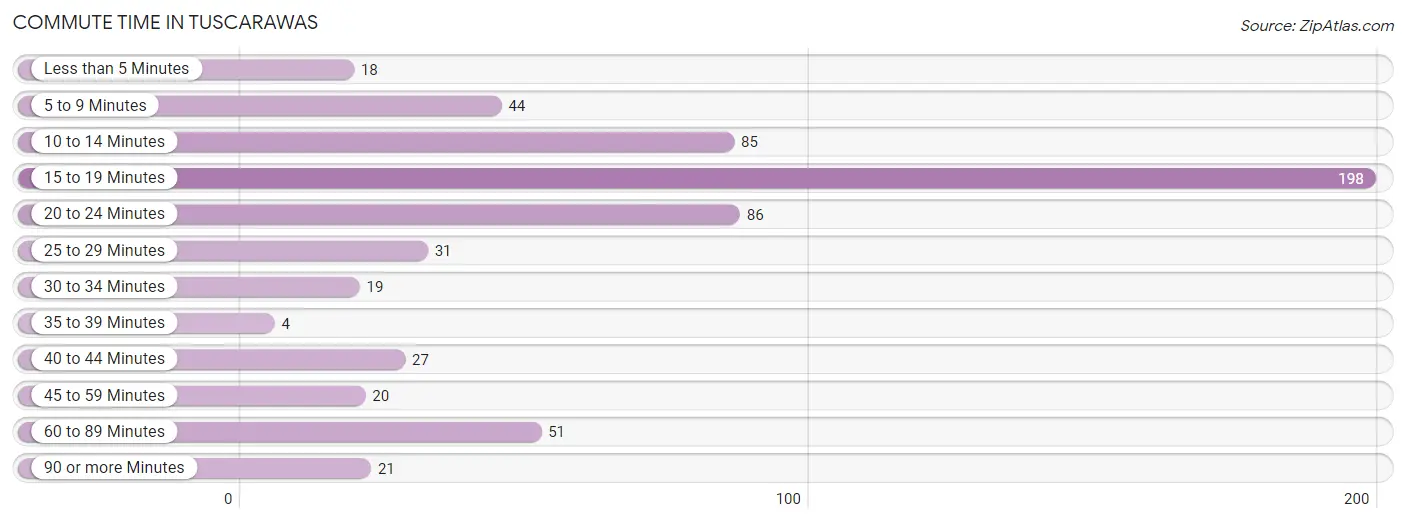
| Commute Time | # Commuters | % Commuters |
| Less than 5 Minutes | 18 | 3.0% |
| 5 to 9 Minutes | 44 | 7.3% |
| 10 to 14 Minutes | 85 | 14.1% |
| 15 to 19 Minutes | 198 | 32.8% |
| 20 to 24 Minutes | 86 | 14.2% |
| 25 to 29 Minutes | 31 | 5.1% |
| 30 to 34 Minutes | 19 | 3.2% |
| 35 to 39 Minutes | 4 | 0.7% |
| 40 to 44 Minutes | 27 | 4.5% |
| 45 to 59 Minutes | 20 | 3.3% |
| 60 to 89 Minutes | 51 | 8.4% |
| 90 or more Minutes | 21 | 3.5% |
Commute Time by Sex in Tuscarawas
The most common commute times in Tuscarawas are 15 to 19 minutes (129 commuters, 38.7%) for males and 20 to 24 minutes (70 commuters, 25.8%) for females.
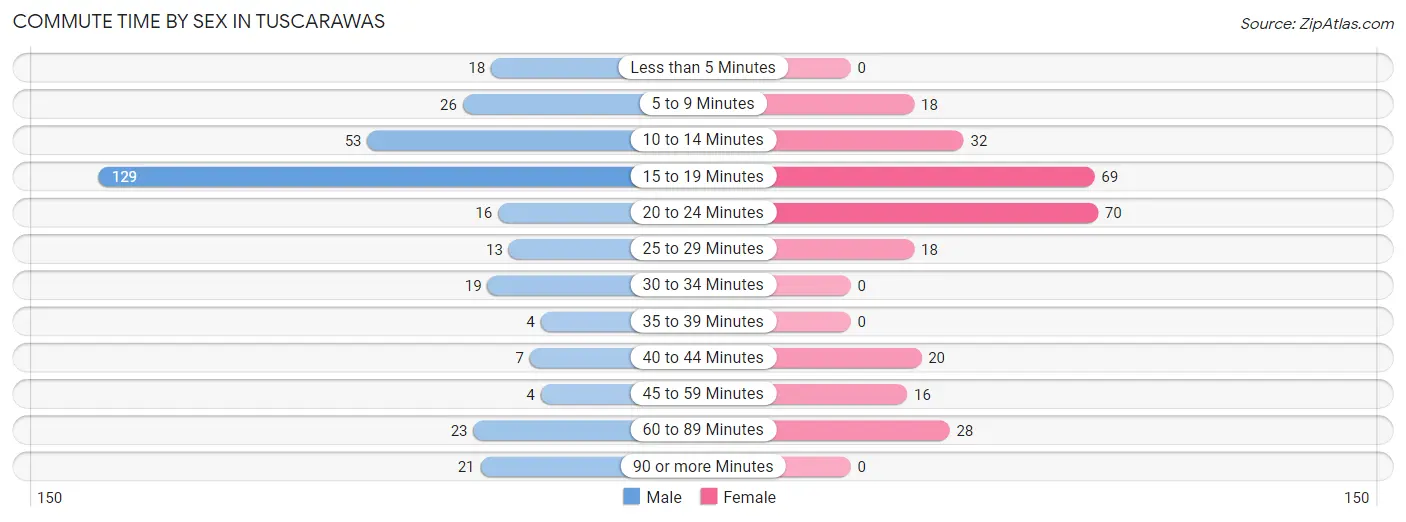
| Commute Time | Male | Female |
| Less than 5 Minutes | 18 (5.4%) | 0 (0.0%) |
| 5 to 9 Minutes | 26 (7.8%) | 18 (6.6%) |
| 10 to 14 Minutes | 53 (15.9%) | 32 (11.8%) |
| 15 to 19 Minutes | 129 (38.7%) | 69 (25.5%) |
| 20 to 24 Minutes | 16 (4.8%) | 70 (25.8%) |
| 25 to 29 Minutes | 13 (3.9%) | 18 (6.6%) |
| 30 to 34 Minutes | 19 (5.7%) | 0 (0.0%) |
| 35 to 39 Minutes | 4 (1.2%) | 0 (0.0%) |
| 40 to 44 Minutes | 7 (2.1%) | 20 (7.4%) |
| 45 to 59 Minutes | 4 (1.2%) | 16 (5.9%) |
| 60 to 89 Minutes | 23 (6.9%) | 28 (10.3%) |
| 90 or more Minutes | 21 (6.3%) | 0 (0.0%) |
Time of Departure to Work by Sex in Tuscarawas
The most frequent times of departure to work in Tuscarawas are 7:30 AM to 7:59 AM (83, 24.9%) for males and 7:00 AM to 7:29 AM (88, 32.5%) for females.
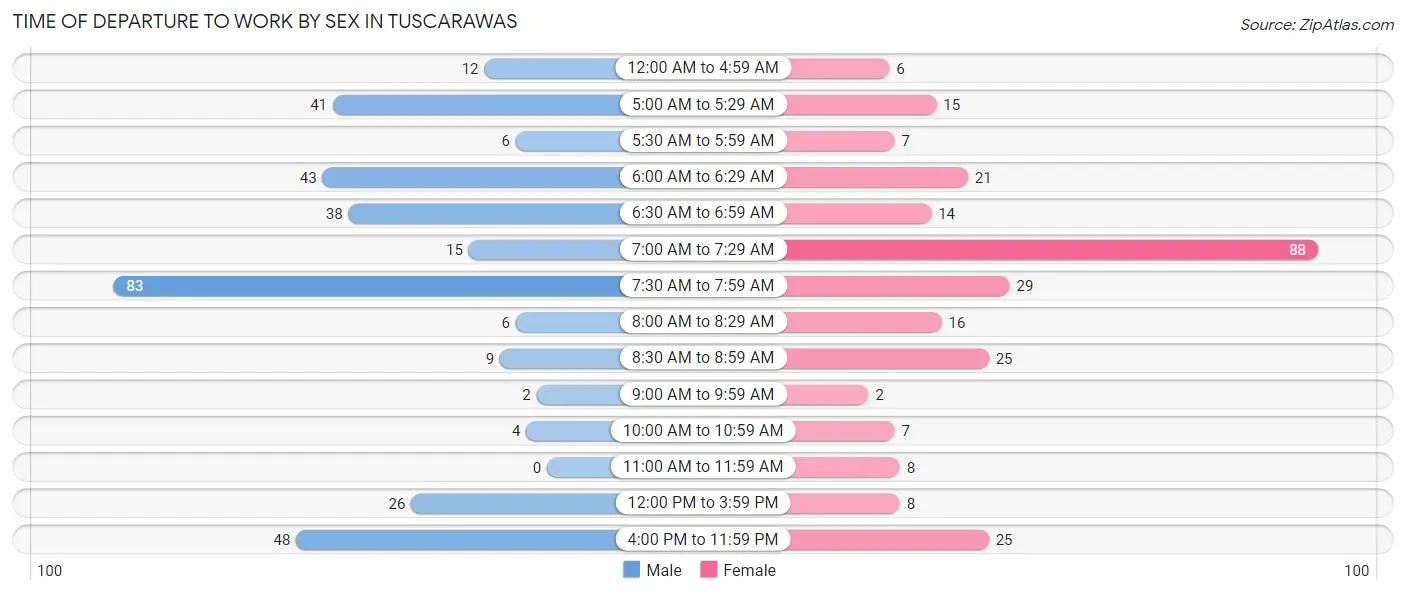
| Time of Departure | Male | Female |
| 12:00 AM to 4:59 AM | 12 (3.6%) | 6 (2.2%) |
| 5:00 AM to 5:29 AM | 41 (12.3%) | 15 (5.5%) |
| 5:30 AM to 5:59 AM | 6 (1.8%) | 7 (2.6%) |
| 6:00 AM to 6:29 AM | 43 (12.9%) | 21 (7.7%) |
| 6:30 AM to 6:59 AM | 38 (11.4%) | 14 (5.2%) |
| 7:00 AM to 7:29 AM | 15 (4.5%) | 88 (32.5%) |
| 7:30 AM to 7:59 AM | 83 (24.9%) | 29 (10.7%) |
| 8:00 AM to 8:29 AM | 6 (1.8%) | 16 (5.9%) |
| 8:30 AM to 8:59 AM | 9 (2.7%) | 25 (9.2%) |
| 9:00 AM to 9:59 AM | 2 (0.6%) | 2 (0.7%) |
| 10:00 AM to 10:59 AM | 4 (1.2%) | 7 (2.6%) |
| 11:00 AM to 11:59 AM | 0 (0.0%) | 8 (2.9%) |
| 12:00 PM to 3:59 PM | 26 (7.8%) | 8 (2.9%) |
| 4:00 PM to 11:59 PM | 48 (14.4%) | 25 (9.2%) |
| Total | 333 (100.0%) | 271 (100.0%) |
Housing Occupancy in Tuscarawas
Occupancy by Ownership in Tuscarawas
Of the total 487 dwellings in Tuscarawas, owner-occupied units account for 352 (72.3%), while renter-occupied units make up 135 (27.7%).
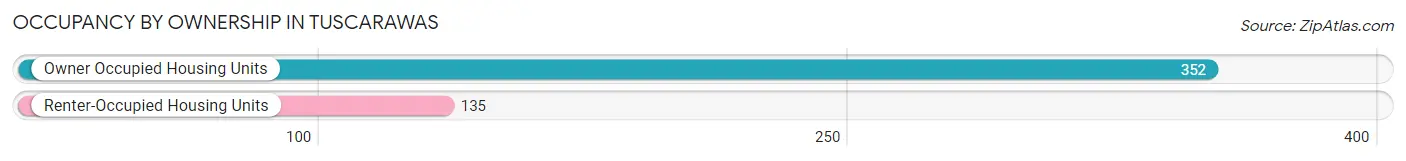
| Occupancy | # Housing Units | % Housing Units |
| Owner Occupied Housing Units | 352 | 72.3% |
| Renter-Occupied Housing Units | 135 | 27.7% |
| Total Occupied Housing Units | 487 | 100.0% |
Occupancy by Household Size in Tuscarawas
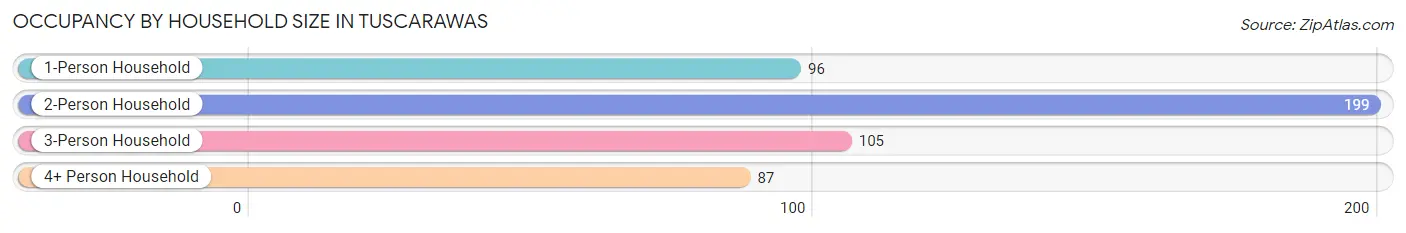
| Household Size | # Housing Units | % Housing Units |
| 1-Person Household | 96 | 19.7% |
| 2-Person Household | 199 | 40.9% |
| 3-Person Household | 105 | 21.6% |
| 4+ Person Household | 87 | 17.9% |
| Total Housing Units | 487 | 100.0% |
Occupancy by Ownership by Household Size in Tuscarawas
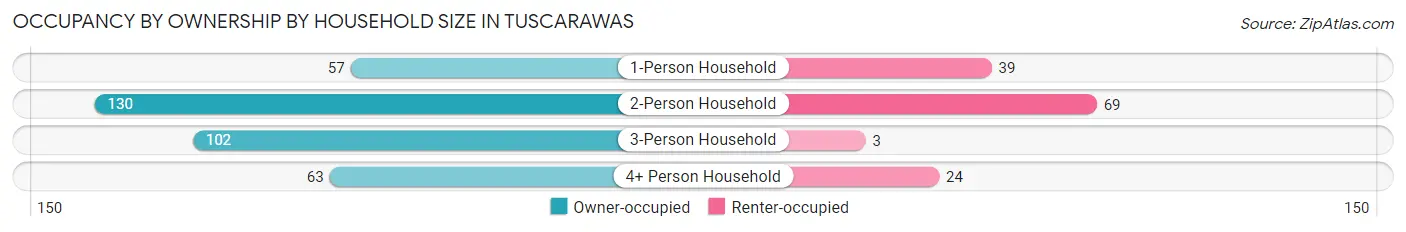
| Household Size | Owner-occupied | Renter-occupied |
| 1-Person Household | 57 (59.4%) | 39 (40.6%) |
| 2-Person Household | 130 (65.3%) | 69 (34.7%) |
| 3-Person Household | 102 (97.1%) | 3 (2.9%) |
| 4+ Person Household | 63 (72.4%) | 24 (27.6%) |
| Total Housing Units | 352 (72.3%) | 135 (27.7%) |
Occupancy by Educational Attainment in Tuscarawas
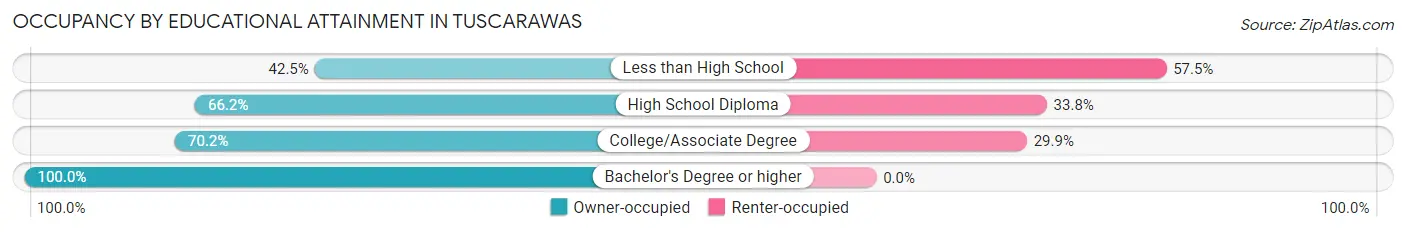
| Household Size | Owner-occupied | Renter-occupied |
| Less than High School | 17 (42.5%) | 23 (57.5%) |
| High School Diploma | 141 (66.2%) | 72 (33.8%) |
| College/Associate Degree | 94 (70.2%) | 40 (29.8%) |
| Bachelor's Degree or higher | 100 (100.0%) | 0 (0.0%) |
Occupancy by Age of Householder in Tuscarawas
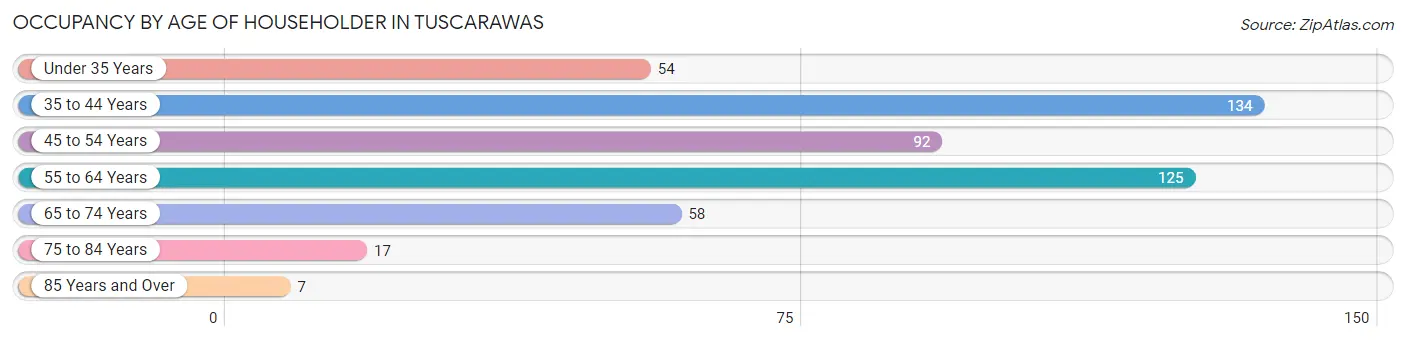
| Age Bracket | # Households | % Households |
| Under 35 Years | 54 | 11.1% |
| 35 to 44 Years | 134 | 27.5% |
| 45 to 54 Years | 92 | 18.9% |
| 55 to 64 Years | 125 | 25.7% |
| 65 to 74 Years | 58 | 11.9% |
| 75 to 84 Years | 17 | 3.5% |
| 85 Years and Over | 7 | 1.4% |
| Total | 487 | 100.0% |
Housing Finances in Tuscarawas
Median Income by Occupancy in Tuscarawas
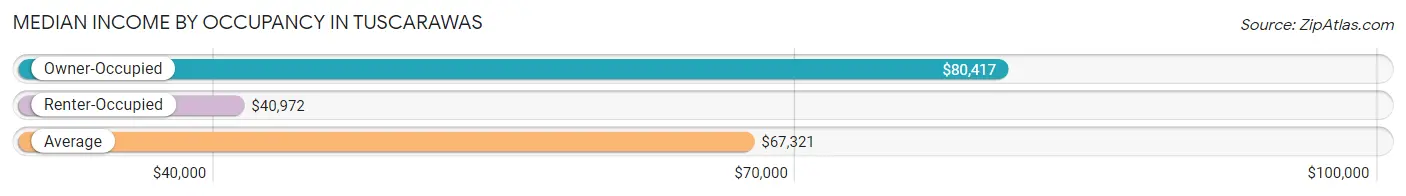
| Occupancy Type | # Households | Median Income |
| Owner-Occupied | 352 (72.3%) | $80,417 |
| Renter-Occupied | 135 (27.7%) | $40,972 |
| Average | 487 (100.0%) | $67,321 |
Occupancy by Householder Income Bracket in Tuscarawas
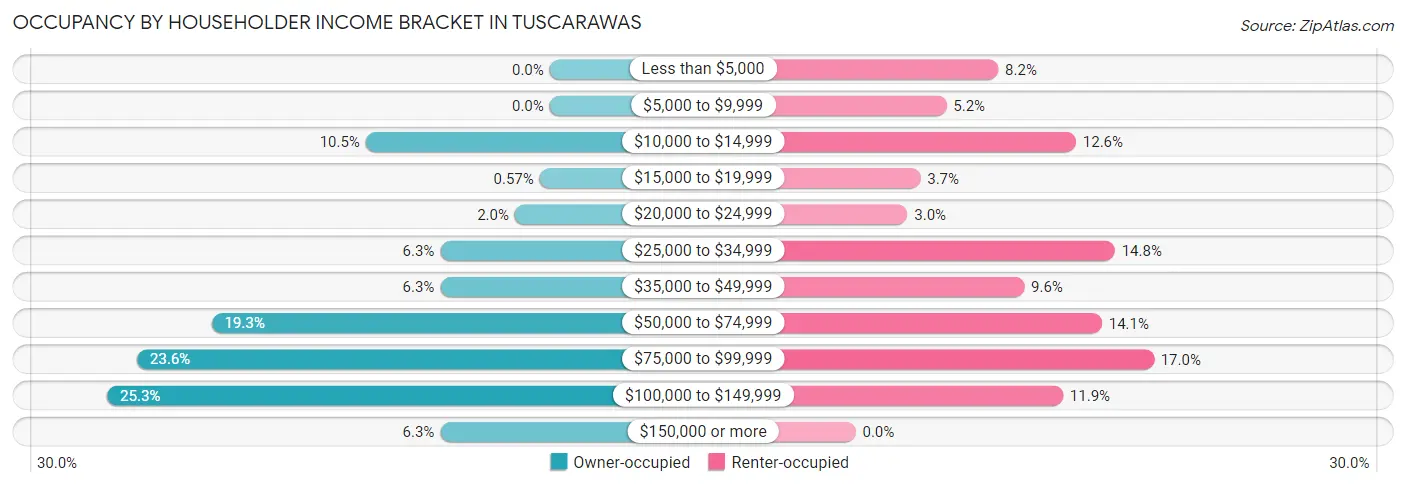
| Income Bracket | Owner-occupied | Renter-occupied |
| Less than $5,000 | 0 (0.0%) | 11 (8.2%) |
| $5,000 to $9,999 | 0 (0.0%) | 7 (5.2%) |
| $10,000 to $14,999 | 37 (10.5%) | 17 (12.6%) |
| $15,000 to $19,999 | 2 (0.6%) | 5 (3.7%) |
| $20,000 to $24,999 | 7 (2.0%) | 4 (3.0%) |
| $25,000 to $34,999 | 22 (6.2%) | 20 (14.8%) |
| $35,000 to $49,999 | 22 (6.2%) | 13 (9.6%) |
| $50,000 to $74,999 | 68 (19.3%) | 19 (14.1%) |
| $75,000 to $99,999 | 83 (23.6%) | 23 (17.0%) |
| $100,000 to $149,999 | 89 (25.3%) | 16 (11.8%) |
| $150,000 or more | 22 (6.2%) | 0 (0.0%) |
| Total | 352 (100.0%) | 135 (100.0%) |
Monthly Housing Cost Tiers in Tuscarawas
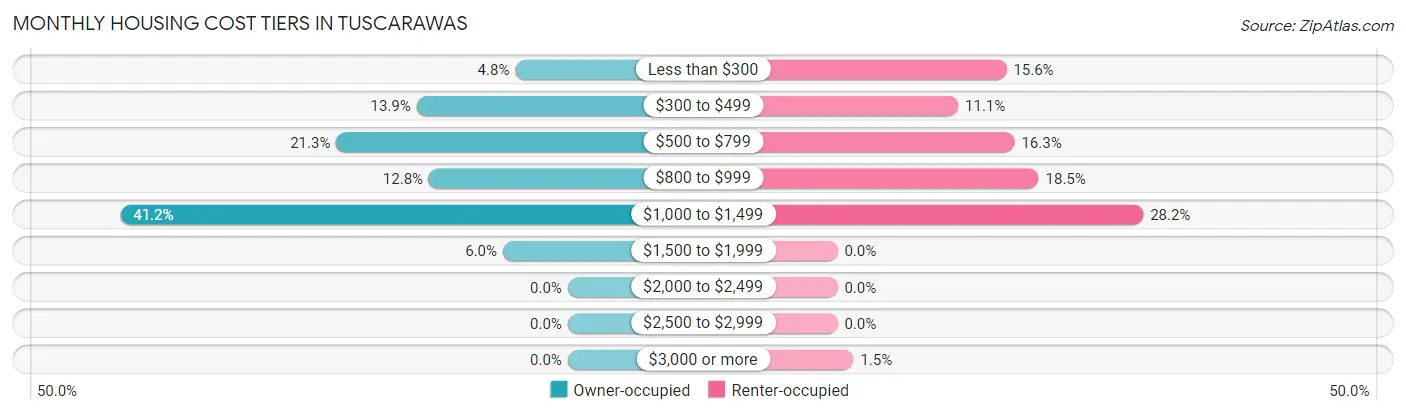
| Monthly Cost | Owner-occupied | Renter-occupied |
| Less than $300 | 17 (4.8%) | 21 (15.6%) |
| $300 to $499 | 49 (13.9%) | 15 (11.1%) |
| $500 to $799 | 75 (21.3%) | 22 (16.3%) |
| $800 to $999 | 45 (12.8%) | 25 (18.5%) |
| $1,000 to $1,499 | 145 (41.2%) | 38 (28.1%) |
| $1,500 to $1,999 | 21 (6.0%) | 0 (0.0%) |
| $2,000 to $2,499 | 0 (0.0%) | 0 (0.0%) |
| $2,500 to $2,999 | 0 (0.0%) | 0 (0.0%) |
| $3,000 or more | 0 (0.0%) | 2 (1.5%) |
| Total | 352 (100.0%) | 135 (100.0%) |
Physical Housing Characteristics in Tuscarawas
Housing Structures in Tuscarawas
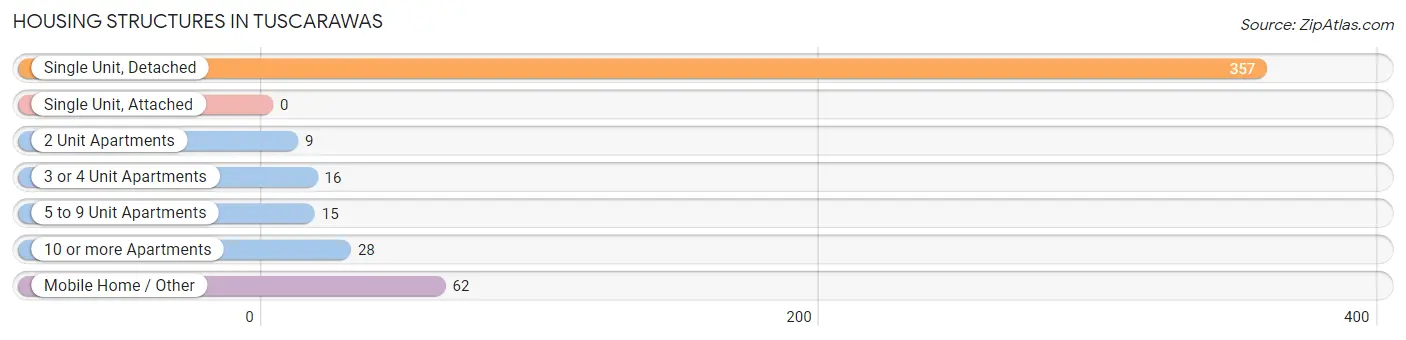
| Structure Type | # Housing Units | % Housing Units |
| Single Unit, Detached | 357 | 73.3% |
| Single Unit, Attached | 0 | 0.0% |
| 2 Unit Apartments | 9 | 1.8% |
| 3 or 4 Unit Apartments | 16 | 3.3% |
| 5 to 9 Unit Apartments | 15 | 3.1% |
| 10 or more Apartments | 28 | 5.8% |
| Mobile Home / Other | 62 | 12.7% |
| Total | 487 | 100.0% |
Housing Structures by Occupancy in Tuscarawas
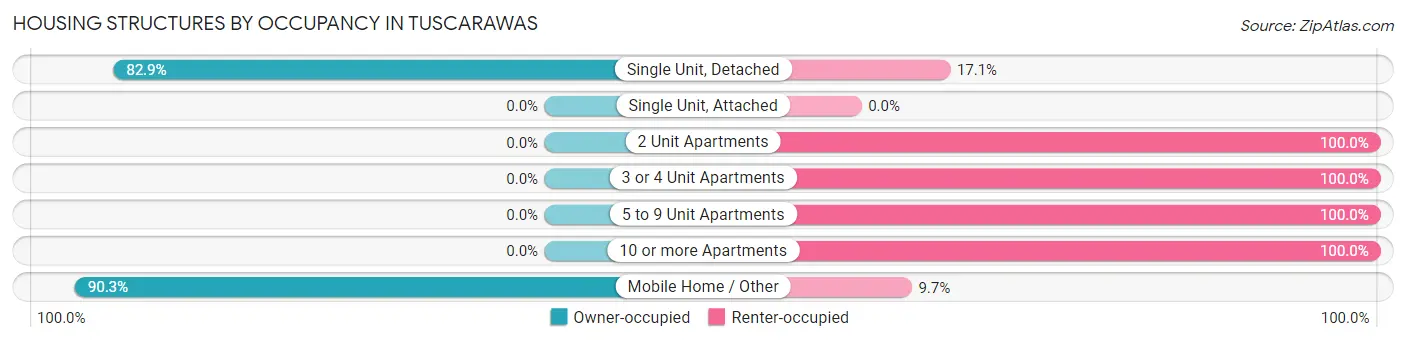
| Structure Type | Owner-occupied | Renter-occupied |
| Single Unit, Detached | 296 (82.9%) | 61 (17.1%) |
| Single Unit, Attached | 0 (0.0%) | 0 (0.0%) |
| 2 Unit Apartments | 0 (0.0%) | 9 (100.0%) |
| 3 or 4 Unit Apartments | 0 (0.0%) | 16 (100.0%) |
| 5 to 9 Unit Apartments | 0 (0.0%) | 15 (100.0%) |
| 10 or more Apartments | 0 (0.0%) | 28 (100.0%) |
| Mobile Home / Other | 56 (90.3%) | 6 (9.7%) |
| Total | 352 (72.3%) | 135 (27.7%) |
Housing Structures by Number of Rooms in Tuscarawas
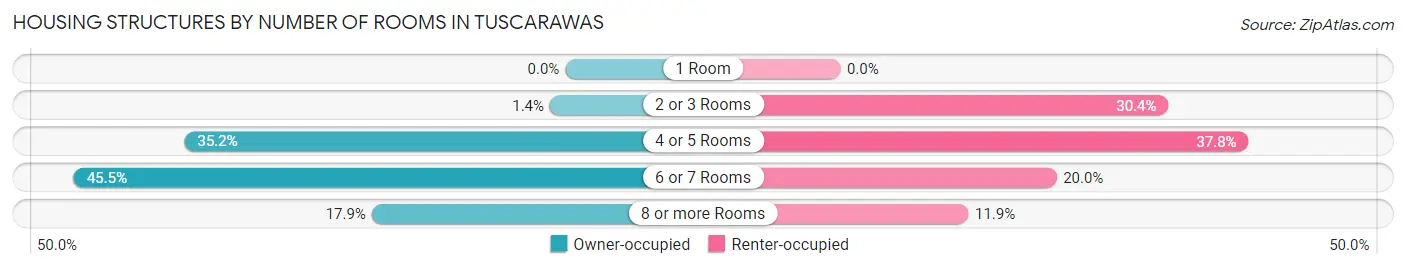
| Number of Rooms | Owner-occupied | Renter-occupied |
| 1 Room | 0 (0.0%) | 0 (0.0%) |
| 2 or 3 Rooms | 5 (1.4%) | 41 (30.4%) |
| 4 or 5 Rooms | 124 (35.2%) | 51 (37.8%) |
| 6 or 7 Rooms | 160 (45.5%) | 27 (20.0%) |
| 8 or more Rooms | 63 (17.9%) | 16 (11.8%) |
| Total | 352 (100.0%) | 135 (100.0%) |
Housing Structure by Heating Type in Tuscarawas
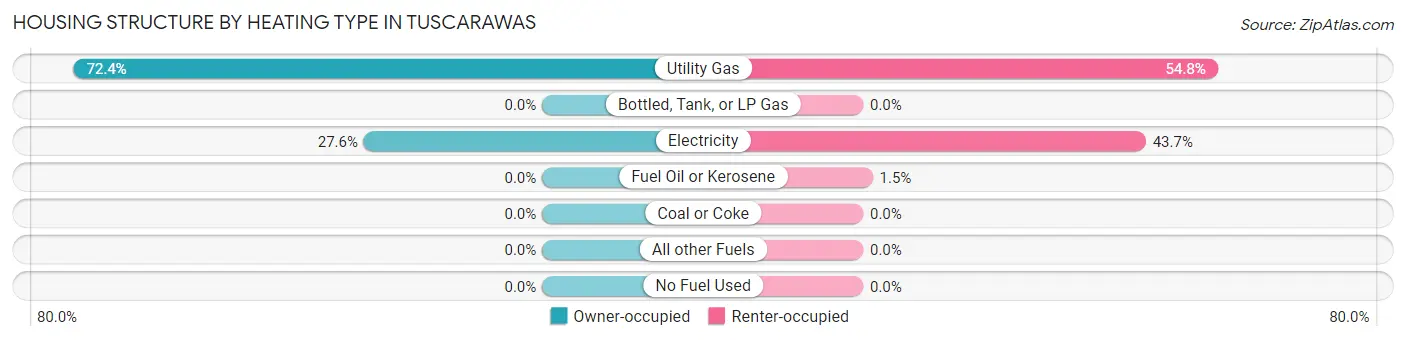
| Heating Type | Owner-occupied | Renter-occupied |
| Utility Gas | 255 (72.4%) | 74 (54.8%) |
| Bottled, Tank, or LP Gas | 0 (0.0%) | 0 (0.0%) |
| Electricity | 97 (27.6%) | 59 (43.7%) |
| Fuel Oil or Kerosene | 0 (0.0%) | 2 (1.5%) |
| Coal or Coke | 0 (0.0%) | 0 (0.0%) |
| All other Fuels | 0 (0.0%) | 0 (0.0%) |
| No Fuel Used | 0 (0.0%) | 0 (0.0%) |
| Total | 352 (100.0%) | 135 (100.0%) |
Household Vehicle Usage in Tuscarawas
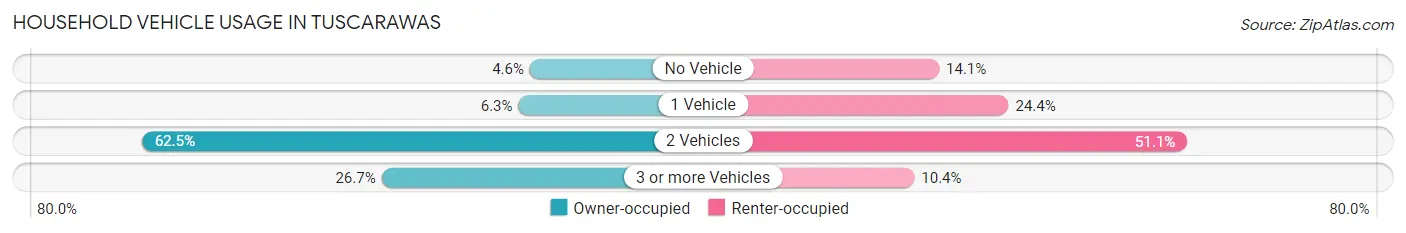
| Vehicles per Household | Owner-occupied | Renter-occupied |
| No Vehicle | 16 (4.5%) | 19 (14.1%) |
| 1 Vehicle | 22 (6.2%) | 33 (24.4%) |
| 2 Vehicles | 220 (62.5%) | 69 (51.1%) |
| 3 or more Vehicles | 94 (26.7%) | 14 (10.4%) |
| Total | 352 (100.0%) | 135 (100.0%) |
Real Estate & Mortgages in Tuscarawas
Real Estate and Mortgage Overview in Tuscarawas
| Characteristic | Without Mortgage | With Mortgage |
| Housing Units | 121 | 231 |
| Median Property Value | - | - |
| Median Household Income | $63,125 | $8 |
| Monthly Housing Costs | $474 | $0 |
| Real Estate Taxes | - | - |
Property Value by Mortgage Status in Tuscarawas
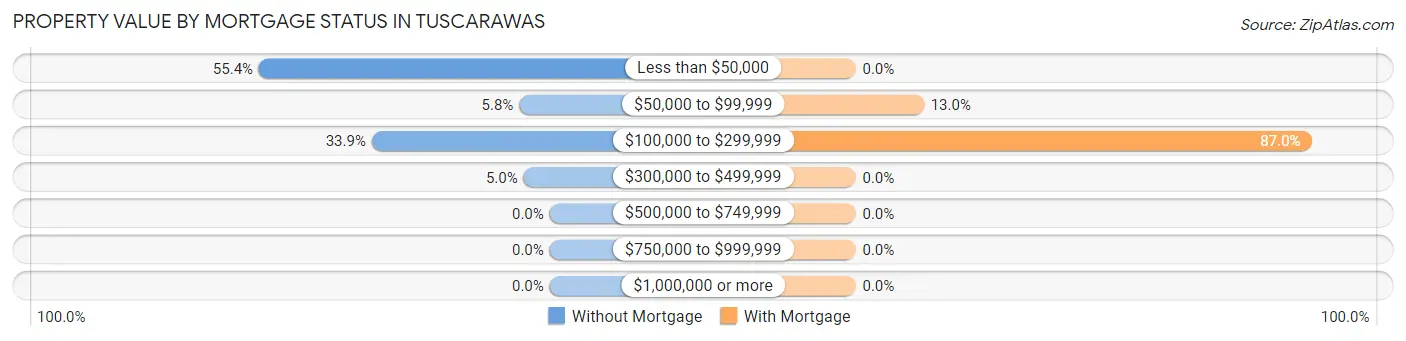
| Property Value | Without Mortgage | With Mortgage |
| Less than $50,000 | 67 (55.4%) | 0 (0.0%) |
| $50,000 to $99,999 | 7 (5.8%) | 30 (13.0%) |
| $100,000 to $299,999 | 41 (33.9%) | 201 (87.0%) |
| $300,000 to $499,999 | 6 (5.0%) | 0 (0.0%) |
| $500,000 to $749,999 | 0 (0.0%) | 0 (0.0%) |
| $750,000 to $999,999 | 0 (0.0%) | 0 (0.0%) |
| $1,000,000 or more | 0 (0.0%) | 0 (0.0%) |
| Total | 121 (100.0%) | 231 (100.0%) |
Household Income by Mortgage Status in Tuscarawas
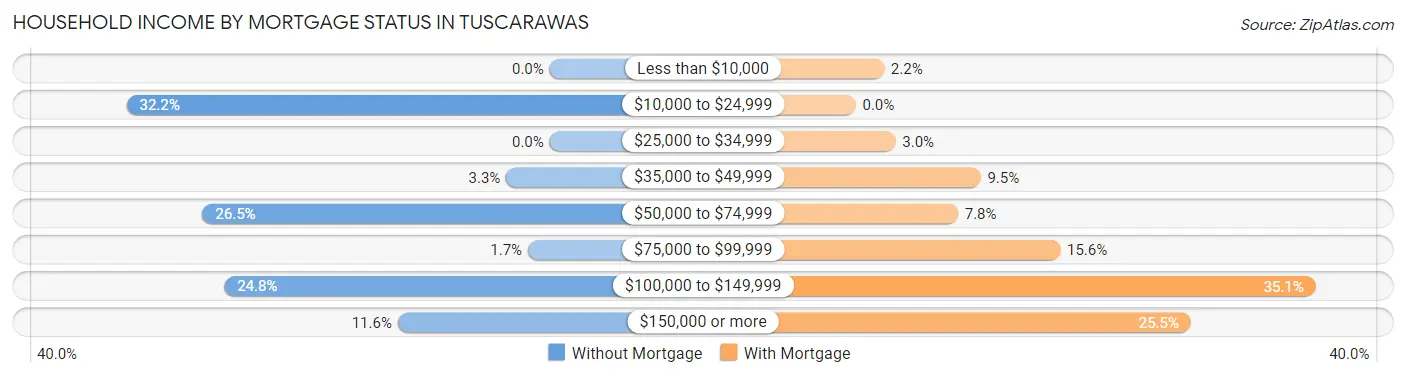
| Household Income | Without Mortgage | With Mortgage |
| Less than $10,000 | 0 (0.0%) | 5 (2.2%) |
| $10,000 to $24,999 | 39 (32.2%) | 0 (0.0%) |
| $25,000 to $34,999 | 0 (0.0%) | 7 (3.0%) |
| $35,000 to $49,999 | 4 (3.3%) | 22 (9.5%) |
| $50,000 to $74,999 | 32 (26.5%) | 18 (7.8%) |
| $75,000 to $99,999 | 2 (1.7%) | 36 (15.6%) |
| $100,000 to $149,999 | 30 (24.8%) | 81 (35.1%) |
| $150,000 or more | 14 (11.6%) | 59 (25.5%) |
| Total | 121 (100.0%) | 231 (100.0%) |
Property Value to Household Income Ratio in Tuscarawas
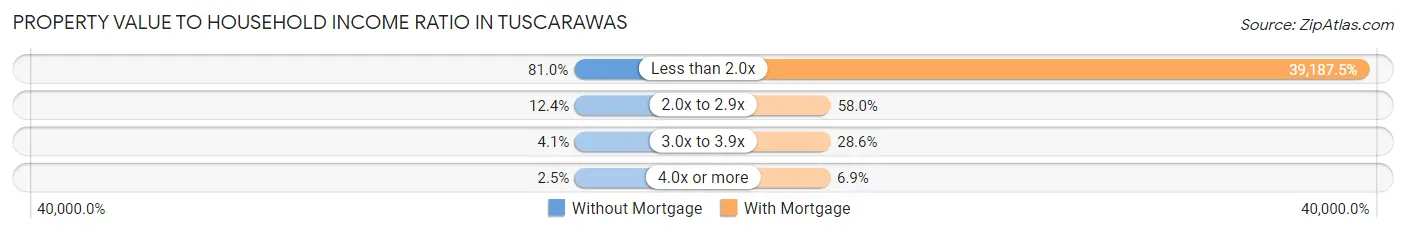
| Value-to-Income Ratio | Without Mortgage | With Mortgage |
| Less than 2.0x | 98 (81.0%) | 90,523 (39,187.5%) |
| 2.0x to 2.9x | 15 (12.4%) | 134 (58.0%) |
| 3.0x to 3.9x | 5 (4.1%) | 66 (28.6%) |
| 4.0x or more | 3 (2.5%) | 16 (6.9%) |
| Total | 121 (100.0%) | 231 (100.0%) |
Real Estate Taxes by Mortgage Status in Tuscarawas
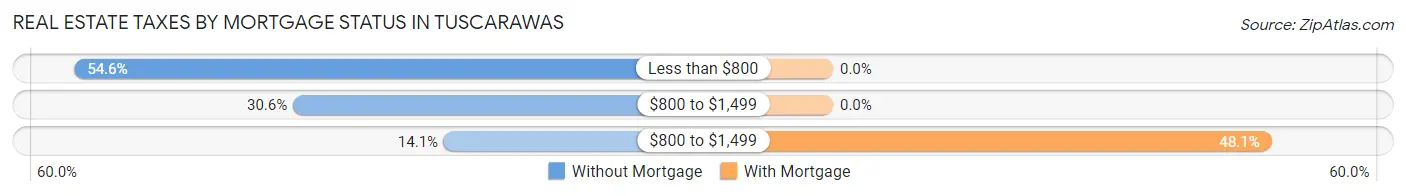
| Property Taxes | Without Mortgage | With Mortgage |
| Less than $800 | 66 (54.5%) | 0 (0.0%) |
| $800 to $1,499 | 37 (30.6%) | 0 (0.0%) |
| $800 to $1,499 | 17 (14.1%) | 111 (48.0%) |
| Total | 121 (100.0%) | 231 (100.0%) |
Health & Disability in Tuscarawas
Health Insurance Coverage by Age in Tuscarawas
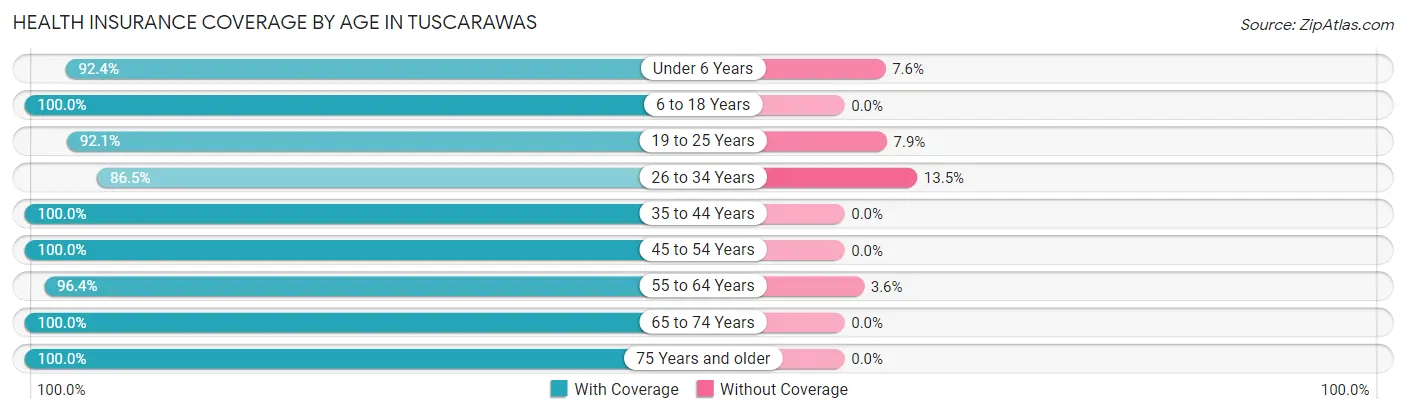
| Age Bracket | With Coverage | Without Coverage |
| Under 6 Years | 121 (92.4%) | 10 (7.6%) |
| 6 to 18 Years | 246 (100.0%) | 0 (0.0%) |
| 19 to 25 Years | 70 (92.1%) | 6 (7.9%) |
| 26 to 34 Years | 83 (86.5%) | 13 (13.5%) |
| 35 to 44 Years | 210 (100.0%) | 0 (0.0%) |
| 45 to 54 Years | 201 (100.0%) | 0 (0.0%) |
| 55 to 64 Years | 186 (96.4%) | 7 (3.6%) |
| 65 to 74 Years | 113 (100.0%) | 0 (0.0%) |
| 75 Years and older | 30 (100.0%) | 0 (0.0%) |
| Total | 1,260 (97.2%) | 36 (2.8%) |
Health Insurance Coverage by Citizenship Status in Tuscarawas
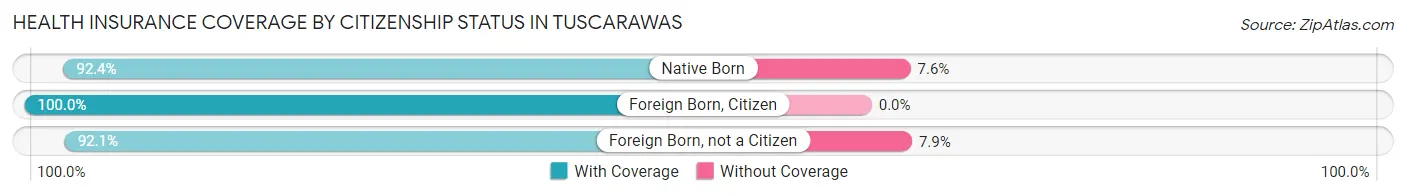
| Citizenship Status | With Coverage | Without Coverage |
| Native Born | 121 (92.4%) | 10 (7.6%) |
| Foreign Born, Citizen | 246 (100.0%) | 0 (0.0%) |
| Foreign Born, not a Citizen | 70 (92.1%) | 6 (7.9%) |
Health Insurance Coverage by Household Income in Tuscarawas
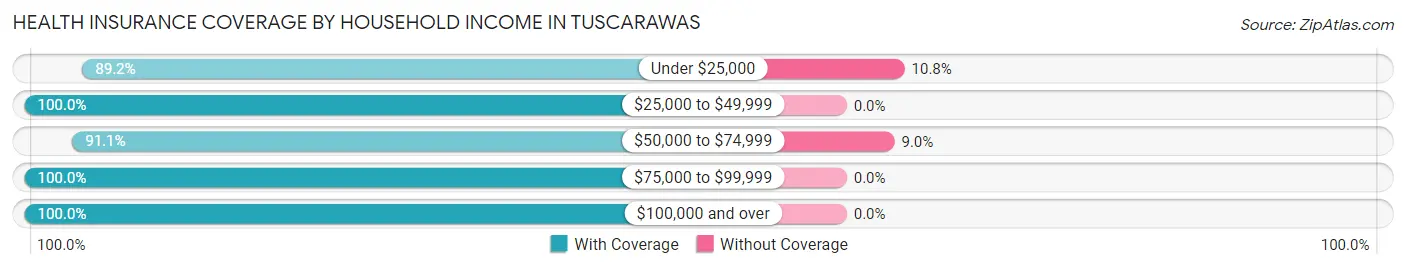
| Household Income | With Coverage | Without Coverage |
| Under $25,000 | 107 (89.2%) | 13 (10.8%) |
| $25,000 to $49,999 | 231 (100.0%) | 0 (0.0%) |
| $50,000 to $74,999 | 234 (91.0%) | 23 (8.9%) |
| $75,000 to $99,999 | 313 (100.0%) | 0 (0.0%) |
| $100,000 and over | 375 (100.0%) | 0 (0.0%) |
Public vs Private Health Insurance Coverage by Age in Tuscarawas
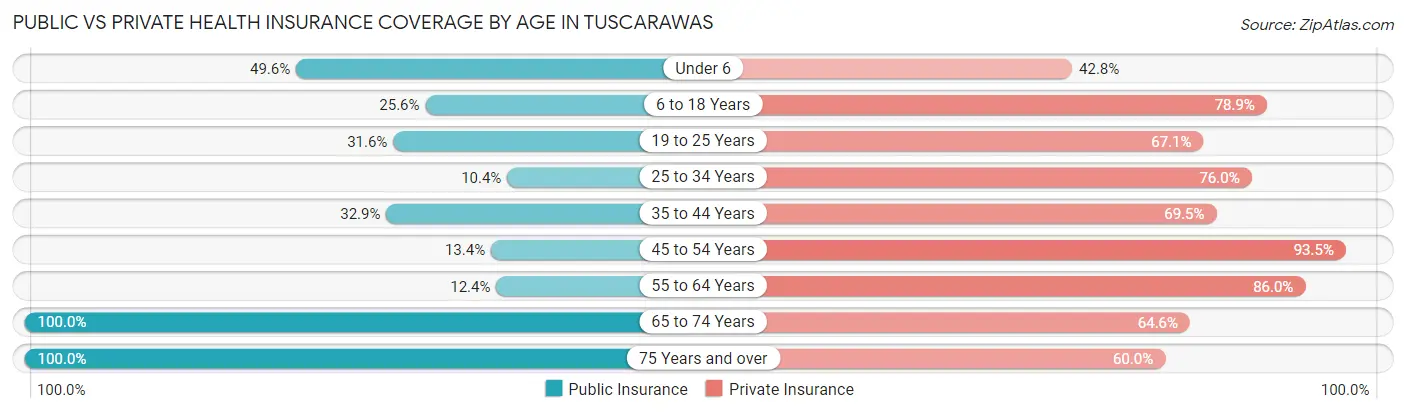
| Age Bracket | Public Insurance | Private Insurance |
| Under 6 | 65 (49.6%) | 56 (42.7%) |
| 6 to 18 Years | 63 (25.6%) | 194 (78.9%) |
| 19 to 25 Years | 24 (31.6%) | 51 (67.1%) |
| 25 to 34 Years | 10 (10.4%) | 73 (76.0%) |
| 35 to 44 Years | 69 (32.9%) | 146 (69.5%) |
| 45 to 54 Years | 27 (13.4%) | 188 (93.5%) |
| 55 to 64 Years | 24 (12.4%) | 166 (86.0%) |
| 65 to 74 Years | 113 (100.0%) | 73 (64.6%) |
| 75 Years and over | 30 (100.0%) | 18 (60.0%) |
| Total | 425 (32.8%) | 965 (74.5%) |
Disability Status by Sex by Age in Tuscarawas
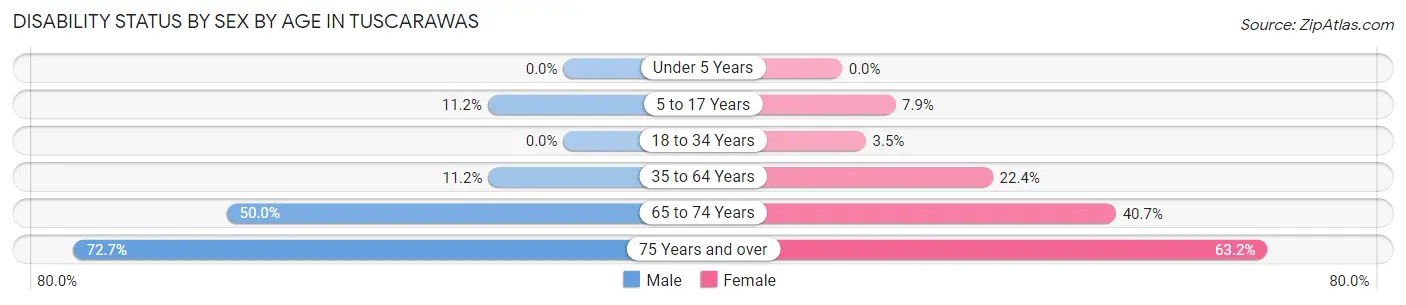
| Age Bracket | Male | Female |
| Under 5 Years | 0 (0.0%) | 0 (0.0%) |
| 5 to 17 Years | 11 (11.2%) | 11 (7.9%) |
| 18 to 34 Years | 0 (0.0%) | 3 (3.5%) |
| 35 to 64 Years | 32 (11.2%) | 71 (22.4%) |
| 65 to 74 Years | 27 (50.0%) | 24 (40.7%) |
| 75 Years and over | 8 (72.7%) | 12 (63.2%) |
Disability Class by Sex by Age in Tuscarawas
Disability Class: Hearing Difficulty
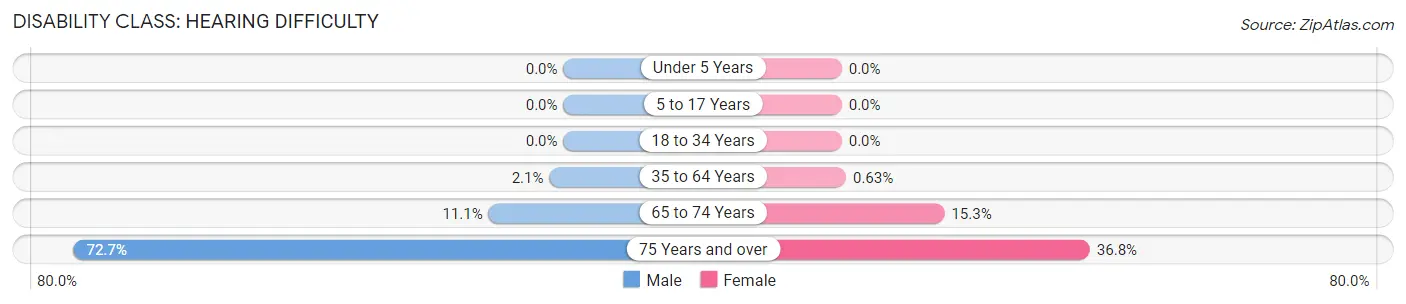
| Age Bracket | Male | Female |
| Under 5 Years | 0 (0.0%) | 0 (0.0%) |
| 5 to 17 Years | 0 (0.0%) | 0 (0.0%) |
| 18 to 34 Years | 0 (0.0%) | 0 (0.0%) |
| 35 to 64 Years | 6 (2.1%) | 2 (0.6%) |
| 65 to 74 Years | 6 (11.1%) | 9 (15.2%) |
| 75 Years and over | 8 (72.7%) | 7 (36.8%) |
Disability Class: Vision Difficulty
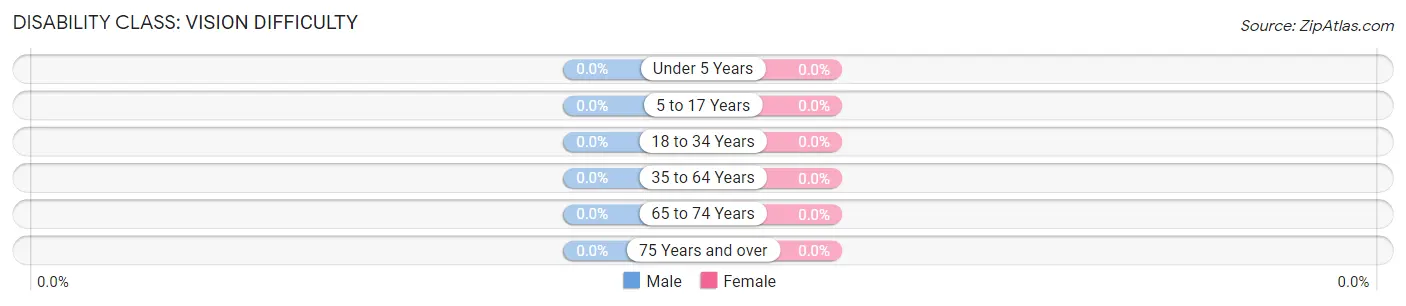
| Age Bracket | Male | Female |
| Under 5 Years | 0 (0.0%) | 0 (0.0%) |
| 5 to 17 Years | 0 (0.0%) | 0 (0.0%) |
| 18 to 34 Years | 0 (0.0%) | 0 (0.0%) |
| 35 to 64 Years | 0 (0.0%) | 0 (0.0%) |
| 65 to 74 Years | 0 (0.0%) | 0 (0.0%) |
| 75 Years and over | 0 (0.0%) | 0 (0.0%) |
Disability Class: Cognitive Difficulty
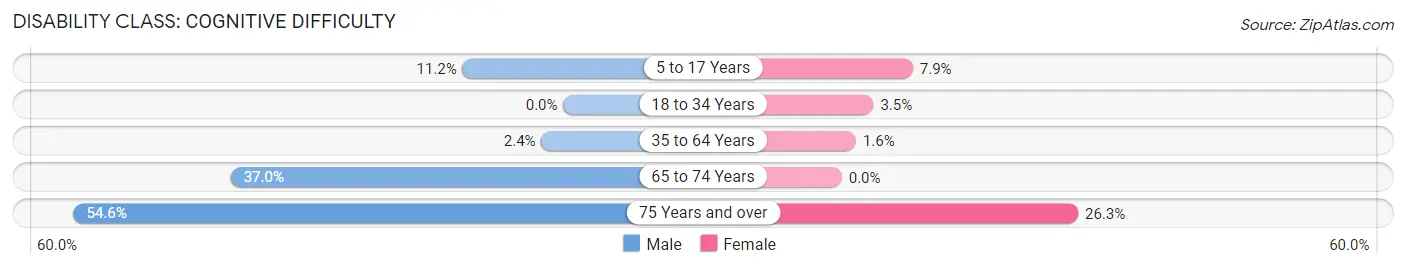
| Age Bracket | Male | Female |
| 5 to 17 Years | 11 (11.2%) | 11 (7.9%) |
| 18 to 34 Years | 0 (0.0%) | 3 (3.5%) |
| 35 to 64 Years | 7 (2.4%) | 5 (1.6%) |
| 65 to 74 Years | 20 (37.0%) | 0 (0.0%) |
| 75 Years and over | 6 (54.5%) | 5 (26.3%) |
Disability Class: Ambulatory Difficulty
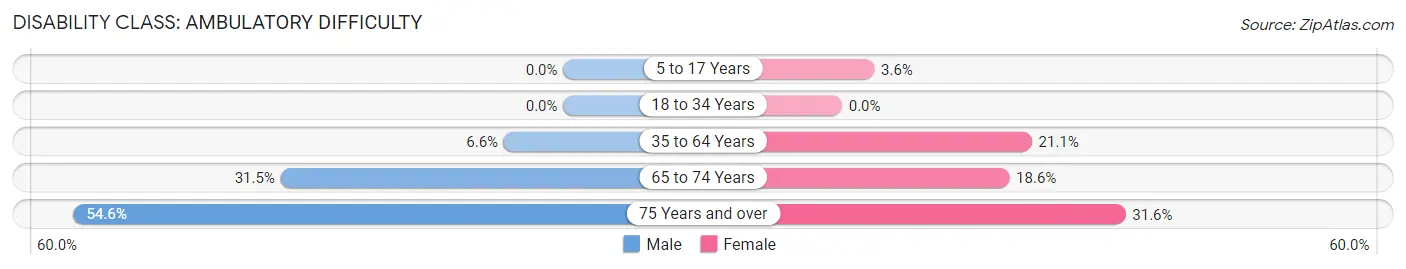
| Age Bracket | Male | Female |
| 5 to 17 Years | 0 (0.0%) | 5 (3.6%) |
| 18 to 34 Years | 0 (0.0%) | 0 (0.0%) |
| 35 to 64 Years | 19 (6.6%) | 67 (21.1%) |
| 65 to 74 Years | 17 (31.5%) | 11 (18.6%) |
| 75 Years and over | 6 (54.5%) | 6 (31.6%) |
Disability Class: Self-Care Difficulty
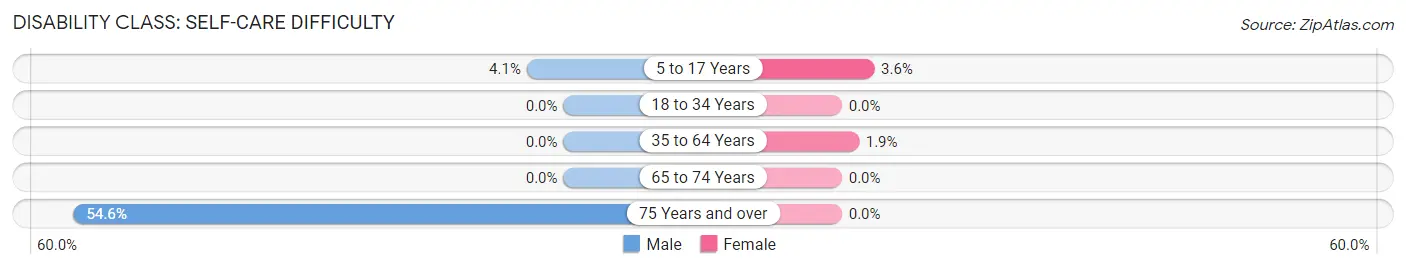
| Age Bracket | Male | Female |
| 5 to 17 Years | 4 (4.1%) | 5 (3.6%) |
| 18 to 34 Years | 0 (0.0%) | 0 (0.0%) |
| 35 to 64 Years | 0 (0.0%) | 6 (1.9%) |
| 65 to 74 Years | 0 (0.0%) | 0 (0.0%) |
| 75 Years and over | 6 (54.5%) | 0 (0.0%) |
Technology Access in Tuscarawas
Computing Device Access in Tuscarawas
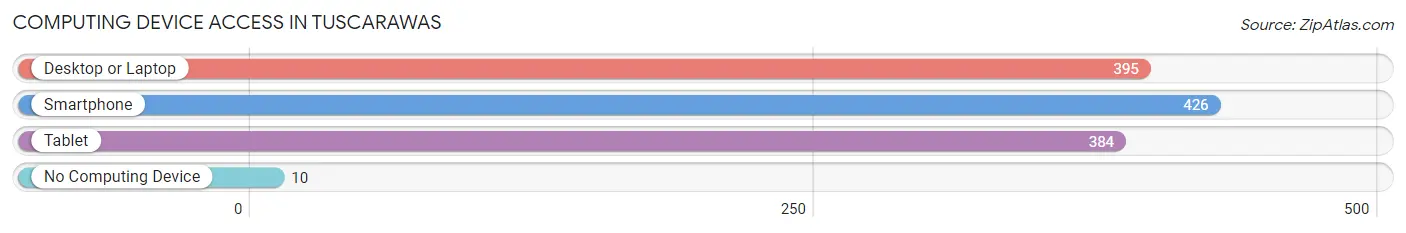
| Device Type | # Households | % Households |
| Desktop or Laptop | 395 | 81.1% |
| Smartphone | 426 | 87.5% |
| Tablet | 384 | 78.8% |
| No Computing Device | 10 | 2.1% |
| Total | 487 | 100.0% |
Internet Access in Tuscarawas
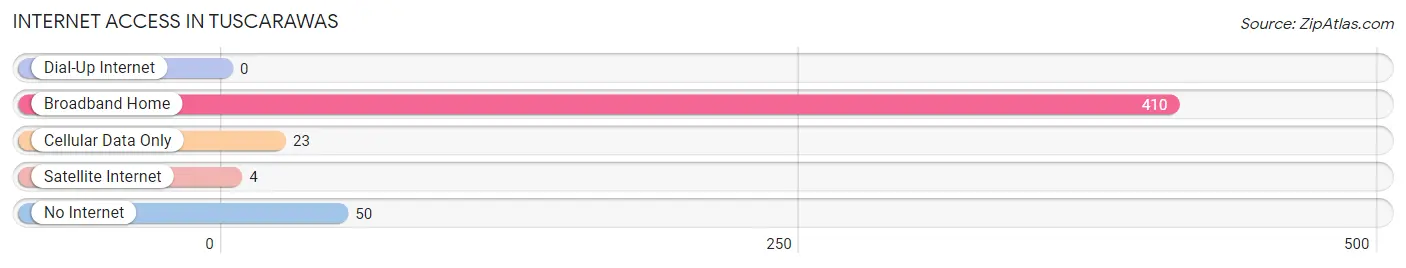
| Internet Type | # Households | % Households |
| Dial-Up Internet | 0 | 0.0% |
| Broadband Home | 410 | 84.2% |
| Cellular Data Only | 23 | 4.7% |
| Satellite Internet | 4 | 0.8% |
| No Internet | 50 | 10.3% |
| Total | 487 | 100.0% |
Tuscarawas Summary
Tuscarawas is a county located in the state of Ohio, United States. It is part of the Canton-Massillon, OH Metropolitan Statistical Area. As of the 2010 census, the population was 92,582. The county seat is New Philadelphia.
History
Tuscarawas County was formed in 1808 from portions of Muskingum and Coshocton counties. It was named after the Tuscarawas River, which in turn was named after the Native American tribe of the same name. The county was originally part of the Connecticut Western Reserve, and was settled by European Americans beginning in the late 18th century.
Geography
Tuscarawas County is located in east-central Ohio, along the Ohio River. It is bordered by Coshocton County to the north, Holmes County to the east, Carroll County to the south, and Harrison and Stark counties to the west. The county has a total area of 576 square miles, of which 571 square miles is land and 5.2 square miles is water.
The Tuscarawas River runs through the county, and is joined by the Walhonding River in the northern part of the county. The county is mostly rural, with small towns and villages scattered throughout. The largest city is New Philadelphia, the county seat. Other cities and villages include Dover, Uhrichsville, Dennison, Bolivar, Strasburg, and Gnadenhutten.
Economy
Tuscarawas County has a diverse economy, with a mix of manufacturing, agriculture, and services. The county is home to several large employers, including Dover Chemical Corporation, the Timken Company, and the Ohio Valley Clay Company. Agriculture is also an important part of the economy, with corn, soybeans, and hay being the main crops.
Demographics
As of the 2010 census, there were 92,582 people, 35,945 households, and 25,717 families residing in the county. The population density was 162.2 people per square mile. There were 39,845 housing units at an average density of 69.7 per square mile. The racial makeup of the county was 96.2% White, 1.2% Black or African American, 0.3% Native American, 0.4% Asian, 0.2% Pacific Islander, 0.5% from other races, and 1.2% from two or more races. 1.7% of the population were Hispanic or Latino of any race.
There were 35,945 households, out of which 30.2% had children under the age of 18 living with them, 56.2% were married couples living together, 10.2% had a female householder with no husband present, and 29.3% were non-families. 24.7% of all households were made up of individuals, and 10.3% had someone living alone who was 65 years of age or older. The average household size was 2.51 and the average family size was 2.98.
In the county, the population was spread out, with 24.2% under the age of 18, 8.2% from 18 to 24, 27.2% from 25 to 44, 25.2% from 45 to 64, and 15.2% who were 65 years of age or older. The median age was 38.4 years. For every 100 females there were 96.2 males. For every 100 females age 18 and over, there were 93.2 males.
The median income for a household in the county was $41,945, and the median income for a family was $50,845. Males had a median income of $41,845 versus $30,845 for females. The per capita income for the county was $20,945. About 9.7% of families and 12.7% of the population were below the poverty line, including 17.2% of those under age 18 and 8.2% of those age 65 or over.
Common Questions
What is Per Capita Income in Tuscarawas?
Per Capita income in Tuscarawas is $26,506.
What is the Median Family Income in Tuscarawas?
Median Family Income in Tuscarawas is $90,227.
What is the Median Household income in Tuscarawas?
Median Household Income in Tuscarawas is $67,321.
What is Income or Wage Gap in Tuscarawas?
Income or Wage Gap in Tuscarawas is 21.8%.
Women in Tuscarawas earn 78.2 cents for every dollar earned by a man.
What is Inequality or Gini Index in Tuscarawas?
Inequality or Gini Index in Tuscarawas is 0.34.
What is the Total Population of Tuscarawas?
Total Population of Tuscarawas is 1,296.
What is the Total Male Population of Tuscarawas?
Total Male Population of Tuscarawas is 632.
What is the Total Female Population of Tuscarawas?
Total Female Population of Tuscarawas is 664.
What is the Ratio of Males per 100 Females in Tuscarawas?
There are 95.18 Males per 100 Females in Tuscarawas.
What is the Ratio of Females per 100 Males in Tuscarawas?
There are 105.06 Females per 100 Males in Tuscarawas.
What is the Median Population Age in Tuscarawas?
Median Population Age in Tuscarawas is 41.7 Years.
What is the Average Family Size in Tuscarawas
Average Family Size in Tuscarawas is 3.0 People.
What is the Average Household Size in Tuscarawas
Average Household Size in Tuscarawas is 2.7 People.
How Large is the Labor Force in Tuscarawas?
There are 677 People in the Labor Forcein in Tuscarawas.
What is the Percentage of People in the Labor Force in Tuscarawas?
70.3% of People are in the Labor Force in Tuscarawas.
What is the Unemployment Rate in Tuscarawas?
Unemployment Rate in Tuscarawas is 3.0%.