Trenton, OH Map & Demographics
Trenton Map
Trenton Overview
$32,954
PER CAPITA INCOME
$97,925
AVG FAMILY INCOME
$84,392
AVG HOUSEHOLD INCOME
34.1%
WAGE / INCOME GAP [ % ]
65.9¢/ $1
WAGE / INCOME GAP [ $ ]
0.35
INEQUALITY / GINI INDEX
13,133
TOTAL POPULATION
6,632
MALE POPULATION
6,501
FEMALE POPULATION
102.02
MALES / 100 FEMALES
98.02
FEMALES / 100 MALES
33.5
MEDIAN AGE
3.4
AVG FAMILY SIZE
3.0
AVG HOUSEHOLD SIZE
6,707
LABOR FORCE [ PEOPLE ]
67.3%
PERCENT IN LABOR FORCE
4.7%
UNEMPLOYMENT RATE
Trenton Zip Codes
Trenton Area Codes
Income in Trenton
Income Overview in Trenton
Per Capita Income in Trenton is $32,954, while median incomes of families and households are $97,925 and $84,392 respectively.
| Characteristic | Number | Measure |
| Per Capita Income | 13,133 | $32,954 |
| Median Family Income | 3,467 | $97,925 |
| Mean Family Income | 3,467 | $106,838 |
| Median Household Income | 4,418 | $84,392 |
| Mean Household Income | 4,418 | $96,509 |
| Income Deficit | 3,467 | $0 |
| Wage / Income Gap (%) | 13,133 | 34.08% |
| Wage / Income Gap ($) | 13,133 | 65.92¢ per $1 |
| Gini / Inequality Index | 13,133 | 0.35 |
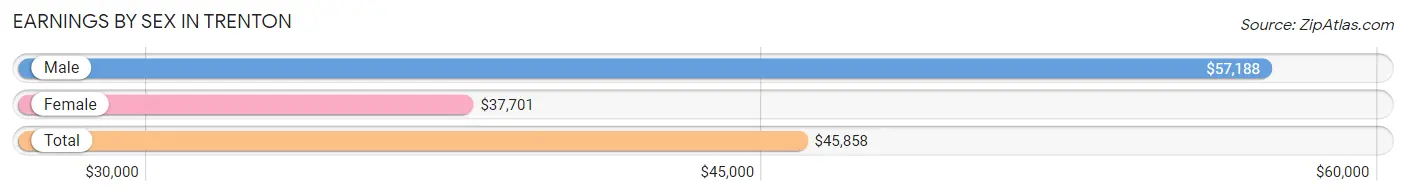
Earnings by Sex in Trenton
Average Earnings in Trenton are $45,858, $57,188 for men and $37,701 for women, a difference of 34.1%.
| Sex | Number | Average Earnings |
| Male | 3,554 (52.4%) | $57,188 |
| Female | 3,228 (47.6%) | $37,701 |
| Total | 6,782 (100.0%) | $45,858 |
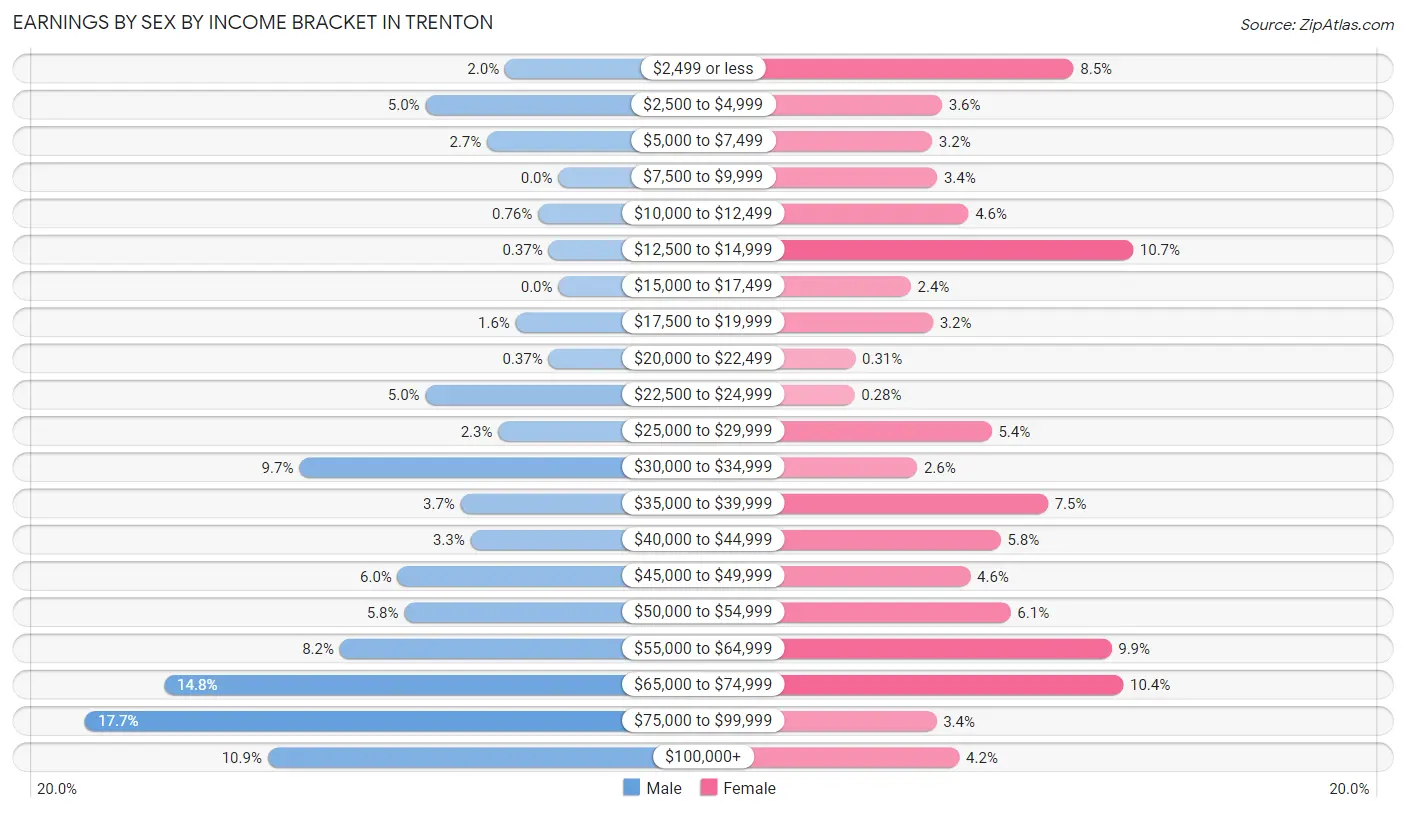
Earnings by Sex by Income Bracket in Trenton
The most common earnings brackets in Trenton are $75,000 to $99,999 for men (630 | 17.7%) and $12,500 to $14,999 for women (346 | 10.7%).
| Income | Male | Female |
| $2,499 or less | 71 (2.0%) | 274 (8.5%) |
| $2,500 to $4,999 | 177 (5.0%) | 115 (3.6%) |
| $5,000 to $7,499 | 95 (2.7%) | 103 (3.2%) |
| $7,500 to $9,999 | 0 (0.0%) | 109 (3.4%) |
| $10,000 to $12,499 | 27 (0.8%) | 147 (4.5%) |
| $12,500 to $14,999 | 13 (0.4%) | 346 (10.7%) |
| $15,000 to $17,499 | 0 (0.0%) | 77 (2.4%) |
| $17,500 to $19,999 | 57 (1.6%) | 104 (3.2%) |
| $20,000 to $22,499 | 13 (0.4%) | 10 (0.3%) |
| $22,500 to $24,999 | 177 (5.0%) | 9 (0.3%) |
| $25,000 to $29,999 | 80 (2.2%) | 175 (5.4%) |
| $30,000 to $34,999 | 345 (9.7%) | 85 (2.6%) |
| $35,000 to $39,999 | 130 (3.7%) | 243 (7.5%) |
| $40,000 to $44,999 | 117 (3.3%) | 186 (5.8%) |
| $45,000 to $49,999 | 214 (6.0%) | 149 (4.6%) |
| $50,000 to $54,999 | 205 (5.8%) | 198 (6.1%) |
| $55,000 to $64,999 | 291 (8.2%) | 320 (9.9%) |
| $65,000 to $74,999 | 525 (14.8%) | 334 (10.3%) |
| $75,000 to $99,999 | 630 (17.7%) | 108 (3.4%) |
| $100,000+ | 387 (10.9%) | 136 (4.2%) |
| Total | 3,554 (100.0%) | 3,228 (100.0%) |
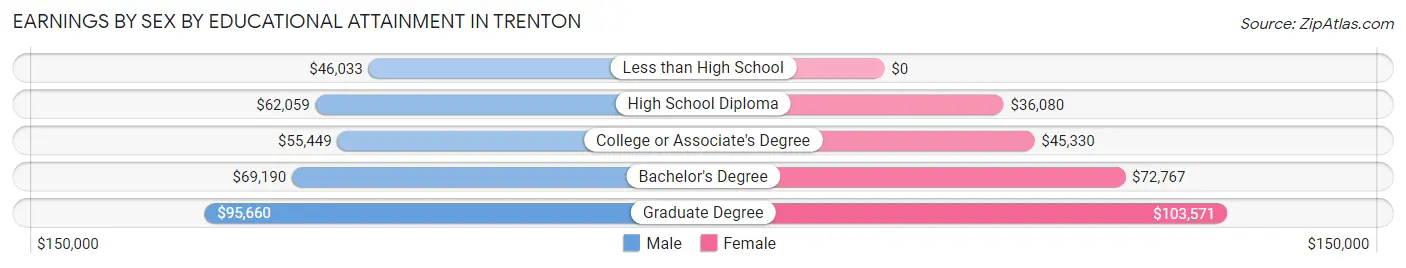
Earnings by Sex by Educational Attainment in Trenton
Average earnings in Trenton are $60,591 for men and $45,632 for women, a difference of 24.7%. Men with an educational attainment of graduate degree enjoy the highest average annual earnings of $95,660, while those with less than high school education earn the least with $46,033. Women with an educational attainment of graduate degree earn the most with the average annual earnings of $103,571, while those with high school diploma education have the smallest earnings of $36,080.
| Educational Attainment | Male Income | Female Income |
| Less than High School | $46,033 | $0 |
| High School Diploma | $62,059 | $36,080 |
| College or Associate's Degree | $55,449 | $45,330 |
| Bachelor's Degree | $69,190 | $72,767 |
| Graduate Degree | $95,660 | $103,571 |
| Total | $60,591 | $45,632 |
Family Income in Trenton
Family Income Brackets in Trenton
According to the Trenton family income data, there are 1,151 families falling into the $100,000 to $149,999 income range, which is the most common income bracket and makes up 33.2% of all families. Conversely, the $10,000 to $14,999 income bracket is the least frequent group with only 10 families (0.3%) belonging to this category.
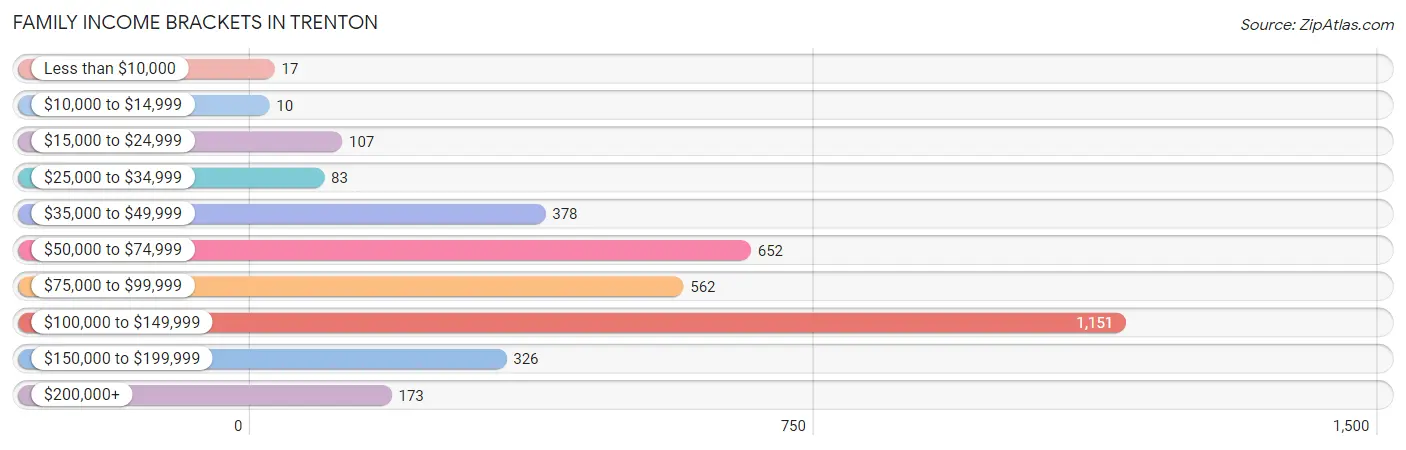
| Income Bracket | # Families | % Families |
| Less than $10,000 | 17 | 0.5% |
| $10,000 to $14,999 | 10 | 0.3% |
| $15,000 to $24,999 | 107 | 3.1% |
| $25,000 to $34,999 | 83 | 2.4% |
| $35,000 to $49,999 | 378 | 10.9% |
| $50,000 to $74,999 | 652 | 18.8% |
| $75,000 to $99,999 | 562 | 16.2% |
| $100,000 to $149,999 | 1,151 | 33.2% |
| $150,000 to $199,999 | 326 | 9.4% |
| $200,000+ | 173 | 5.0% |
Family Income by Famaliy Size in Trenton
6-person families (360 | 10.4%) account for the highest median family income in Trenton with $113,088 per family, while 2-person families (1,172 | 33.8%) have the highest median income of $38,802 per family member.
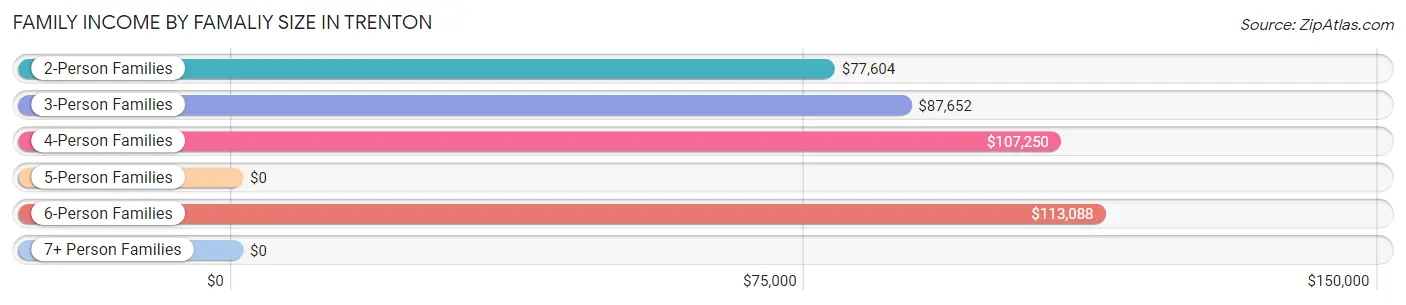
| Income Bracket | # Families | Median Income |
| 2-Person Families | 1,172 (33.8%) | $77,604 |
| 3-Person Families | 1,100 (31.7%) | $87,652 |
| 4-Person Families | 794 (22.9%) | $107,250 |
| 5-Person Families | 41 (1.2%) | $0 |
| 6-Person Families | 360 (10.4%) | $113,088 |
| 7+ Person Families | 0 (0.0%) | $0 |
| Total | 3,467 (100.0%) | $97,925 |
Family Income by Number of Earners in Trenton
The median family income in Trenton is $97,925, with families comprising 3+ earners (652) having the highest median family income of $132,968, while families with no earners (338) have the lowest median family income of $58,667, accounting for 18.8% and 9.8% of families, respectively.
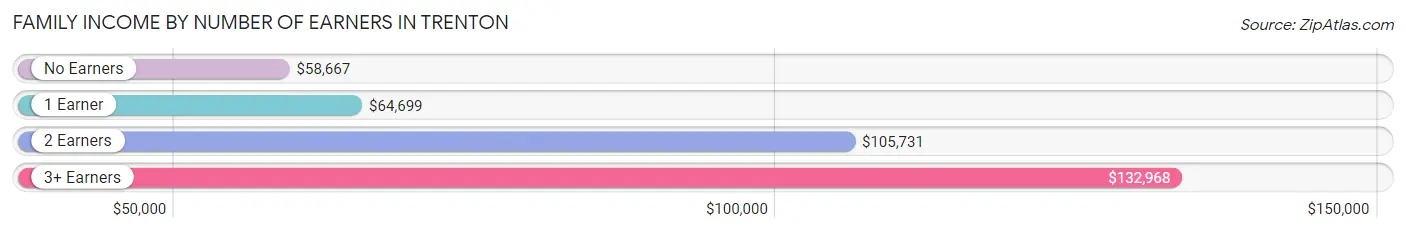
| Number of Earners | # Families | Median Income |
| No Earners | 338 (9.8%) | $58,667 |
| 1 Earner | 1,244 (35.9%) | $64,699 |
| 2 Earners | 1,233 (35.6%) | $105,731 |
| 3+ Earners | 652 (18.8%) | $132,968 |
| Total | 3,467 (100.0%) | $97,925 |
Household Income in Trenton
Household Income Brackets in Trenton
With 1,180 households falling in the category, the $100,000 to $149,999 income range is the most frequent in Trenton, accounting for 26.7% of all households. In contrast, only 53 households (1.2%) fall into the $10,000 to $14,999 income bracket, making it the least populous group.
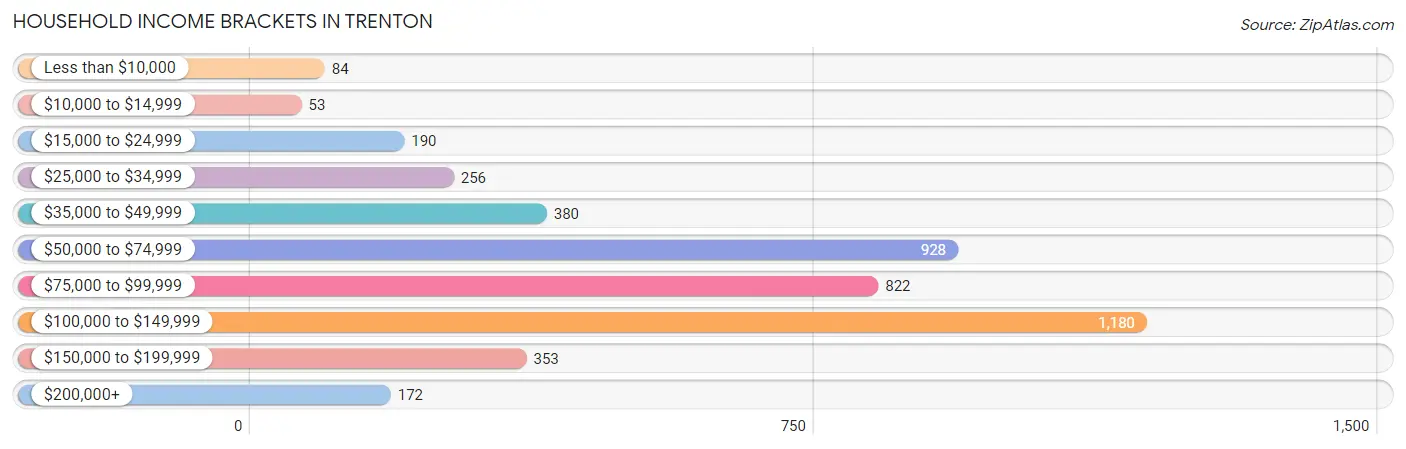
| Income Bracket | # Households | % Households |
| Less than $10,000 | 84 | 1.9% |
| $10,000 to $14,999 | 53 | 1.2% |
| $15,000 to $24,999 | 190 | 4.3% |
| $25,000 to $34,999 | 256 | 5.8% |
| $35,000 to $49,999 | 380 | 8.6% |
| $50,000 to $74,999 | 928 | 21.0% |
| $75,000 to $99,999 | 822 | 18.6% |
| $100,000 to $149,999 | 1,180 | 26.7% |
| $150,000 to $199,999 | 353 | 8.0% |
| $200,000+ | 172 | 3.9% |
Household Income by Householder Age in Trenton
The median household income in Trenton is $84,392, with the highest median household income of $101,215 found in the 45 to 64 years age bracket for the primary householder. A total of 1,623 households (36.7%) fall into this category. Meanwhile, the 15 to 24 years age bracket for the primary householder has the lowest median household income of $0, with 68 households (1.5%) in this group.
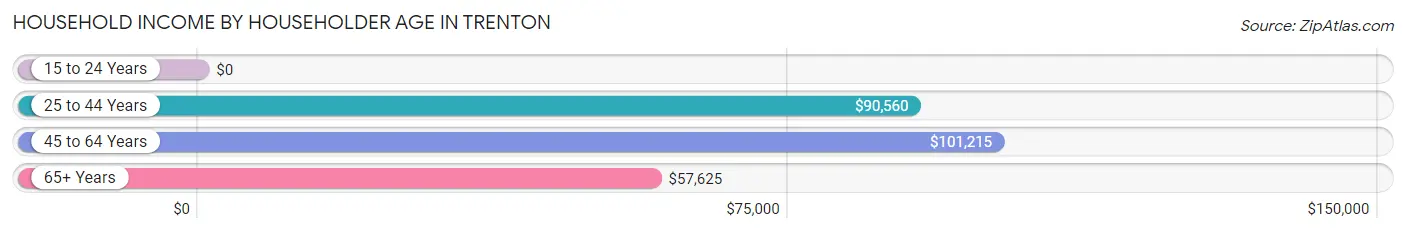
| Income Bracket | # Households | Median Income |
| 15 to 24 Years | 68 (1.5%) | $0 |
| 25 to 44 Years | 1,762 (39.9%) | $90,560 |
| 45 to 64 Years | 1,623 (36.7%) | $101,215 |
| 65+ Years | 965 (21.8%) | $57,625 |
| Total | 4,418 (100.0%) | $84,392 |
Poverty in Trenton
Income Below Poverty by Sex and Age in Trenton
With 2.2% poverty level for males and 6.7% for females among the residents of Trenton, 12 to 14 year old males and 25 to 34 year old females are the most vulnerable to poverty, with 18 males (11.3%) and 112 females (15.3%) in their respective age groups living below the poverty level.
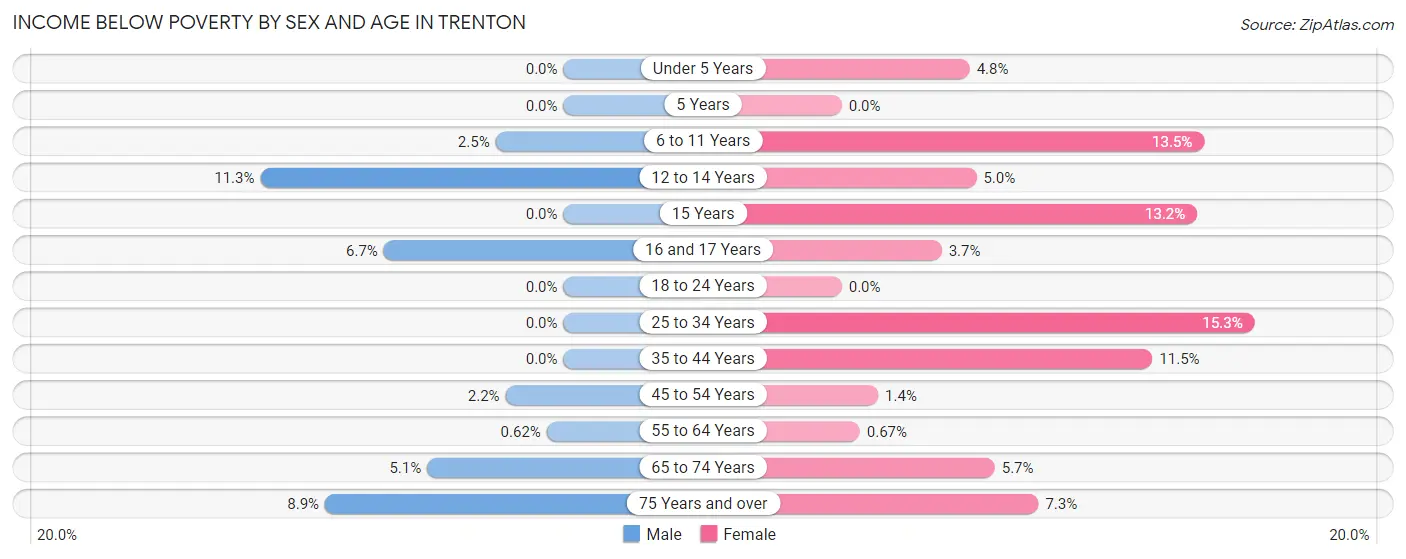
| Age Bracket | Male | Female |
| Under 5 Years | 0 (0.0%) | 25 (4.8%) |
| 5 Years | 0 (0.0%) | 0 (0.0%) |
| 6 to 11 Years | 21 (2.5%) | 64 (13.5%) |
| 12 to 14 Years | 18 (11.3%) | 23 (5.0%) |
| 15 Years | 0 (0.0%) | 24 (13.2%) |
| 16 and 17 Years | 26 (6.7%) | 14 (3.7%) |
| 18 to 24 Years | 0 (0.0%) | 0 (0.0%) |
| 25 to 34 Years | 0 (0.0%) | 112 (15.3%) |
| 35 to 44 Years | 0 (0.0%) | 98 (11.5%) |
| 45 to 54 Years | 18 (2.1%) | 12 (1.3%) |
| 55 to 64 Years | 5 (0.6%) | 3 (0.7%) |
| 65 to 74 Years | 16 (5.1%) | 28 (5.7%) |
| 75 Years and over | 37 (8.8%) | 30 (7.3%) |
| Total | 141 (2.2%) | 433 (6.7%) |
Income Above Poverty by Sex and Age in Trenton
According to the poverty statistics in Trenton, males aged under 5 years and females aged 18 to 24 years are the age groups that are most secure financially, with 100.0% of males and 100.0% of females in these age groups living above the poverty line.
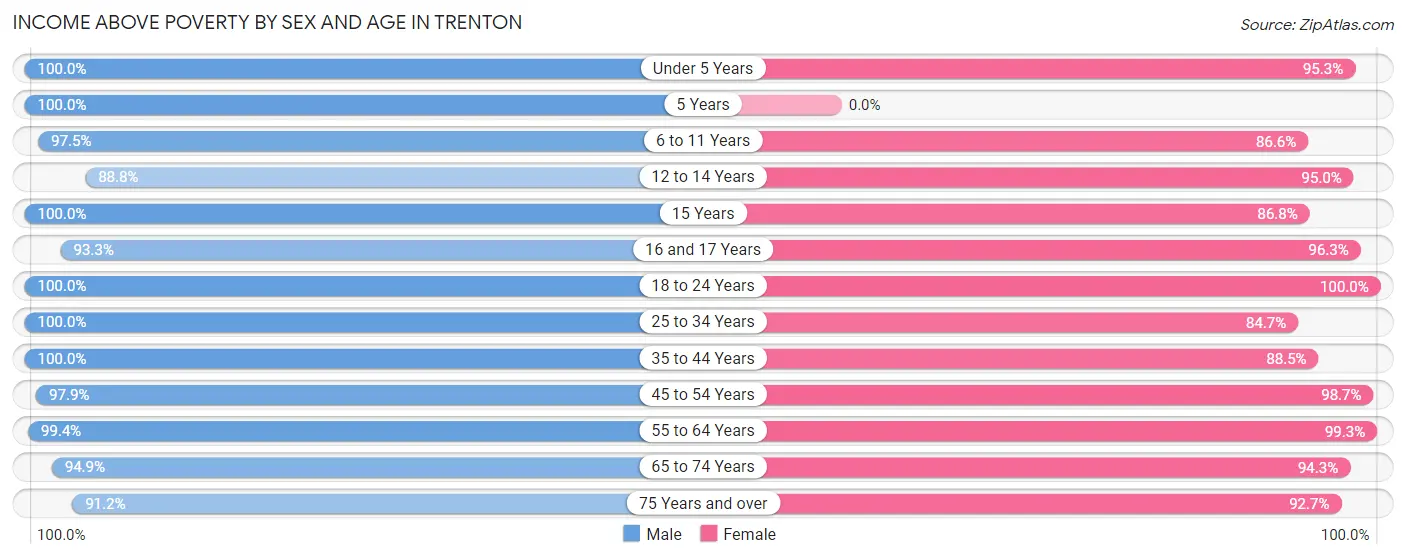
| Age Bracket | Male | Female |
| Under 5 Years | 205 (100.0%) | 501 (95.3%) |
| 5 Years | 38 (100.0%) | 0 (0.0%) |
| 6 to 11 Years | 812 (97.5%) | 412 (86.6%) |
| 12 to 14 Years | 142 (88.7%) | 437 (95.0%) |
| 15 Years | 136 (100.0%) | 158 (86.8%) |
| 16 and 17 Years | 364 (93.3%) | 363 (96.3%) |
| 18 to 24 Years | 626 (100.0%) | 623 (100.0%) |
| 25 to 34 Years | 760 (100.0%) | 619 (84.7%) |
| 35 to 44 Years | 997 (100.0%) | 752 (88.5%) |
| 45 to 54 Years | 819 (97.9%) | 874 (98.7%) |
| 55 to 64 Years | 801 (99.4%) | 442 (99.3%) |
| 65 to 74 Years | 300 (94.9%) | 465 (94.3%) |
| 75 Years and over | 381 (91.1%) | 381 (92.7%) |
| Total | 6,381 (97.8%) | 6,027 (93.3%) |
Income Below Poverty Among Married-Couple Families in Trenton
The poverty statistics for married-couple families in Trenton show that 0.8% or 21 of the total 2,627 families live below the poverty line. Families with no children have the highest poverty rate of 1.2%, comprising of 16 families. On the other hand, families with 3 or 4 children have the lowest poverty rate of 0.0%, which includes 0 families.
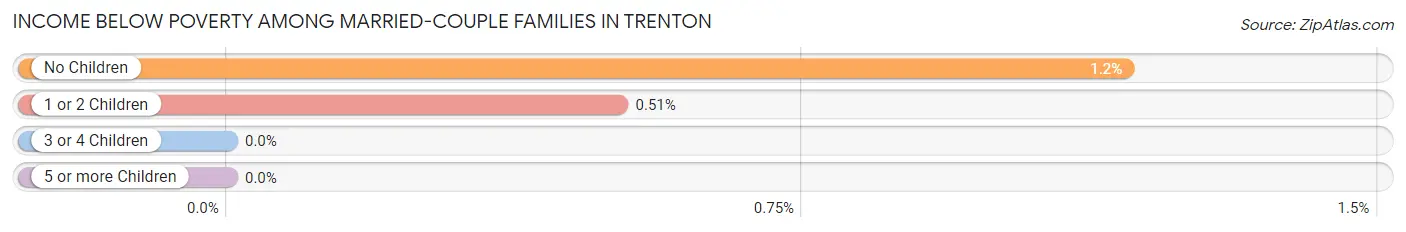
| Children | Above Poverty | Below Poverty |
| No Children | 1,355 (98.8%) | 16 (1.2%) |
| 1 or 2 Children | 966 (99.5%) | 5 (0.5%) |
| 3 or 4 Children | 285 (100.0%) | 0 (0.0%) |
| 5 or more Children | 0 (0.0%) | 0 (0.0%) |
| Total | 2,606 (99.2%) | 21 (0.8%) |
Income Below Poverty Among Single-Parent Households in Trenton
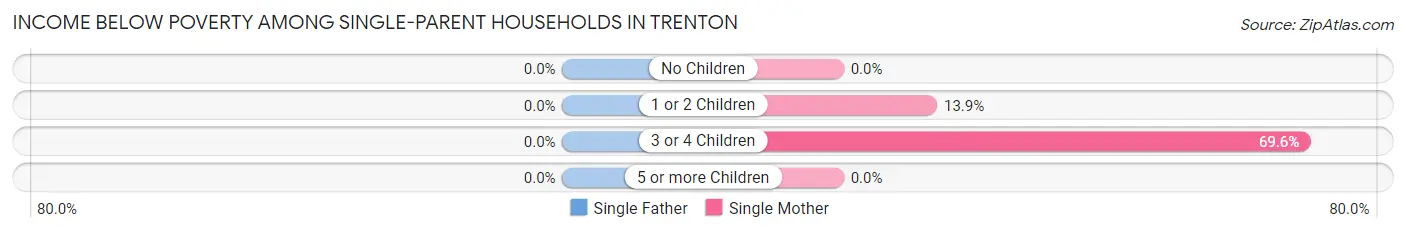
| Children | Single Father | Single Mother |
| No Children | 0 (0.0%) | 0 (0.0%) |
| 1 or 2 Children | 0 (0.0%) | 27 (13.9%) |
| 3 or 4 Children | 0 (0.0%) | 39 (69.6%) |
| 5 or more Children | 0 (0.0%) | 0 (0.0%) |
| Total | 0 (0.0%) | 66 (16.5%) |
Income Below Poverty Among Married-Couple vs Single-Parent Households in Trenton
The poverty data for Trenton shows that 21 of the married-couple family households (0.8%) and 66 of the single-parent households (7.9%) are living below the poverty level. Within the married-couple family households, those with no children have the highest poverty rate, with 16 households (1.2%) falling below the poverty line. Among the single-parent households, those with 3 or 4 children have the highest poverty rate, with 39 household (35.4%) living below poverty.
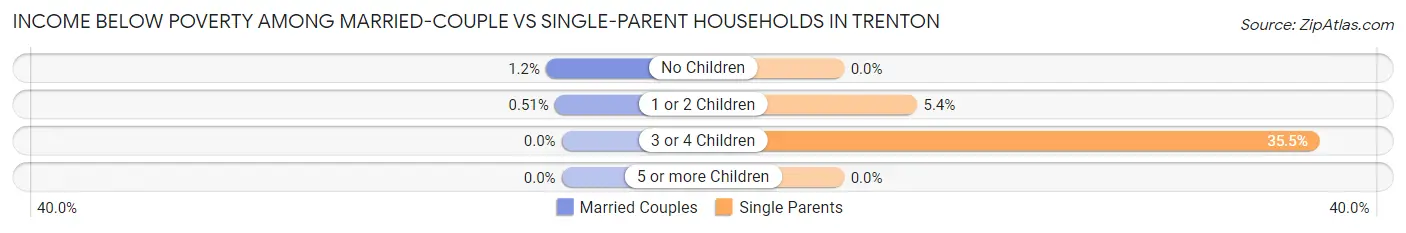
| Children | Married-Couple Families | Single-Parent Households |
| No Children | 16 (1.2%) | 0 (0.0%) |
| 1 or 2 Children | 5 (0.5%) | 27 (5.4%) |
| 3 or 4 Children | 0 (0.0%) | 39 (35.4%) |
| 5 or more Children | 0 (0.0%) | 0 (0.0%) |
| Total | 21 (0.8%) | 66 (7.9%) |
Race in Trenton
The most populous races in Trenton are White / Caucasian (12,751 | 97.1%), Two or more Races (297 | 2.3%), and Hispanic or Latino (129 | 1.0%).
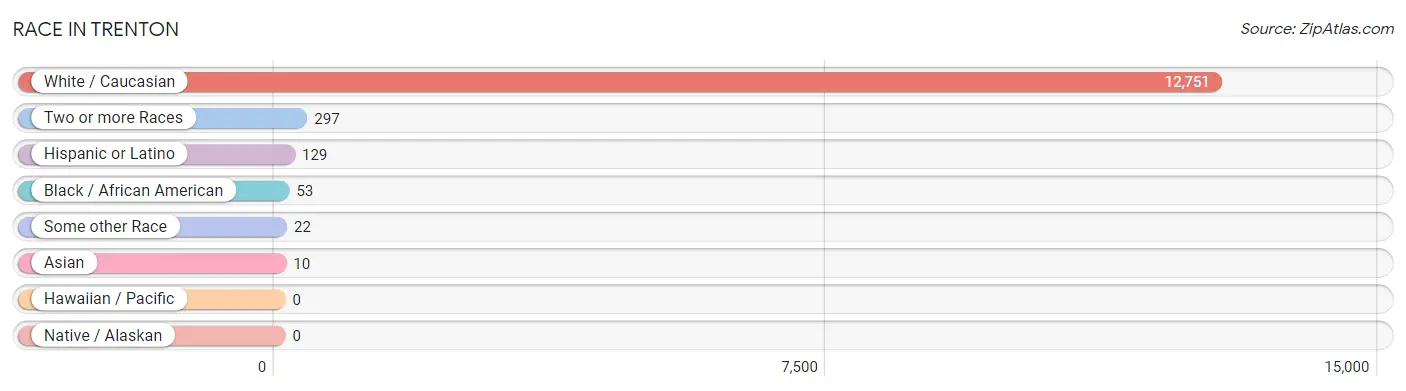
| Race | # Population | % Population |
| Asian | 10 | 0.1% |
| Black / African American | 53 | 0.4% |
| Hawaiian / Pacific | 0 | 0.0% |
| Hispanic or Latino | 129 | 1.0% |
| Native / Alaskan | 0 | 0.0% |
| White / Caucasian | 12,751 | 97.1% |
| Two or more Races | 297 | 2.3% |
| Some other Race | 22 | 0.2% |
| Total | 13,133 | 100.0% |
Ancestry in Trenton
The most populous ancestries reported in Trenton are Irish (2,567 | 19.6%), German (2,100 | 16.0%), American (1,225 | 9.3%), English (1,152 | 8.8%), and Italian (767 | 5.8%), together accounting for 59.5% of all Trenton residents.
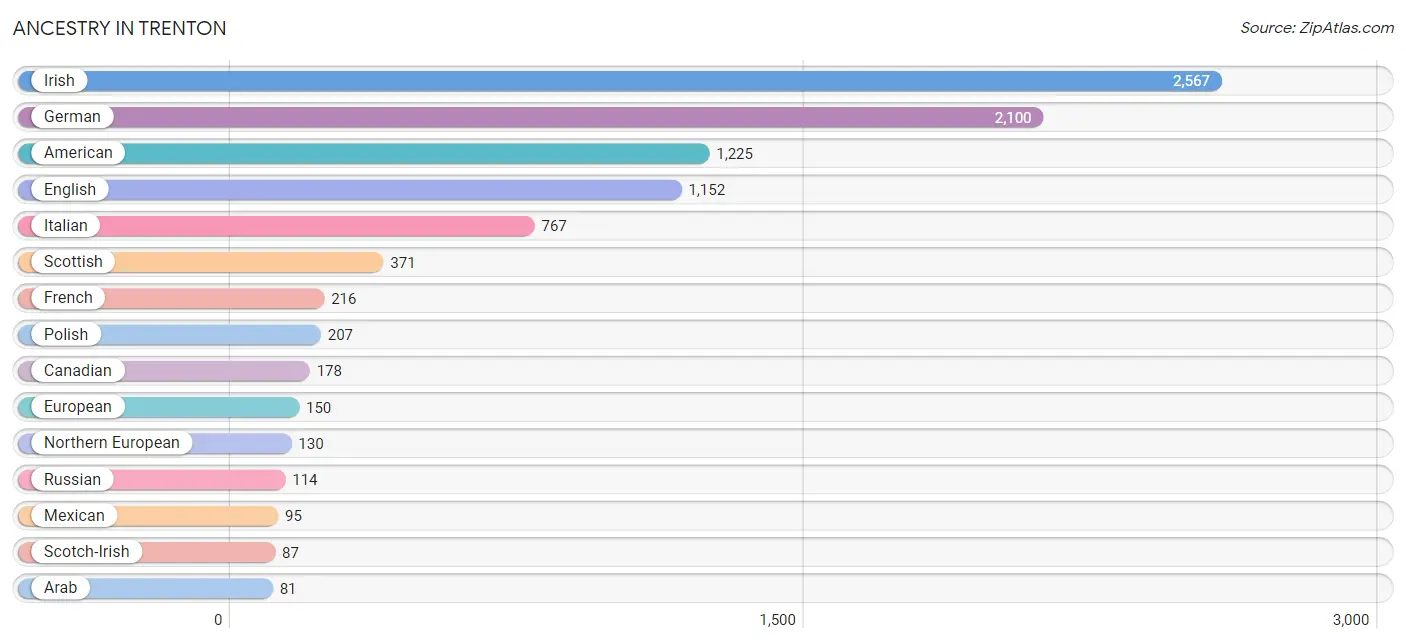
| Ancestry | # Population | % Population |
| American | 1,225 | 9.3% |
| Arab | 81 | 0.6% |
| Blackfeet | 8 | 0.1% |
| British | 43 | 0.3% |
| Burmese | 29 | 0.2% |
| Canadian | 178 | 1.4% |
| Cuban | 34 | 0.3% |
| Czech | 73 | 0.6% |
| Dutch | 55 | 0.4% |
| English | 1,152 | 8.8% |
| European | 150 | 1.1% |
| French | 216 | 1.6% |
| German | 2,100 | 16.0% |
| Hungarian | 40 | 0.3% |
| Indian (Asian) | 10 | 0.1% |
| Irish | 2,567 | 19.6% |
| Italian | 767 | 5.8% |
| Jordanian | 28 | 0.2% |
| Mexican | 95 | 0.7% |
| Northern European | 130 | 1.0% |
| Norwegian | 21 | 0.2% |
| Polish | 207 | 1.6% |
| Russian | 114 | 0.9% |
| Scandinavian | 11 | 0.1% |
| Scotch-Irish | 87 | 0.7% |
| Scottish | 371 | 2.8% |
| Slavic | 24 | 0.2% |
| Slovak | 28 | 0.2% |
| Swedish | 14 | 0.1% |
| Thai | 24 | 0.2% |
| Welsh | 21 | 0.2% | View All 31 Rows |
Immigrants in Trenton
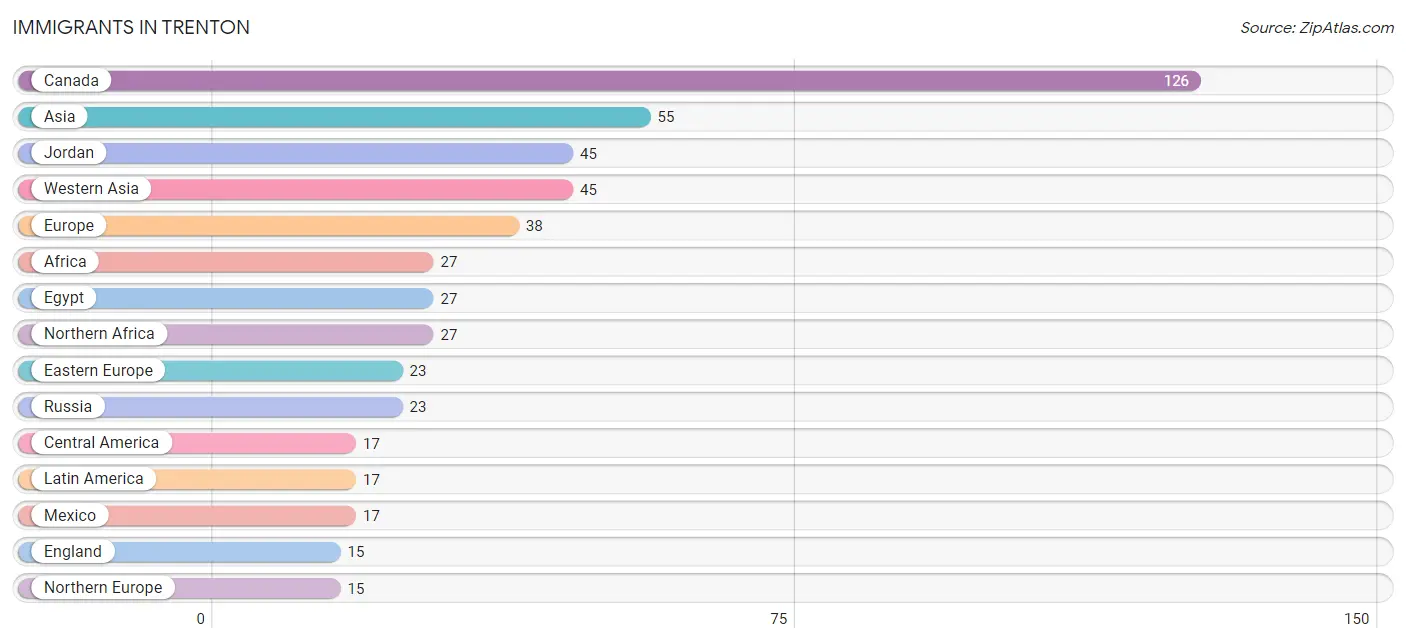
The most numerous immigrant groups reported in Trenton came from Canada (126 | 1.0%), Asia (55 | 0.4%), Jordan (45 | 0.3%), Western Asia (45 | 0.3%), and Europe (38 | 0.3%), together accounting for 2.4% of all Trenton residents.
| Immigration Origin | # Population | % Population |
| Africa | 27 | 0.2% |
| Asia | 55 | 0.4% |
| Canada | 126 | 1.0% |
| Central America | 17 | 0.1% |
| China | 10 | 0.1% |
| Eastern Asia | 10 | 0.1% |
| Eastern Europe | 23 | 0.2% |
| Egypt | 27 | 0.2% |
| England | 15 | 0.1% |
| Europe | 38 | 0.3% |
| Jordan | 45 | 0.3% |
| Latin America | 17 | 0.1% |
| Mexico | 17 | 0.1% |
| Northern Africa | 27 | 0.2% |
| Northern Europe | 15 | 0.1% |
| Russia | 23 | 0.2% |
| Western Asia | 45 | 0.3% | View All 17 Rows |
Sex and Age in Trenton
Sex and Age in Trenton
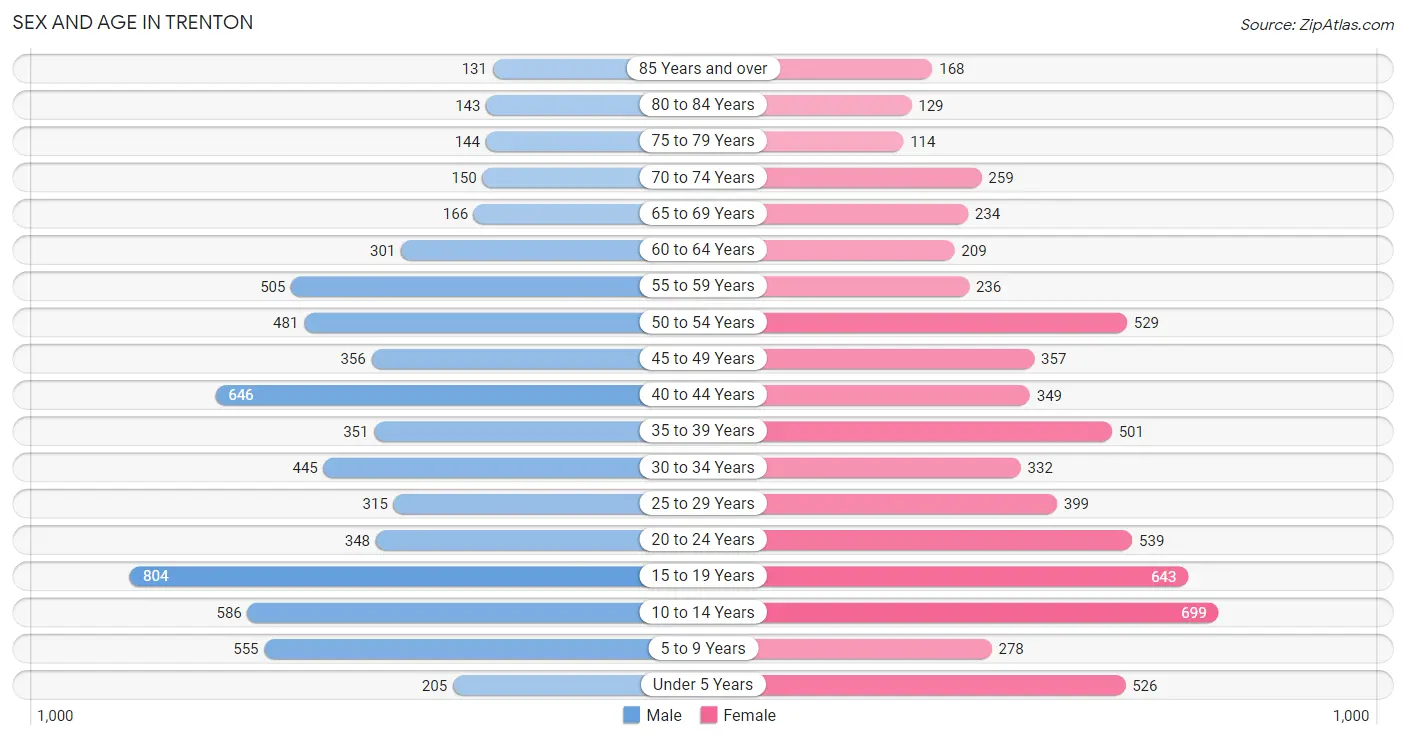
The most populous age groups in Trenton are 15 to 19 Years (804 | 12.1%) for men and 10 to 14 Years (699 | 10.7%) for women.
| Age Bracket | Male | Female |
| Under 5 Years | 205 (3.1%) | 526 (8.1%) |
| 5 to 9 Years | 555 (8.4%) | 278 (4.3%) |
| 10 to 14 Years | 586 (8.8%) | 699 (10.7%) |
| 15 to 19 Years | 804 (12.1%) | 643 (9.9%) |
| 20 to 24 Years | 348 (5.2%) | 539 (8.3%) |
| 25 to 29 Years | 315 (4.8%) | 399 (6.1%) |
| 30 to 34 Years | 445 (6.7%) | 332 (5.1%) |
| 35 to 39 Years | 351 (5.3%) | 501 (7.7%) |
| 40 to 44 Years | 646 (9.7%) | 349 (5.4%) |
| 45 to 49 Years | 356 (5.4%) | 357 (5.5%) |
| 50 to 54 Years | 481 (7.2%) | 529 (8.1%) |
| 55 to 59 Years | 505 (7.6%) | 236 (3.6%) |
| 60 to 64 Years | 301 (4.5%) | 209 (3.2%) |
| 65 to 69 Years | 166 (2.5%) | 234 (3.6%) |
| 70 to 74 Years | 150 (2.3%) | 259 (4.0%) |
| 75 to 79 Years | 144 (2.2%) | 114 (1.8%) |
| 80 to 84 Years | 143 (2.2%) | 129 (2.0%) |
| 85 Years and over | 131 (2.0%) | 168 (2.6%) |
| Total | 6,632 (100.0%) | 6,501 (100.0%) |
Families and Households in Trenton
Median Family Size in Trenton
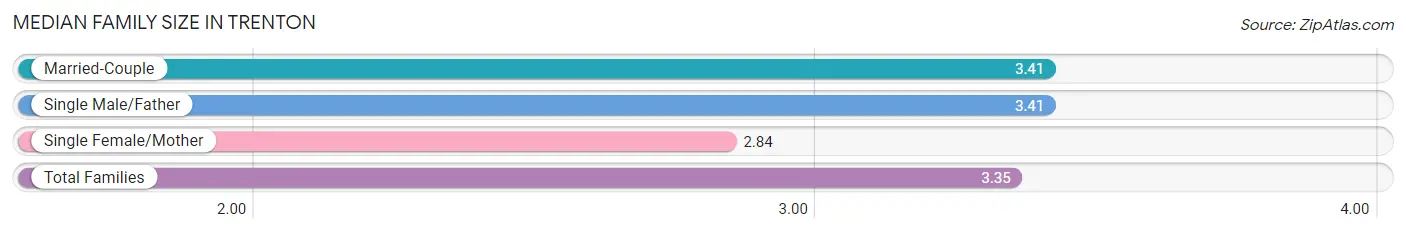
The median family size in Trenton is 3.35 persons per family, with married-couple families (2,627 | 75.8%) accounting for the largest median family size of 3.41 persons per family. On the other hand, single female/mother families (400 | 11.5%) represent the smallest median family size with 2.84 persons per family.
| Family Type | # Families | Family Size |
| Married-Couple | 2,627 (75.8%) | 3.41 |
| Single Male/Father | 440 (12.7%) | 3.41 |
| Single Female/Mother | 400 (11.5%) | 2.84 |
| Total Families | 3,467 (100.0%) | 3.35 |
Median Household Size in Trenton
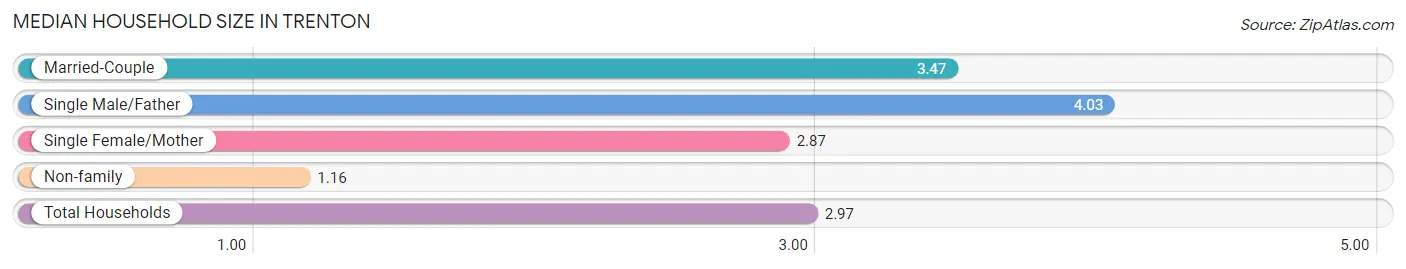
The median household size in Trenton is 2.97 persons per household, with single male/father households (440 | 10.0%) accounting for the largest median household size of 4.03 persons per household. non-family households (951 | 21.5%) represent the smallest median household size with 1.16 persons per household.
| Household Type | # Households | Household Size |
| Married-Couple | 2,627 (59.5%) | 3.47 |
| Single Male/Father | 440 (10.0%) | 4.03 |
| Single Female/Mother | 400 (9.0%) | 2.87 |
| Non-family | 951 (21.5%) | 1.16 |
| Total Households | 4,418 (100.0%) | 2.97 |
Household Size by Marriage Status in Trenton
Out of a total of 4,418 households in Trenton, 3,467 (78.5%) are family households, while 951 (21.5%) are nonfamily households. The most numerous type of family households are 3-person households, comprising 1,069, and the most common type of nonfamily households are 1-person households, comprising 838.
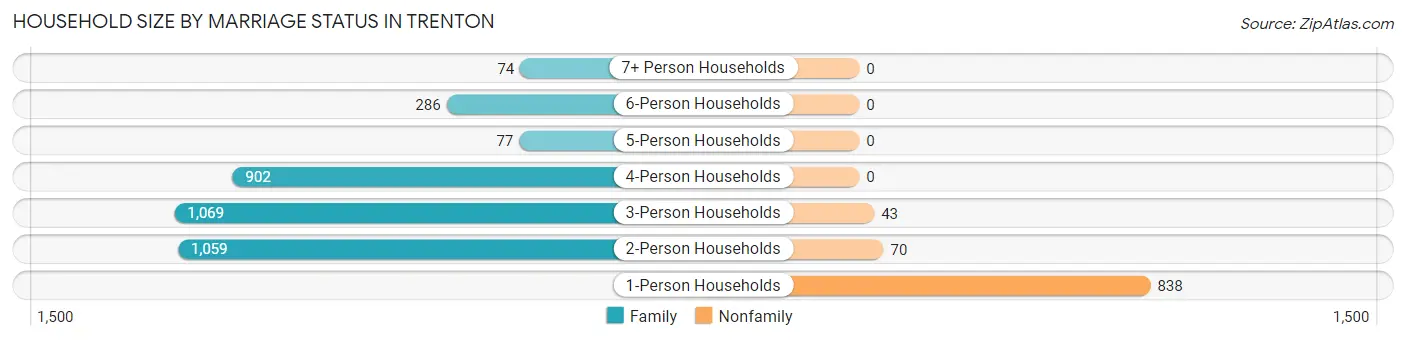
| Household Size | Family Households | Nonfamily Households |
| 1-Person Households | - | 838 (19.0%) |
| 2-Person Households | 1,059 (24.0%) | 70 (1.6%) |
| 3-Person Households | 1,069 (24.2%) | 43 (1.0%) |
| 4-Person Households | 902 (20.4%) | 0 (0.0%) |
| 5-Person Households | 77 (1.7%) | 0 (0.0%) |
| 6-Person Households | 286 (6.5%) | 0 (0.0%) |
| 7+ Person Households | 74 (1.7%) | 0 (0.0%) |
| Total | 3,467 (78.5%) | 951 (21.5%) |
Female Fertility in Trenton
Fertility by Age in Trenton
Average fertility rate in Trenton is 9.0 births per 1,000 women. Women in the age bracket of 20 to 34 years have the highest fertility rate with 23.0 births per 1,000 women. Women in the age bracket of 20 to 34 years acount for 100.0% of all women with births.
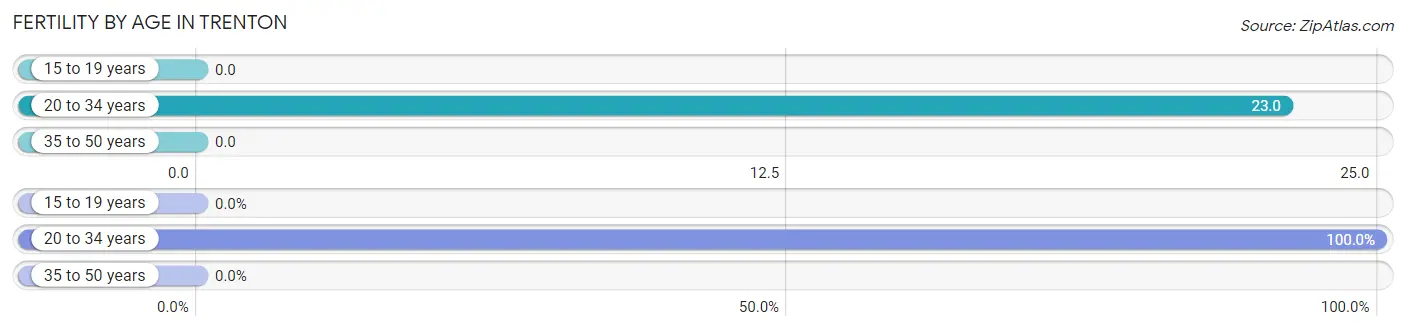
| Age Bracket | Women with Births | Births / 1,000 Women |
| 15 to 19 years | 0 (0.0%) | 0.0 |
| 20 to 34 years | 29 (100.0%) | 23.0 |
| 35 to 50 years | 0 (0.0%) | 0.0 |
| Total | 29 (100.0%) | 9.0 |
Fertility by Age by Marriage Status in Trenton
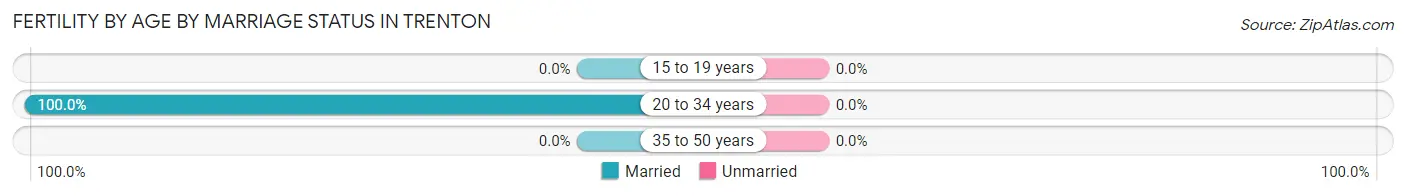
| Age Bracket | Married | Unmarried |
| 15 to 19 years | 0 (0.0%) | 0 (0.0%) |
| 20 to 34 years | 29 (100.0%) | 0 (0.0%) |
| 35 to 50 years | 0 (0.0%) | 0 (0.0%) |
| Total | 29 (100.0%) | 0 (0.0%) |
Fertility by Education in Trenton
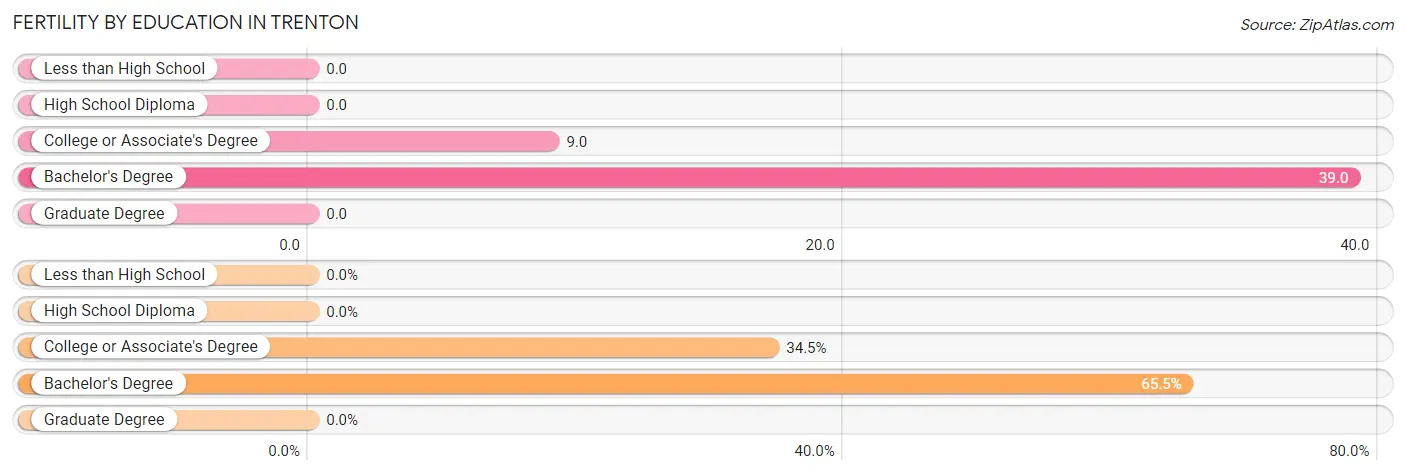
| Educational Attainment | Women with Births | Births / 1,000 Women |
| Less than High School | 0 (0.0%) | 0.0 |
| High School Diploma | 0 (0.0%) | 0.0 |
| College or Associate's Degree | 10 (34.5%) | 9.0 |
| Bachelor's Degree | 19 (65.5%) | 39.0 |
| Graduate Degree | 0 (0.0%) | 0.0 |
| Total | 29 (100.0%) | 9.0 |
Fertility by Education by Marriage Status in Trenton
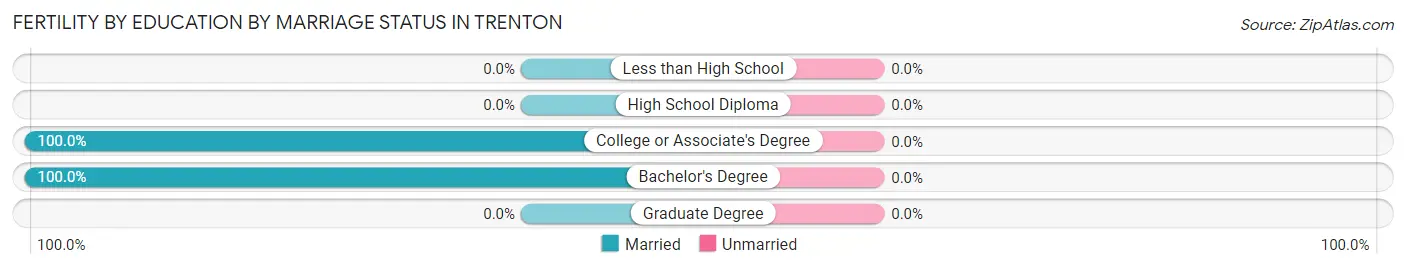
| Educational Attainment | Married | Unmarried |
| Less than High School | 0 (0.0%) | 0 (0.0%) |
| High School Diploma | 0 (0.0%) | 0 (0.0%) |
| College or Associate's Degree | 10 (100.0%) | 0 (0.0%) |
| Bachelor's Degree | 19 (100.0%) | 0 (0.0%) |
| Graduate Degree | 0 (0.0%) | 0 (0.0%) |
| Total | 29 (100.0%) | 0 (0.0%) |
Employment Characteristics in Trenton
Employment by Class of Employer in Trenton
Among the 6,317 employed individuals in Trenton, private company employees (4,922 | 77.9%), local government employees (545 | 8.6%), and not-for-profit organizations (466 | 7.4%) make up the most common classes of employment.
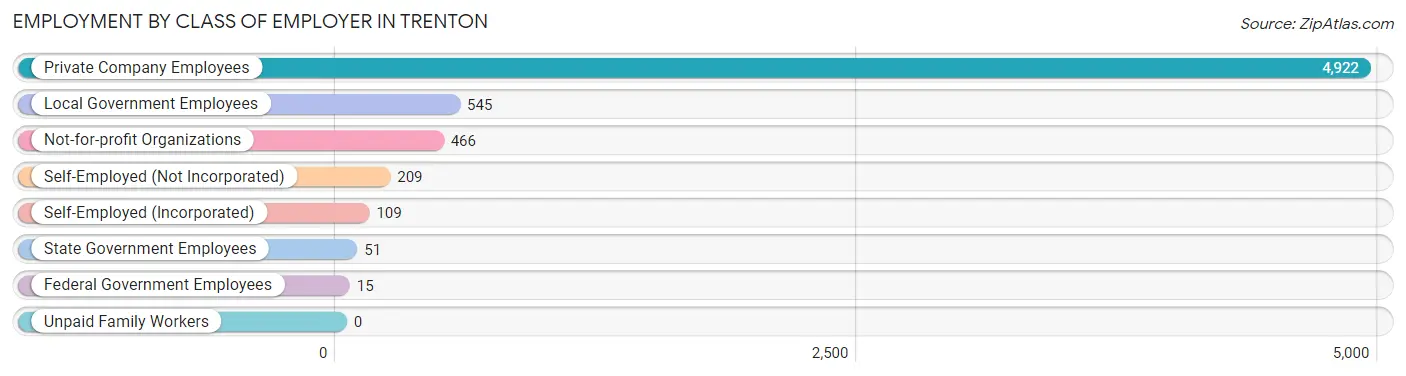
| Employer Class | # Employees | % Employees |
| Private Company Employees | 4,922 | 77.9% |
| Self-Employed (Incorporated) | 109 | 1.7% |
| Self-Employed (Not Incorporated) | 209 | 3.3% |
| Not-for-profit Organizations | 466 | 7.4% |
| Local Government Employees | 545 | 8.6% |
| State Government Employees | 51 | 0.8% |
| Federal Government Employees | 15 | 0.2% |
| Unpaid Family Workers | 0 | 0.0% |
| Total | 6,317 | 100.0% |
Employment Status by Age in Trenton
According to the labor force statistics for Trenton, out of the total population over 16 years of age (9,966), 67.3% or 6,707 individuals are in the labor force, with 4.7% or 315 of them unemployed. The age group with the highest labor force participation rate is 60 to 64 years, with 92.5% or 472 individuals in the labor force. Within the labor force, the 16 to 19 years age range has the highest percentage of unemployed individuals, with 13.5% or 65 of them being unemployed.
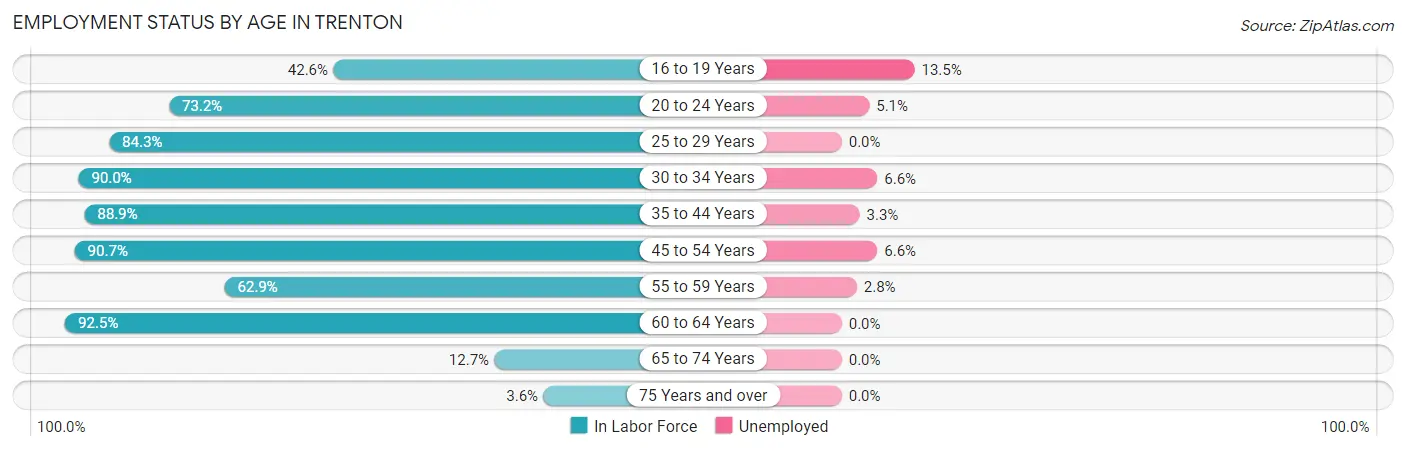
| Age Bracket | In Labor Force | Unemployed |
| 16 to 19 Years | 481 (42.6%) | 65 (13.5%) |
| 20 to 24 Years | 649 (73.2%) | 33 (5.1%) |
| 25 to 29 Years | 602 (84.3%) | 0 (0.0%) |
| 30 to 34 Years | 699 (90.0%) | 46 (6.6%) |
| 35 to 44 Years | 1,642 (88.9%) | 54 (3.3%) |
| 45 to 54 Years | 1,563 (90.7%) | 103 (6.6%) |
| 55 to 59 Years | 466 (62.9%) | 13 (2.8%) |
| 60 to 64 Years | 472 (92.5%) | 0 (0.0%) |
| 65 to 74 Years | 103 (12.7%) | 0 (0.0%) |
| 75 Years and over | 30 (3.6%) | 0 (0.0%) |
| Total | 6,707 (67.3%) | 315 (4.7%) |
Employment Status by Educational Attainment in Trenton
According to labor force statistics for Trenton, 86.2% of individuals (5,441) out of the total population between 25 and 64 years of age (6,312) are in the labor force, with 4.0% or 218 of them being unemployed. The group with the highest labor force participation rate are those with the educational attainment of bachelor's degree or higher, with 91.3% or 949 individuals in the labor force. Within the labor force, individuals with high school diploma education have the highest percentage of unemployment, with 6.0% or 107 of them being unemployed.
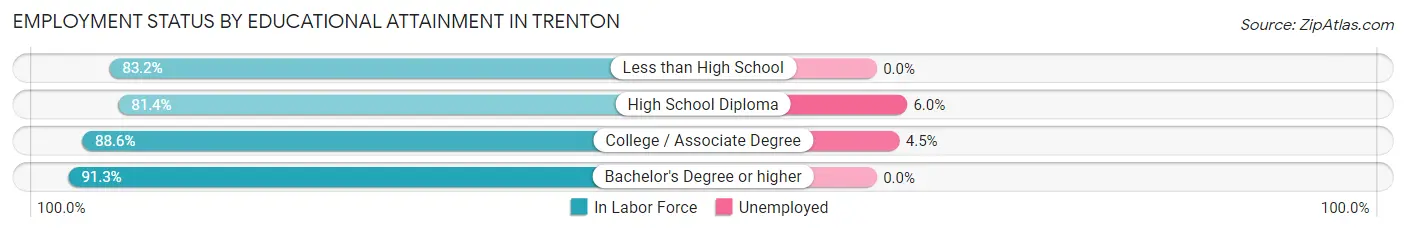
| Educational Attainment | In Labor Force | Unemployed |
| Less than High School | 297 (83.2%) | 0 (0.0%) |
| High School Diploma | 1,789 (81.4%) | 132 (6.0%) |
| College / Associate Degree | 2,408 (88.6%) | 122 (4.5%) |
| Bachelor's Degree or higher | 949 (91.3%) | 0 (0.0%) |
| Total | 5,441 (86.2%) | 252 (4.0%) |
Employment Occupations by Sex in Trenton
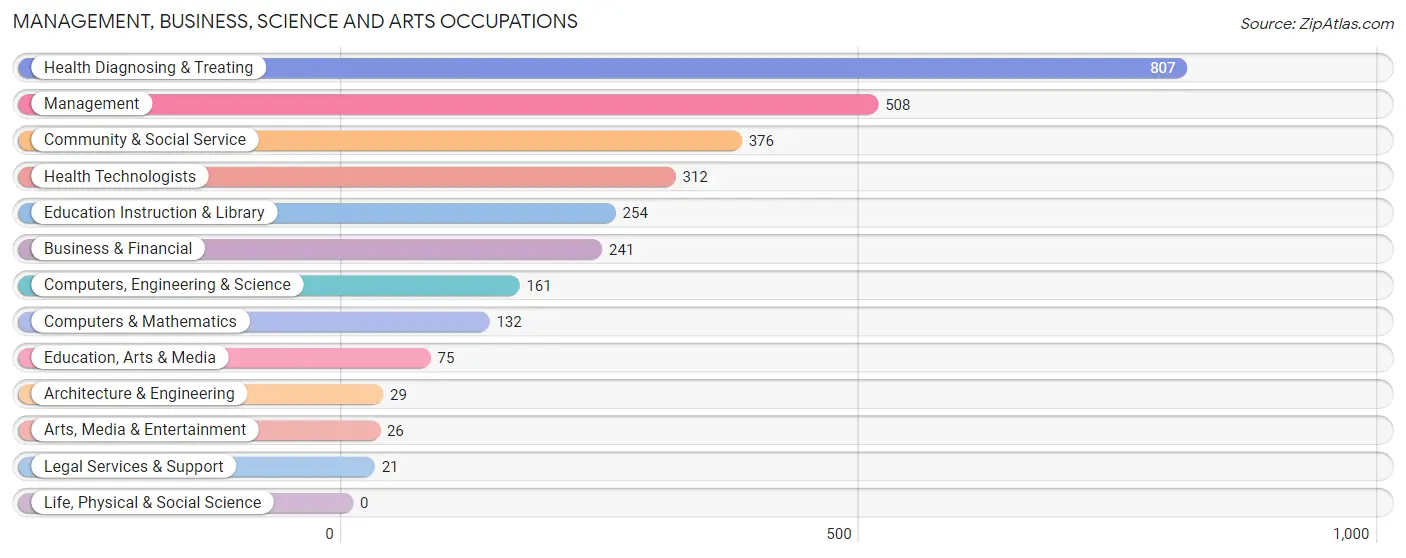
Management, Business, Science and Arts Occupations
The most common Management, Business, Science and Arts occupations in Trenton are Health Diagnosing & Treating (807 | 12.6%), Management (508 | 8.0%), Community & Social Service (376 | 5.9%), Health Technologists (312 | 4.9%), and Education Instruction & Library (254 | 4.0%).
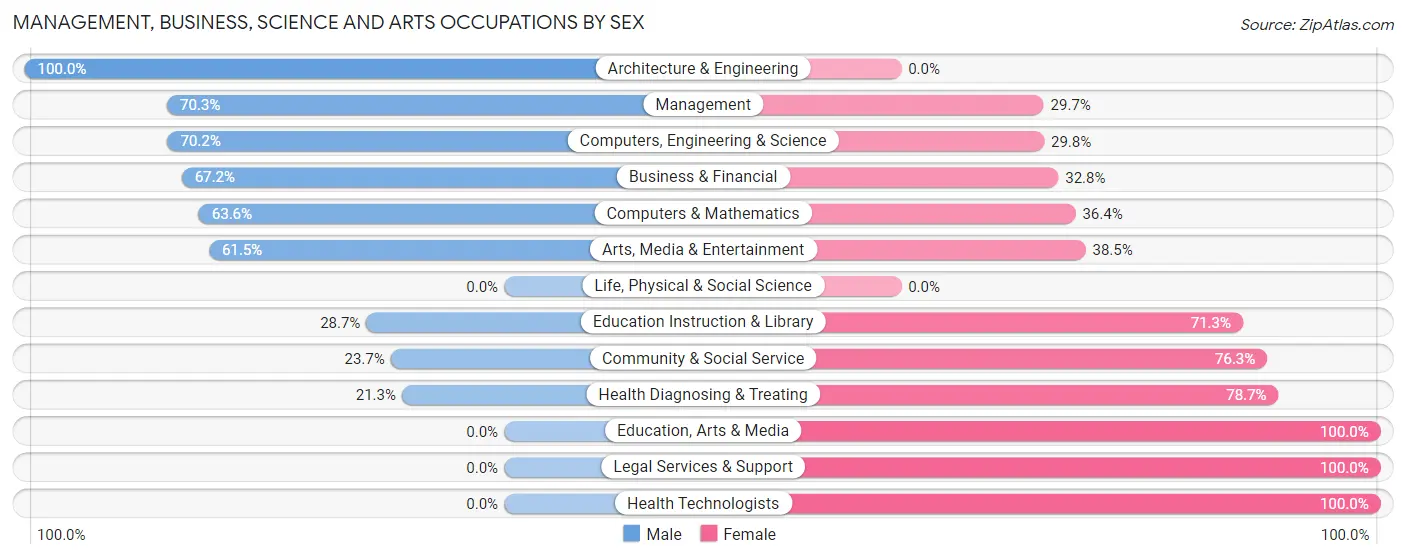
Management, Business, Science and Arts Occupations by Sex
Within the Management, Business, Science and Arts occupations in Trenton, the most male-oriented occupations are Architecture & Engineering (100.0%), Management (70.3%), and Computers, Engineering & Science (70.2%), while the most female-oriented occupations are Education, Arts & Media (100.0%), Legal Services & Support (100.0%), and Health Technologists (100.0%).
| Occupation | Male | Female |
| Management | 357 (70.3%) | 151 (29.7%) |
| Business & Financial | 162 (67.2%) | 79 (32.8%) |
| Computers, Engineering & Science | 113 (70.2%) | 48 (29.8%) |
| Computers & Mathematics | 84 (63.6%) | 48 (36.4%) |
| Architecture & Engineering | 29 (100.0%) | 0 (0.0%) |
| Life, Physical & Social Science | 0 (0.0%) | 0 (0.0%) |
| Community & Social Service | 89 (23.7%) | 287 (76.3%) |
| Education, Arts & Media | 0 (0.0%) | 75 (100.0%) |
| Legal Services & Support | 0 (0.0%) | 21 (100.0%) |
| Education Instruction & Library | 73 (28.7%) | 181 (71.3%) |
| Arts, Media & Entertainment | 16 (61.5%) | 10 (38.5%) |
| Health Diagnosing & Treating | 172 (21.3%) | 635 (78.7%) |
| Health Technologists | 0 (0.0%) | 312 (100.0%) |
| Total (Category) | 893 (42.7%) | 1,200 (57.3%) |
| Total (Overall) | 3,369 (52.7%) | 3,023 (47.3%) |
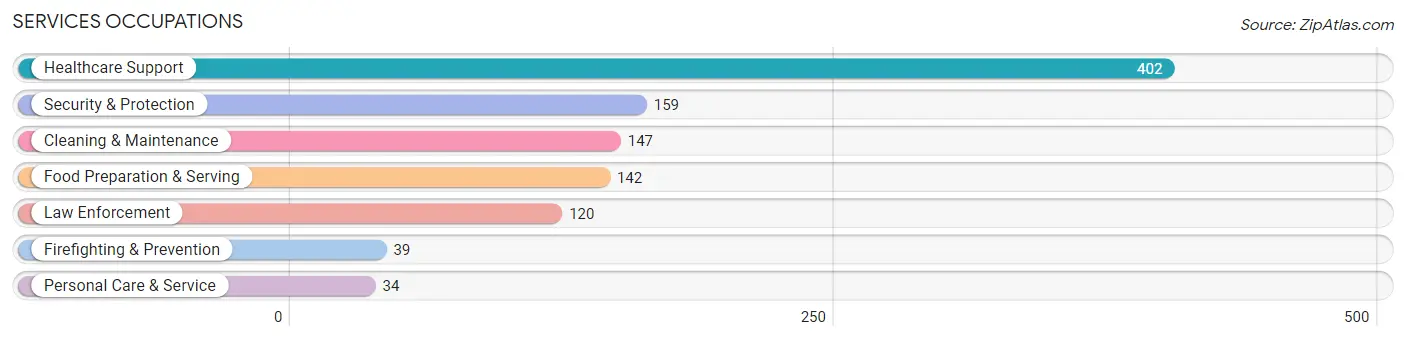
Services Occupations
The most common Services occupations in Trenton are Healthcare Support (402 | 6.3%), Security & Protection (159 | 2.5%), Cleaning & Maintenance (147 | 2.3%), Food Preparation & Serving (142 | 2.2%), and Law Enforcement (120 | 1.9%).
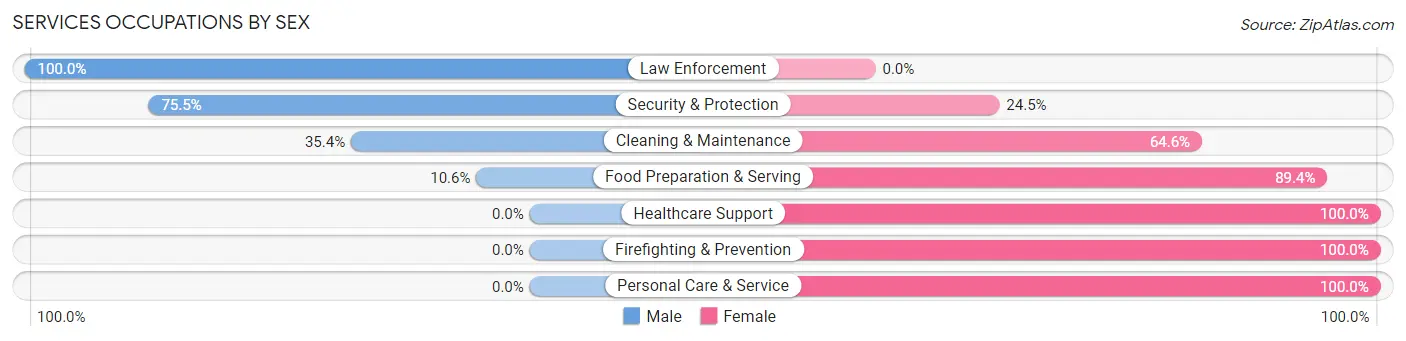
Services Occupations by Sex
Within the Services occupations in Trenton, the most male-oriented occupations are Law Enforcement (100.0%), Security & Protection (75.5%), and Cleaning & Maintenance (35.4%), while the most female-oriented occupations are Healthcare Support (100.0%), Firefighting & Prevention (100.0%), and Personal Care & Service (100.0%).
| Occupation | Male | Female |
| Healthcare Support | 0 (0.0%) | 402 (100.0%) |
| Security & Protection | 120 (75.5%) | 39 (24.5%) |
| Firefighting & Prevention | 0 (0.0%) | 39 (100.0%) |
| Law Enforcement | 120 (100.0%) | 0 (0.0%) |
| Food Preparation & Serving | 15 (10.6%) | 127 (89.4%) |
| Cleaning & Maintenance | 52 (35.4%) | 95 (64.6%) |
| Personal Care & Service | 0 (0.0%) | 34 (100.0%) |
| Total (Category) | 187 (21.1%) | 697 (78.8%) |
| Total (Overall) | 3,369 (52.7%) | 3,023 (47.3%) |
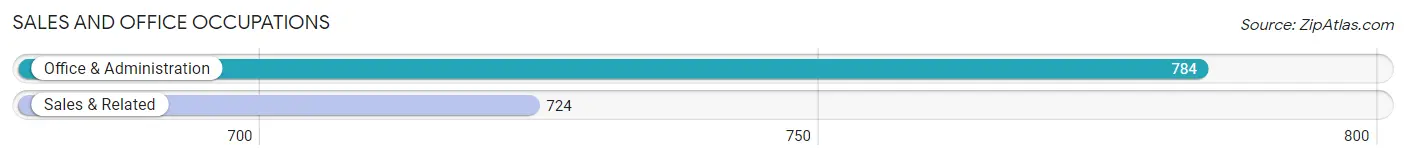
Sales and Office Occupations
The most common Sales and Office occupations in Trenton are Office & Administration (784 | 12.3%), and Sales & Related (724 | 11.3%).
Sales and Office Occupations by Sex
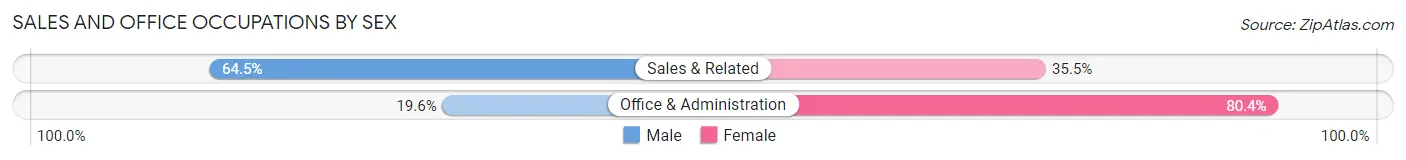
| Occupation | Male | Female |
| Sales & Related | 467 (64.5%) | 257 (35.5%) |
| Office & Administration | 154 (19.6%) | 630 (80.4%) |
| Total (Category) | 621 (41.2%) | 887 (58.8%) |
| Total (Overall) | 3,369 (52.7%) | 3,023 (47.3%) |
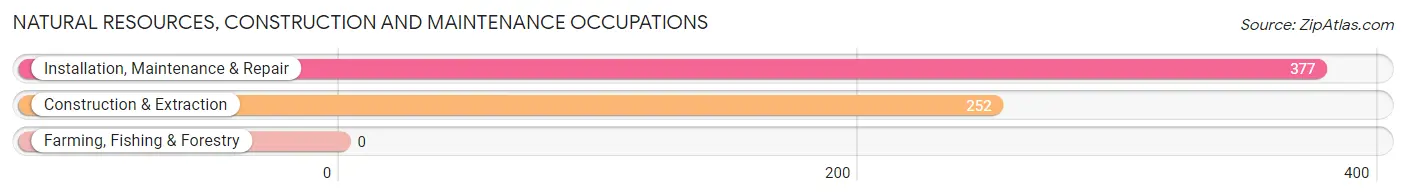
Natural Resources, Construction and Maintenance Occupations
The most common Natural Resources, Construction and Maintenance occupations in Trenton are Installation, Maintenance & Repair (377 | 5.9%), and Construction & Extraction (252 | 3.9%).
Natural Resources, Construction and Maintenance Occupations by Sex
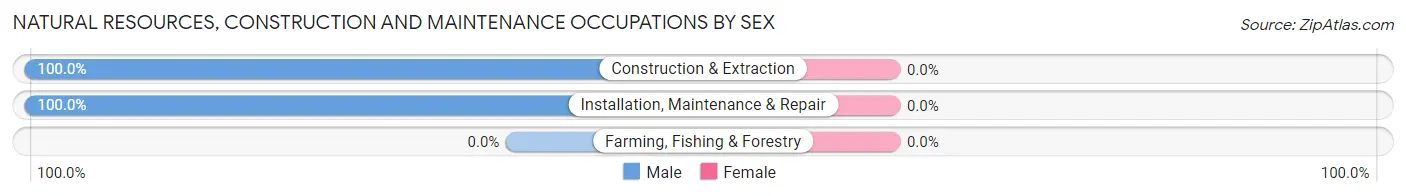
| Occupation | Male | Female |
| Farming, Fishing & Forestry | 0 (0.0%) | 0 (0.0%) |
| Construction & Extraction | 252 (100.0%) | 0 (0.0%) |
| Installation, Maintenance & Repair | 377 (100.0%) | 0 (0.0%) |
| Total (Category) | 629 (100.0%) | 0 (0.0%) |
| Total (Overall) | 3,369 (52.7%) | 3,023 (47.3%) |
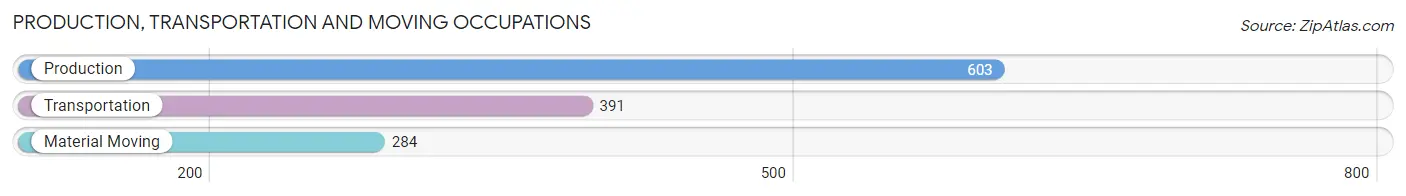
Production, Transportation and Moving Occupations
The most common Production, Transportation and Moving occupations in Trenton are Production (603 | 9.4%), Transportation (391 | 6.1%), and Material Moving (284 | 4.4%).
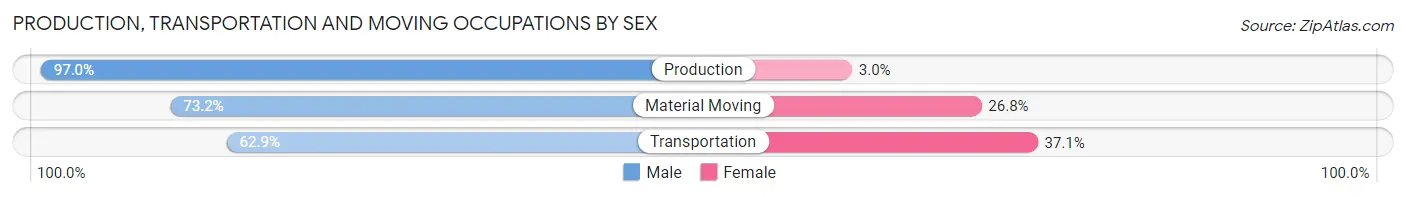
Production, Transportation and Moving Occupations by Sex
| Occupation | Male | Female |
| Production | 585 (97.0%) | 18 (3.0%) |
| Transportation | 246 (62.9%) | 145 (37.1%) |
| Material Moving | 208 (73.2%) | 76 (26.8%) |
| Total (Category) | 1,039 (81.3%) | 239 (18.7%) |
| Total (Overall) | 3,369 (52.7%) | 3,023 (47.3%) |
Employment Industries by Sex in Trenton
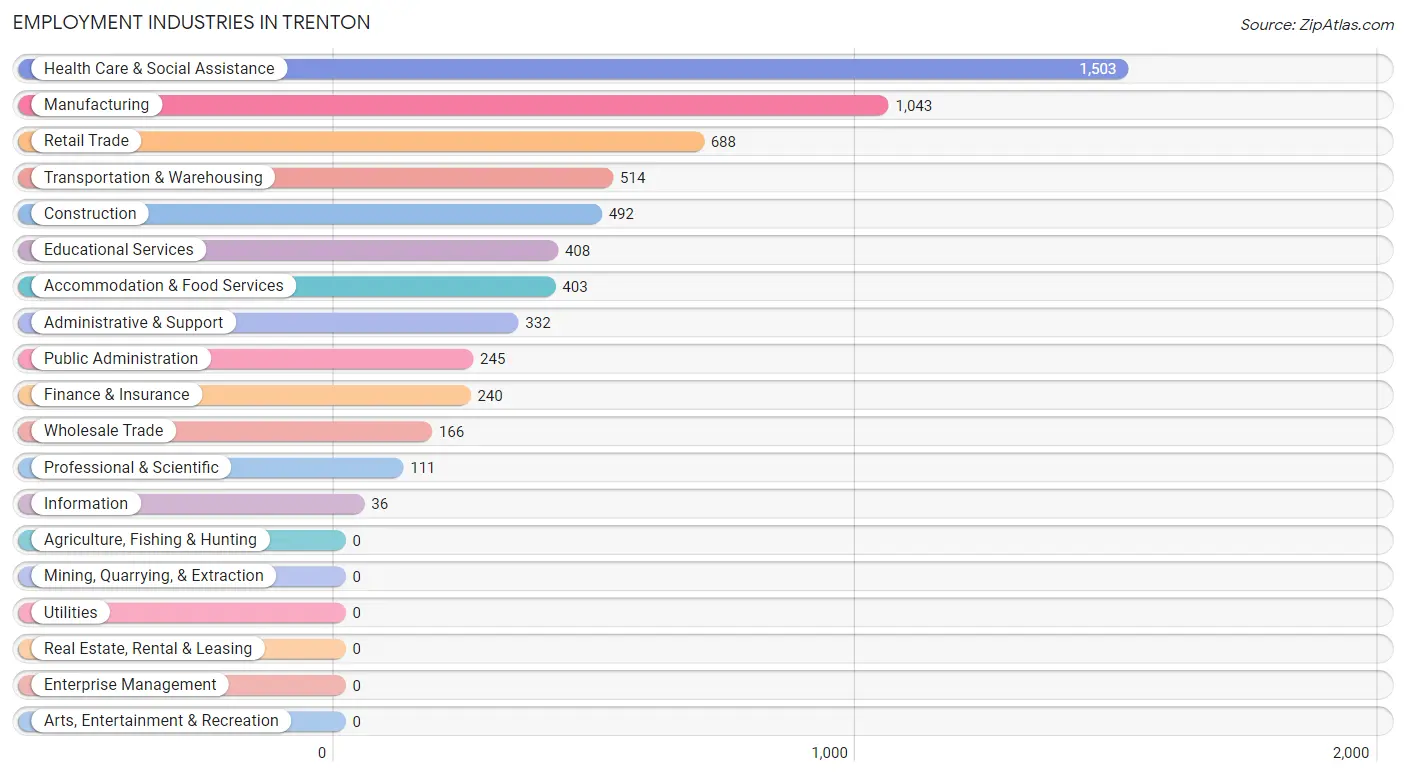
Employment Industries in Trenton
The major employment industries in Trenton include Health Care & Social Assistance (1,503 | 23.5%), Manufacturing (1,043 | 16.3%), Retail Trade (688 | 10.8%), Transportation & Warehousing (514 | 8.0%), and Construction (492 | 7.7%).
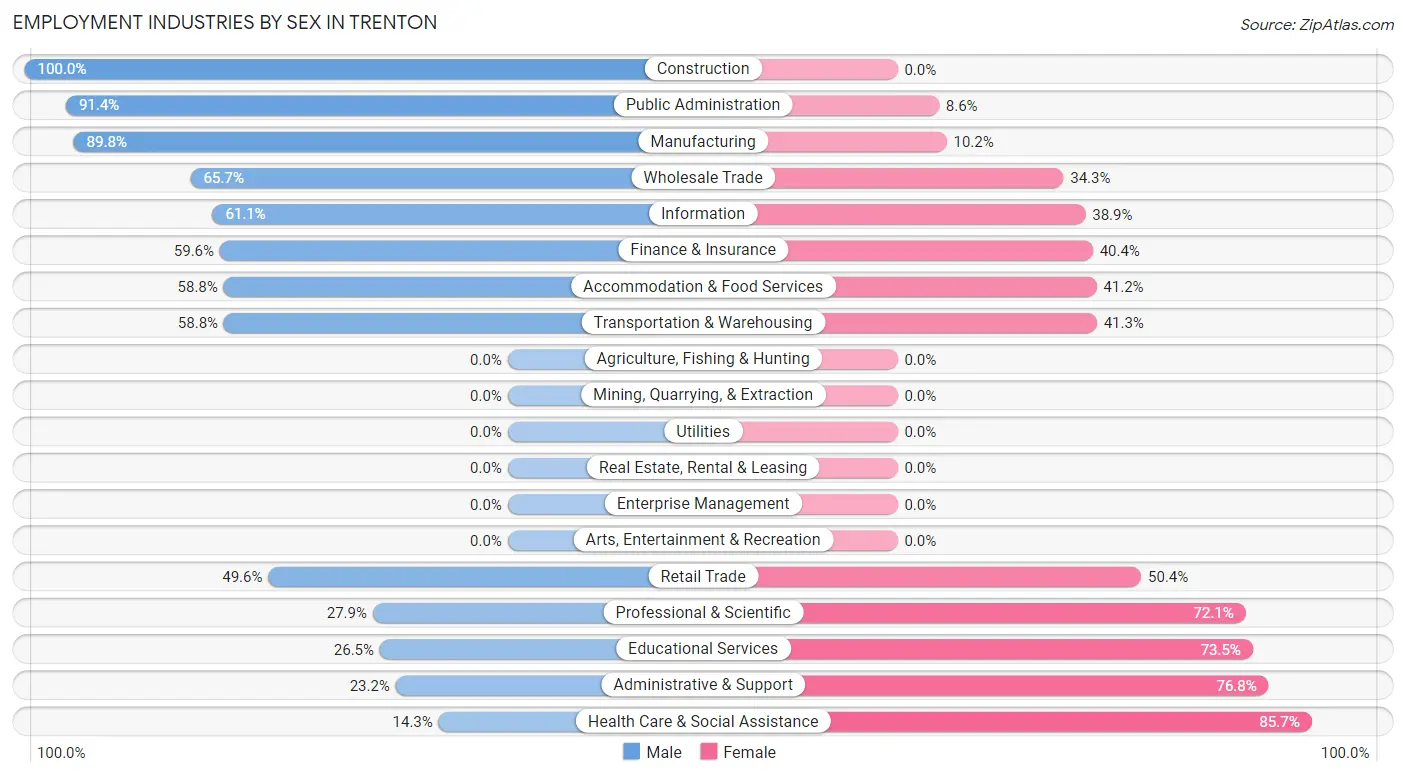
Employment Industries by Sex in Trenton
The Trenton industries that see more men than women are Construction (100.0%), Public Administration (91.4%), and Manufacturing (89.8%), whereas the industries that tend to have a higher number of women are Health Care & Social Assistance (85.7%), Administrative & Support (76.8%), and Educational Services (73.5%).
| Industry | Male | Female |
| Agriculture, Fishing & Hunting | 0 (0.0%) | 0 (0.0%) |
| Mining, Quarrying, & Extraction | 0 (0.0%) | 0 (0.0%) |
| Construction | 492 (100.0%) | 0 (0.0%) |
| Manufacturing | 937 (89.8%) | 106 (10.2%) |
| Wholesale Trade | 109 (65.7%) | 57 (34.3%) |
| Retail Trade | 341 (49.6%) | 347 (50.4%) |
| Transportation & Warehousing | 302 (58.8%) | 212 (41.2%) |
| Utilities | 0 (0.0%) | 0 (0.0%) |
| Information | 22 (61.1%) | 14 (38.9%) |
| Finance & Insurance | 143 (59.6%) | 97 (40.4%) |
| Real Estate, Rental & Leasing | 0 (0.0%) | 0 (0.0%) |
| Professional & Scientific | 31 (27.9%) | 80 (72.1%) |
| Enterprise Management | 0 (0.0%) | 0 (0.0%) |
| Administrative & Support | 77 (23.2%) | 255 (76.8%) |
| Educational Services | 108 (26.5%) | 300 (73.5%) |
| Health Care & Social Assistance | 215 (14.3%) | 1,288 (85.7%) |
| Arts, Entertainment & Recreation | 0 (0.0%) | 0 (0.0%) |
| Accommodation & Food Services | 237 (58.8%) | 166 (41.2%) |
| Public Administration | 224 (91.4%) | 21 (8.6%) |
| Total | 3,369 (52.7%) | 3,023 (47.3%) |
Education in Trenton
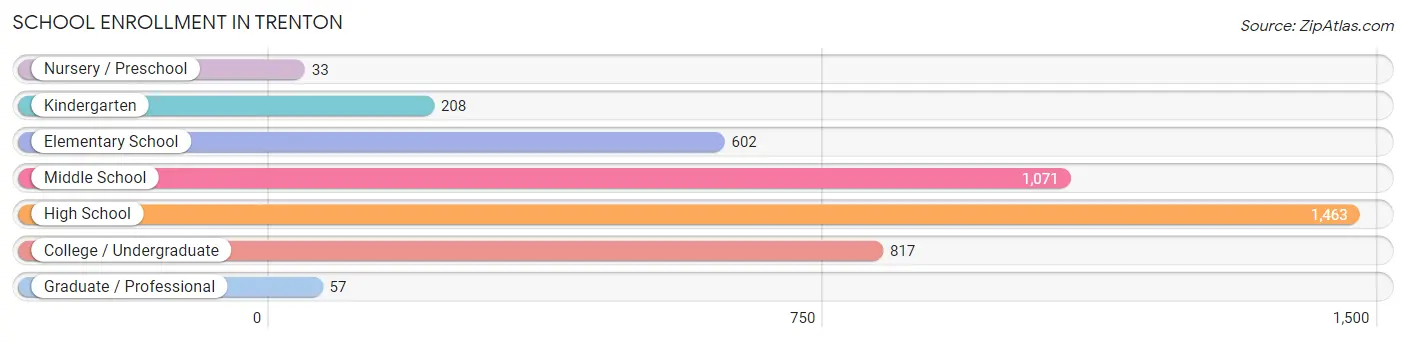
School Enrollment in Trenton
The most common levels of schooling among the 4,251 students in Trenton are high school (1,463 | 34.4%), middle school (1,071 | 25.2%), and college / undergraduate (817 | 19.2%).
| School Level | # Students | % Students |
| Nursery / Preschool | 33 | 0.8% |
| Kindergarten | 208 | 4.9% |
| Elementary School | 602 | 14.2% |
| Middle School | 1,071 | 25.2% |
| High School | 1,463 | 34.4% |
| College / Undergraduate | 817 | 19.2% |
| Graduate / Professional | 57 | 1.3% |
| Total | 4,251 | 100.0% |
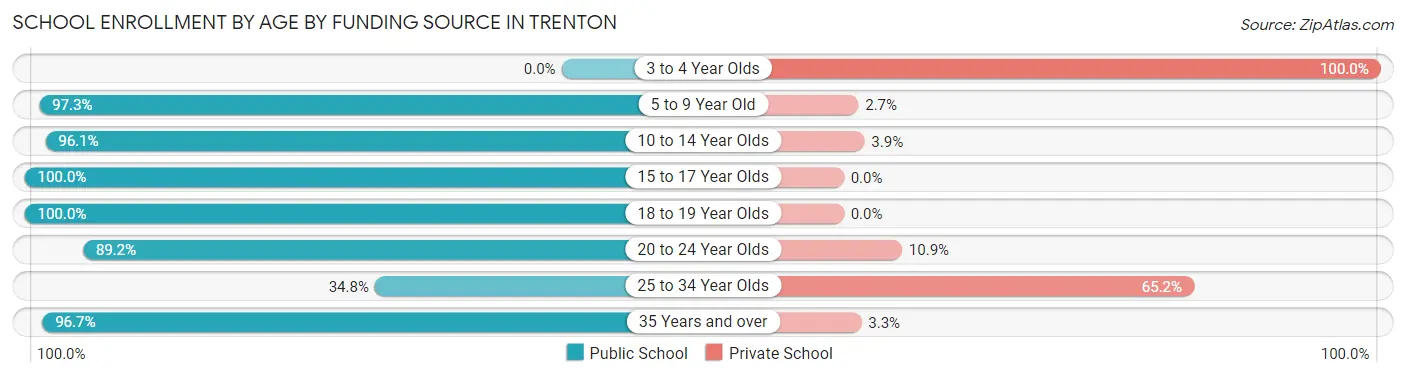
School Enrollment by Age by Funding Source in Trenton
Out of a total of 4,251 students who are enrolled in schools in Trenton, 204 (4.8%) attend a private institution, while the remaining 4,047 (95.2%) are enrolled in public schools. The age group of 3 to 4 year olds has the highest likelihood of being enrolled in private schools, with 33 (100.0% in the age bracket) enrolled. Conversely, the age group of 15 to 17 year olds has the lowest likelihood of being enrolled in a private school, with 1,037 (100.0% in the age bracket) attending a public institution.
| Age Bracket | Public School | Private School |
| 3 to 4 Year Olds | 0 (0.0%) | 33 (100.0%) |
| 5 to 9 Year Old | 751 (97.3%) | 21 (2.7%) |
| 10 to 14 Year Olds | 1,195 (96.1%) | 48 (3.9%) |
| 15 to 17 Year Olds | 1,037 (100.0%) | 0 (0.0%) |
| 18 to 19 Year Olds | 315 (100.0%) | 0 (0.0%) |
| 20 to 24 Year Olds | 345 (89.1%) | 42 (10.8%) |
| 25 to 34 Year Olds | 24 (34.8%) | 45 (65.2%) |
| 35 Years and over | 382 (96.7%) | 13 (3.3%) |
| Total | 4,047 (95.2%) | 204 (4.8%) |
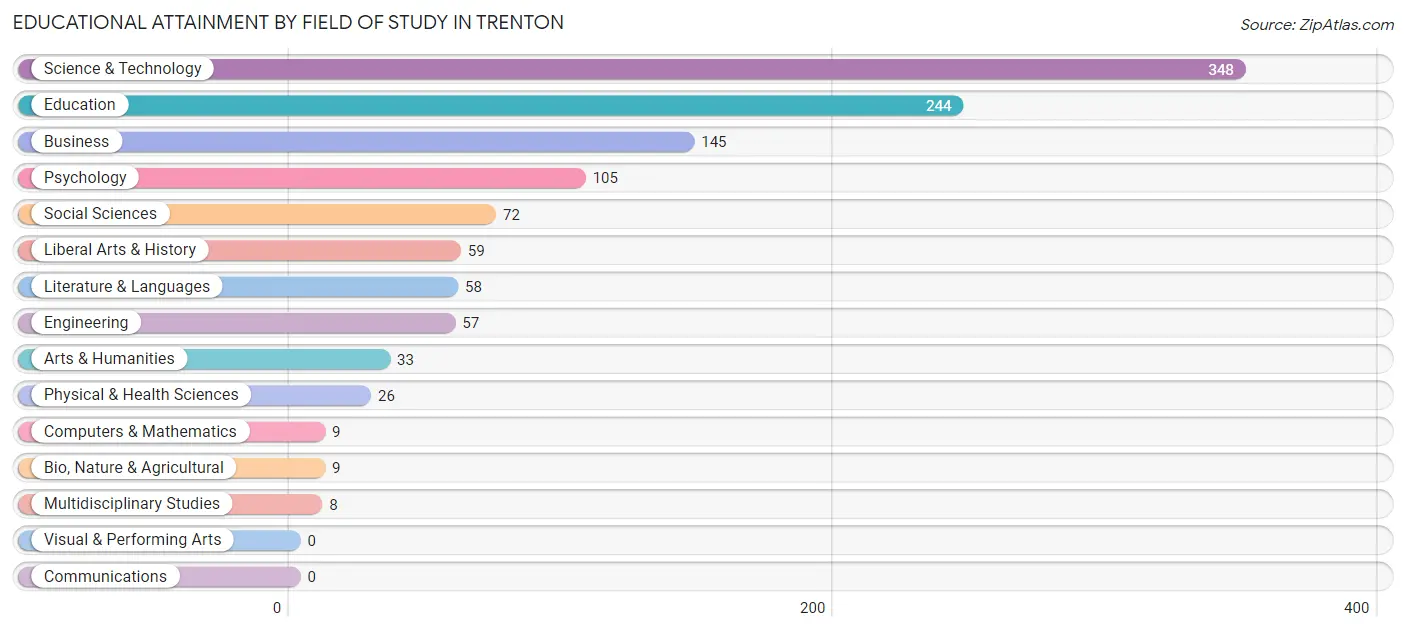
Educational Attainment by Field of Study in Trenton
Science & technology (348 | 29.7%), education (244 | 20.8%), business (145 | 12.4%), psychology (105 | 8.9%), and social sciences (72 | 6.1%) are the most common fields of study among 1,173 individuals in Trenton who have obtained a bachelor's degree or higher.
| Field of Study | # Graduates | % Graduates |
| Computers & Mathematics | 9 | 0.8% |
| Bio, Nature & Agricultural | 9 | 0.8% |
| Physical & Health Sciences | 26 | 2.2% |
| Psychology | 105 | 8.9% |
| Social Sciences | 72 | 6.1% |
| Engineering | 57 | 4.9% |
| Multidisciplinary Studies | 8 | 0.7% |
| Science & Technology | 348 | 29.7% |
| Business | 145 | 12.4% |
| Education | 244 | 20.8% |
| Literature & Languages | 58 | 4.9% |
| Liberal Arts & History | 59 | 5.0% |
| Visual & Performing Arts | 0 | 0.0% |
| Communications | 0 | 0.0% |
| Arts & Humanities | 33 | 2.8% |
| Total | 1,173 | 100.0% |
Transportation & Commute in Trenton
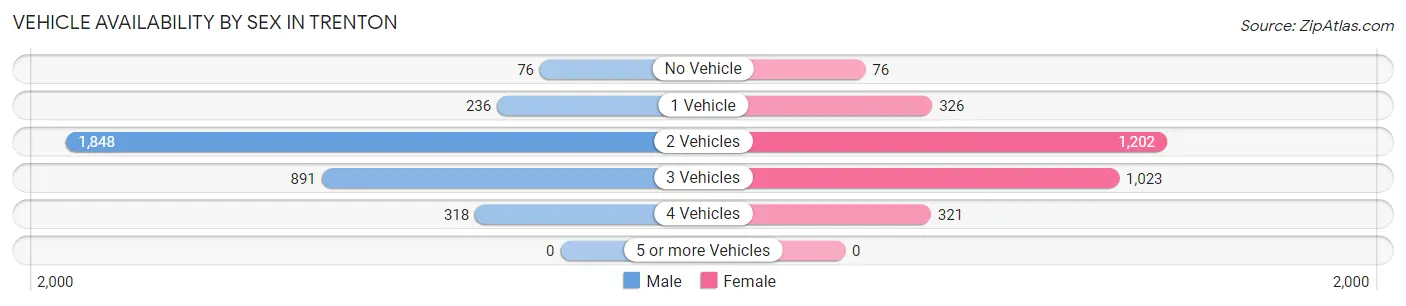
Vehicle Availability by Sex in Trenton
The most prevalent vehicle ownership categories in Trenton are males with 2 vehicles (1,848, accounting for 54.8%) and females with 2 vehicles (1,202, making up 62.7%).
| Vehicles Available | Male | Female |
| No Vehicle | 76 (2.3%) | 76 (2.6%) |
| 1 Vehicle | 236 (7.0%) | 326 (11.1%) |
| 2 Vehicles | 1,848 (54.8%) | 1,202 (40.8%) |
| 3 Vehicles | 891 (26.5%) | 1,023 (34.7%) |
| 4 Vehicles | 318 (9.4%) | 321 (10.9%) |
| 5 or more Vehicles | 0 (0.0%) | 0 (0.0%) |
| Total | 3,369 (100.0%) | 2,948 (100.0%) |
Commute Time in Trenton
The most frequently occuring commute durations in Trenton are 20 to 24 minutes (1,396 commuters, 23.8%), 45 to 59 minutes (774 commuters, 13.2%), and 25 to 29 minutes (682 commuters, 11.6%).
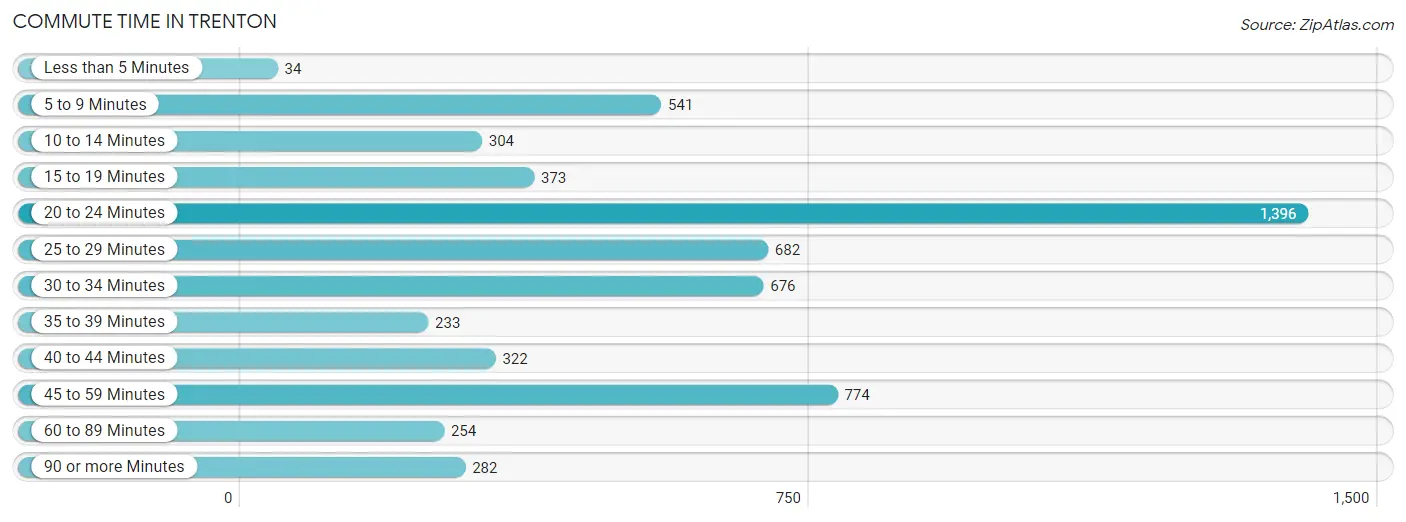
| Commute Time | # Commuters | % Commuters |
| Less than 5 Minutes | 34 | 0.6% |
| 5 to 9 Minutes | 541 | 9.2% |
| 10 to 14 Minutes | 304 | 5.2% |
| 15 to 19 Minutes | 373 | 6.4% |
| 20 to 24 Minutes | 1,396 | 23.8% |
| 25 to 29 Minutes | 682 | 11.6% |
| 30 to 34 Minutes | 676 | 11.5% |
| 35 to 39 Minutes | 233 | 4.0% |
| 40 to 44 Minutes | 322 | 5.5% |
| 45 to 59 Minutes | 774 | 13.2% |
| 60 to 89 Minutes | 254 | 4.3% |
| 90 or more Minutes | 282 | 4.8% |
Commute Time by Sex in Trenton
The most common commute times in Trenton are 20 to 24 minutes (669 commuters, 21.0%) for males and 20 to 24 minutes (727 commuters, 27.0%) for females.
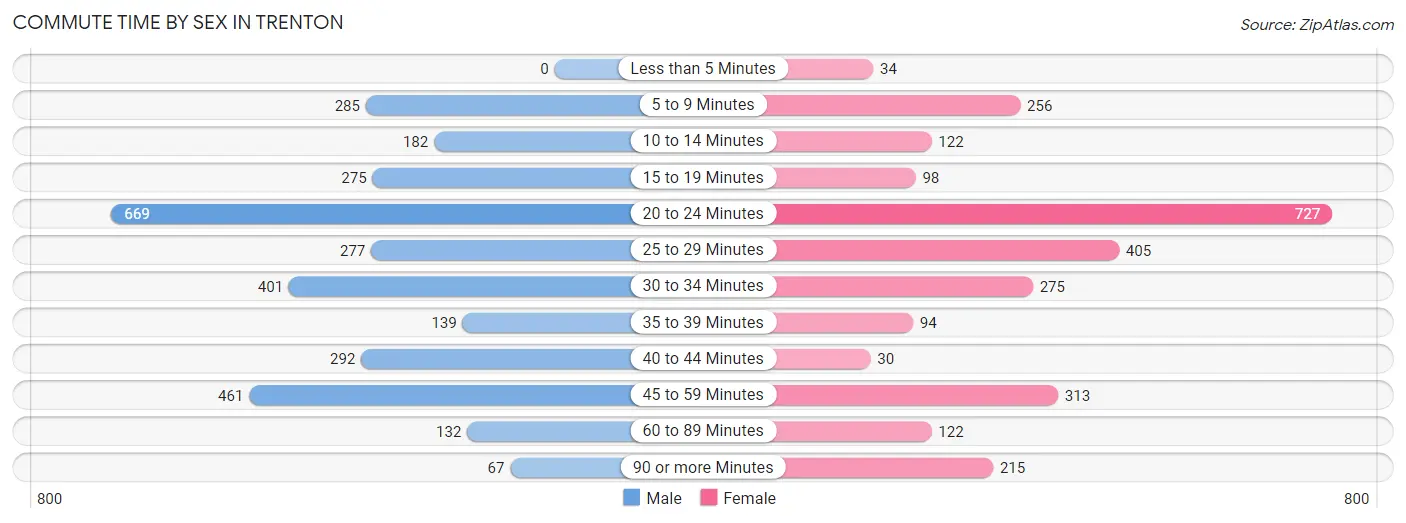
| Commute Time | Male | Female |
| Less than 5 Minutes | 0 (0.0%) | 34 (1.3%) |
| 5 to 9 Minutes | 285 (9.0%) | 256 (9.5%) |
| 10 to 14 Minutes | 182 (5.7%) | 122 (4.5%) |
| 15 to 19 Minutes | 275 (8.6%) | 98 (3.6%) |
| 20 to 24 Minutes | 669 (21.0%) | 727 (27.0%) |
| 25 to 29 Minutes | 277 (8.7%) | 405 (15.0%) |
| 30 to 34 Minutes | 401 (12.6%) | 275 (10.2%) |
| 35 to 39 Minutes | 139 (4.4%) | 94 (3.5%) |
| 40 to 44 Minutes | 292 (9.2%) | 30 (1.1%) |
| 45 to 59 Minutes | 461 (14.5%) | 313 (11.6%) |
| 60 to 89 Minutes | 132 (4.2%) | 122 (4.5%) |
| 90 or more Minutes | 67 (2.1%) | 215 (8.0%) |
Time of Departure to Work by Sex in Trenton
The most frequent times of departure to work in Trenton are 6:00 AM to 6:29 AM (608, 19.1%) for males and 6:30 AM to 6:59 AM (477, 17.7%) for females.
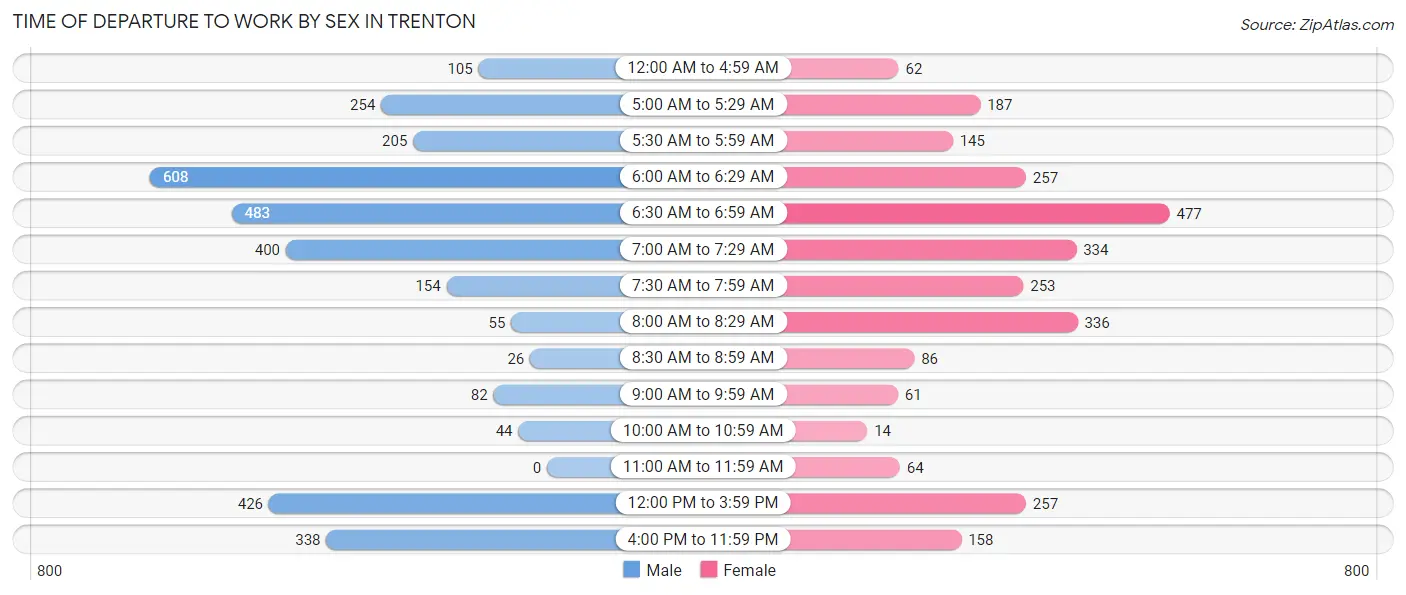
| Time of Departure | Male | Female |
| 12:00 AM to 4:59 AM | 105 (3.3%) | 62 (2.3%) |
| 5:00 AM to 5:29 AM | 254 (8.0%) | 187 (7.0%) |
| 5:30 AM to 5:59 AM | 205 (6.5%) | 145 (5.4%) |
| 6:00 AM to 6:29 AM | 608 (19.1%) | 257 (9.6%) |
| 6:30 AM to 6:59 AM | 483 (15.2%) | 477 (17.7%) |
| 7:00 AM to 7:29 AM | 400 (12.6%) | 334 (12.4%) |
| 7:30 AM to 7:59 AM | 154 (4.8%) | 253 (9.4%) |
| 8:00 AM to 8:29 AM | 55 (1.7%) | 336 (12.5%) |
| 8:30 AM to 8:59 AM | 26 (0.8%) | 86 (3.2%) |
| 9:00 AM to 9:59 AM | 82 (2.6%) | 61 (2.3%) |
| 10:00 AM to 10:59 AM | 44 (1.4%) | 14 (0.5%) |
| 11:00 AM to 11:59 AM | 0 (0.0%) | 64 (2.4%) |
| 12:00 PM to 3:59 PM | 426 (13.4%) | 257 (9.6%) |
| 4:00 PM to 11:59 PM | 338 (10.6%) | 158 (5.9%) |
| Total | 3,180 (100.0%) | 2,691 (100.0%) |
Housing Occupancy in Trenton
Occupancy by Ownership in Trenton
Of the total 4,418 dwellings in Trenton, owner-occupied units account for 3,091 (70.0%), while renter-occupied units make up 1,327 (30.0%).
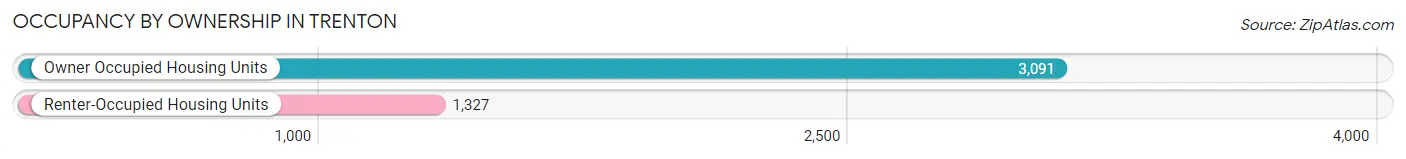
| Occupancy | # Housing Units | % Housing Units |
| Owner Occupied Housing Units | 3,091 | 70.0% |
| Renter-Occupied Housing Units | 1,327 | 30.0% |
| Total Occupied Housing Units | 4,418 | 100.0% |
Occupancy by Household Size in Trenton
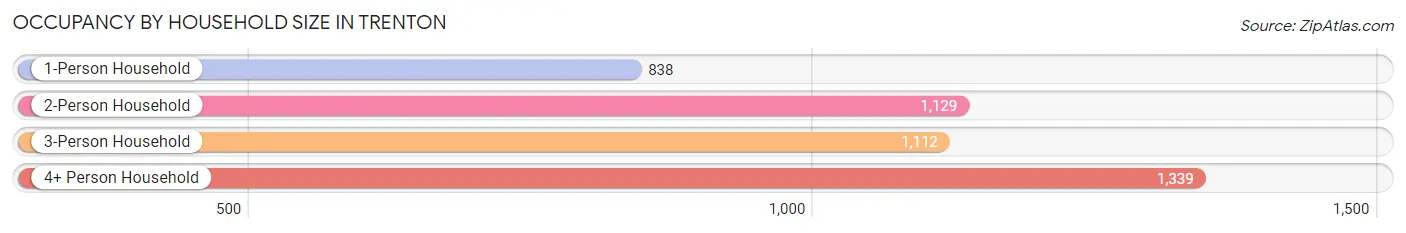
| Household Size | # Housing Units | % Housing Units |
| 1-Person Household | 838 | 19.0% |
| 2-Person Household | 1,129 | 25.6% |
| 3-Person Household | 1,112 | 25.2% |
| 4+ Person Household | 1,339 | 30.3% |
| Total Housing Units | 4,418 | 100.0% |
Occupancy by Ownership by Household Size in Trenton
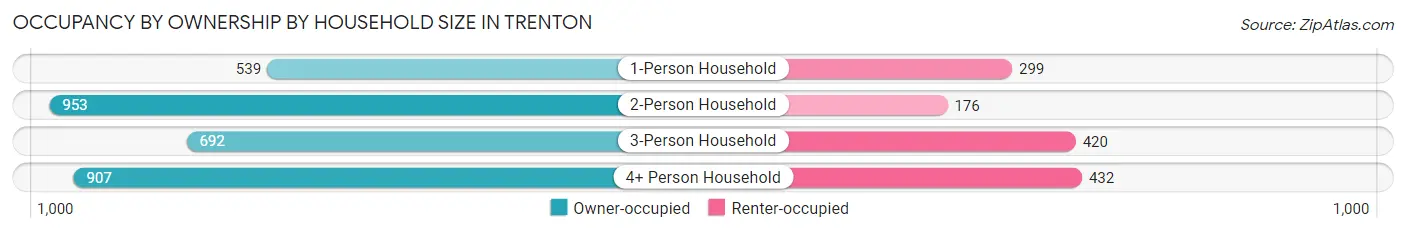
| Household Size | Owner-occupied | Renter-occupied |
| 1-Person Household | 539 (64.3%) | 299 (35.7%) |
| 2-Person Household | 953 (84.4%) | 176 (15.6%) |
| 3-Person Household | 692 (62.2%) | 420 (37.8%) |
| 4+ Person Household | 907 (67.7%) | 432 (32.3%) |
| Total Housing Units | 3,091 (70.0%) | 1,327 (30.0%) |
Occupancy by Educational Attainment in Trenton
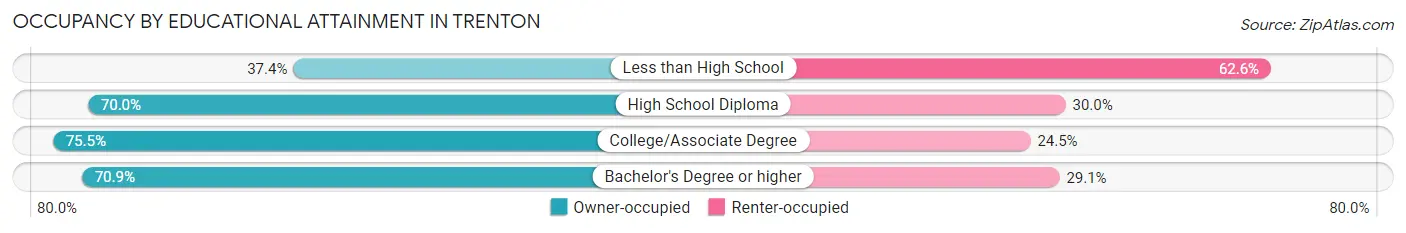
| Household Size | Owner-occupied | Renter-occupied |
| Less than High School | 126 (37.4%) | 211 (62.6%) |
| High School Diploma | 1,076 (70.0%) | 462 (30.0%) |
| College/Associate Degree | 1,401 (75.5%) | 454 (24.5%) |
| Bachelor's Degree or higher | 488 (70.9%) | 200 (29.1%) |
Occupancy by Age of Householder in Trenton
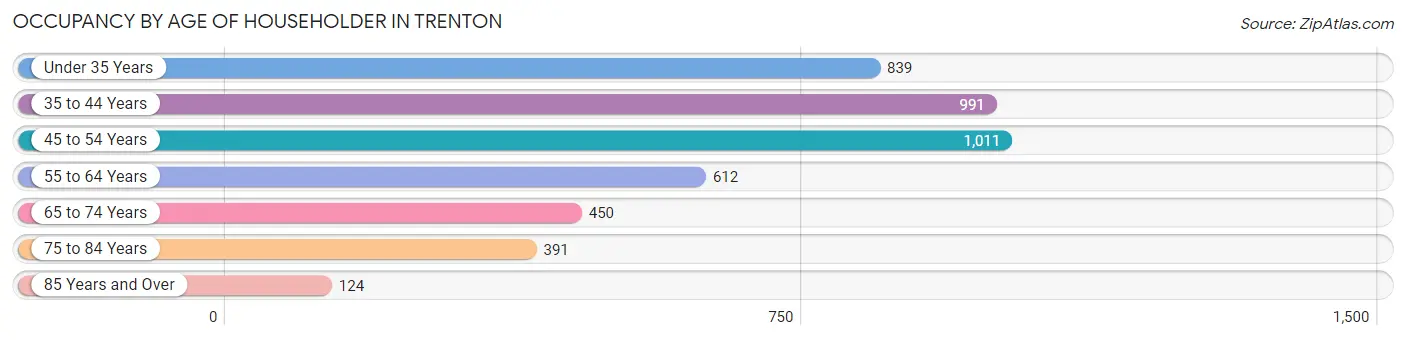
| Age Bracket | # Households | % Households |
| Under 35 Years | 839 | 19.0% |
| 35 to 44 Years | 991 | 22.4% |
| 45 to 54 Years | 1,011 | 22.9% |
| 55 to 64 Years | 612 | 13.9% |
| 65 to 74 Years | 450 | 10.2% |
| 75 to 84 Years | 391 | 8.8% |
| 85 Years and Over | 124 | 2.8% |
| Total | 4,418 | 100.0% |
Housing Finances in Trenton
Median Income by Occupancy in Trenton
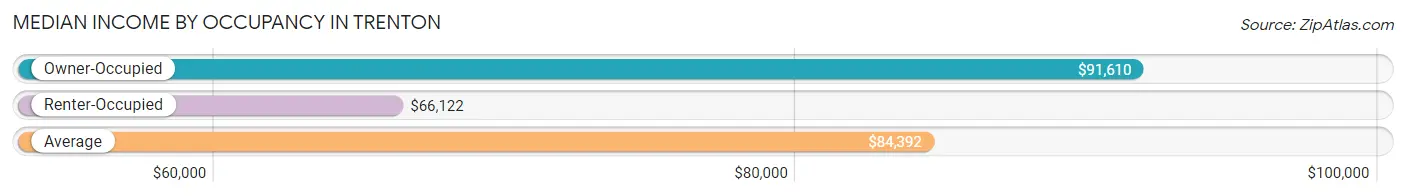
| Occupancy Type | # Households | Median Income |
| Owner-Occupied | 3,091 (70.0%) | $91,610 |
| Renter-Occupied | 1,327 (30.0%) | $66,122 |
| Average | 4,418 (100.0%) | $84,392 |
Occupancy by Householder Income Bracket in Trenton
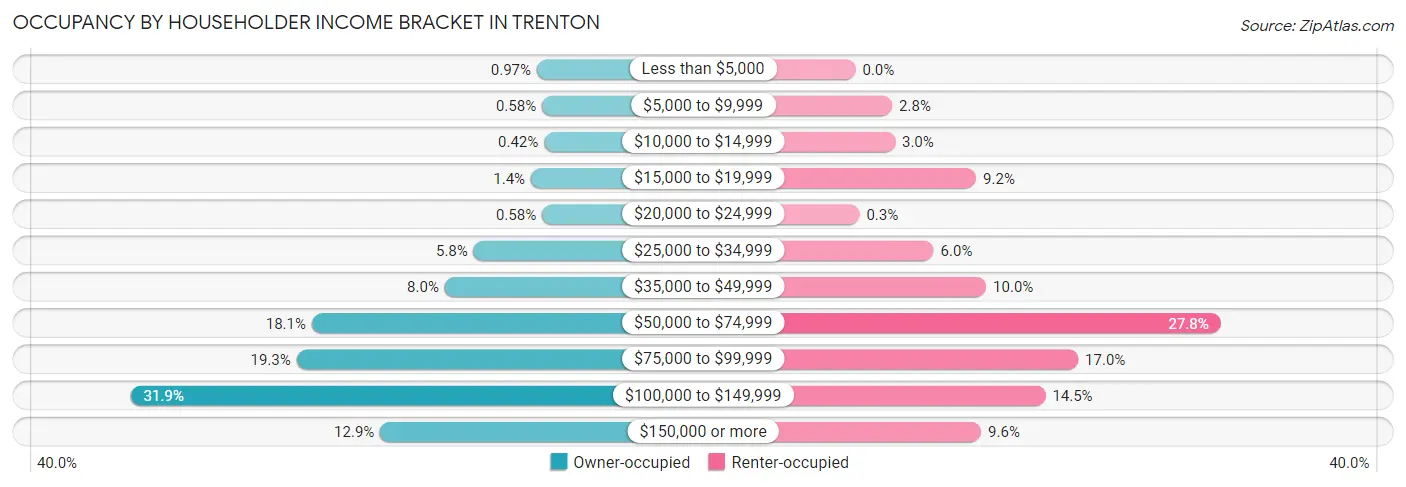
| Income Bracket | Owner-occupied | Renter-occupied |
| Less than $5,000 | 30 (1.0%) | 0 (0.0%) |
| $5,000 to $9,999 | 18 (0.6%) | 37 (2.8%) |
| $10,000 to $14,999 | 13 (0.4%) | 40 (3.0%) |
| $15,000 to $19,999 | 44 (1.4%) | 122 (9.2%) |
| $20,000 to $24,999 | 18 (0.6%) | 4 (0.3%) |
| $25,000 to $34,999 | 179 (5.8%) | 79 (5.9%) |
| $35,000 to $49,999 | 247 (8.0%) | 132 (10.0%) |
| $50,000 to $74,999 | 560 (18.1%) | 369 (27.8%) |
| $75,000 to $99,999 | 596 (19.3%) | 225 (17.0%) |
| $100,000 to $149,999 | 987 (31.9%) | 192 (14.5%) |
| $150,000 or more | 399 (12.9%) | 127 (9.6%) |
| Total | 3,091 (100.0%) | 1,327 (100.0%) |
Monthly Housing Cost Tiers in Trenton
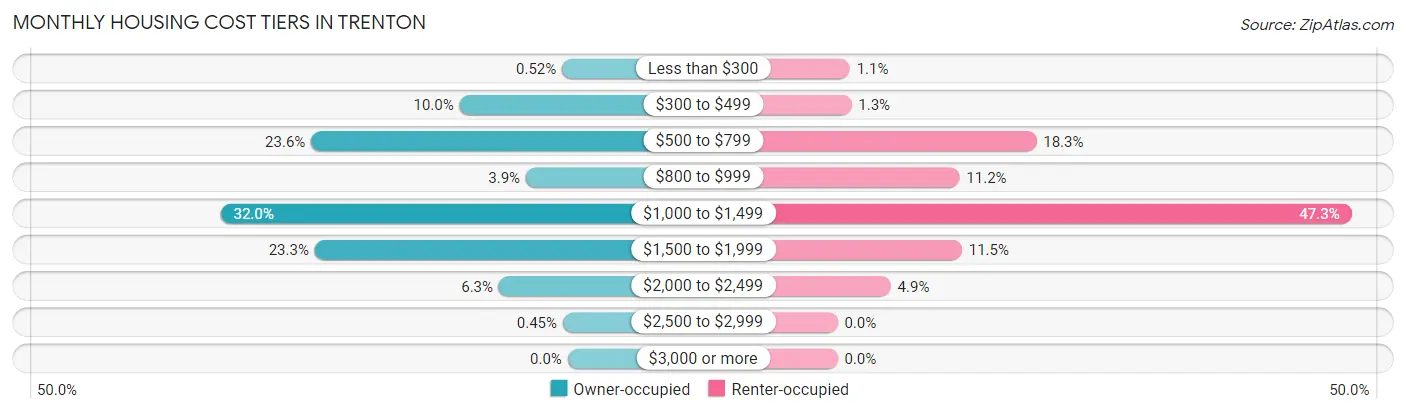
| Monthly Cost | Owner-occupied | Renter-occupied |
| Less than $300 | 16 (0.5%) | 15 (1.1%) |
| $300 to $499 | 308 (10.0%) | 17 (1.3%) |
| $500 to $799 | 730 (23.6%) | 243 (18.3%) |
| $800 to $999 | 119 (3.8%) | 149 (11.2%) |
| $1,000 to $1,499 | 988 (32.0%) | 628 (47.3%) |
| $1,500 to $1,999 | 720 (23.3%) | 152 (11.5%) |
| $2,000 to $2,499 | 196 (6.3%) | 65 (4.9%) |
| $2,500 to $2,999 | 14 (0.4%) | 0 (0.0%) |
| $3,000 or more | 0 (0.0%) | 0 (0.0%) |
| Total | 3,091 (100.0%) | 1,327 (100.0%) |
Physical Housing Characteristics in Trenton
Housing Structures in Trenton
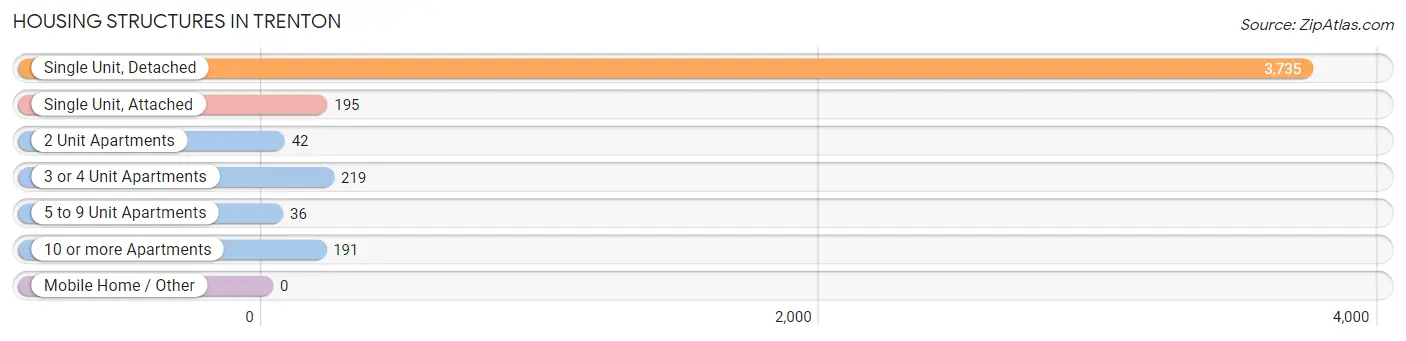
| Structure Type | # Housing Units | % Housing Units |
| Single Unit, Detached | 3,735 | 84.5% |
| Single Unit, Attached | 195 | 4.4% |
| 2 Unit Apartments | 42 | 0.9% |
| 3 or 4 Unit Apartments | 219 | 5.0% |
| 5 to 9 Unit Apartments | 36 | 0.8% |
| 10 or more Apartments | 191 | 4.3% |
| Mobile Home / Other | 0 | 0.0% |
| Total | 4,418 | 100.0% |
Housing Structures by Occupancy in Trenton
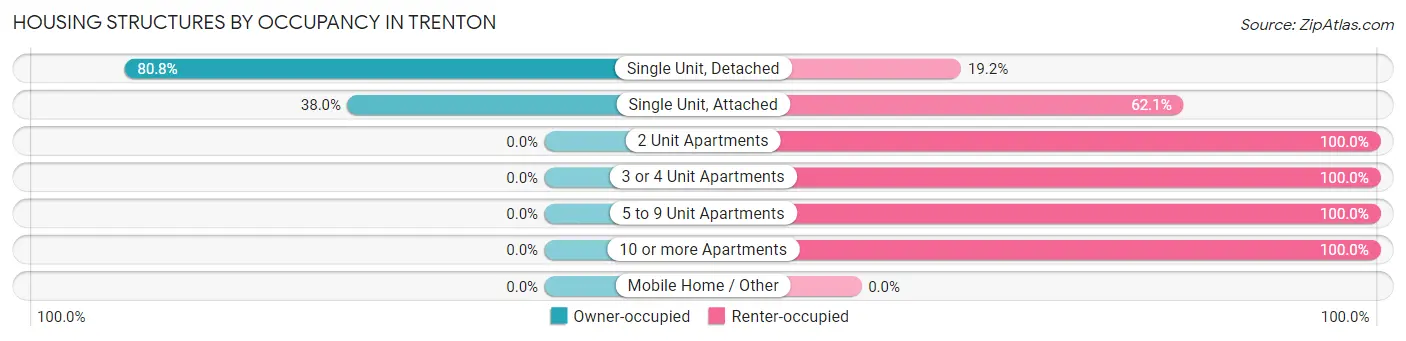
| Structure Type | Owner-occupied | Renter-occupied |
| Single Unit, Detached | 3,017 (80.8%) | 718 (19.2%) |
| Single Unit, Attached | 74 (38.0%) | 121 (62.1%) |
| 2 Unit Apartments | 0 (0.0%) | 42 (100.0%) |
| 3 or 4 Unit Apartments | 0 (0.0%) | 219 (100.0%) |
| 5 to 9 Unit Apartments | 0 (0.0%) | 36 (100.0%) |
| 10 or more Apartments | 0 (0.0%) | 191 (100.0%) |
| Mobile Home / Other | 0 (0.0%) | 0 (0.0%) |
| Total | 3,091 (70.0%) | 1,327 (30.0%) |
Housing Structures by Number of Rooms in Trenton
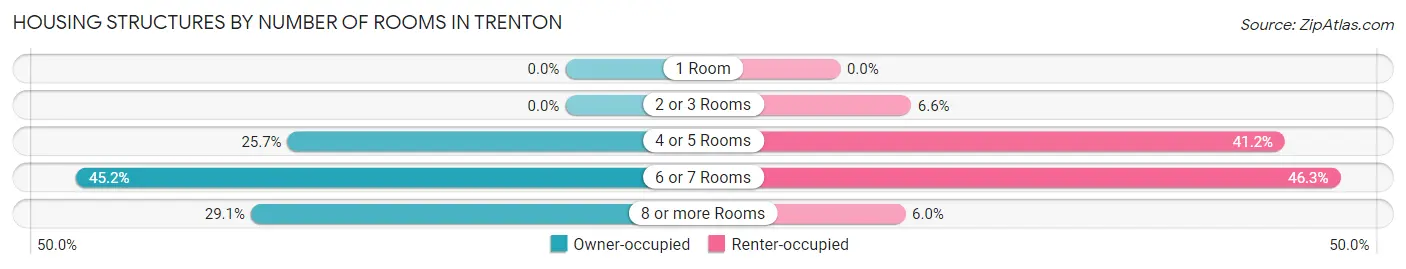
| Number of Rooms | Owner-occupied | Renter-occupied |
| 1 Room | 0 (0.0%) | 0 (0.0%) |
| 2 or 3 Rooms | 0 (0.0%) | 87 (6.6%) |
| 4 or 5 Rooms | 794 (25.7%) | 546 (41.1%) |
| 6 or 7 Rooms | 1,398 (45.2%) | 614 (46.3%) |
| 8 or more Rooms | 899 (29.1%) | 80 (6.0%) |
| Total | 3,091 (100.0%) | 1,327 (100.0%) |
Housing Structure by Heating Type in Trenton
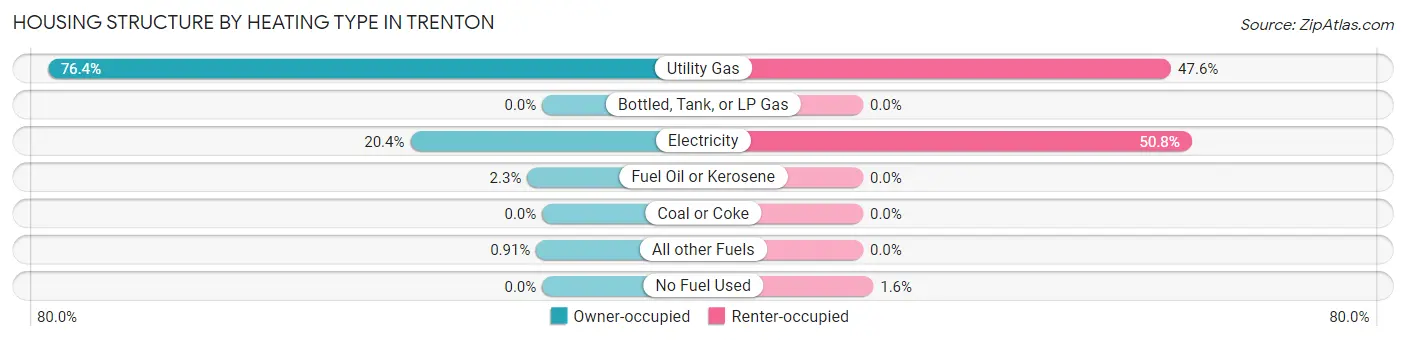
| Heating Type | Owner-occupied | Renter-occupied |
| Utility Gas | 2,362 (76.4%) | 632 (47.6%) |
| Bottled, Tank, or LP Gas | 0 (0.0%) | 0 (0.0%) |
| Electricity | 630 (20.4%) | 674 (50.8%) |
| Fuel Oil or Kerosene | 71 (2.3%) | 0 (0.0%) |
| Coal or Coke | 0 (0.0%) | 0 (0.0%) |
| All other Fuels | 28 (0.9%) | 0 (0.0%) |
| No Fuel Used | 0 (0.0%) | 21 (1.6%) |
| Total | 3,091 (100.0%) | 1,327 (100.0%) |
Household Vehicle Usage in Trenton
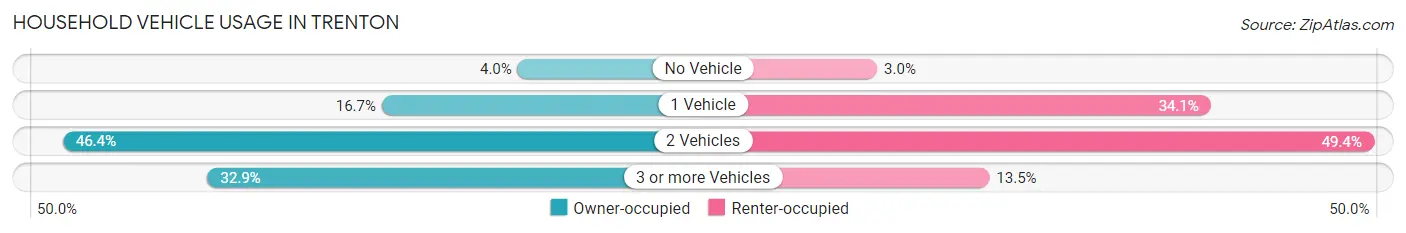
| Vehicles per Household | Owner-occupied | Renter-occupied |
| No Vehicle | 123 (4.0%) | 40 (3.0%) |
| 1 Vehicle | 515 (16.7%) | 453 (34.1%) |
| 2 Vehicles | 1,435 (46.4%) | 655 (49.4%) |
| 3 or more Vehicles | 1,018 (32.9%) | 179 (13.5%) |
| Total | 3,091 (100.0%) | 1,327 (100.0%) |
Real Estate & Mortgages in Trenton
Real Estate and Mortgage Overview in Trenton
| Characteristic | Without Mortgage | With Mortgage |
| Housing Units | 896 | 2,195 |
| Median Property Value | $147,400 | $193,500 |
| Median Household Income | $75,217 | $376 |
| Monthly Housing Costs | $547 | $0 |
| Real Estate Taxes | $2,138 | $92 |
Property Value by Mortgage Status in Trenton
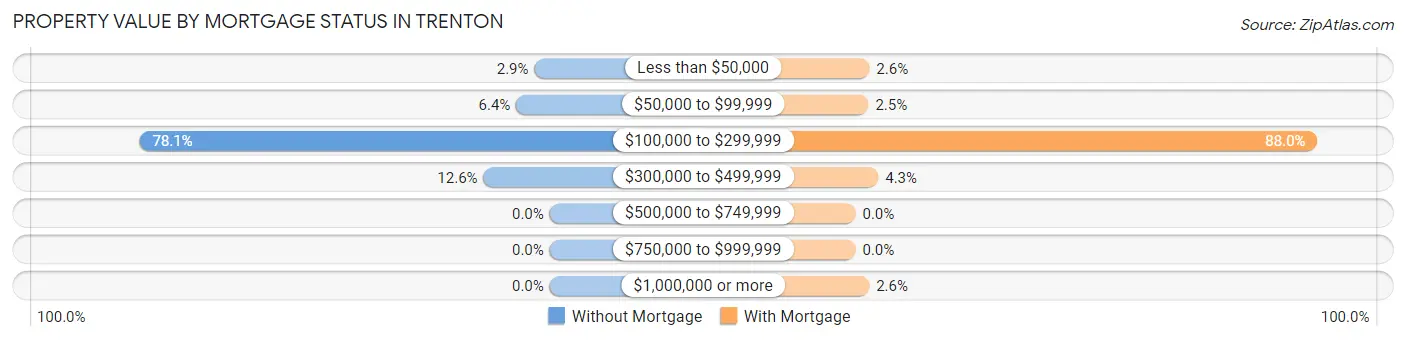
| Property Value | Without Mortgage | With Mortgage |
| Less than $50,000 | 26 (2.9%) | 58 (2.6%) |
| $50,000 to $99,999 | 57 (6.4%) | 54 (2.5%) |
| $100,000 to $299,999 | 700 (78.1%) | 1,931 (88.0%) |
| $300,000 to $499,999 | 113 (12.6%) | 95 (4.3%) |
| $500,000 to $749,999 | 0 (0.0%) | 0 (0.0%) |
| $750,000 to $999,999 | 0 (0.0%) | 0 (0.0%) |
| $1,000,000 or more | 0 (0.0%) | 57 (2.6%) |
| Total | 896 (100.0%) | 2,195 (100.0%) |
Household Income by Mortgage Status in Trenton
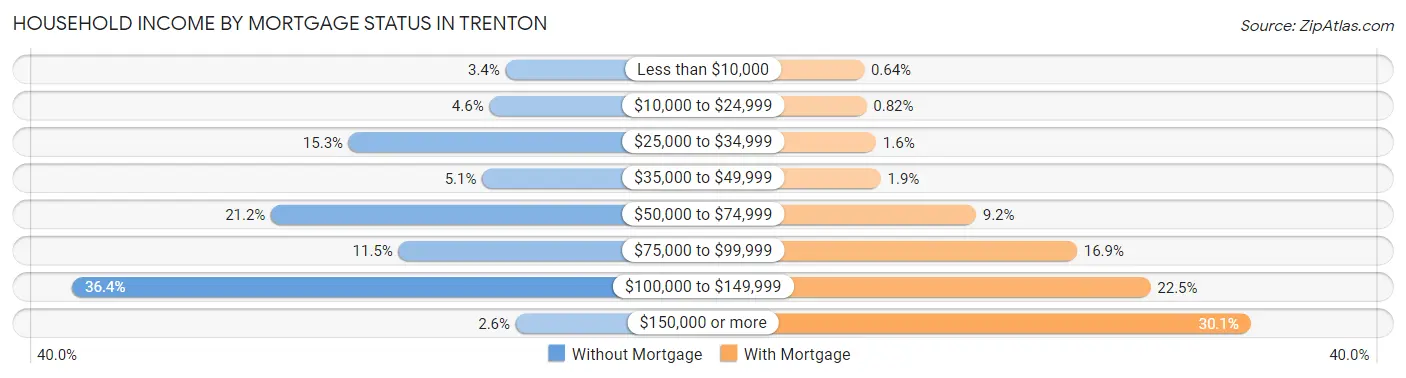
| Household Income | Without Mortgage | With Mortgage |
| Less than $10,000 | 30 (3.4%) | 14 (0.6%) |
| $10,000 to $24,999 | 41 (4.6%) | 18 (0.8%) |
| $25,000 to $34,999 | 137 (15.3%) | 34 (1.5%) |
| $35,000 to $49,999 | 46 (5.1%) | 42 (1.9%) |
| $50,000 to $74,999 | 190 (21.2%) | 201 (9.2%) |
| $75,000 to $99,999 | 103 (11.5%) | 370 (16.9%) |
| $100,000 to $149,999 | 326 (36.4%) | 493 (22.5%) |
| $150,000 or more | 23 (2.6%) | 661 (30.1%) |
| Total | 896 (100.0%) | 2,195 (100.0%) |
Property Value to Household Income Ratio in Trenton
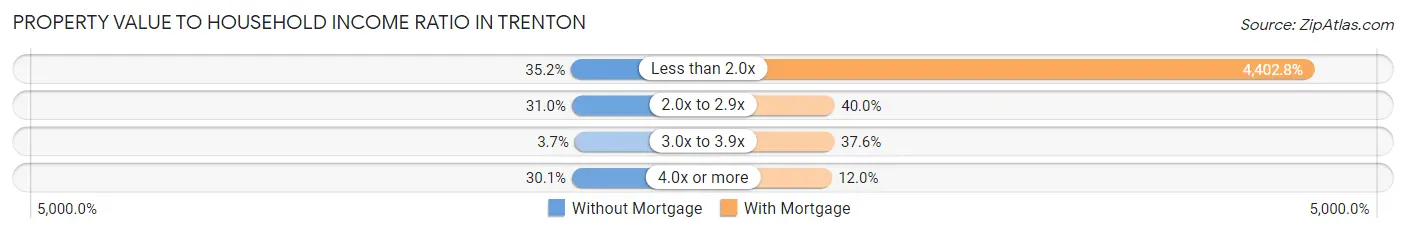
| Value-to-Income Ratio | Without Mortgage | With Mortgage |
| Less than 2.0x | 315 (35.2%) | 96,641 (4,402.8%) |
| 2.0x to 2.9x | 278 (31.0%) | 878 (40.0%) |
| 3.0x to 3.9x | 33 (3.7%) | 826 (37.6%) |
| 4.0x or more | 270 (30.1%) | 263 (12.0%) |
| Total | 896 (100.0%) | 2,195 (100.0%) |
Real Estate Taxes by Mortgage Status in Trenton
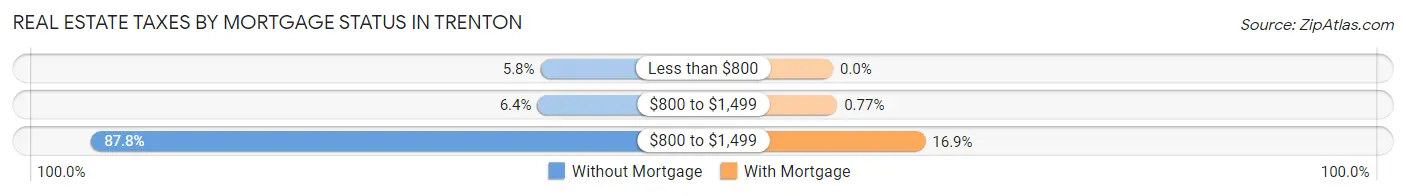
| Property Taxes | Without Mortgage | With Mortgage |
| Less than $800 | 52 (5.8%) | 0 (0.0%) |
| $800 to $1,499 | 57 (6.4%) | 17 (0.8%) |
| $800 to $1,499 | 787 (87.8%) | 370 (16.9%) |
| Total | 896 (100.0%) | 2,195 (100.0%) |
Health & Disability in Trenton
Health Insurance Coverage by Age in Trenton
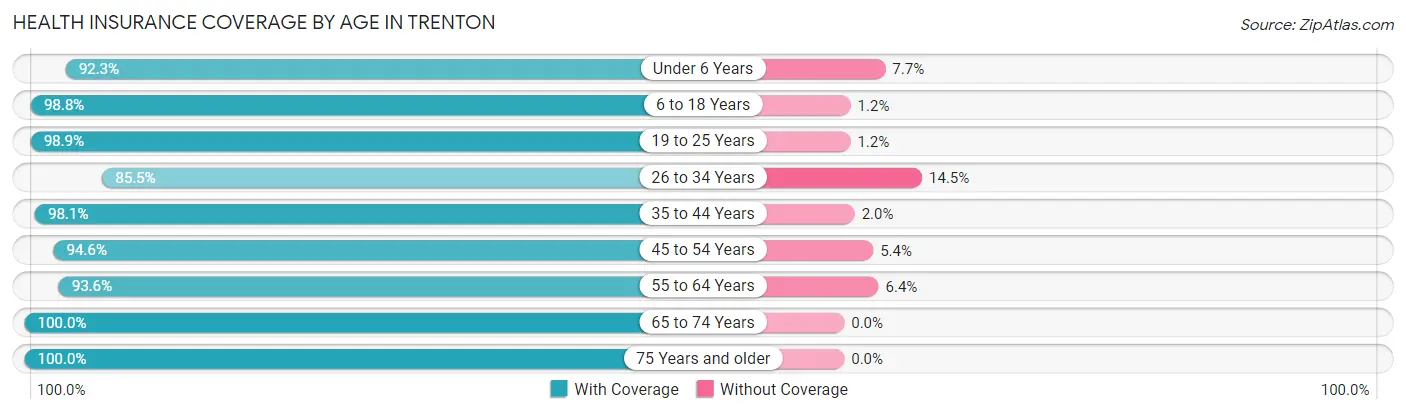
| Age Bracket | With Coverage | Without Coverage |
| Under 6 Years | 710 (92.3%) | 59 (7.7%) |
| 6 to 18 Years | 3,416 (98.8%) | 41 (1.2%) |
| 19 to 25 Years | 1,119 (98.9%) | 13 (1.1%) |
| 26 to 34 Years | 1,125 (85.5%) | 191 (14.5%) |
| 35 to 44 Years | 1,811 (98.1%) | 36 (1.9%) |
| 45 to 54 Years | 1,630 (94.6%) | 93 (5.4%) |
| 55 to 64 Years | 1,171 (93.6%) | 80 (6.4%) |
| 65 to 74 Years | 809 (100.0%) | 0 (0.0%) |
| 75 Years and older | 829 (100.0%) | 0 (0.0%) |
| Total | 12,620 (96.1%) | 513 (3.9%) |
Health Insurance Coverage by Citizenship Status in Trenton
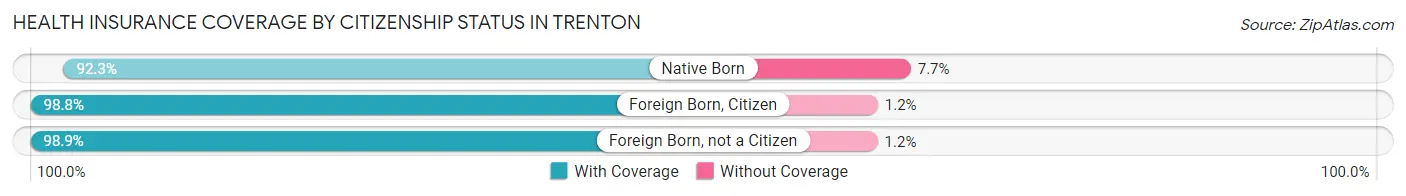
| Citizenship Status | With Coverage | Without Coverage |
| Native Born | 710 (92.3%) | 59 (7.7%) |
| Foreign Born, Citizen | 3,416 (98.8%) | 41 (1.2%) |
| Foreign Born, not a Citizen | 1,119 (98.9%) | 13 (1.1%) |
Health Insurance Coverage by Household Income in Trenton
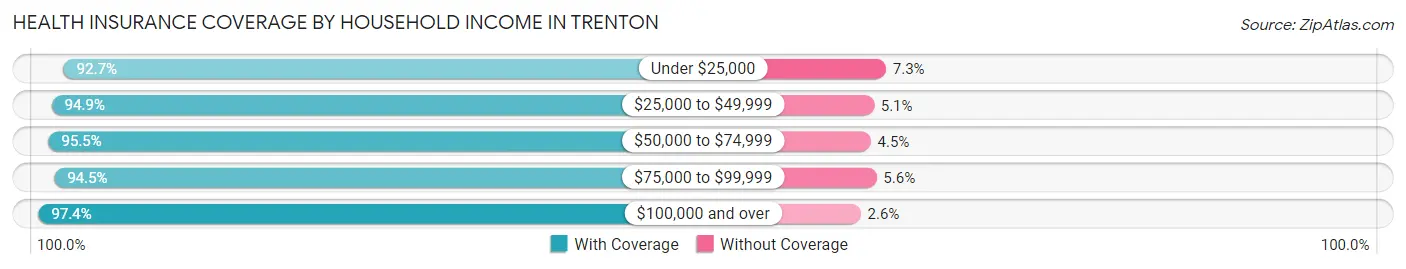
| Household Income | With Coverage | Without Coverage |
| Under $25,000 | 494 (92.7%) | 39 (7.3%) |
| $25,000 to $49,999 | 1,388 (94.9%) | 74 (5.1%) |
| $50,000 to $74,999 | 2,355 (95.5%) | 110 (4.5%) |
| $75,000 to $99,999 | 2,093 (94.5%) | 123 (5.6%) |
| $100,000 and over | 6,290 (97.4%) | 167 (2.6%) |
Public vs Private Health Insurance Coverage by Age in Trenton
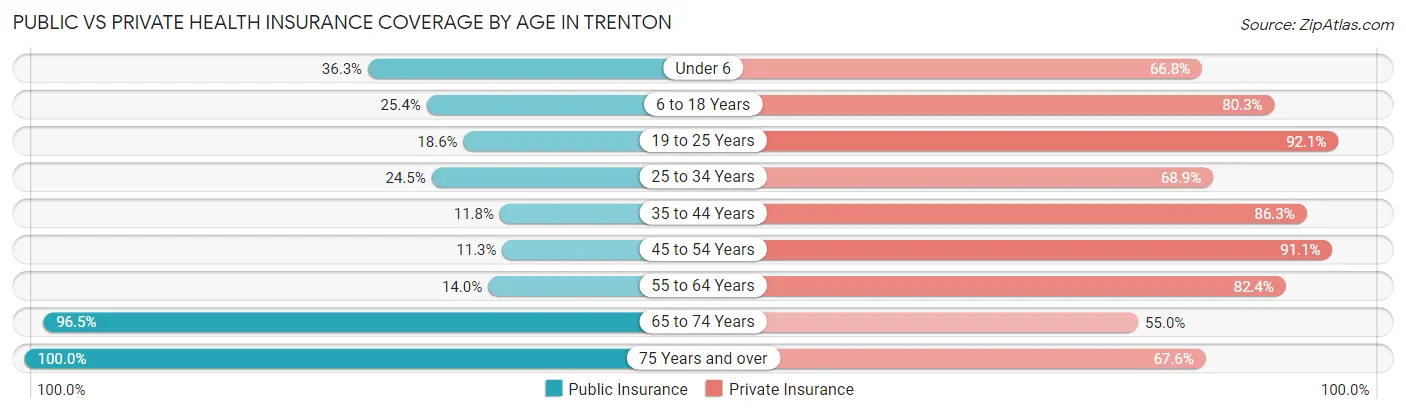
| Age Bracket | Public Insurance | Private Insurance |
| Under 6 | 279 (36.3%) | 514 (66.8%) |
| 6 to 18 Years | 877 (25.4%) | 2,776 (80.3%) |
| 19 to 25 Years | 210 (18.5%) | 1,043 (92.1%) |
| 25 to 34 Years | 322 (24.5%) | 907 (68.9%) |
| 35 to 44 Years | 218 (11.8%) | 1,593 (86.3%) |
| 45 to 54 Years | 195 (11.3%) | 1,569 (91.1%) |
| 55 to 64 Years | 175 (14.0%) | 1,031 (82.4%) |
| 65 to 74 Years | 781 (96.5%) | 445 (55.0%) |
| 75 Years and over | 829 (100.0%) | 560 (67.5%) |
| Total | 3,886 (29.6%) | 10,438 (79.5%) |
Disability Status by Sex by Age in Trenton
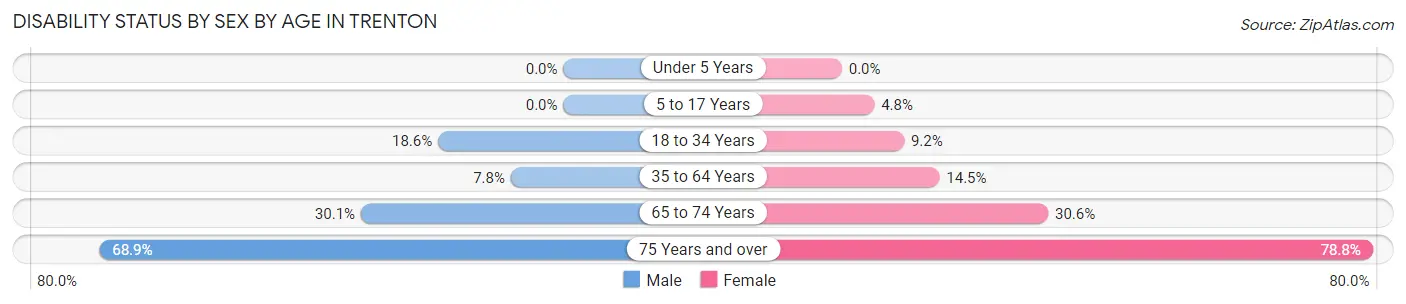
| Age Bracket | Male | Female |
| Under 5 Years | 0 (0.0%) | 0 (0.0%) |
| 5 to 17 Years | 0 (0.0%) | 74 (4.8%) |
| 18 to 34 Years | 258 (18.6%) | 125 (9.2%) |
| 35 to 64 Years | 206 (7.8%) | 316 (14.5%) |
| 65 to 74 Years | 95 (30.1%) | 151 (30.6%) |
| 75 Years and over | 288 (68.9%) | 324 (78.8%) |
Disability Class by Sex by Age in Trenton
Disability Class: Hearing Difficulty
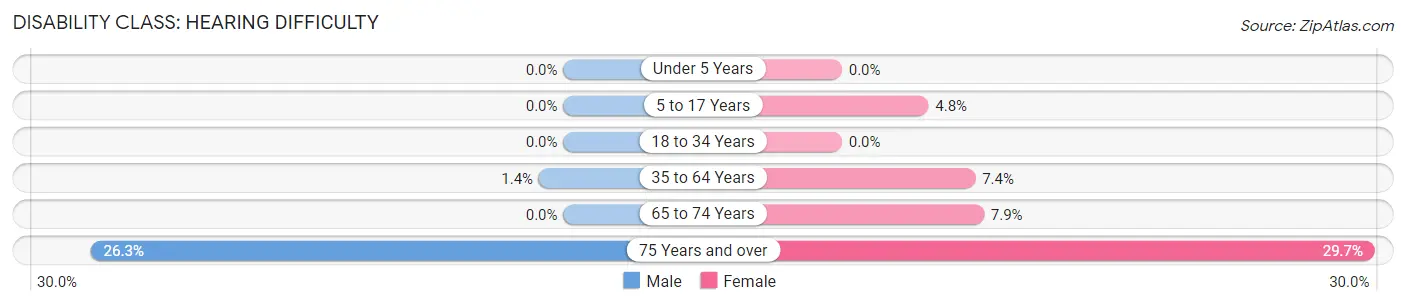
| Age Bracket | Male | Female |
| Under 5 Years | 0 (0.0%) | 0 (0.0%) |
| 5 to 17 Years | 0 (0.0%) | 74 (4.8%) |
| 18 to 34 Years | 0 (0.0%) | 0 (0.0%) |
| 35 to 64 Years | 36 (1.4%) | 162 (7.4%) |
| 65 to 74 Years | 0 (0.0%) | 39 (7.9%) |
| 75 Years and over | 110 (26.3%) | 122 (29.7%) |
Disability Class: Vision Difficulty
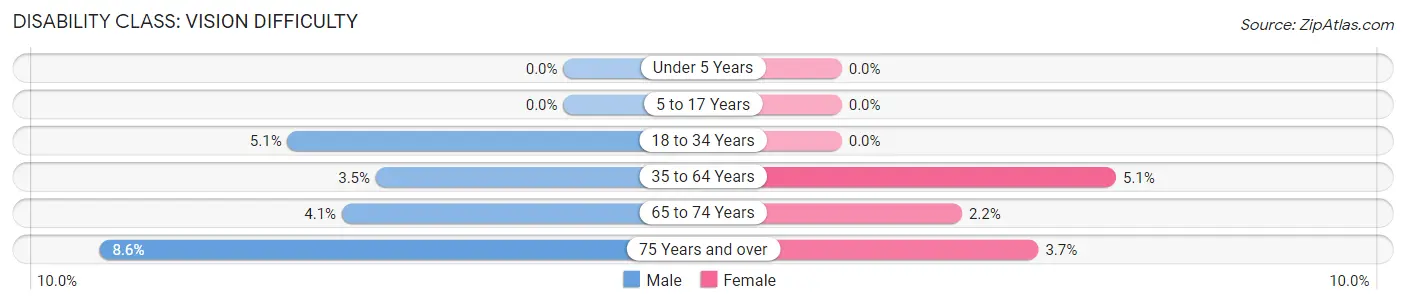
| Age Bracket | Male | Female |
| Under 5 Years | 0 (0.0%) | 0 (0.0%) |
| 5 to 17 Years | 0 (0.0%) | 0 (0.0%) |
| 18 to 34 Years | 71 (5.1%) | 0 (0.0%) |
| 35 to 64 Years | 92 (3.5%) | 111 (5.1%) |
| 65 to 74 Years | 13 (4.1%) | 11 (2.2%) |
| 75 Years and over | 36 (8.6%) | 15 (3.6%) |
Disability Class: Cognitive Difficulty
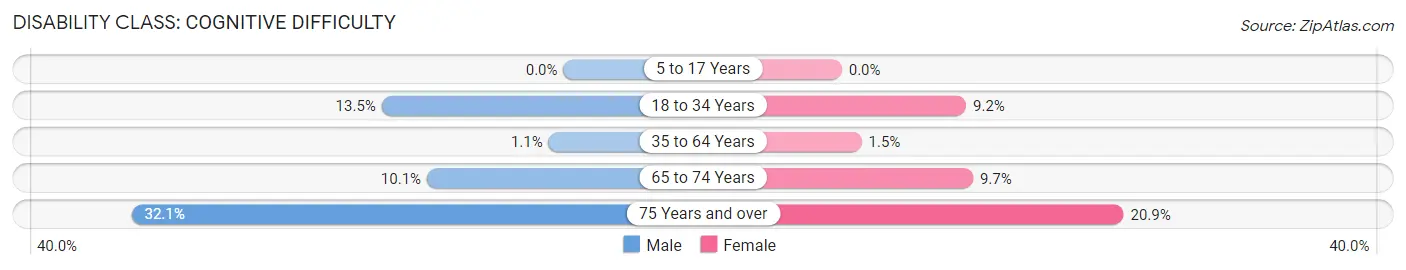
| Age Bracket | Male | Female |
| 5 to 17 Years | 0 (0.0%) | 0 (0.0%) |
| 18 to 34 Years | 187 (13.5%) | 125 (9.2%) |
| 35 to 64 Years | 29 (1.1%) | 32 (1.5%) |
| 65 to 74 Years | 32 (10.1%) | 48 (9.7%) |
| 75 Years and over | 134 (32.1%) | 86 (20.9%) |
Disability Class: Ambulatory Difficulty
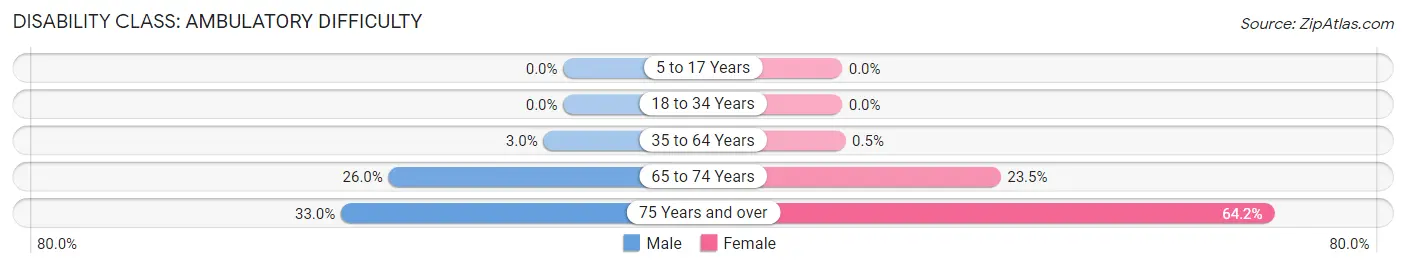
| Age Bracket | Male | Female |
| 5 to 17 Years | 0 (0.0%) | 0 (0.0%) |
| 18 to 34 Years | 0 (0.0%) | 0 (0.0%) |
| 35 to 64 Years | 78 (2.9%) | 11 (0.5%) |
| 65 to 74 Years | 82 (26.0%) | 116 (23.5%) |
| 75 Years and over | 138 (33.0%) | 264 (64.2%) |
Disability Class: Self-Care Difficulty
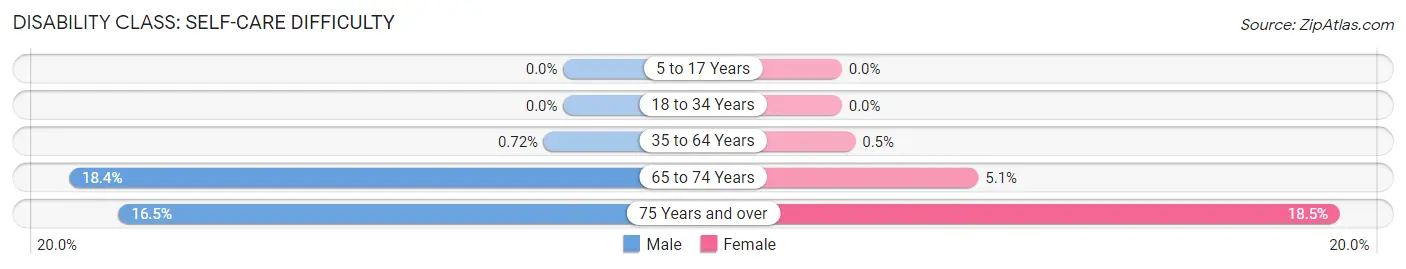
| Age Bracket | Male | Female |
| 5 to 17 Years | 0 (0.0%) | 0 (0.0%) |
| 18 to 34 Years | 0 (0.0%) | 0 (0.0%) |
| 35 to 64 Years | 19 (0.7%) | 11 (0.5%) |
| 65 to 74 Years | 58 (18.3%) | 25 (5.1%) |
| 75 Years and over | 69 (16.5%) | 76 (18.5%) |
Technology Access in Trenton
Computing Device Access in Trenton
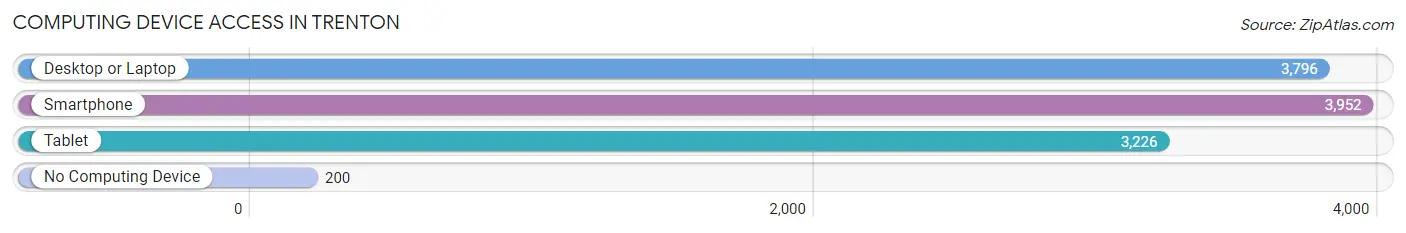
| Device Type | # Households | % Households |
| Desktop or Laptop | 3,796 | 85.9% |
| Smartphone | 3,952 | 89.4% |
| Tablet | 3,226 | 73.0% |
| No Computing Device | 200 | 4.5% |
| Total | 4,418 | 100.0% |
Internet Access in Trenton
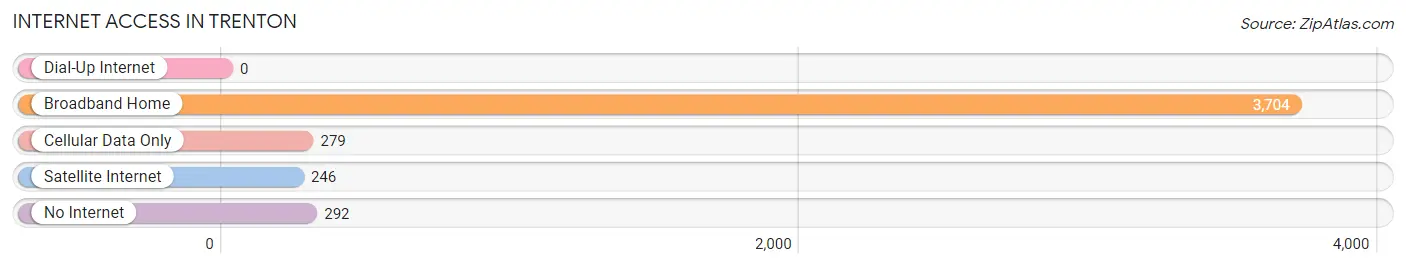
| Internet Type | # Households | % Households |
| Dial-Up Internet | 0 | 0.0% |
| Broadband Home | 3,704 | 83.8% |
| Cellular Data Only | 279 | 6.3% |
| Satellite Internet | 246 | 5.6% |
| No Internet | 292 | 6.6% |
| Total | 4,418 | 100.0% |
Trenton Summary
Trenton, Ohio is a small city located in Butler County, Ohio. It is situated on the Great Miami River, approximately 25 miles north of Cincinnati. The city has a population of 11,837, according to the 2010 census.
History
Trenton was founded in 1804 by William Trent, a Revolutionary War veteran. The city was originally known as “Trent’s Town” and was incorporated in 1817. The city was named after William Trent, who was a major landowner in the area.
Trenton was an important stop on the Underground Railroad, and many escaped slaves passed through the city on their way to freedom. The city was also a major stop on the Miami and Erie Canal, which was built in the early 1800s.
Geography
Trenton is located in Butler County, Ohio, approximately 25 miles north of Cincinnati. The city is situated on the Great Miami River, and is surrounded by the cities of Hamilton, Middletown, and Oxford. The city has a total area of 4.3 square miles, all of which is land.
Economy
Trenton’s economy is largely based on manufacturing and retail. The city is home to several large manufacturing companies, including the Trenton Foundry, which produces cast iron products, and the Trenton Tool Company, which produces industrial tools. The city is also home to several retail stores, including a Walmart Supercenter and a Kroger grocery store.
Demographics
According to the 2010 census, Trenton has a population of 11,837. The population is predominantly white (90.2%), with a small African American population (4.2%) and a small Hispanic population (2.3%). The median household income is $41,945, and the median home value is $117,400.
Conclusion
Trenton, Ohio is a small city located in Butler County, Ohio. It is situated on the Great Miami River, approximately 25 miles north of Cincinnati. The city has a population of 11,837, according to the 2010 census. Trenton was founded in 1804 by William Trent, a Revolutionary War veteran, and was an important stop on the Underground Railroad and the Miami and Erie Canal. The city’s economy is largely based on manufacturing and retail, and the population is predominantly white.
Common Questions
What is Per Capita Income in Trenton?
Per Capita income in Trenton is $32,954.
What is the Median Family Income in Trenton?
Median Family Income in Trenton is $97,925.
What is the Median Household income in Trenton?
Median Household Income in Trenton is $84,392.
What is Income or Wage Gap in Trenton?
Income or Wage Gap in Trenton is 34.1%.
Women in Trenton earn 65.9 cents for every dollar earned by a man.
What is Inequality or Gini Index in Trenton?
Inequality or Gini Index in Trenton is 0.35.
What is the Total Population of Trenton?
Total Population of Trenton is 13,133.
What is the Total Male Population of Trenton?
Total Male Population of Trenton is 6,632.
What is the Total Female Population of Trenton?
Total Female Population of Trenton is 6,501.
What is the Ratio of Males per 100 Females in Trenton?
There are 102.02 Males per 100 Females in Trenton.
What is the Ratio of Females per 100 Males in Trenton?
There are 98.02 Females per 100 Males in Trenton.
What is the Median Population Age in Trenton?
Median Population Age in Trenton is 33.5 Years.
What is the Average Family Size in Trenton
Average Family Size in Trenton is 3.4 People.
What is the Average Household Size in Trenton
Average Household Size in Trenton is 3.0 People.
How Large is the Labor Force in Trenton?
There are 6,707 People in the Labor Forcein in Trenton.
What is the Percentage of People in the Labor Force in Trenton?
67.3% of People are in the Labor Force in Trenton.
What is the Unemployment Rate in Trenton?
Unemployment Rate in Trenton is 4.7%.