Toronto, OH Map & Demographics
Toronto Map
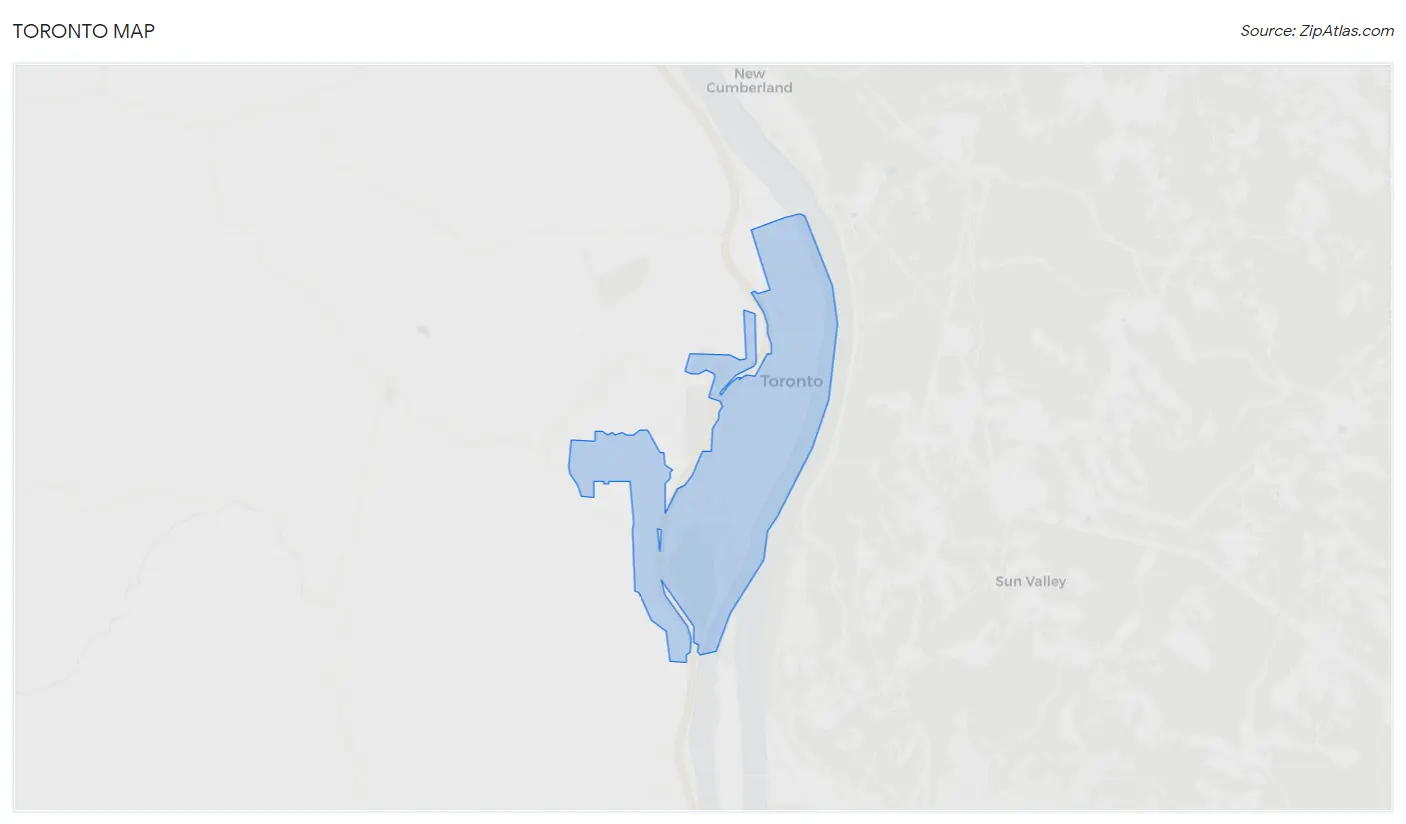
Toronto Overview
$30,742
PER CAPITA INCOME
$66,833
AVG FAMILY INCOME
$48,287
AVG HOUSEHOLD INCOME
46.3%
WAGE / INCOME GAP [ % ]
53.7¢/ $1
WAGE / INCOME GAP [ $ ]
0.47
INEQUALITY / GINI INDEX
5,387
TOTAL POPULATION
2,550
MALE POPULATION
2,837
FEMALE POPULATION
89.88
MALES / 100 FEMALES
111.25
FEMALES / 100 MALES
43.2
MEDIAN AGE
3.0
AVG FAMILY SIZE
2.2
AVG HOUSEHOLD SIZE
2,465
LABOR FORCE [ PEOPLE ]
57.8%
PERCENT IN LABOR FORCE
4.3%
UNEMPLOYMENT RATE
Toronto Zip Codes
Toronto Area Codes
Income in Toronto
Income Overview in Toronto
Per Capita Income in Toronto is $30,742, while median incomes of families and households are $66,833 and $48,287 respectively.
| Characteristic | Number | Measure |
| Per Capita Income | 5,387 | $30,742 |
| Median Family Income | 1,354 | $66,833 |
| Mean Family Income | 1,354 | $84,172 |
| Median Household Income | 2,417 | $48,287 |
| Mean Household Income | 2,417 | $65,998 |
| Income Deficit | 1,354 | $0 |
| Wage / Income Gap (%) | 5,387 | 46.28% |
| Wage / Income Gap ($) | 5,387 | 53.72¢ per $1 |
| Gini / Inequality Index | 5,387 | 0.47 |
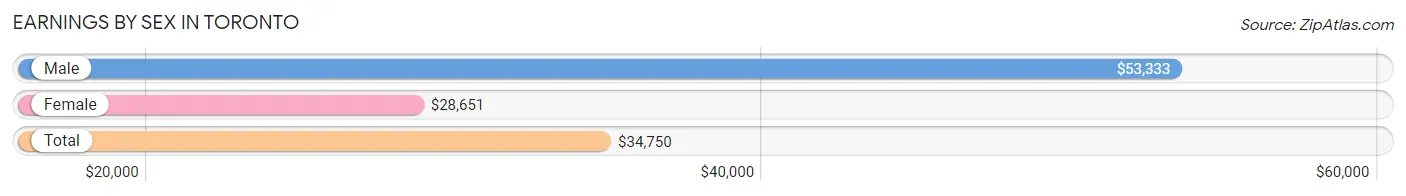
Earnings by Sex in Toronto
Average Earnings in Toronto are $34,750, $53,333 for men and $28,651 for women, a difference of 46.3%.
| Sex | Number | Average Earnings |
| Male | 1,106 (43.8%) | $53,333 |
| Female | 1,422 (56.2%) | $28,651 |
| Total | 2,528 (100.0%) | $34,750 |
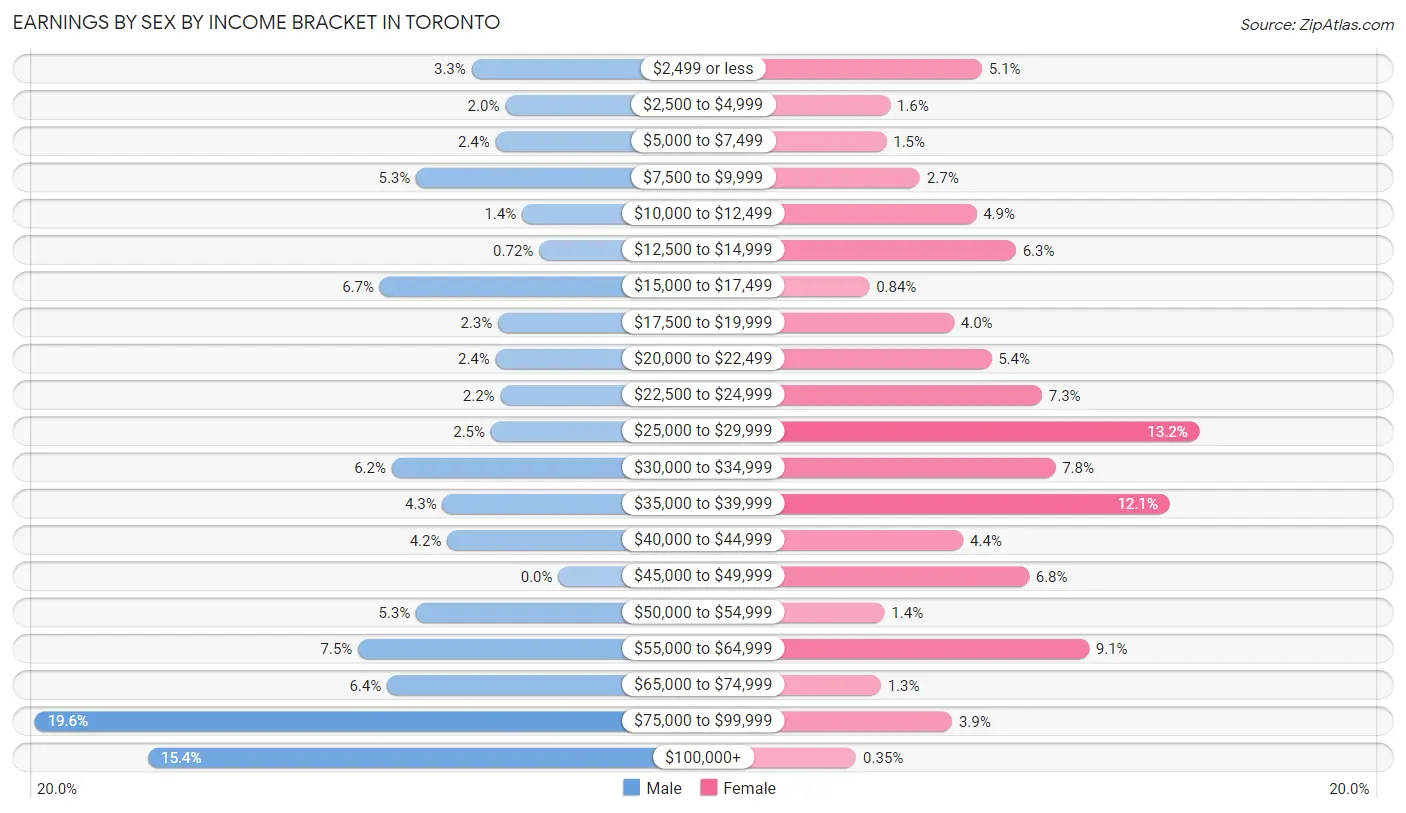
Earnings by Sex by Income Bracket in Toronto
The most common earnings brackets in Toronto are $75,000 to $99,999 for men (217 | 19.6%) and $25,000 to $29,999 for women (188 | 13.2%).
| Income | Male | Female |
| $2,499 or less | 36 (3.3%) | 72 (5.1%) |
| $2,500 to $4,999 | 22 (2.0%) | 23 (1.6%) |
| $5,000 to $7,499 | 26 (2.4%) | 21 (1.5%) |
| $7,500 to $9,999 | 59 (5.3%) | 39 (2.7%) |
| $10,000 to $12,499 | 15 (1.4%) | 69 (4.9%) |
| $12,500 to $14,999 | 8 (0.7%) | 90 (6.3%) |
| $15,000 to $17,499 | 74 (6.7%) | 12 (0.8%) |
| $17,500 to $19,999 | 25 (2.3%) | 57 (4.0%) |
| $20,000 to $22,499 | 26 (2.4%) | 77 (5.4%) |
| $22,500 to $24,999 | 24 (2.2%) | 104 (7.3%) |
| $25,000 to $29,999 | 28 (2.5%) | 188 (13.2%) |
| $30,000 to $34,999 | 69 (6.2%) | 111 (7.8%) |
| $35,000 to $39,999 | 48 (4.3%) | 172 (12.1%) |
| $40,000 to $44,999 | 46 (4.2%) | 62 (4.4%) |
| $45,000 to $49,999 | 0 (0.0%) | 97 (6.8%) |
| $50,000 to $54,999 | 59 (5.3%) | 20 (1.4%) |
| $55,000 to $64,999 | 83 (7.5%) | 129 (9.1%) |
| $65,000 to $74,999 | 71 (6.4%) | 18 (1.3%) |
| $75,000 to $99,999 | 217 (19.6%) | 56 (3.9%) |
| $100,000+ | 170 (15.4%) | 5 (0.4%) |
| Total | 1,106 (100.0%) | 1,422 (100.0%) |
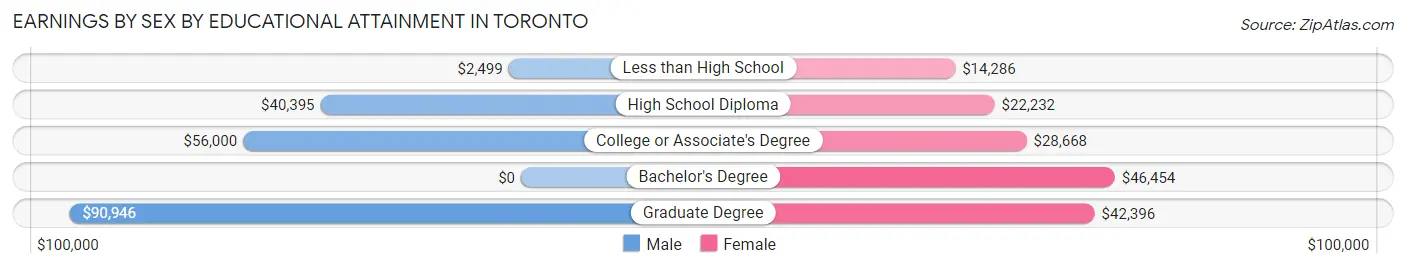
Earnings by Sex by Educational Attainment in Toronto
Average earnings in Toronto are $58,125 for men and $29,655 for women, a difference of 49.0%. Men with an educational attainment of graduate degree enjoy the highest average annual earnings of $90,946, while those with less than high school education earn the least with $2,499. Women with an educational attainment of bachelor's degree earn the most with the average annual earnings of $46,454, while those with less than high school education have the smallest earnings of $14,286.
| Educational Attainment | Male Income | Female Income |
| Less than High School | $2,499 | $14,286 |
| High School Diploma | $40,395 | $22,232 |
| College or Associate's Degree | $56,000 | $28,668 |
| Bachelor's Degree | - | - |
| Graduate Degree | $90,946 | $42,396 |
| Total | $58,125 | $29,655 |
Family Income in Toronto
Family Income Brackets in Toronto
According to the Toronto family income data, there are 305 families falling into the $50,000 to $74,999 income range, which is the most common income bracket and makes up 22.5% of all families. Conversely, the less than $10,000 income bracket is the least frequent group with only 38 families (2.8%) belonging to this category.
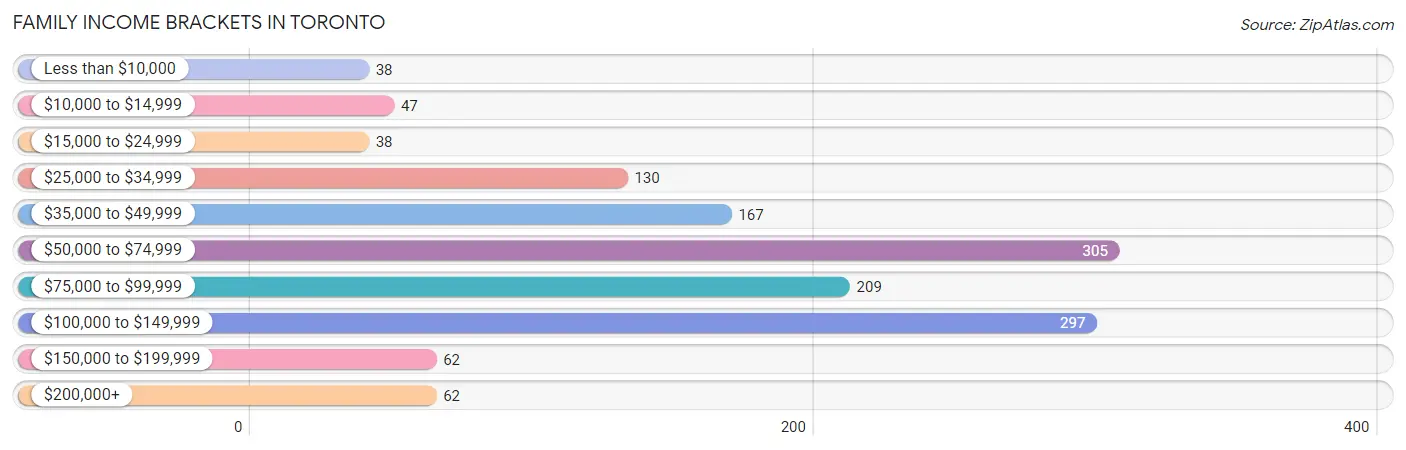
| Income Bracket | # Families | % Families |
| Less than $10,000 | 38 | 2.8% |
| $10,000 to $14,999 | 47 | 3.5% |
| $15,000 to $24,999 | 38 | 2.8% |
| $25,000 to $34,999 | 130 | 9.6% |
| $35,000 to $49,999 | 167 | 12.3% |
| $50,000 to $74,999 | 305 | 22.5% |
| $75,000 to $99,999 | 209 | 15.4% |
| $100,000 to $149,999 | 297 | 21.9% |
| $150,000 to $199,999 | 62 | 4.6% |
| $200,000+ | 62 | 4.6% |
Family Income by Famaliy Size in Toronto
4-person families (235 | 17.4%) account for the highest median family income in Toronto with $100,250 per family, while 2-person families (787 | 58.1%) have the highest median income of $32,050 per family member.
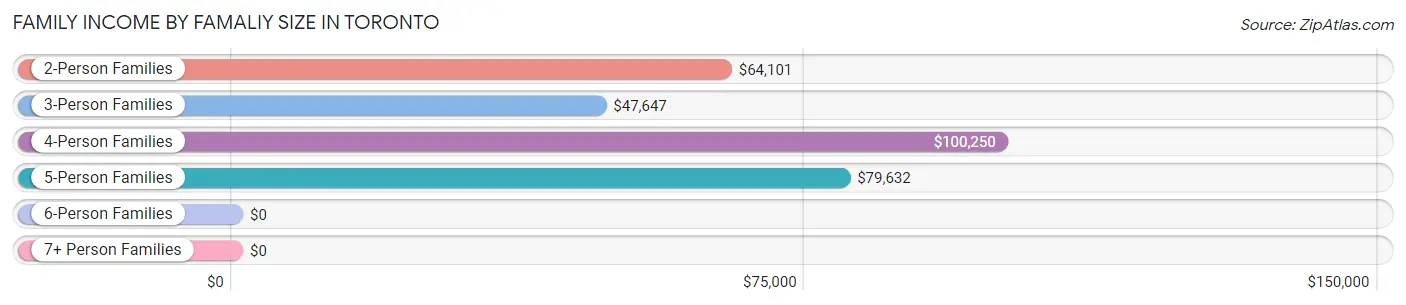
| Income Bracket | # Families | Median Income |
| 2-Person Families | 787 (58.1%) | $64,101 |
| 3-Person Families | 196 (14.5%) | $47,647 |
| 4-Person Families | 235 (17.4%) | $100,250 |
| 5-Person Families | 122 (9.0%) | $79,632 |
| 6-Person Families | 3 (0.2%) | $0 |
| 7+ Person Families | 11 (0.8%) | $0 |
| Total | 1,354 (100.0%) | $66,833 |
Family Income by Number of Earners in Toronto
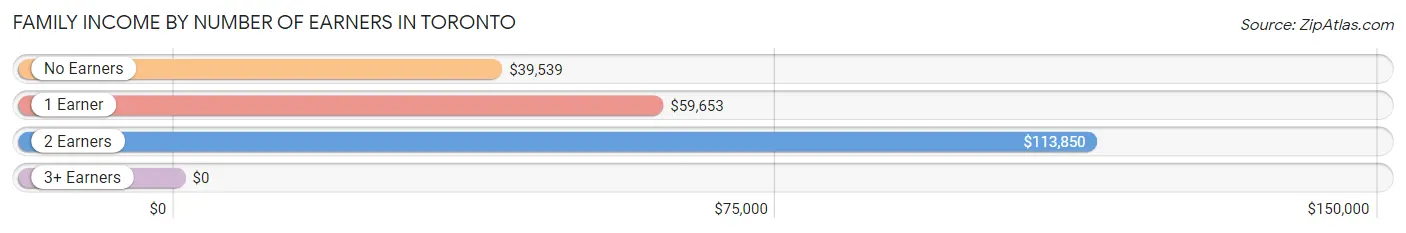
| Number of Earners | # Families | Median Income |
| No Earners | 213 (15.7%) | $39,539 |
| 1 Earner | 546 (40.3%) | $59,653 |
| 2 Earners | 553 (40.8%) | $113,850 |
| 3+ Earners | 42 (3.1%) | $0 |
| Total | 1,354 (100.0%) | $66,833 |
Household Income in Toronto
Household Income Brackets in Toronto
With 476 households falling in the category, the $50,000 to $74,999 income range is the most frequent in Toronto, accounting for 19.7% of all households. In contrast, only 63 households (2.6%) fall into the $150,000 to $199,999 income bracket, making it the least populous group.
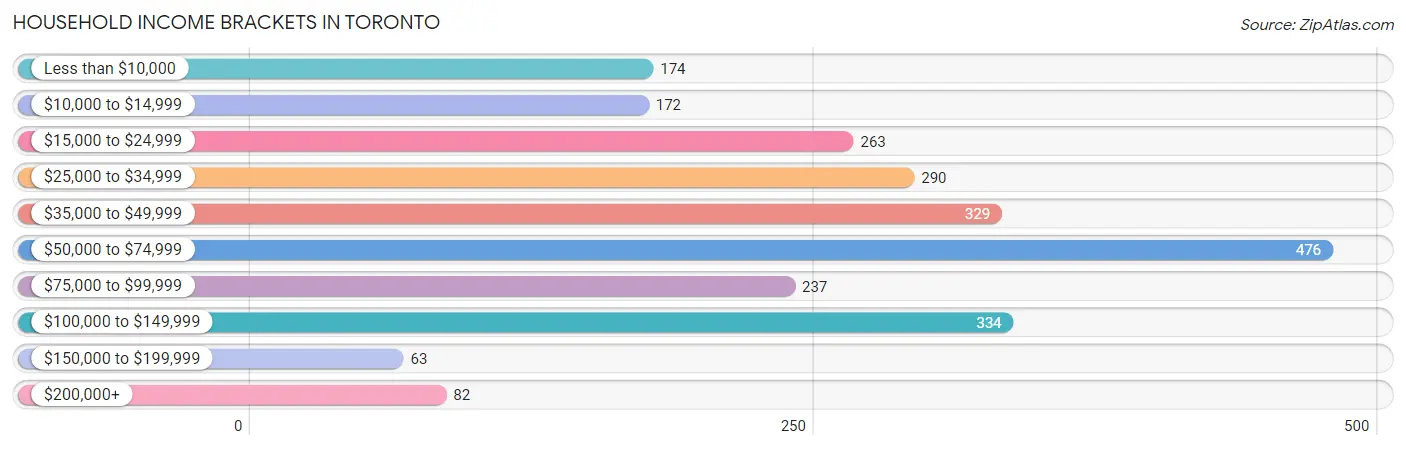
| Income Bracket | # Households | % Households |
| Less than $10,000 | 174 | 7.2% |
| $10,000 to $14,999 | 172 | 7.1% |
| $15,000 to $24,999 | 263 | 10.9% |
| $25,000 to $34,999 | 290 | 12.0% |
| $35,000 to $49,999 | 329 | 13.6% |
| $50,000 to $74,999 | 476 | 19.7% |
| $75,000 to $99,999 | 237 | 9.8% |
| $100,000 to $149,999 | 334 | 13.8% |
| $150,000 to $199,999 | 63 | 2.6% |
| $200,000+ | 82 | 3.4% |
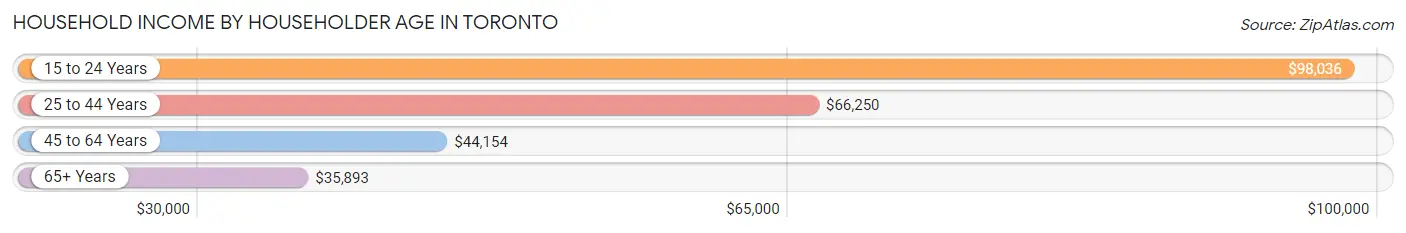
Household Income by Householder Age in Toronto
The median household income in Toronto is $48,287, with the highest median household income of $98,036 found in the 15 to 24 years age bracket for the primary householder. A total of 43 households (1.8%) fall into this category. Meanwhile, the 65+ years age bracket for the primary householder has the lowest median household income of $35,893, with 716 households (29.6%) in this group.
| Income Bracket | # Households | Median Income |
| 15 to 24 Years | 43 (1.8%) | $98,036 |
| 25 to 44 Years | 731 (30.2%) | $66,250 |
| 45 to 64 Years | 927 (38.4%) | $44,154 |
| 65+ Years | 716 (29.6%) | $35,893 |
| Total | 2,417 (100.0%) | $48,287 |
Poverty in Toronto
Income Below Poverty by Sex and Age in Toronto
With 16.3% poverty level for males and 16.4% for females among the residents of Toronto, 12 to 14 year old males and 15 year old females are the most vulnerable to poverty, with 13 males (65.0%) and 18 females (60.0%) in their respective age groups living below the poverty level.
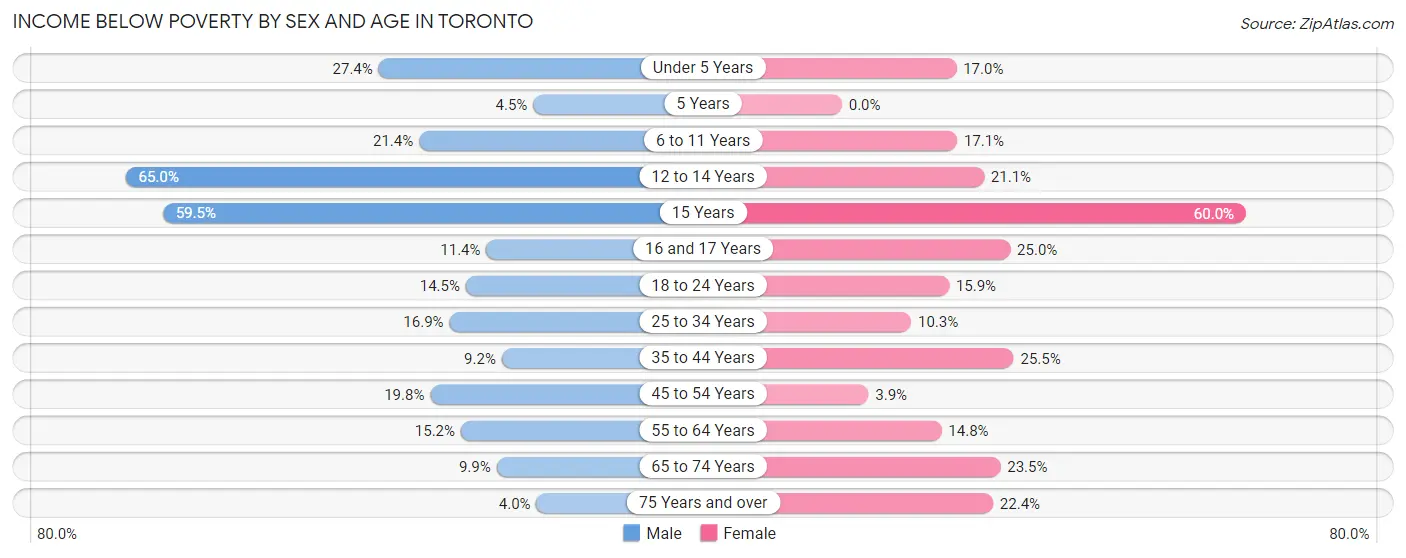
| Age Bracket | Male | Female |
| Under 5 Years | 48 (27.4%) | 26 (17.0%) |
| 5 Years | 6 (4.5%) | 0 (0.0%) |
| 6 to 11 Years | 42 (21.4%) | 33 (17.1%) |
| 12 to 14 Years | 13 (65.0%) | 23 (21.1%) |
| 15 Years | 47 (59.5%) | 18 (60.0%) |
| 16 and 17 Years | 8 (11.4%) | 9 (25.0%) |
| 18 to 24 Years | 20 (14.5%) | 14 (15.9%) |
| 25 to 34 Years | 55 (16.9%) | 49 (10.3%) |
| 35 to 44 Years | 29 (9.1%) | 77 (25.5%) |
| 45 to 54 Years | 52 (19.8%) | 14 (3.9%) |
| 55 to 64 Years | 63 (15.2%) | 80 (14.8%) |
| 65 to 74 Years | 26 (9.9%) | 76 (23.5%) |
| 75 Years and over | 6 (4.0%) | 46 (22.4%) |
| Total | 415 (16.3%) | 465 (16.4%) |
Income Above Poverty by Sex and Age in Toronto
According to the poverty statistics in Toronto, males aged 75 years and over and females aged 5 years are the age groups that are most secure financially, with 96.0% of males and 100.0% of females in these age groups living above the poverty line.
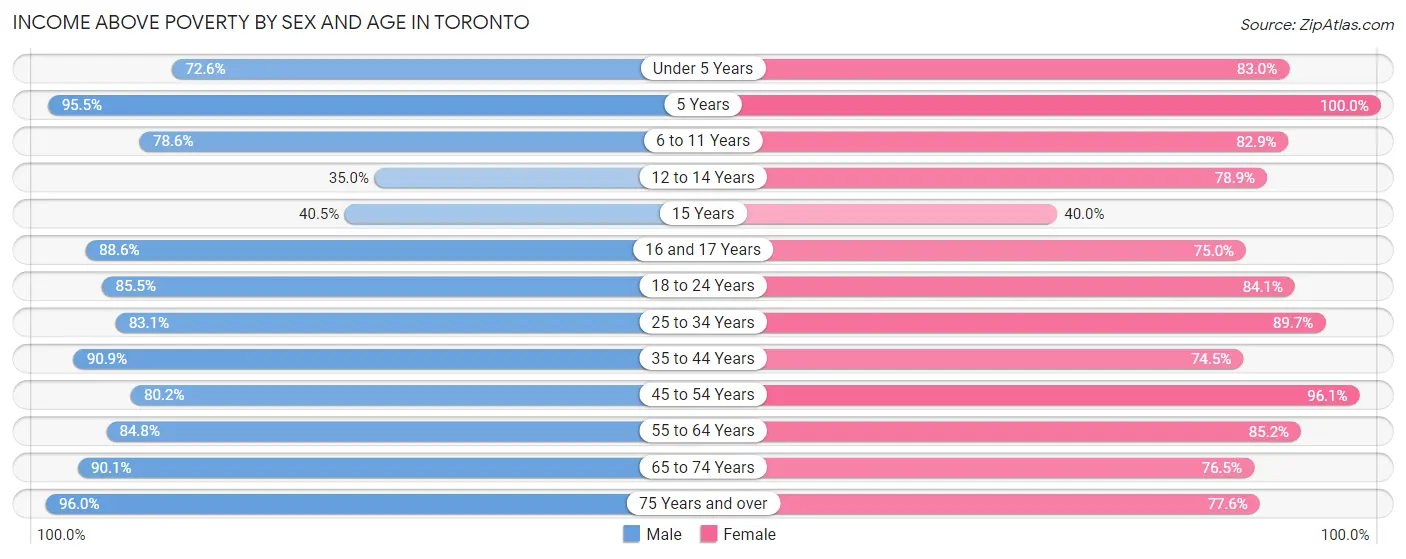
| Age Bracket | Male | Female |
| Under 5 Years | 127 (72.6%) | 127 (83.0%) |
| 5 Years | 128 (95.5%) | 26 (100.0%) |
| 6 to 11 Years | 154 (78.6%) | 160 (82.9%) |
| 12 to 14 Years | 7 (35.0%) | 86 (78.9%) |
| 15 Years | 32 (40.5%) | 12 (40.0%) |
| 16 and 17 Years | 62 (88.6%) | 27 (75.0%) |
| 18 to 24 Years | 118 (85.5%) | 74 (84.1%) |
| 25 to 34 Years | 270 (83.1%) | 427 (89.7%) |
| 35 to 44 Years | 288 (90.8%) | 225 (74.5%) |
| 45 to 54 Years | 211 (80.2%) | 341 (96.1%) |
| 55 to 64 Years | 351 (84.8%) | 461 (85.2%) |
| 65 to 74 Years | 236 (90.1%) | 247 (76.5%) |
| 75 Years and over | 144 (96.0%) | 159 (77.6%) |
| Total | 2,128 (83.7%) | 2,372 (83.6%) |
Income Below Poverty Among Married-Couple Families in Toronto
The poverty statistics for married-couple families in Toronto show that 2.6% or 26 of the total 994 families live below the poverty line. Families with 3 or 4 children have the highest poverty rate of 5.1%, comprising of 5 families. On the other hand, families with 1 or 2 children have the lowest poverty rate of 0.0%, which includes 0 families.
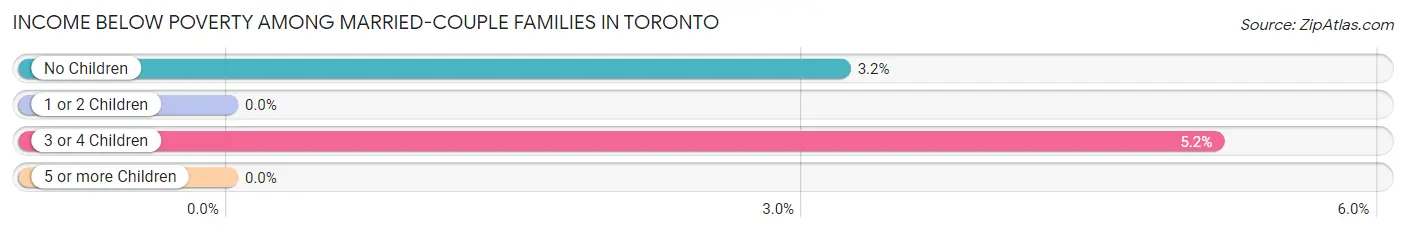
| Children | Above Poverty | Below Poverty |
| No Children | 635 (96.8%) | 21 (3.2%) |
| 1 or 2 Children | 235 (100.0%) | 0 (0.0%) |
| 3 or 4 Children | 92 (94.9%) | 5 (5.1%) |
| 5 or more Children | 6 (100.0%) | 0 (0.0%) |
| Total | 968 (97.4%) | 26 (2.6%) |
Income Below Poverty Among Single-Parent Households in Toronto
According to the poverty data in Toronto, 15.4% or 14 single-father households and 35.7% or 96 single-mother households are living below the poverty line. Among single-father households, those with 3 or 4 children have the highest poverty rate, with 14 households (100.0%) experiencing poverty. Likewise, among single-mother households, those with 3 or 4 children have the highest poverty rate, with 23 households (85.2%) falling below the poverty line.
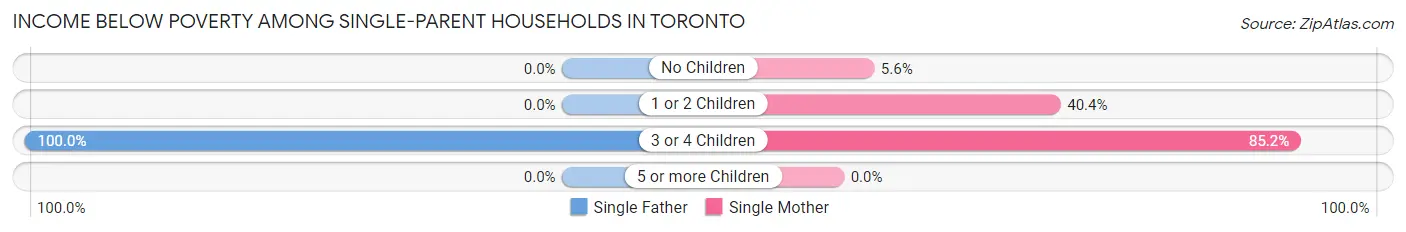
| Children | Single Father | Single Mother |
| No Children | 0 (0.0%) | 4 (5.6%) |
| 1 or 2 Children | 0 (0.0%) | 69 (40.4%) |
| 3 or 4 Children | 14 (100.0%) | 23 (85.2%) |
| 5 or more Children | 0 (0.0%) | 0 (0.0%) |
| Total | 14 (15.4%) | 96 (35.7%) |
Income Below Poverty Among Married-Couple vs Single-Parent Households in Toronto
The poverty data for Toronto shows that 26 of the married-couple family households (2.6%) and 110 of the single-parent households (30.6%) are living below the poverty level. Within the married-couple family households, those with 3 or 4 children have the highest poverty rate, with 5 households (5.1%) falling below the poverty line. Among the single-parent households, those with 3 or 4 children have the highest poverty rate, with 37 household (90.2%) living below poverty.
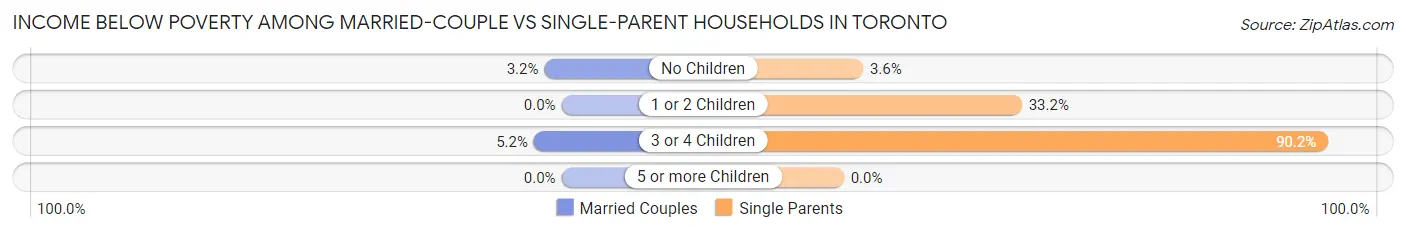
| Children | Married-Couple Families | Single-Parent Households |
| No Children | 21 (3.2%) | 4 (3.6%) |
| 1 or 2 Children | 0 (0.0%) | 69 (33.2%) |
| 3 or 4 Children | 5 (5.1%) | 37 (90.2%) |
| 5 or more Children | 0 (0.0%) | 0 (0.0%) |
| Total | 26 (2.6%) | 110 (30.6%) |
Race in Toronto
The most populous races in Toronto are White / Caucasian (5,050 | 93.7%), Black / African American (156 | 2.9%), and Two or more Races (156 | 2.9%).
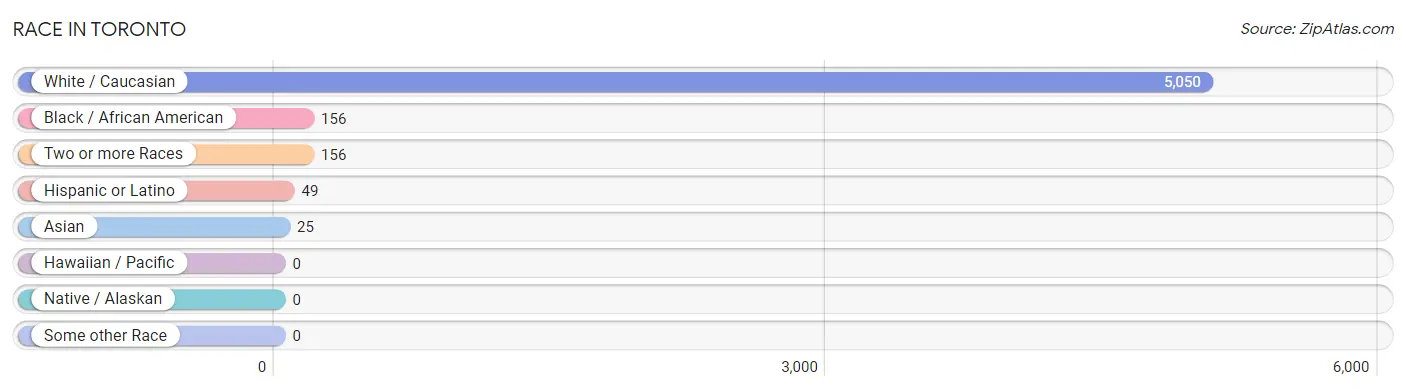
| Race | # Population | % Population |
| Asian | 25 | 0.5% |
| Black / African American | 156 | 2.9% |
| Hawaiian / Pacific | 0 | 0.0% |
| Hispanic or Latino | 49 | 0.9% |
| Native / Alaskan | 0 | 0.0% |
| White / Caucasian | 5,050 | 93.7% |
| Two or more Races | 156 | 2.9% |
| Some other Race | 0 | 0.0% |
| Total | 5,387 | 100.0% |
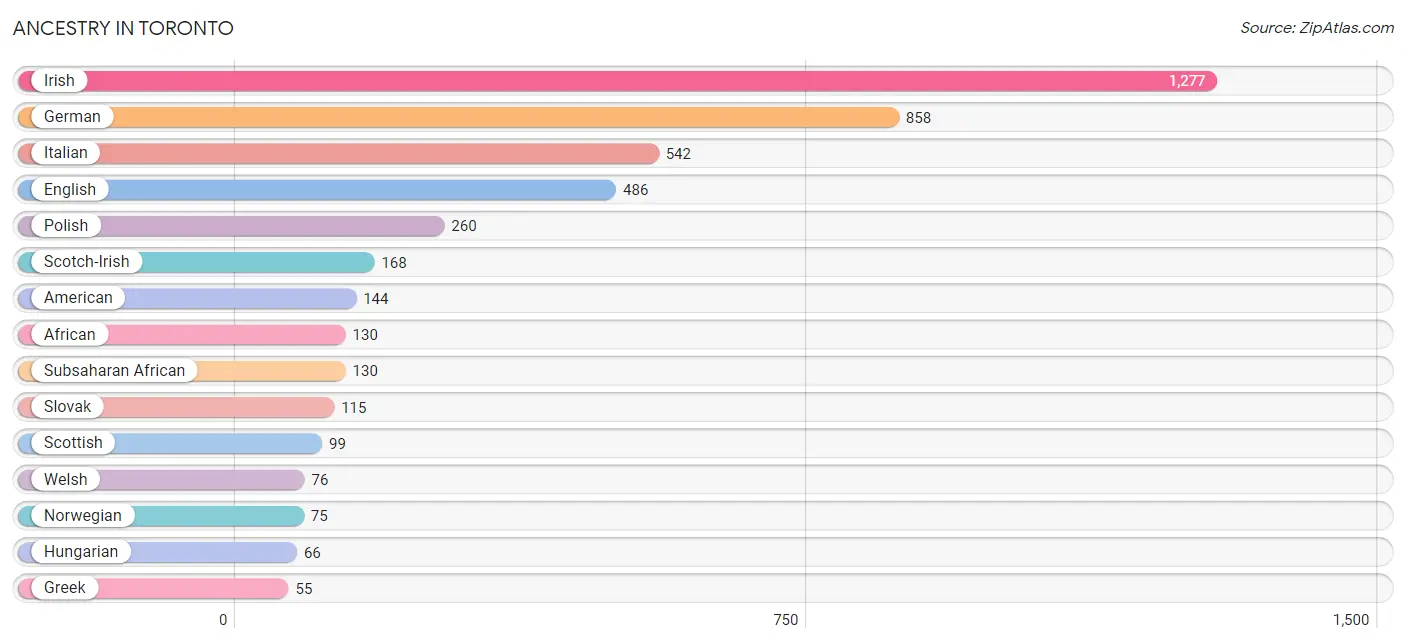
Ancestry in Toronto
The most populous ancestries reported in Toronto are Irish (1,277 | 23.7%), German (858 | 15.9%), Italian (542 | 10.1%), English (486 | 9.0%), and Polish (260 | 4.8%), together accounting for 63.5% of all Toronto residents.
| Ancestry | # Population | % Population |
| African | 130 | 2.4% |
| American | 144 | 2.7% |
| Austrian | 10 | 0.2% |
| British | 8 | 0.2% |
| Bulgarian | 6 | 0.1% |
| Cherokee | 11 | 0.2% |
| Czech | 41 | 0.8% |
| Czechoslovakian | 6 | 0.1% |
| Dutch | 52 | 1.0% |
| Eastern European | 7 | 0.1% |
| English | 486 | 9.0% |
| European | 15 | 0.3% |
| French | 25 | 0.5% |
| German | 858 | 15.9% |
| Greek | 55 | 1.0% |
| Hungarian | 66 | 1.2% |
| Indian (Asian) | 42 | 0.8% |
| Irish | 1,277 | 23.7% |
| Italian | 542 | 10.1% |
| Korean | 17 | 0.3% |
| Lithuanian | 7 | 0.1% |
| Mexican | 6 | 0.1% |
| Norwegian | 75 | 1.4% |
| Polish | 260 | 4.8% |
| Russian | 35 | 0.6% |
| Scotch-Irish | 168 | 3.1% |
| Scottish | 99 | 1.8% |
| Serbian | 28 | 0.5% |
| Sioux | 13 | 0.2% |
| Slavic | 5 | 0.1% |
| Slovak | 115 | 2.1% |
| Spanish | 43 | 0.8% |
| Subsaharan African | 130 | 2.4% |
| Swiss | 5 | 0.1% |
| Welsh | 76 | 1.4% | View All 35 Rows |
Immigrants in Toronto
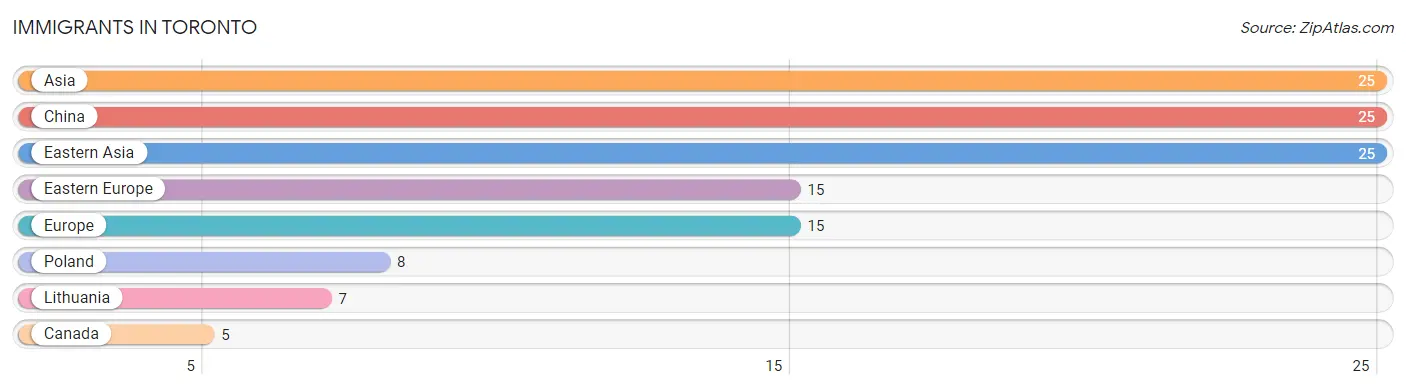
The most numerous immigrant groups reported in Toronto came from Asia (25 | 0.5%), China (25 | 0.5%), Eastern Asia (25 | 0.5%), Eastern Europe (15 | 0.3%), and Europe (15 | 0.3%), together accounting for 1.9% of all Toronto residents.
| Immigration Origin | # Population | % Population |
| Asia | 25 | 0.5% |
| Canada | 5 | 0.1% |
| China | 25 | 0.5% |
| Eastern Asia | 25 | 0.5% |
| Eastern Europe | 15 | 0.3% |
| Europe | 15 | 0.3% |
| Lithuania | 7 | 0.1% |
| Poland | 8 | 0.2% | View All 8 Rows |
Sex and Age in Toronto
Sex and Age in Toronto
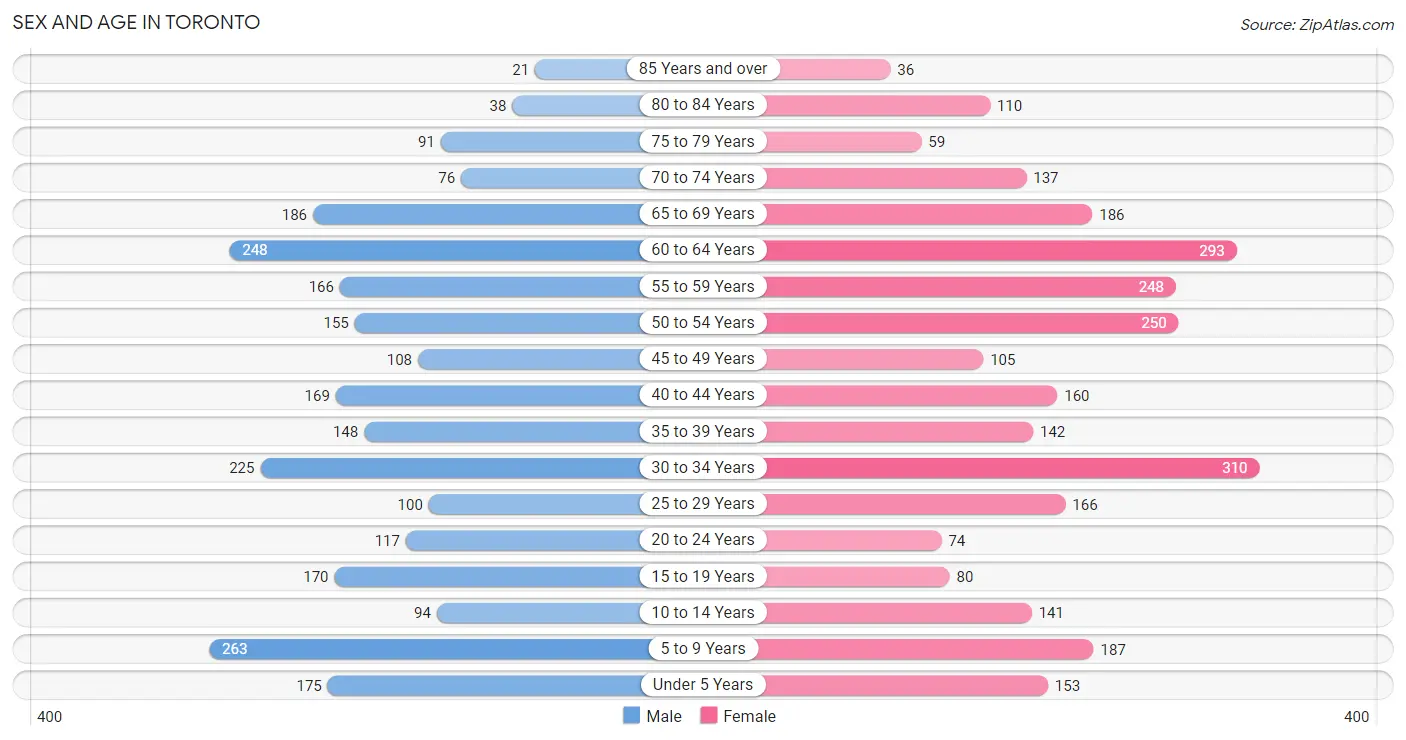
The most populous age groups in Toronto are 5 to 9 Years (263 | 10.3%) for men and 30 to 34 Years (310 | 10.9%) for women.
| Age Bracket | Male | Female |
| Under 5 Years | 175 (6.9%) | 153 (5.4%) |
| 5 to 9 Years | 263 (10.3%) | 187 (6.6%) |
| 10 to 14 Years | 94 (3.7%) | 141 (5.0%) |
| 15 to 19 Years | 170 (6.7%) | 80 (2.8%) |
| 20 to 24 Years | 117 (4.6%) | 74 (2.6%) |
| 25 to 29 Years | 100 (3.9%) | 166 (5.9%) |
| 30 to 34 Years | 225 (8.8%) | 310 (10.9%) |
| 35 to 39 Years | 148 (5.8%) | 142 (5.0%) |
| 40 to 44 Years | 169 (6.6%) | 160 (5.6%) |
| 45 to 49 Years | 108 (4.2%) | 105 (3.7%) |
| 50 to 54 Years | 155 (6.1%) | 250 (8.8%) |
| 55 to 59 Years | 166 (6.5%) | 248 (8.7%) |
| 60 to 64 Years | 248 (9.7%) | 293 (10.3%) |
| 65 to 69 Years | 186 (7.3%) | 186 (6.6%) |
| 70 to 74 Years | 76 (3.0%) | 137 (4.8%) |
| 75 to 79 Years | 91 (3.6%) | 59 (2.1%) |
| 80 to 84 Years | 38 (1.5%) | 110 (3.9%) |
| 85 Years and over | 21 (0.8%) | 36 (1.3%) |
| Total | 2,550 (100.0%) | 2,837 (100.0%) |
Families and Households in Toronto
Median Family Size in Toronto
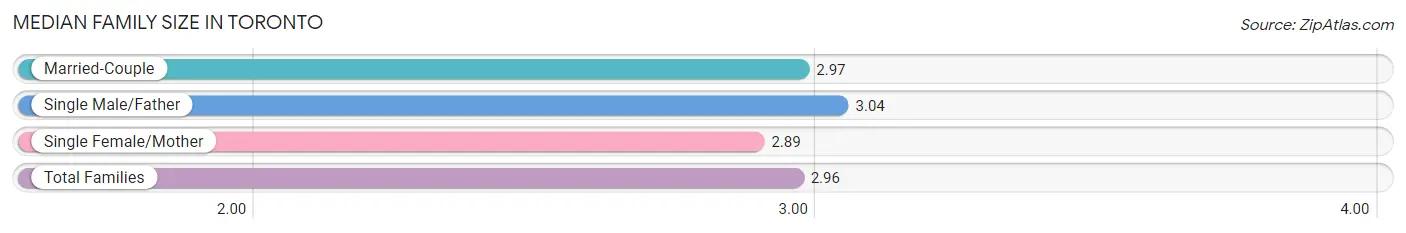
The median family size in Toronto is 2.96 persons per family, with single male/father families (91 | 6.7%) accounting for the largest median family size of 3.04 persons per family. On the other hand, single female/mother families (269 | 19.9%) represent the smallest median family size with 2.89 persons per family.
| Family Type | # Families | Family Size |
| Married-Couple | 994 (73.4%) | 2.97 |
| Single Male/Father | 91 (6.7%) | 3.04 |
| Single Female/Mother | 269 (19.9%) | 2.89 |
| Total Families | 1,354 (100.0%) | 2.96 |
Median Household Size in Toronto
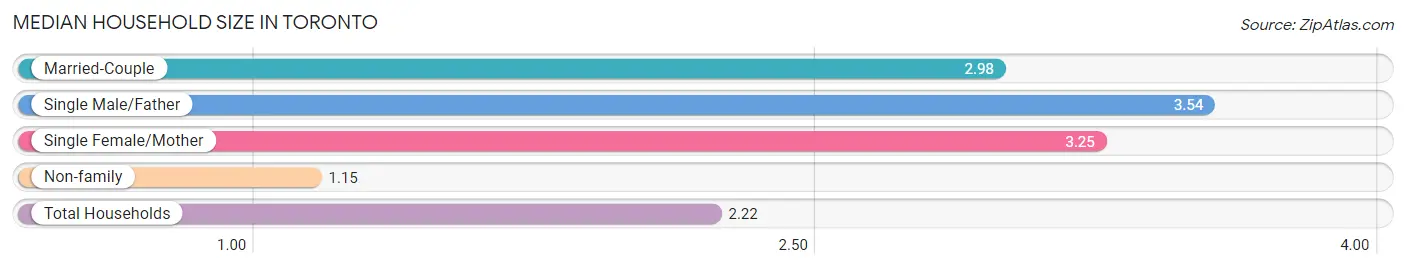
The median household size in Toronto is 2.22 persons per household, with single male/father households (91 | 3.8%) accounting for the largest median household size of 3.54 persons per household. non-family households (1,063 | 44.0%) represent the smallest median household size with 1.15 persons per household.
| Household Type | # Households | Household Size |
| Married-Couple | 994 (41.1%) | 2.98 |
| Single Male/Father | 91 (3.8%) | 3.54 |
| Single Female/Mother | 269 (11.1%) | 3.25 |
| Non-family | 1,063 (44.0%) | 1.15 |
| Total Households | 2,417 (100.0%) | 2.22 |
Household Size by Marriage Status in Toronto
Out of a total of 2,417 households in Toronto, 1,354 (56.0%) are family households, while 1,063 (44.0%) are nonfamily households. The most numerous type of family households are 2-person households, comprising 729, and the most common type of nonfamily households are 1-person households, comprising 965.
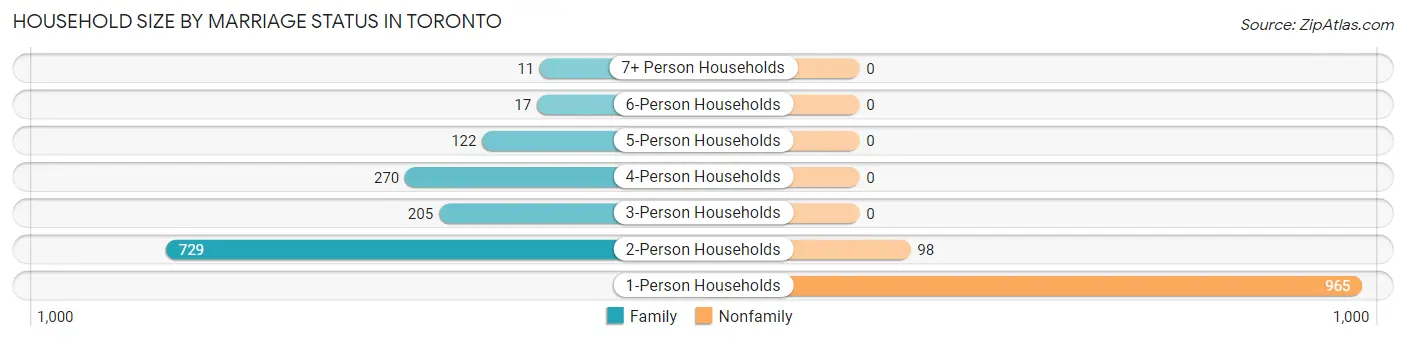
| Household Size | Family Households | Nonfamily Households |
| 1-Person Households | - | 965 (39.9%) |
| 2-Person Households | 729 (30.2%) | 98 (4.1%) |
| 3-Person Households | 205 (8.5%) | 0 (0.0%) |
| 4-Person Households | 270 (11.2%) | 0 (0.0%) |
| 5-Person Households | 122 (5.1%) | 0 (0.0%) |
| 6-Person Households | 17 (0.7%) | 0 (0.0%) |
| 7+ Person Households | 11 (0.5%) | 0 (0.0%) |
| Total | 1,354 (56.0%) | 1,063 (44.0%) |
Female Fertility in Toronto
Fertility by Age in Toronto
Average fertility rate in Toronto is 11.0 births per 1,000 women. Women in the age bracket of 35 to 50 years have the highest fertility rate with 25.0 births per 1,000 women. Women in the age bracket of 35 to 50 years acount for 100.0% of all women with births.
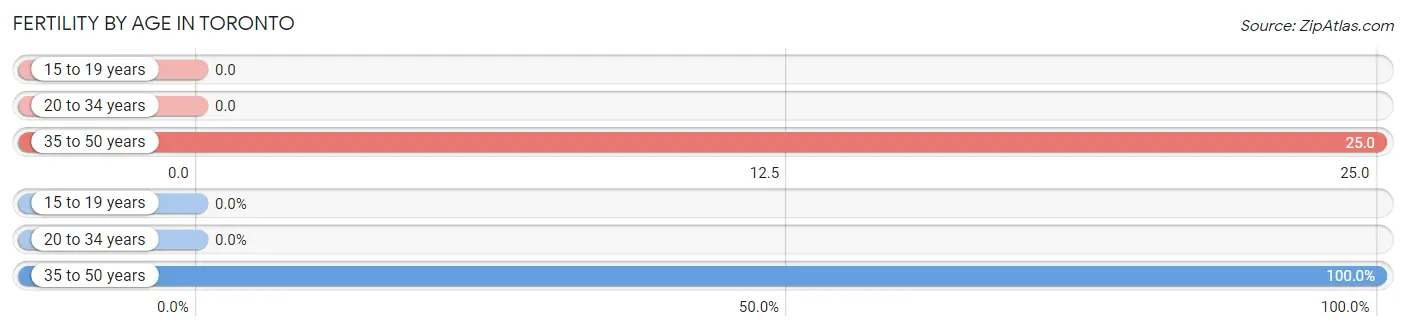
| Age Bracket | Women with Births | Births / 1,000 Women |
| 15 to 19 years | 0 (0.0%) | 0.0 |
| 20 to 34 years | 0 (0.0%) | 0.0 |
| 35 to 50 years | 12 (100.0%) | 25.0 |
| Total | 12 (100.0%) | 11.0 |
Fertility by Age by Marriage Status in Toronto
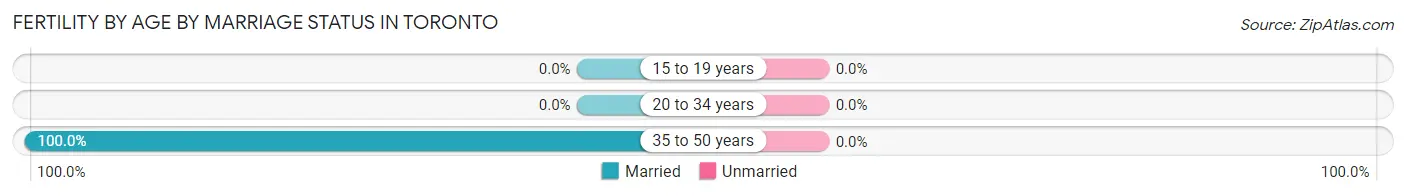
| Age Bracket | Married | Unmarried |
| 15 to 19 years | 0 (0.0%) | 0 (0.0%) |
| 20 to 34 years | 0 (0.0%) | 0 (0.0%) |
| 35 to 50 years | 12 (100.0%) | 0 (0.0%) |
| Total | 12 (100.0%) | 0 (0.0%) |
Fertility by Education in Toronto
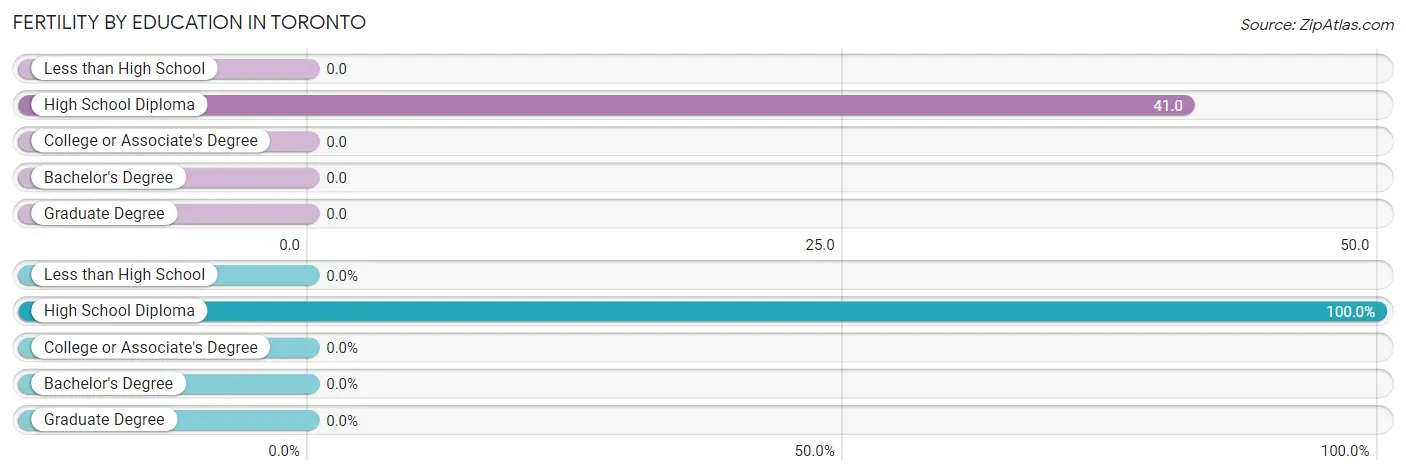
| Educational Attainment | Women with Births | Births / 1,000 Women |
| Less than High School | 0 (0.0%) | 0.0 |
| High School Diploma | 12 (100.0%) | 41.0 |
| College or Associate's Degree | 0 (0.0%) | 0.0 |
| Bachelor's Degree | 0 (0.0%) | 0.0 |
| Graduate Degree | 0 (0.0%) | 0.0 |
| Total | 12 (100.0%) | 11.0 |
Fertility by Education by Marriage Status in Toronto
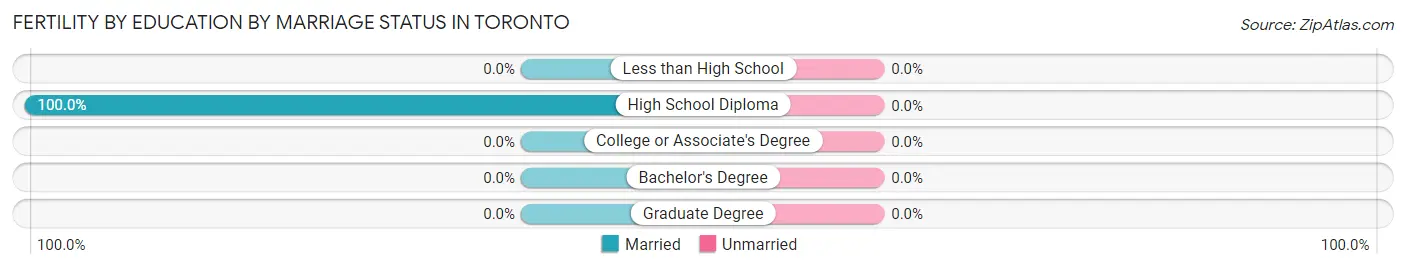
| Educational Attainment | Married | Unmarried |
| Less than High School | 0 (0.0%) | 0 (0.0%) |
| High School Diploma | 12 (100.0%) | 0 (0.0%) |
| College or Associate's Degree | 0 (0.0%) | 0 (0.0%) |
| Bachelor's Degree | 0 (0.0%) | 0 (0.0%) |
| Graduate Degree | 0 (0.0%) | 0 (0.0%) |
| Total | 12 (100.0%) | 0 (0.0%) |
Employment Characteristics in Toronto
Employment by Class of Employer in Toronto
Among the 2,353 employed individuals in Toronto, private company employees (1,814 | 77.1%), local government employees (162 | 6.9%), and not-for-profit organizations (161 | 6.8%) make up the most common classes of employment.
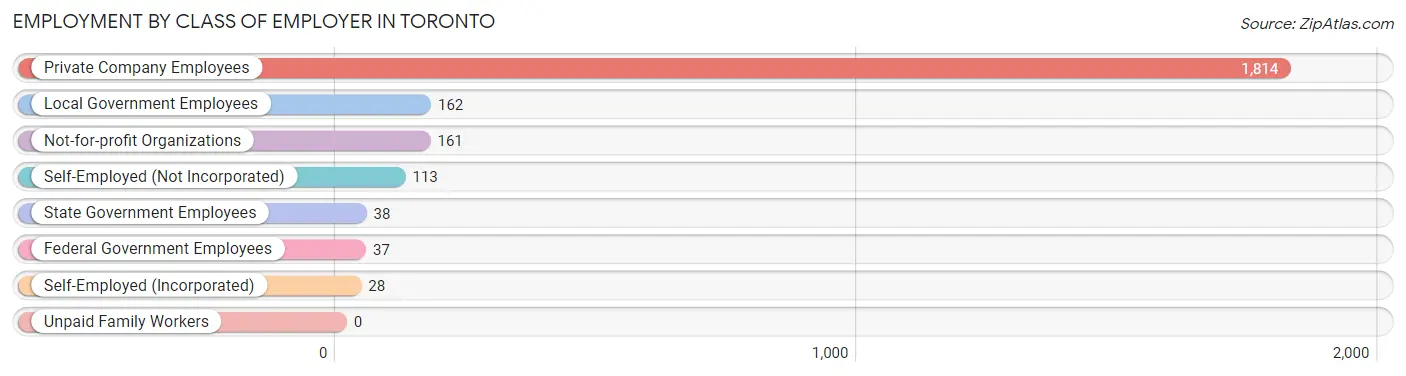
| Employer Class | # Employees | % Employees |
| Private Company Employees | 1,814 | 77.1% |
| Self-Employed (Incorporated) | 28 | 1.2% |
| Self-Employed (Not Incorporated) | 113 | 4.8% |
| Not-for-profit Organizations | 161 | 6.8% |
| Local Government Employees | 162 | 6.9% |
| State Government Employees | 38 | 1.6% |
| Federal Government Employees | 37 | 1.6% |
| Unpaid Family Workers | 0 | 0.0% |
| Total | 2,353 | 100.0% |
Employment Status by Age in Toronto
According to the labor force statistics for Toronto, out of the total population over 16 years of age (4,265), 57.8% or 2,465 individuals are in the labor force, with 4.3% or 106 of them unemployed. The age group with the highest labor force participation rate is 30 to 34 years, with 85.0% or 455 individuals in the labor force. Within the labor force, the 16 to 19 years age range has the highest percentage of unemployed individuals, with 23.5% or 8 of them being unemployed.
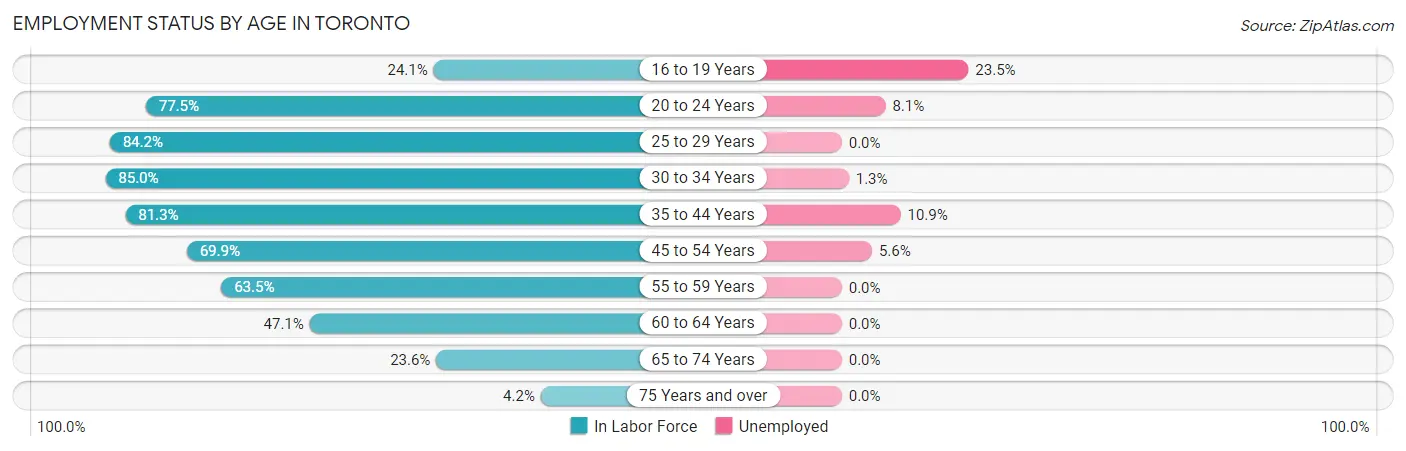
| Age Bracket | In Labor Force | Unemployed |
| 16 to 19 Years | 34 (24.1%) | 8 (23.5%) |
| 20 to 24 Years | 148 (77.5%) | 12 (8.1%) |
| 25 to 29 Years | 224 (84.2%) | 0 (0.0%) |
| 30 to 34 Years | 455 (85.0%) | 6 (1.3%) |
| 35 to 44 Years | 503 (81.3%) | 55 (10.9%) |
| 45 to 54 Years | 432 (69.9%) | 24 (5.6%) |
| 55 to 59 Years | 263 (63.5%) | 0 (0.0%) |
| 60 to 64 Years | 255 (47.1%) | 0 (0.0%) |
| 65 to 74 Years | 138 (23.6%) | 0 (0.0%) |
| 75 Years and over | 15 (4.2%) | 0 (0.0%) |
| Total | 2,465 (57.8%) | 106 (4.3%) |
Employment Status by Educational Attainment in Toronto
According to labor force statistics for Toronto, 71.2% of individuals (2,131) out of the total population between 25 and 64 years of age (2,993) are in the labor force, with 4.0% or 85 of them being unemployed. The group with the highest labor force participation rate are those with the educational attainment of bachelor's degree or higher, with 90.0% or 659 individuals in the labor force. Within the labor force, individuals with high school diploma education have the highest percentage of unemployment, with 8.3% or 53 of them being unemployed.
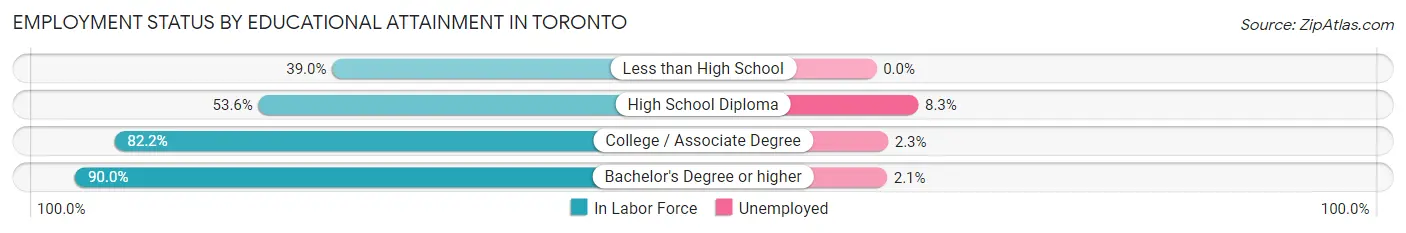
| Educational Attainment | In Labor Force | Unemployed |
| Less than High School | 41 (39.0%) | 0 (0.0%) |
| High School Diploma | 638 (53.6%) | 99 (8.3%) |
| College / Associate Degree | 794 (82.2%) | 22 (2.3%) |
| Bachelor's Degree or higher | 659 (90.0%) | 15 (2.1%) |
| Total | 2,131 (71.2%) | 120 (4.0%) |
Employment Occupations by Sex in Toronto
Management, Business, Science and Arts Occupations
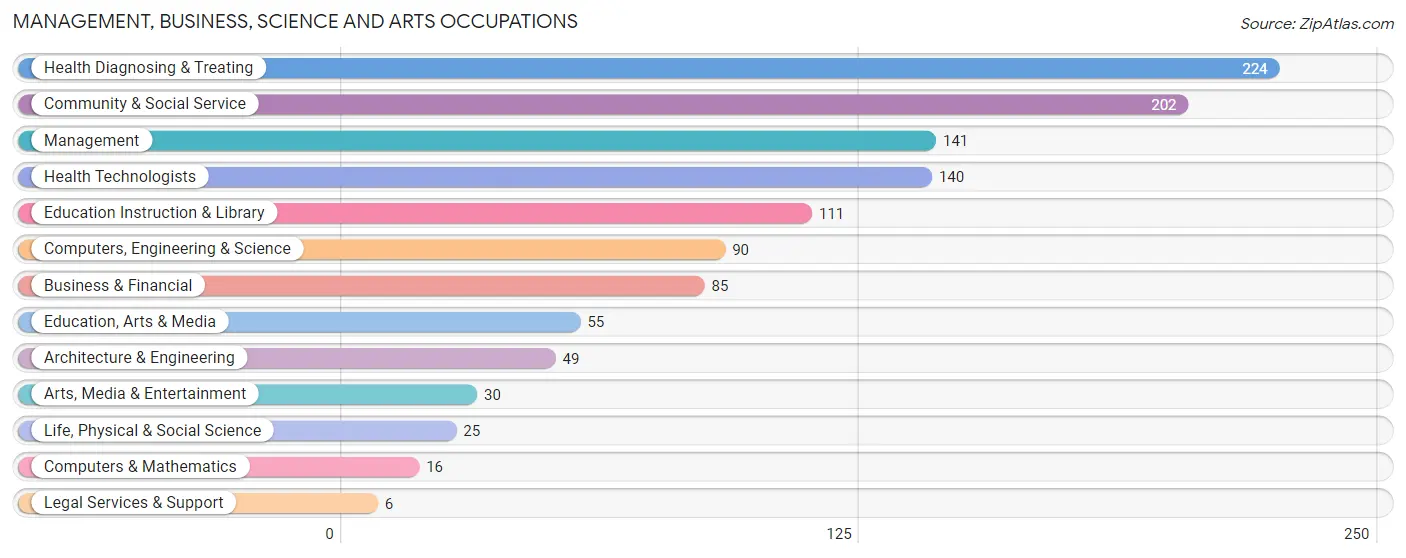
The most common Management, Business, Science and Arts occupations in Toronto are Health Diagnosing & Treating (224 | 9.5%), Community & Social Service (202 | 8.6%), Management (141 | 6.0%), Health Technologists (140 | 5.9%), and Education Instruction & Library (111 | 4.7%).
Management, Business, Science and Arts Occupations by Sex
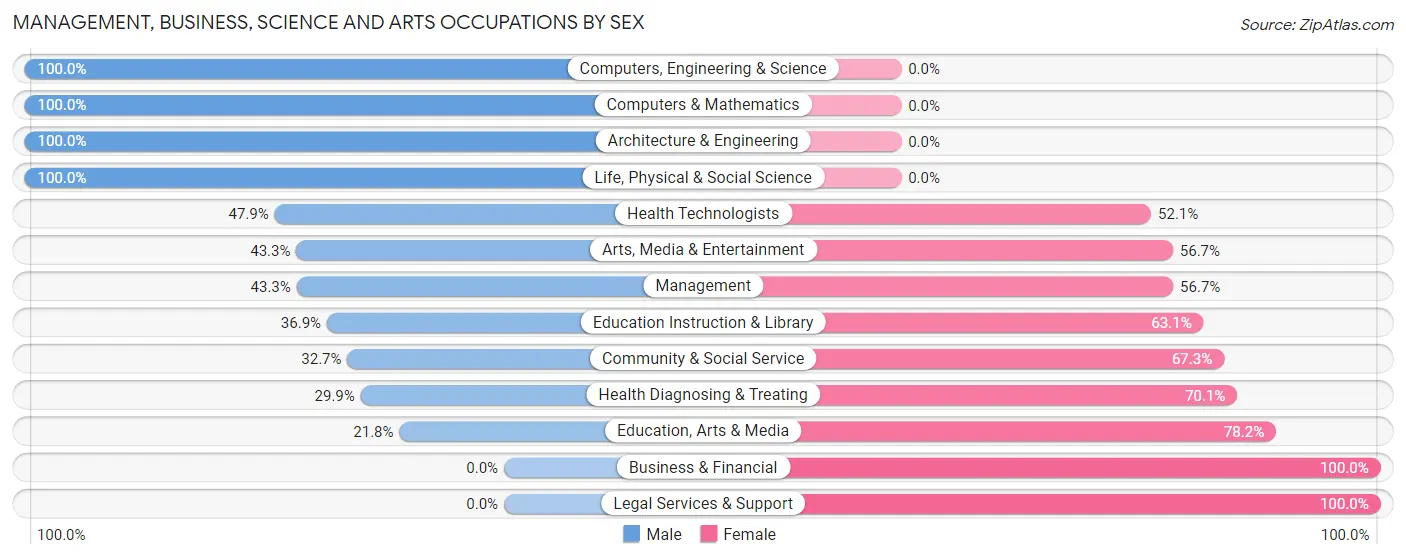
Within the Management, Business, Science and Arts occupations in Toronto, the most male-oriented occupations are Computers, Engineering & Science (100.0%), Computers & Mathematics (100.0%), and Architecture & Engineering (100.0%), while the most female-oriented occupations are Business & Financial (100.0%), Legal Services & Support (100.0%), and Education, Arts & Media (78.2%).
| Occupation | Male | Female |
| Management | 61 (43.3%) | 80 (56.7%) |
| Business & Financial | 0 (0.0%) | 85 (100.0%) |
| Computers, Engineering & Science | 90 (100.0%) | 0 (0.0%) |
| Computers & Mathematics | 16 (100.0%) | 0 (0.0%) |
| Architecture & Engineering | 49 (100.0%) | 0 (0.0%) |
| Life, Physical & Social Science | 25 (100.0%) | 0 (0.0%) |
| Community & Social Service | 66 (32.7%) | 136 (67.3%) |
| Education, Arts & Media | 12 (21.8%) | 43 (78.2%) |
| Legal Services & Support | 0 (0.0%) | 6 (100.0%) |
| Education Instruction & Library | 41 (36.9%) | 70 (63.1%) |
| Arts, Media & Entertainment | 13 (43.3%) | 17 (56.7%) |
| Health Diagnosing & Treating | 67 (29.9%) | 157 (70.1%) |
| Health Technologists | 67 (47.9%) | 73 (52.1%) |
| Total (Category) | 284 (38.3%) | 458 (61.7%) |
| Total (Overall) | 1,036 (43.9%) | 1,326 (56.1%) |
Services Occupations
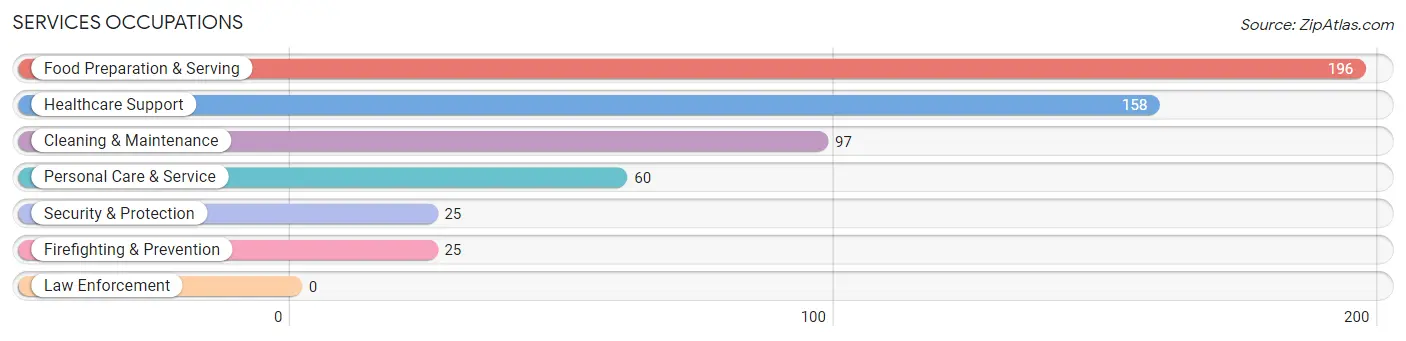
The most common Services occupations in Toronto are Food Preparation & Serving (196 | 8.3%), Healthcare Support (158 | 6.7%), Cleaning & Maintenance (97 | 4.1%), Personal Care & Service (60 | 2.5%), and Security & Protection (25 | 1.1%).
Services Occupations by Sex
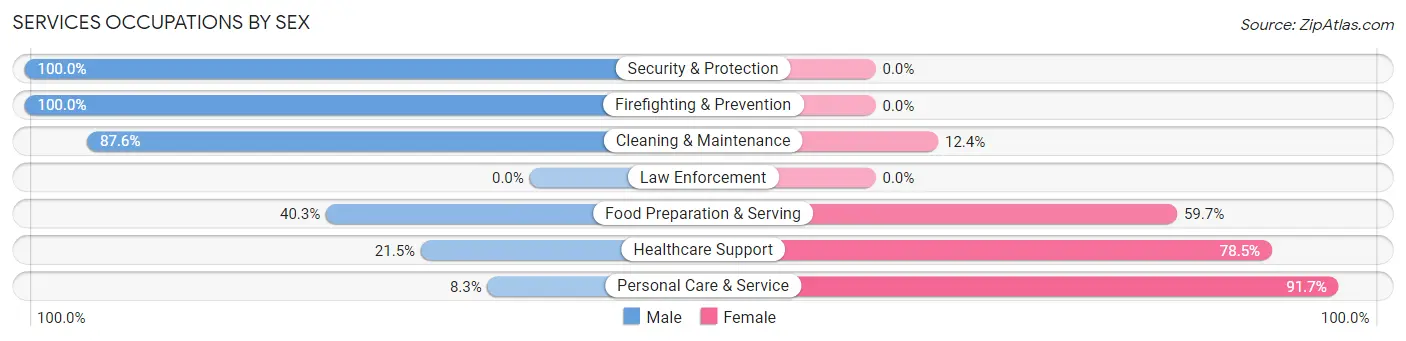
Within the Services occupations in Toronto, the most male-oriented occupations are Security & Protection (100.0%), Firefighting & Prevention (100.0%), and Cleaning & Maintenance (87.6%), while the most female-oriented occupations are Personal Care & Service (91.7%), Healthcare Support (78.5%), and Food Preparation & Serving (59.7%).
| Occupation | Male | Female |
| Healthcare Support | 34 (21.5%) | 124 (78.5%) |
| Security & Protection | 25 (100.0%) | 0 (0.0%) |
| Firefighting & Prevention | 25 (100.0%) | 0 (0.0%) |
| Law Enforcement | 0 (0.0%) | 0 (0.0%) |
| Food Preparation & Serving | 79 (40.3%) | 117 (59.7%) |
| Cleaning & Maintenance | 85 (87.6%) | 12 (12.4%) |
| Personal Care & Service | 5 (8.3%) | 55 (91.7%) |
| Total (Category) | 228 (42.5%) | 308 (57.5%) |
| Total (Overall) | 1,036 (43.9%) | 1,326 (56.1%) |
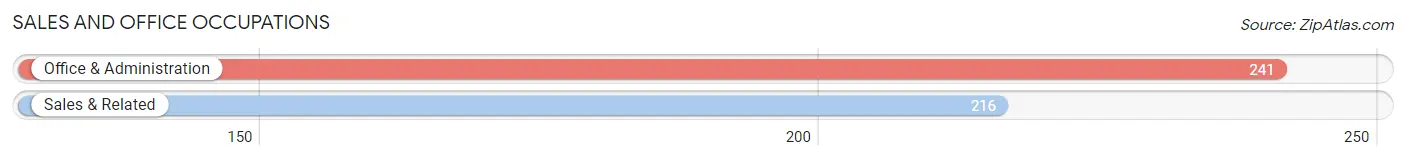
Sales and Office Occupations
The most common Sales and Office occupations in Toronto are Office & Administration (241 | 10.2%), and Sales & Related (216 | 9.1%).
Sales and Office Occupations by Sex
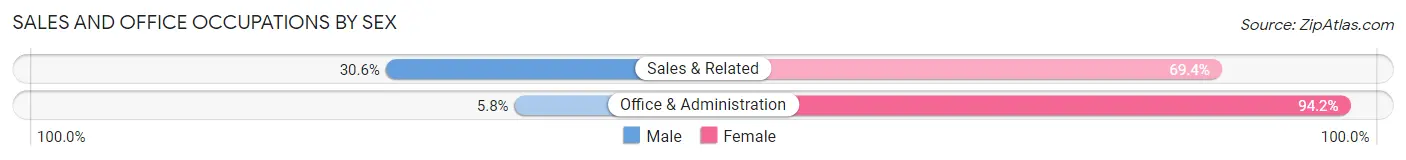
| Occupation | Male | Female |
| Sales & Related | 66 (30.6%) | 150 (69.4%) |
| Office & Administration | 14 (5.8%) | 227 (94.2%) |
| Total (Category) | 80 (17.5%) | 377 (82.5%) |
| Total (Overall) | 1,036 (43.9%) | 1,326 (56.1%) |
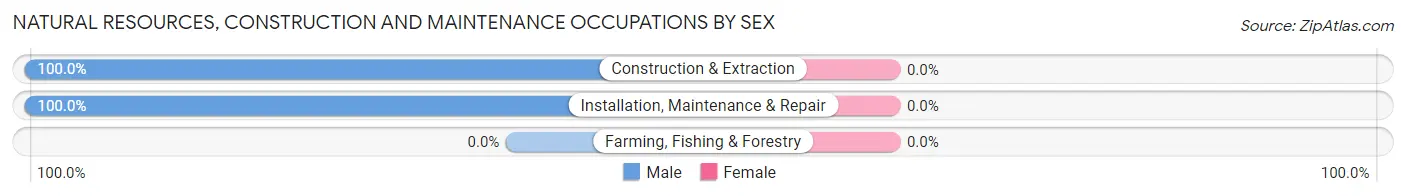
Natural Resources, Construction and Maintenance Occupations
The most common Natural Resources, Construction and Maintenance occupations in Toronto are Construction & Extraction (156 | 6.6%), and Installation, Maintenance & Repair (99 | 4.2%).

Natural Resources, Construction and Maintenance Occupations by Sex
| Occupation | Male | Female |
| Farming, Fishing & Forestry | 0 (0.0%) | 0 (0.0%) |
| Construction & Extraction | 156 (100.0%) | 0 (0.0%) |
| Installation, Maintenance & Repair | 99 (100.0%) | 0 (0.0%) |
| Total (Category) | 255 (100.0%) | 0 (0.0%) |
| Total (Overall) | 1,036 (43.9%) | 1,326 (56.1%) |
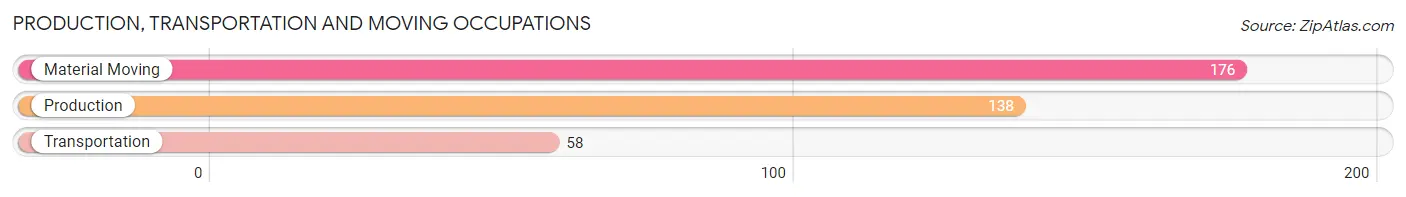
Production, Transportation and Moving Occupations
The most common Production, Transportation and Moving occupations in Toronto are Material Moving (176 | 7.4%), Production (138 | 5.8%), and Transportation (58 | 2.5%).
Production, Transportation and Moving Occupations by Sex
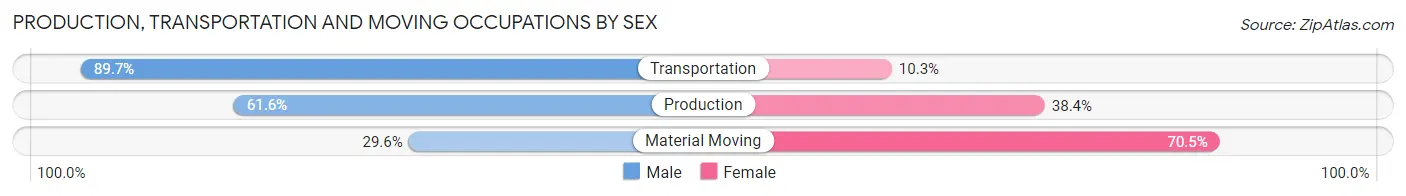
| Occupation | Male | Female |
| Production | 85 (61.6%) | 53 (38.4%) |
| Transportation | 52 (89.7%) | 6 (10.3%) |
| Material Moving | 52 (29.5%) | 124 (70.5%) |
| Total (Category) | 189 (50.8%) | 183 (49.2%) |
| Total (Overall) | 1,036 (43.9%) | 1,326 (56.1%) |
Employment Industries by Sex in Toronto
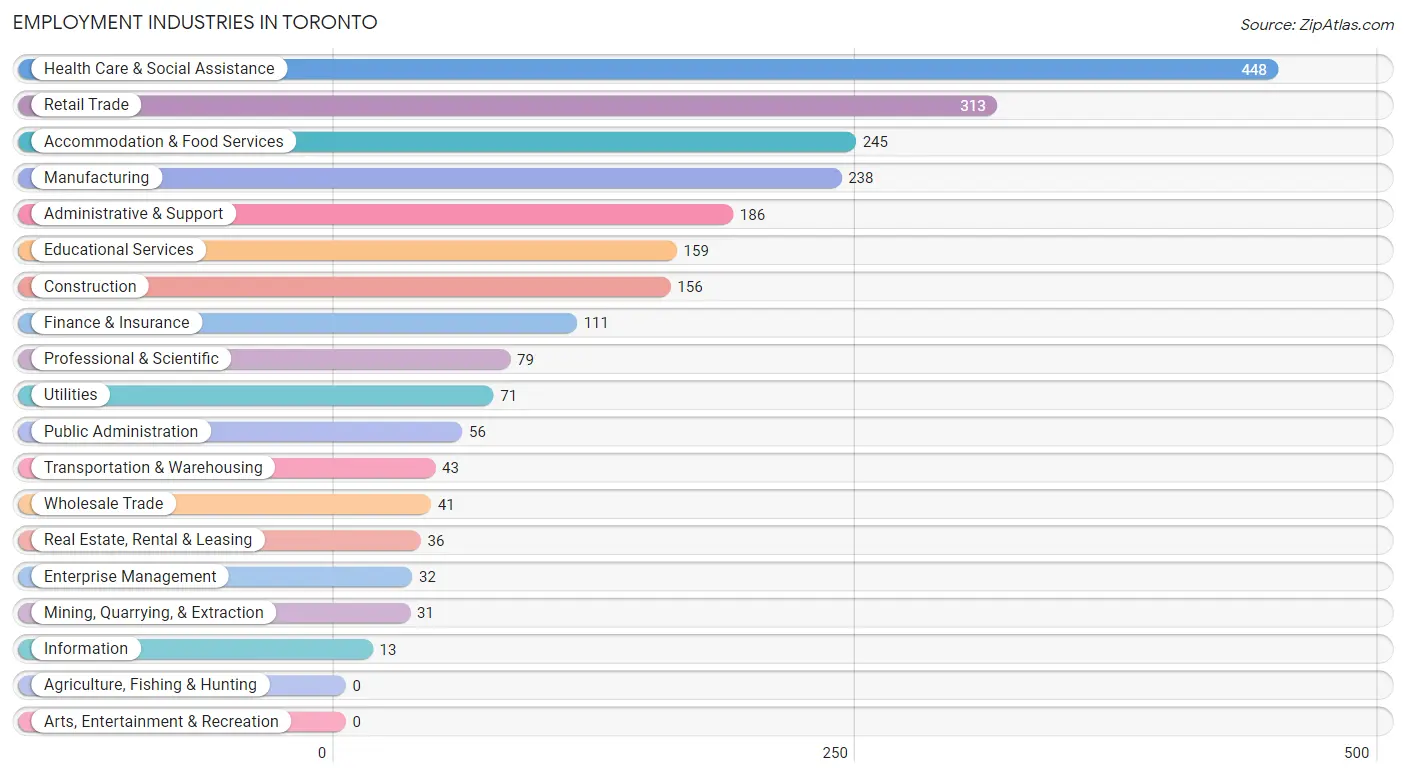
Employment Industries in Toronto
The major employment industries in Toronto include Health Care & Social Assistance (448 | 19.0%), Retail Trade (313 | 13.3%), Accommodation & Food Services (245 | 10.4%), Manufacturing (238 | 10.1%), and Administrative & Support (186 | 7.9%).
Employment Industries by Sex in Toronto
The Toronto industries that see more men than women are Mining, Quarrying, & Extraction (100.0%), Utilities (100.0%), and Information (100.0%), whereas the industries that tend to have a higher number of women are Enterprise Management (100.0%), Finance & Insurance (90.1%), and Real Estate, Rental & Leasing (86.1%).
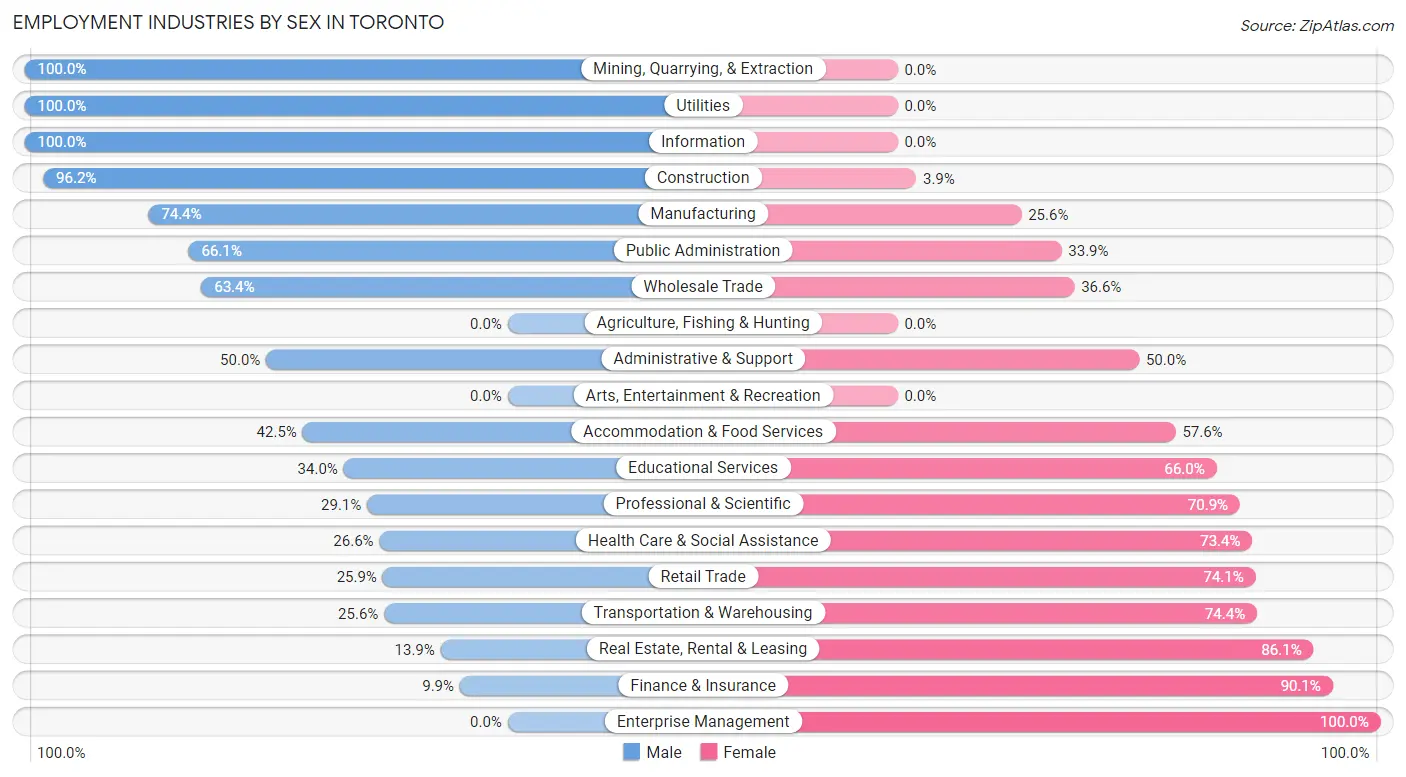
| Industry | Male | Female |
| Agriculture, Fishing & Hunting | 0 (0.0%) | 0 (0.0%) |
| Mining, Quarrying, & Extraction | 31 (100.0%) | 0 (0.0%) |
| Construction | 150 (96.2%) | 6 (3.8%) |
| Manufacturing | 177 (74.4%) | 61 (25.6%) |
| Wholesale Trade | 26 (63.4%) | 15 (36.6%) |
| Retail Trade | 81 (25.9%) | 232 (74.1%) |
| Transportation & Warehousing | 11 (25.6%) | 32 (74.4%) |
| Utilities | 71 (100.0%) | 0 (0.0%) |
| Information | 13 (100.0%) | 0 (0.0%) |
| Finance & Insurance | 11 (9.9%) | 100 (90.1%) |
| Real Estate, Rental & Leasing | 5 (13.9%) | 31 (86.1%) |
| Professional & Scientific | 23 (29.1%) | 56 (70.9%) |
| Enterprise Management | 0 (0.0%) | 32 (100.0%) |
| Administrative & Support | 93 (50.0%) | 93 (50.0%) |
| Educational Services | 54 (34.0%) | 105 (66.0%) |
| Health Care & Social Assistance | 119 (26.6%) | 329 (73.4%) |
| Arts, Entertainment & Recreation | 0 (0.0%) | 0 (0.0%) |
| Accommodation & Food Services | 104 (42.4%) | 141 (57.6%) |
| Public Administration | 37 (66.1%) | 19 (33.9%) |
| Total | 1,036 (43.9%) | 1,326 (56.1%) |
Education in Toronto
School Enrollment in Toronto
The most common levels of schooling among the 1,040 students in Toronto are elementary school (277 | 26.6%), middle school (239 | 23.0%), and high school (228 | 21.9%).
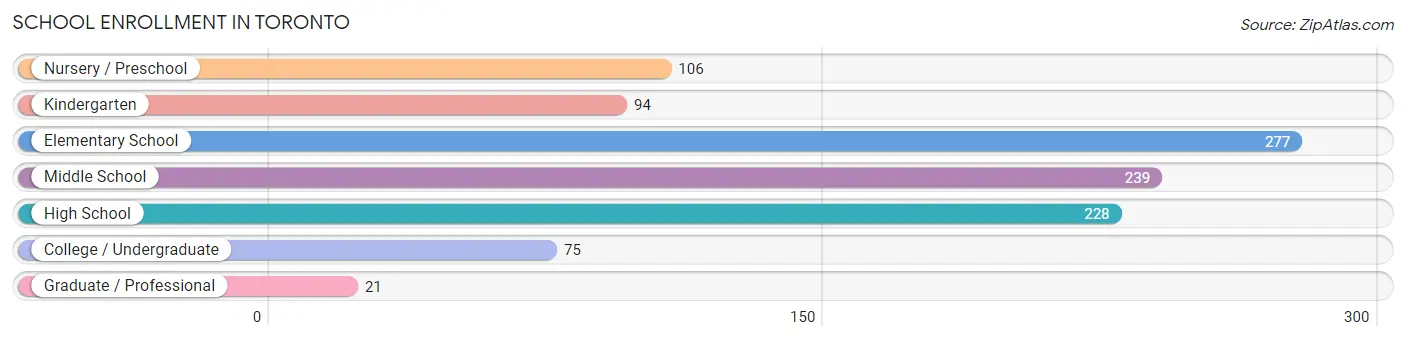
| School Level | # Students | % Students |
| Nursery / Preschool | 106 | 10.2% |
| Kindergarten | 94 | 9.0% |
| Elementary School | 277 | 26.6% |
| Middle School | 239 | 23.0% |
| High School | 228 | 21.9% |
| College / Undergraduate | 75 | 7.2% |
| Graduate / Professional | 21 | 2.0% |
| Total | 1,040 | 100.0% |
School Enrollment by Age by Funding Source in Toronto
Out of a total of 1,040 students who are enrolled in schools in Toronto, 100 (9.6%) attend a private institution, while the remaining 940 (90.4%) are enrolled in public schools. The age group of 25 to 34 year olds has the highest likelihood of being enrolled in private schools, with 16 (50.0% in the age bracket) enrolled. Conversely, the age group of 3 to 4 year olds has the lowest likelihood of being enrolled in a private school, with 27 (100.0% in the age bracket) attending a public institution.
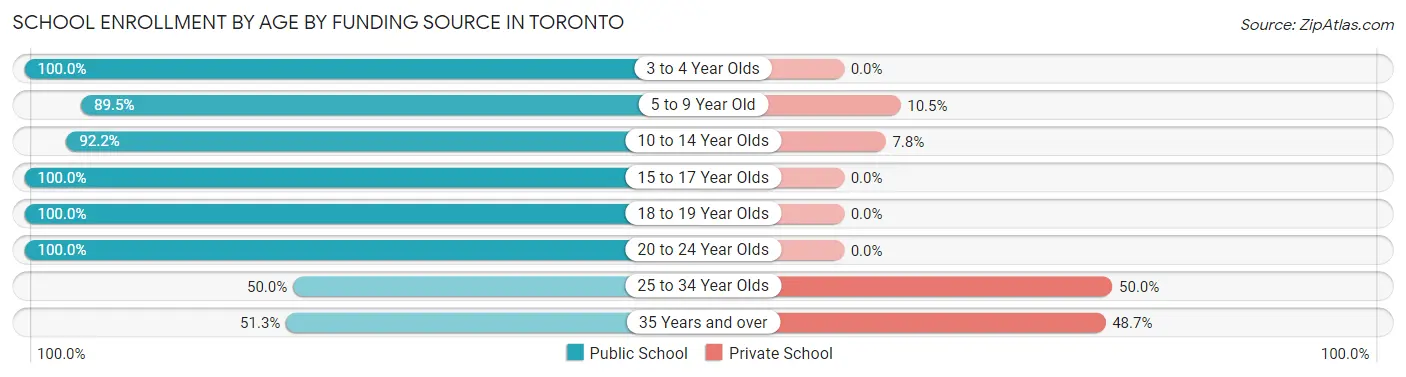
| Age Bracket | Public School | Private School |
| 3 to 4 Year Olds | 27 (100.0%) | 0 (0.0%) |
| 5 to 9 Year Old | 399 (89.5%) | 47 (10.5%) |
| 10 to 14 Year Olds | 213 (92.2%) | 18 (7.8%) |
| 15 to 17 Year Olds | 215 (100.0%) | 0 (0.0%) |
| 18 to 19 Year Olds | 28 (100.0%) | 0 (0.0%) |
| 20 to 24 Year Olds | 22 (100.0%) | 0 (0.0%) |
| 25 to 34 Year Olds | 16 (50.0%) | 16 (50.0%) |
| 35 Years and over | 20 (51.3%) | 19 (48.7%) |
| Total | 940 (90.4%) | 100 (9.6%) |
Educational Attainment by Field of Study in Toronto
Education (261 | 30.2%), science & technology (201 | 23.2%), bio, nature & agricultural (57 | 6.6%), business (54 | 6.2%), and arts & humanities (50 | 5.8%) are the most common fields of study among 865 individuals in Toronto who have obtained a bachelor's degree or higher.
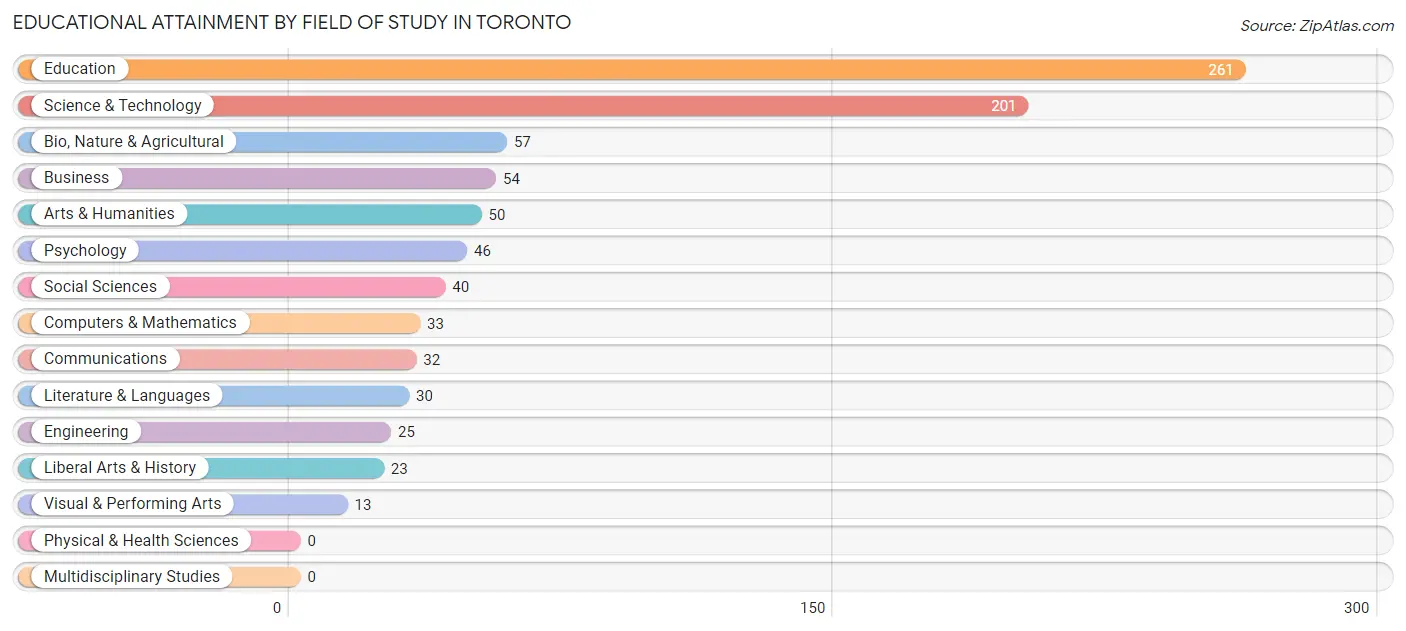
| Field of Study | # Graduates | % Graduates |
| Computers & Mathematics | 33 | 3.8% |
| Bio, Nature & Agricultural | 57 | 6.6% |
| Physical & Health Sciences | 0 | 0.0% |
| Psychology | 46 | 5.3% |
| Social Sciences | 40 | 4.6% |
| Engineering | 25 | 2.9% |
| Multidisciplinary Studies | 0 | 0.0% |
| Science & Technology | 201 | 23.2% |
| Business | 54 | 6.2% |
| Education | 261 | 30.2% |
| Literature & Languages | 30 | 3.5% |
| Liberal Arts & History | 23 | 2.7% |
| Visual & Performing Arts | 13 | 1.5% |
| Communications | 32 | 3.7% |
| Arts & Humanities | 50 | 5.8% |
| Total | 865 | 100.0% |
Transportation & Commute in Toronto
Vehicle Availability by Sex in Toronto
The most prevalent vehicle ownership categories in Toronto are males with 2 vehicles (551, accounting for 53.2%) and females with 2 vehicles (663, making up 41.9%).
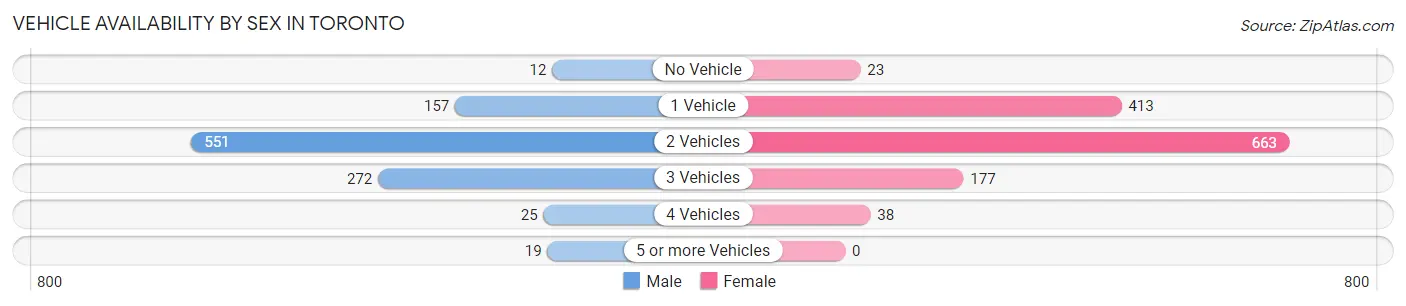
| Vehicles Available | Male | Female |
| No Vehicle | 12 (1.2%) | 23 (1.8%) |
| 1 Vehicle | 157 (15.1%) | 413 (31.4%) |
| 2 Vehicles | 551 (53.2%) | 663 (50.5%) |
| 3 Vehicles | 272 (26.3%) | 177 (13.5%) |
| 4 Vehicles | 25 (2.4%) | 38 (2.9%) |
| 5 or more Vehicles | 19 (1.8%) | 0 (0.0%) |
| Total | 1,036 (100.0%) | 1,314 (100.0%) |
Commute Time in Toronto
The most frequently occuring commute durations in Toronto are 5 to 9 minutes (426 commuters, 19.5%), 20 to 24 minutes (393 commuters, 18.0%), and 15 to 19 minutes (371 commuters, 17.0%).
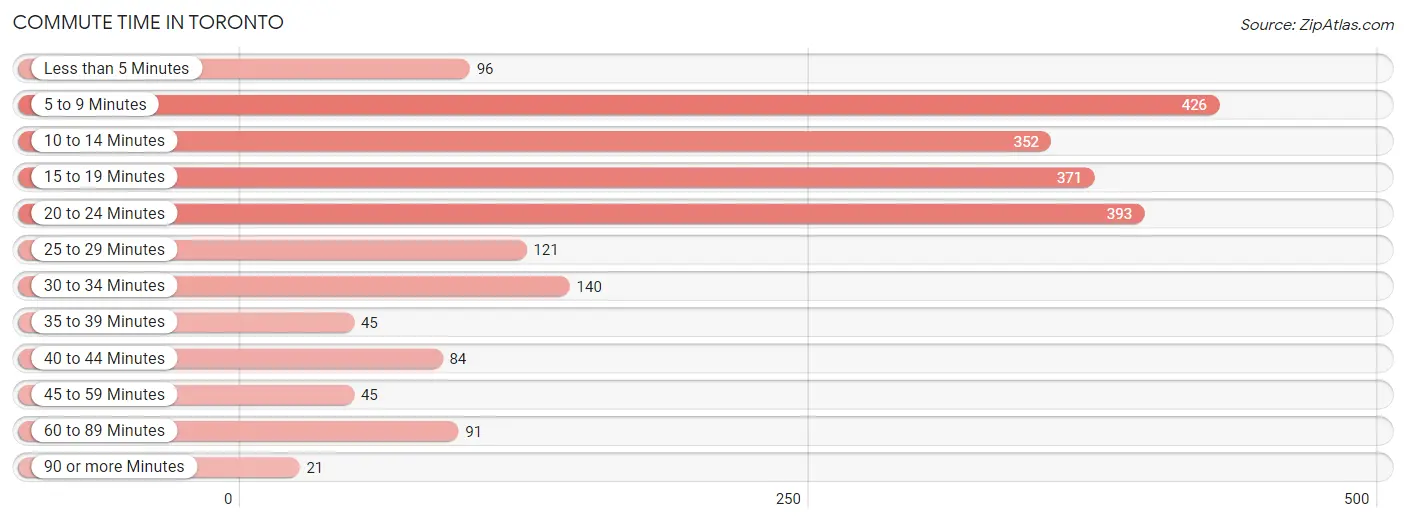
| Commute Time | # Commuters | % Commuters |
| Less than 5 Minutes | 96 | 4.4% |
| 5 to 9 Minutes | 426 | 19.5% |
| 10 to 14 Minutes | 352 | 16.1% |
| 15 to 19 Minutes | 371 | 17.0% |
| 20 to 24 Minutes | 393 | 18.0% |
| 25 to 29 Minutes | 121 | 5.5% |
| 30 to 34 Minutes | 140 | 6.4% |
| 35 to 39 Minutes | 45 | 2.1% |
| 40 to 44 Minutes | 84 | 3.8% |
| 45 to 59 Minutes | 45 | 2.1% |
| 60 to 89 Minutes | 91 | 4.2% |
| 90 or more Minutes | 21 | 1.0% |
Commute Time by Sex in Toronto
The most common commute times in Toronto are 20 to 24 minutes (196 commuters, 19.8%) for males and 5 to 9 minutes (286 commuters, 23.9%) for females.
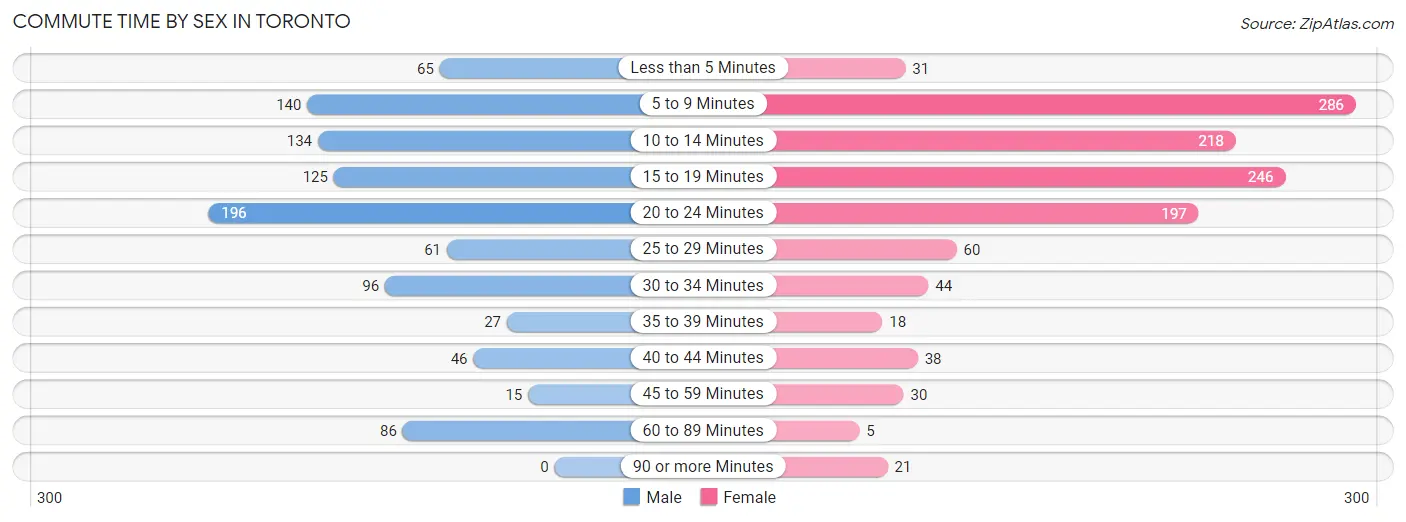
| Commute Time | Male | Female |
| Less than 5 Minutes | 65 (6.6%) | 31 (2.6%) |
| 5 to 9 Minutes | 140 (14.1%) | 286 (23.9%) |
| 10 to 14 Minutes | 134 (13.5%) | 218 (18.3%) |
| 15 to 19 Minutes | 125 (12.6%) | 246 (20.6%) |
| 20 to 24 Minutes | 196 (19.8%) | 197 (16.5%) |
| 25 to 29 Minutes | 61 (6.2%) | 60 (5.0%) |
| 30 to 34 Minutes | 96 (9.7%) | 44 (3.7%) |
| 35 to 39 Minutes | 27 (2.7%) | 18 (1.5%) |
| 40 to 44 Minutes | 46 (4.6%) | 38 (3.2%) |
| 45 to 59 Minutes | 15 (1.5%) | 30 (2.5%) |
| 60 to 89 Minutes | 86 (8.7%) | 5 (0.4%) |
| 90 or more Minutes | 0 (0.0%) | 21 (1.8%) |
Time of Departure to Work by Sex in Toronto
The most frequent times of departure to work in Toronto are 6:30 AM to 6:59 AM (168, 17.0%) for males and 8:00 AM to 8:29 AM (237, 19.9%) for females.
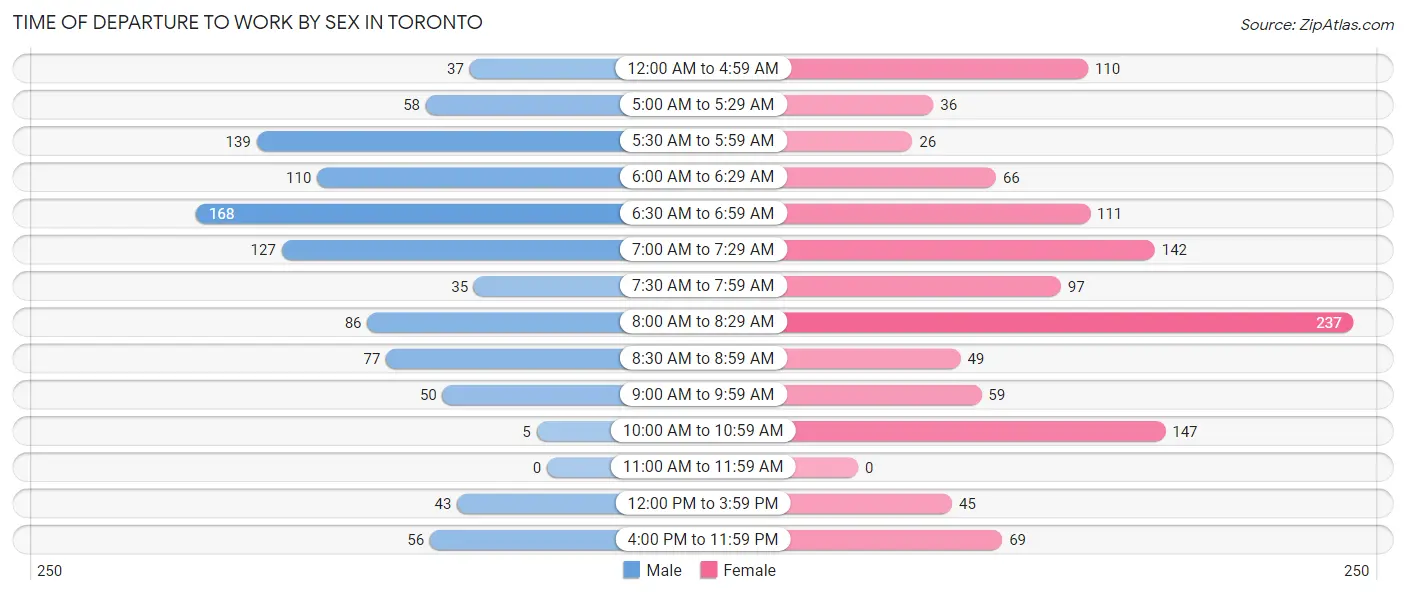
| Time of Departure | Male | Female |
| 12:00 AM to 4:59 AM | 37 (3.7%) | 110 (9.2%) |
| 5:00 AM to 5:29 AM | 58 (5.9%) | 36 (3.0%) |
| 5:30 AM to 5:59 AM | 139 (14.0%) | 26 (2.2%) |
| 6:00 AM to 6:29 AM | 110 (11.1%) | 66 (5.5%) |
| 6:30 AM to 6:59 AM | 168 (17.0%) | 111 (9.3%) |
| 7:00 AM to 7:29 AM | 127 (12.8%) | 142 (11.9%) |
| 7:30 AM to 7:59 AM | 35 (3.5%) | 97 (8.1%) |
| 8:00 AM to 8:29 AM | 86 (8.7%) | 237 (19.9%) |
| 8:30 AM to 8:59 AM | 77 (7.8%) | 49 (4.1%) |
| 9:00 AM to 9:59 AM | 50 (5.1%) | 59 (4.9%) |
| 10:00 AM to 10:59 AM | 5 (0.5%) | 147 (12.3%) |
| 11:00 AM to 11:59 AM | 0 (0.0%) | 0 (0.0%) |
| 12:00 PM to 3:59 PM | 43 (4.3%) | 45 (3.8%) |
| 4:00 PM to 11:59 PM | 56 (5.7%) | 69 (5.8%) |
| Total | 991 (100.0%) | 1,194 (100.0%) |
Housing Occupancy in Toronto
Occupancy by Ownership in Toronto
Of the total 2,417 dwellings in Toronto, owner-occupied units account for 1,762 (72.9%), while renter-occupied units make up 655 (27.1%).
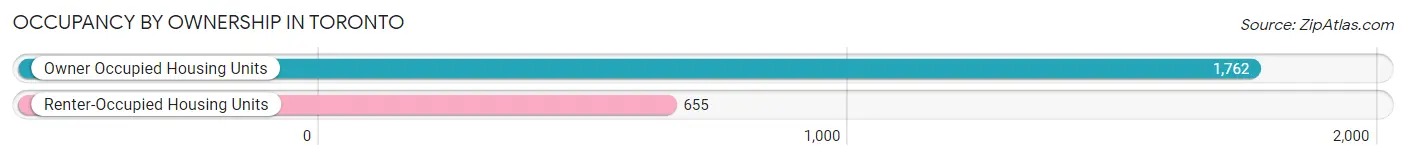
| Occupancy | # Housing Units | % Housing Units |
| Owner Occupied Housing Units | 1,762 | 72.9% |
| Renter-Occupied Housing Units | 655 | 27.1% |
| Total Occupied Housing Units | 2,417 | 100.0% |
Occupancy by Household Size in Toronto
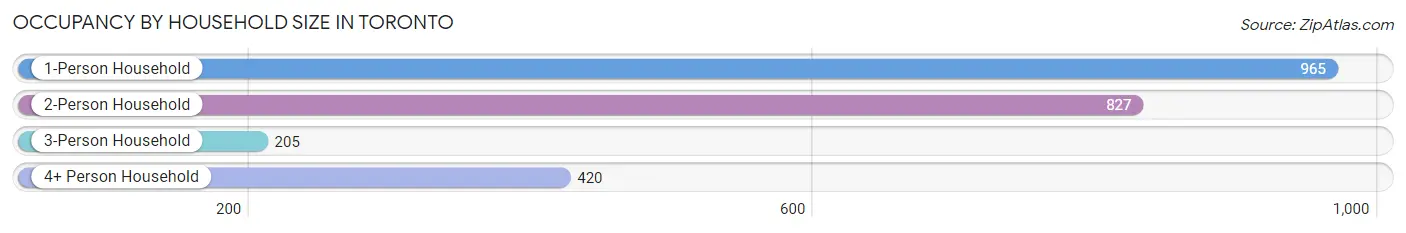
| Household Size | # Housing Units | % Housing Units |
| 1-Person Household | 965 | 39.9% |
| 2-Person Household | 827 | 34.2% |
| 3-Person Household | 205 | 8.5% |
| 4+ Person Household | 420 | 17.4% |
| Total Housing Units | 2,417 | 100.0% |
Occupancy by Ownership by Household Size in Toronto
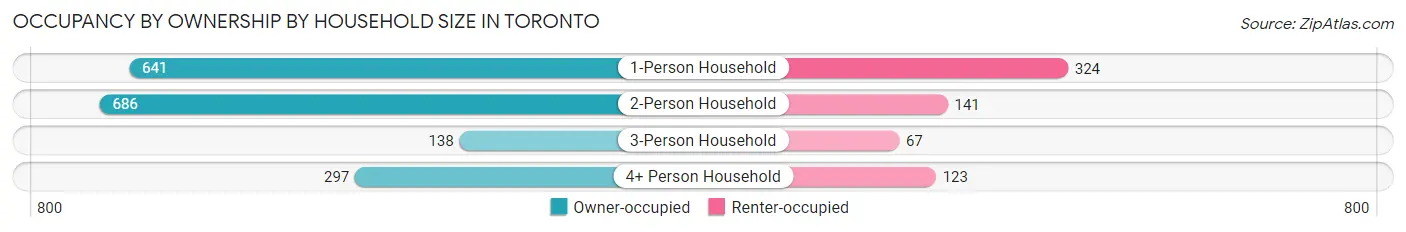
| Household Size | Owner-occupied | Renter-occupied |
| 1-Person Household | 641 (66.4%) | 324 (33.6%) |
| 2-Person Household | 686 (83.0%) | 141 (17.1%) |
| 3-Person Household | 138 (67.3%) | 67 (32.7%) |
| 4+ Person Household | 297 (70.7%) | 123 (29.3%) |
| Total Housing Units | 1,762 (72.9%) | 655 (27.1%) |
Occupancy by Educational Attainment in Toronto
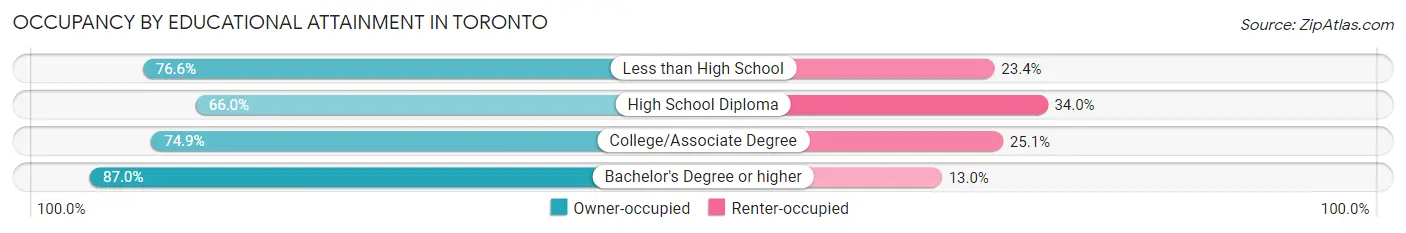
| Household Size | Owner-occupied | Renter-occupied |
| Less than High School | 98 (76.6%) | 30 (23.4%) |
| High School Diploma | 743 (66.0%) | 382 (34.0%) |
| College/Associate Degree | 566 (74.9%) | 190 (25.1%) |
| Bachelor's Degree or higher | 355 (87.0%) | 53 (13.0%) |
Occupancy by Age of Householder in Toronto
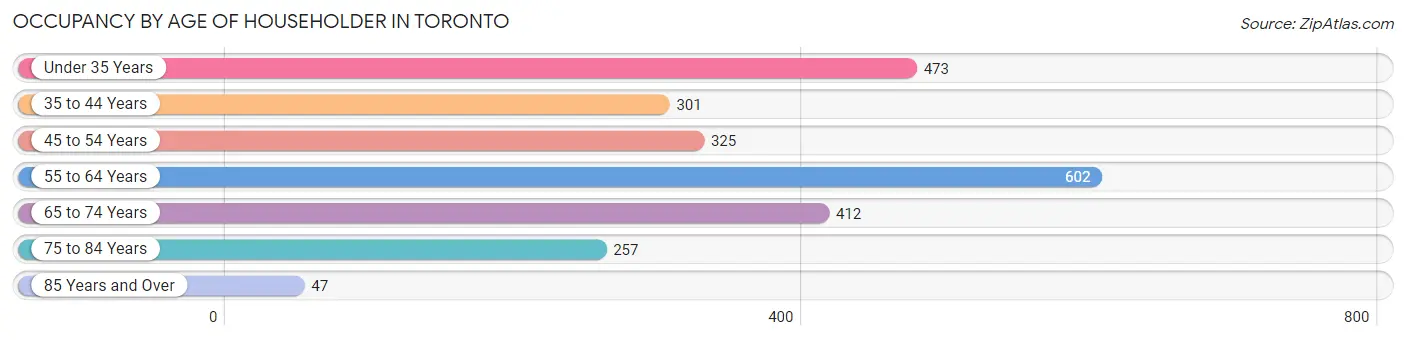
| Age Bracket | # Households | % Households |
| Under 35 Years | 473 | 19.6% |
| 35 to 44 Years | 301 | 12.4% |
| 45 to 54 Years | 325 | 13.5% |
| 55 to 64 Years | 602 | 24.9% |
| 65 to 74 Years | 412 | 17.1% |
| 75 to 84 Years | 257 | 10.6% |
| 85 Years and Over | 47 | 1.9% |
| Total | 2,417 | 100.0% |
Housing Finances in Toronto
Median Income by Occupancy in Toronto
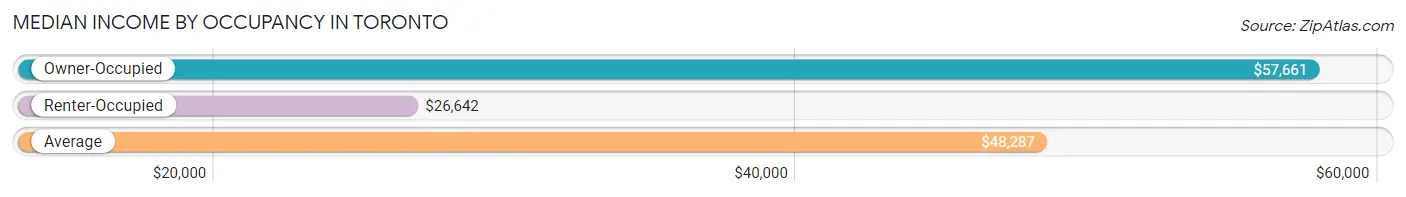
| Occupancy Type | # Households | Median Income |
| Owner-Occupied | 1,762 (72.9%) | $57,661 |
| Renter-Occupied | 655 (27.1%) | $26,642 |
| Average | 2,417 (100.0%) | $48,287 |
Occupancy by Householder Income Bracket in Toronto
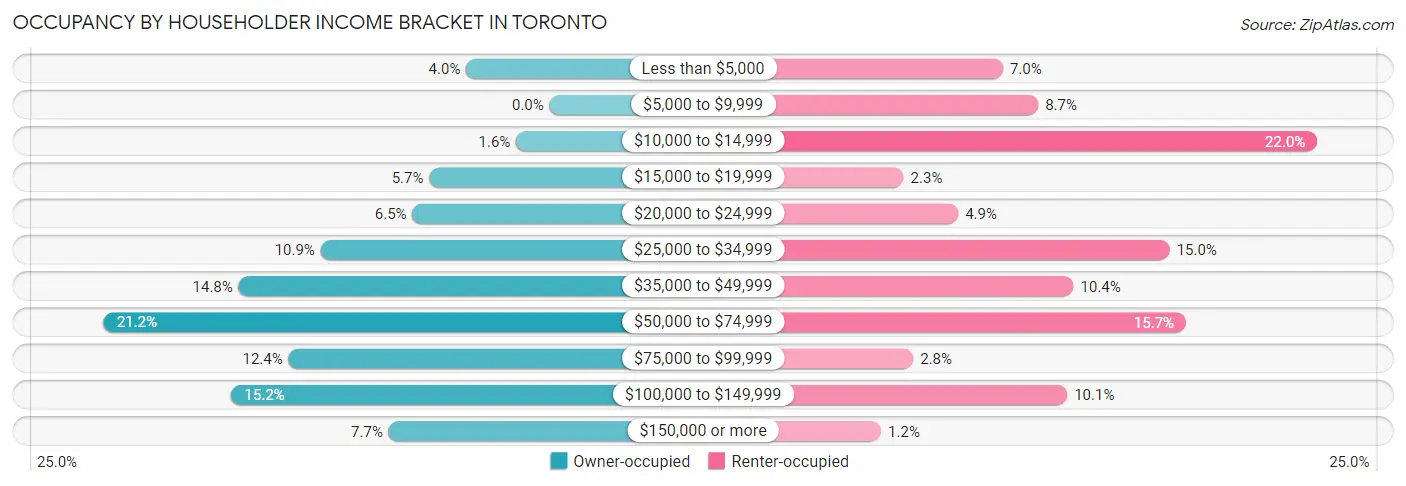
| Income Bracket | Owner-occupied | Renter-occupied |
| Less than $5,000 | 70 (4.0%) | 46 (7.0%) |
| $5,000 to $9,999 | 0 (0.0%) | 57 (8.7%) |
| $10,000 to $14,999 | 28 (1.6%) | 144 (22.0%) |
| $15,000 to $19,999 | 101 (5.7%) | 15 (2.3%) |
| $20,000 to $24,999 | 115 (6.5%) | 32 (4.9%) |
| $25,000 to $34,999 | 192 (10.9%) | 98 (15.0%) |
| $35,000 to $49,999 | 261 (14.8%) | 68 (10.4%) |
| $50,000 to $74,999 | 374 (21.2%) | 103 (15.7%) |
| $75,000 to $99,999 | 219 (12.4%) | 18 (2.8%) |
| $100,000 to $149,999 | 267 (15.1%) | 66 (10.1%) |
| $150,000 or more | 135 (7.7%) | 8 (1.2%) |
| Total | 1,762 (100.0%) | 655 (100.0%) |
Monthly Housing Cost Tiers in Toronto
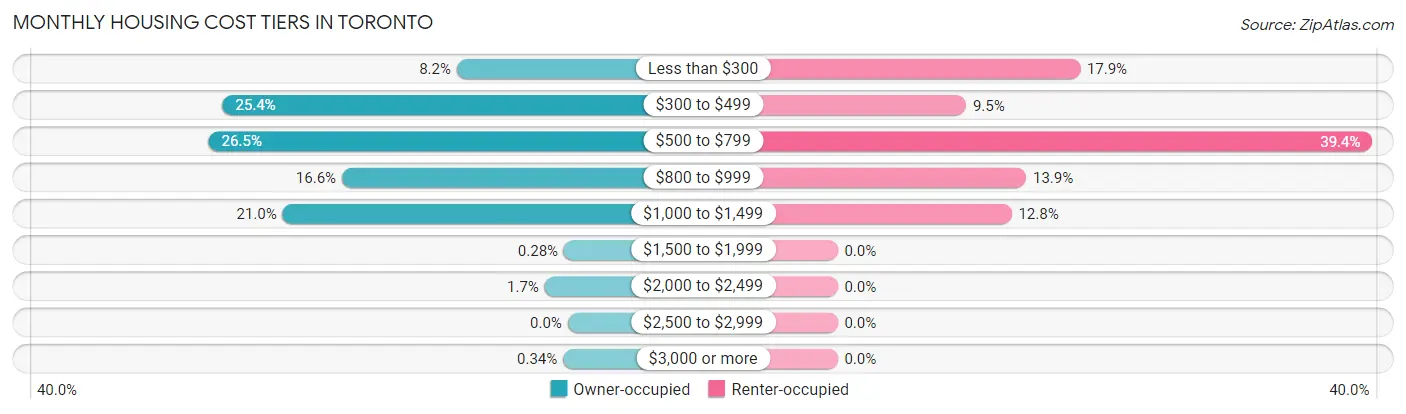
| Monthly Cost | Owner-occupied | Renter-occupied |
| Less than $300 | 144 (8.2%) | 117 (17.9%) |
| $300 to $499 | 448 (25.4%) | 62 (9.5%) |
| $500 to $799 | 466 (26.5%) | 258 (39.4%) |
| $800 to $999 | 293 (16.6%) | 91 (13.9%) |
| $1,000 to $1,499 | 370 (21.0%) | 84 (12.8%) |
| $1,500 to $1,999 | 5 (0.3%) | 0 (0.0%) |
| $2,000 to $2,499 | 30 (1.7%) | 0 (0.0%) |
| $2,500 to $2,999 | 0 (0.0%) | 0 (0.0%) |
| $3,000 or more | 6 (0.3%) | 0 (0.0%) |
| Total | 1,762 (100.0%) | 655 (100.0%) |
Physical Housing Characteristics in Toronto
Housing Structures in Toronto
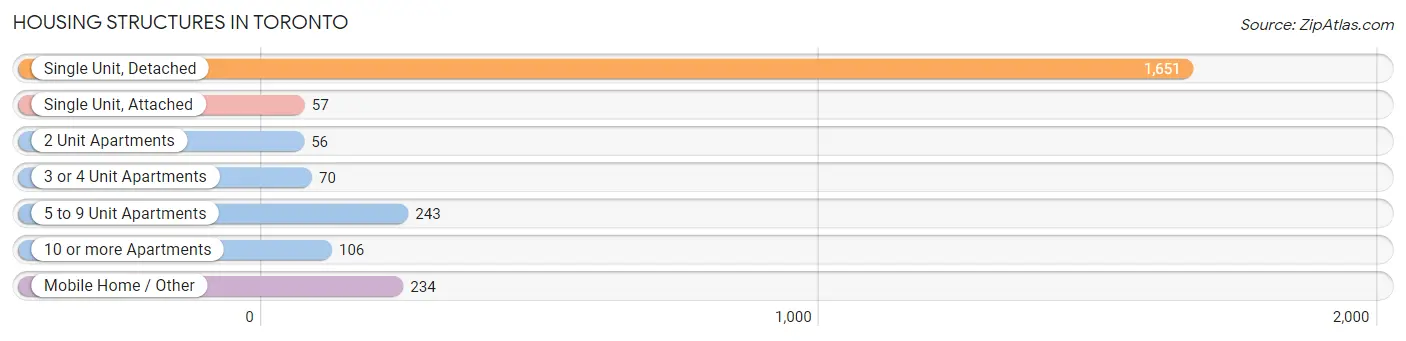
| Structure Type | # Housing Units | % Housing Units |
| Single Unit, Detached | 1,651 | 68.3% |
| Single Unit, Attached | 57 | 2.4% |
| 2 Unit Apartments | 56 | 2.3% |
| 3 or 4 Unit Apartments | 70 | 2.9% |
| 5 to 9 Unit Apartments | 243 | 10.1% |
| 10 or more Apartments | 106 | 4.4% |
| Mobile Home / Other | 234 | 9.7% |
| Total | 2,417 | 100.0% |
Housing Structures by Occupancy in Toronto
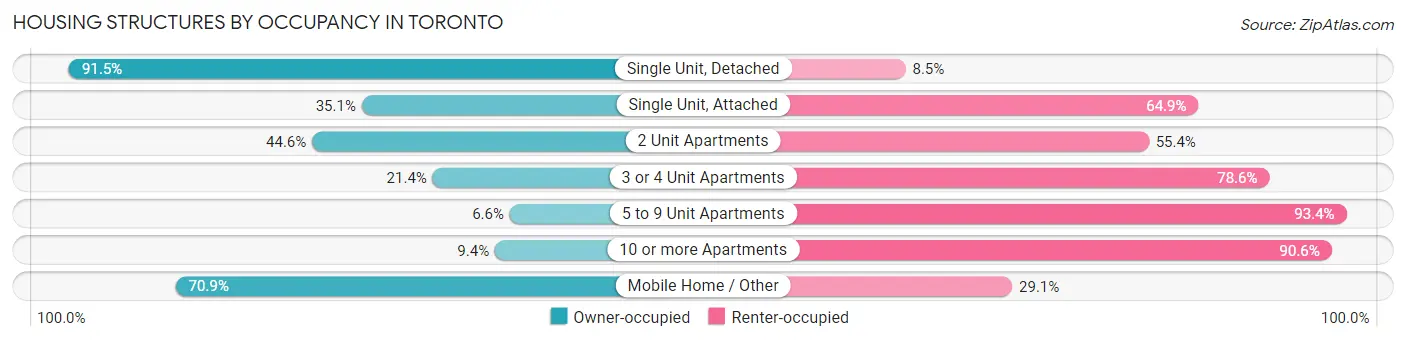
| Structure Type | Owner-occupied | Renter-occupied |
| Single Unit, Detached | 1,510 (91.5%) | 141 (8.5%) |
| Single Unit, Attached | 20 (35.1%) | 37 (64.9%) |
| 2 Unit Apartments | 25 (44.6%) | 31 (55.4%) |
| 3 or 4 Unit Apartments | 15 (21.4%) | 55 (78.6%) |
| 5 to 9 Unit Apartments | 16 (6.6%) | 227 (93.4%) |
| 10 or more Apartments | 10 (9.4%) | 96 (90.6%) |
| Mobile Home / Other | 166 (70.9%) | 68 (29.1%) |
| Total | 1,762 (72.9%) | 655 (27.1%) |
Housing Structures by Number of Rooms in Toronto
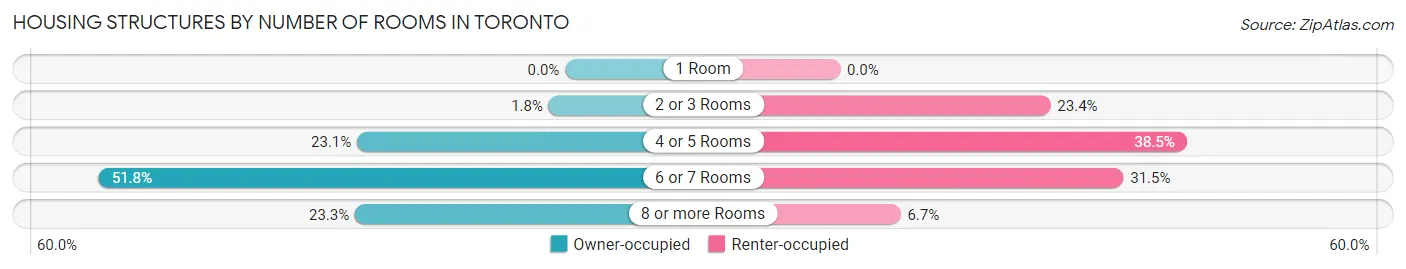
| Number of Rooms | Owner-occupied | Renter-occupied |
| 1 Room | 0 (0.0%) | 0 (0.0%) |
| 2 or 3 Rooms | 32 (1.8%) | 153 (23.4%) |
| 4 or 5 Rooms | 407 (23.1%) | 252 (38.5%) |
| 6 or 7 Rooms | 912 (51.8%) | 206 (31.5%) |
| 8 or more Rooms | 411 (23.3%) | 44 (6.7%) |
| Total | 1,762 (100.0%) | 655 (100.0%) |
Housing Structure by Heating Type in Toronto
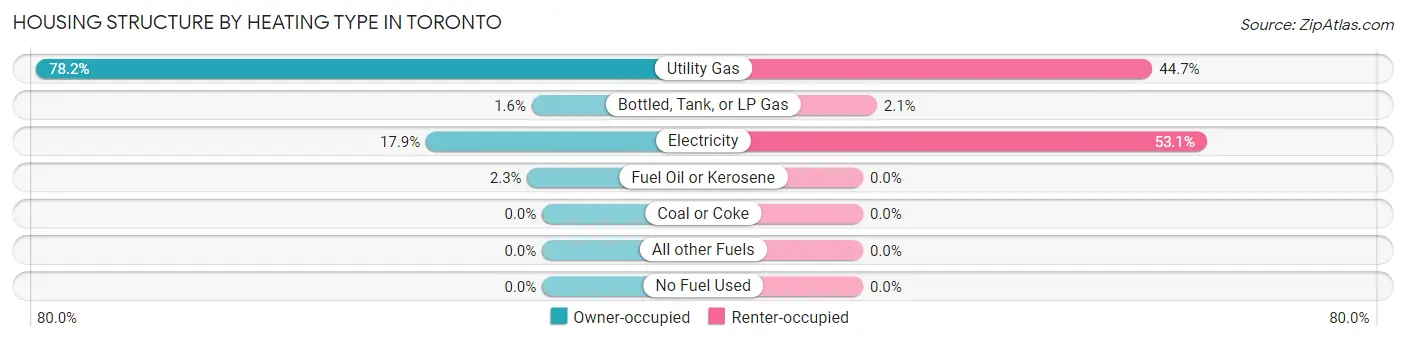
| Heating Type | Owner-occupied | Renter-occupied |
| Utility Gas | 1,378 (78.2%) | 293 (44.7%) |
| Bottled, Tank, or LP Gas | 28 (1.6%) | 14 (2.1%) |
| Electricity | 316 (17.9%) | 348 (53.1%) |
| Fuel Oil or Kerosene | 40 (2.3%) | 0 (0.0%) |
| Coal or Coke | 0 (0.0%) | 0 (0.0%) |
| All other Fuels | 0 (0.0%) | 0 (0.0%) |
| No Fuel Used | 0 (0.0%) | 0 (0.0%) |
| Total | 1,762 (100.0%) | 655 (100.0%) |
Household Vehicle Usage in Toronto
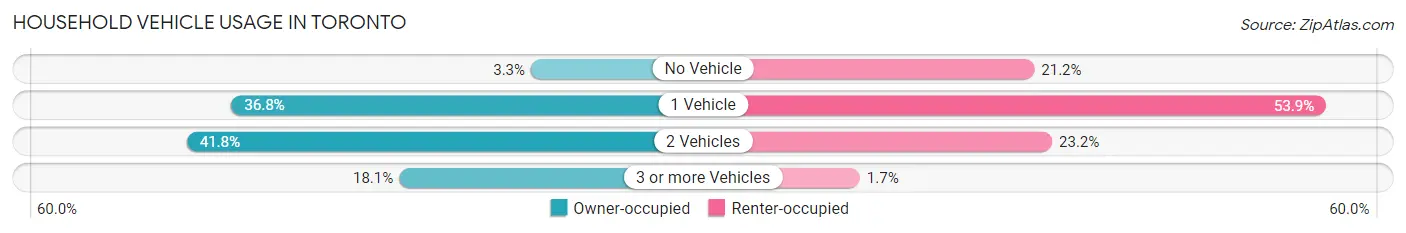
| Vehicles per Household | Owner-occupied | Renter-occupied |
| No Vehicle | 58 (3.3%) | 139 (21.2%) |
| 1 Vehicle | 649 (36.8%) | 353 (53.9%) |
| 2 Vehicles | 737 (41.8%) | 152 (23.2%) |
| 3 or more Vehicles | 318 (18.0%) | 11 (1.7%) |
| Total | 1,762 (100.0%) | 655 (100.0%) |
Real Estate & Mortgages in Toronto
Real Estate and Mortgage Overview in Toronto
| Characteristic | Without Mortgage | With Mortgage |
| Housing Units | 858 | 904 |
| Median Property Value | $90,900 | $110,900 |
| Median Household Income | $44,817 | $67 |
| Monthly Housing Costs | $446 | $0 |
| Real Estate Taxes | $900 | $75 |
Property Value by Mortgage Status in Toronto
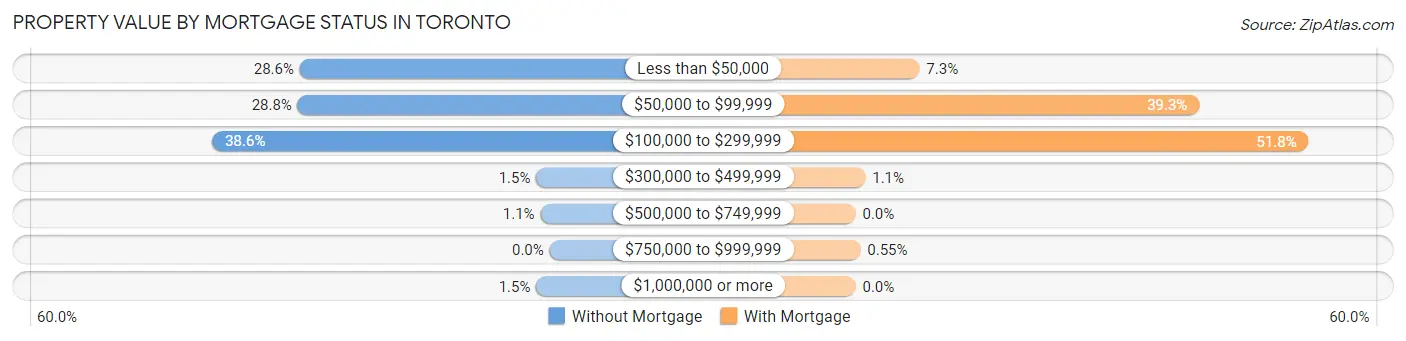
| Property Value | Without Mortgage | With Mortgage |
| Less than $50,000 | 245 (28.5%) | 66 (7.3%) |
| $50,000 to $99,999 | 247 (28.8%) | 355 (39.3%) |
| $100,000 to $299,999 | 331 (38.6%) | 468 (51.8%) |
| $300,000 to $499,999 | 13 (1.5%) | 10 (1.1%) |
| $500,000 to $749,999 | 9 (1.1%) | 0 (0.0%) |
| $750,000 to $999,999 | 0 (0.0%) | 5 (0.5%) |
| $1,000,000 or more | 13 (1.5%) | 0 (0.0%) |
| Total | 858 (100.0%) | 904 (100.0%) |
Household Income by Mortgage Status in Toronto
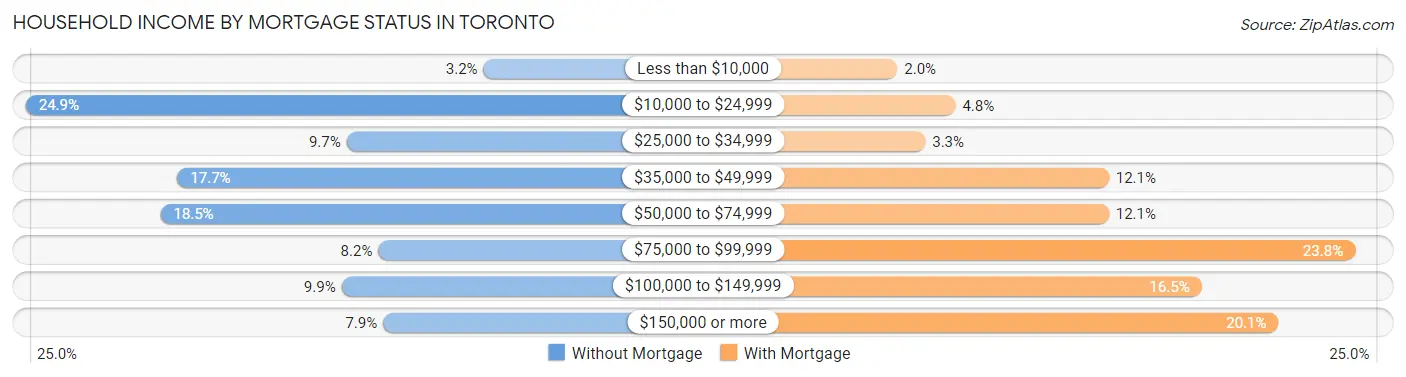
| Household Income | Without Mortgage | With Mortgage |
| Less than $10,000 | 27 (3.2%) | 18 (2.0%) |
| $10,000 to $24,999 | 214 (24.9%) | 43 (4.8%) |
| $25,000 to $34,999 | 83 (9.7%) | 30 (3.3%) |
| $35,000 to $49,999 | 152 (17.7%) | 109 (12.1%) |
| $50,000 to $74,999 | 159 (18.5%) | 109 (12.1%) |
| $75,000 to $99,999 | 70 (8.2%) | 215 (23.8%) |
| $100,000 to $149,999 | 85 (9.9%) | 149 (16.5%) |
| $150,000 or more | 68 (7.9%) | 182 (20.1%) |
| Total | 858 (100.0%) | 904 (100.0%) |
Property Value to Household Income Ratio in Toronto
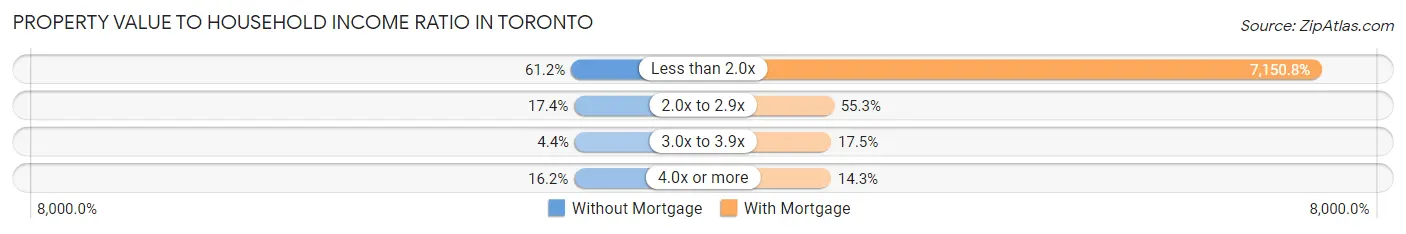
| Value-to-Income Ratio | Without Mortgage | With Mortgage |
| Less than 2.0x | 525 (61.2%) | 64,643 (7,150.8%) |
| 2.0x to 2.9x | 149 (17.4%) | 500 (55.3%) |
| 3.0x to 3.9x | 38 (4.4%) | 158 (17.5%) |
| 4.0x or more | 139 (16.2%) | 129 (14.3%) |
| Total | 858 (100.0%) | 904 (100.0%) |
Real Estate Taxes by Mortgage Status in Toronto
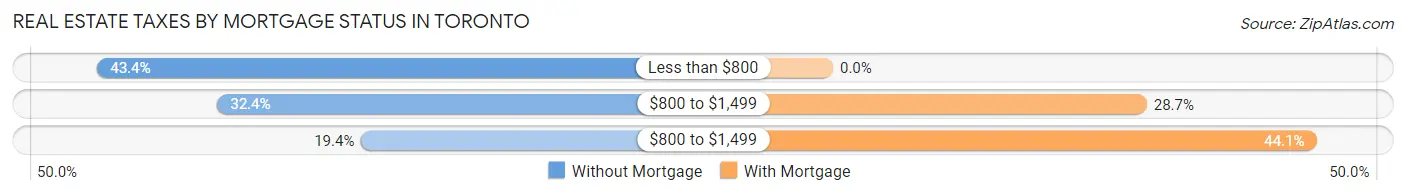
| Property Taxes | Without Mortgage | With Mortgage |
| Less than $800 | 372 (43.4%) | 0 (0.0%) |
| $800 to $1,499 | 278 (32.4%) | 259 (28.6%) |
| $800 to $1,499 | 166 (19.4%) | 399 (44.1%) |
| Total | 858 (100.0%) | 904 (100.0%) |
Health & Disability in Toronto
Health Insurance Coverage by Age in Toronto
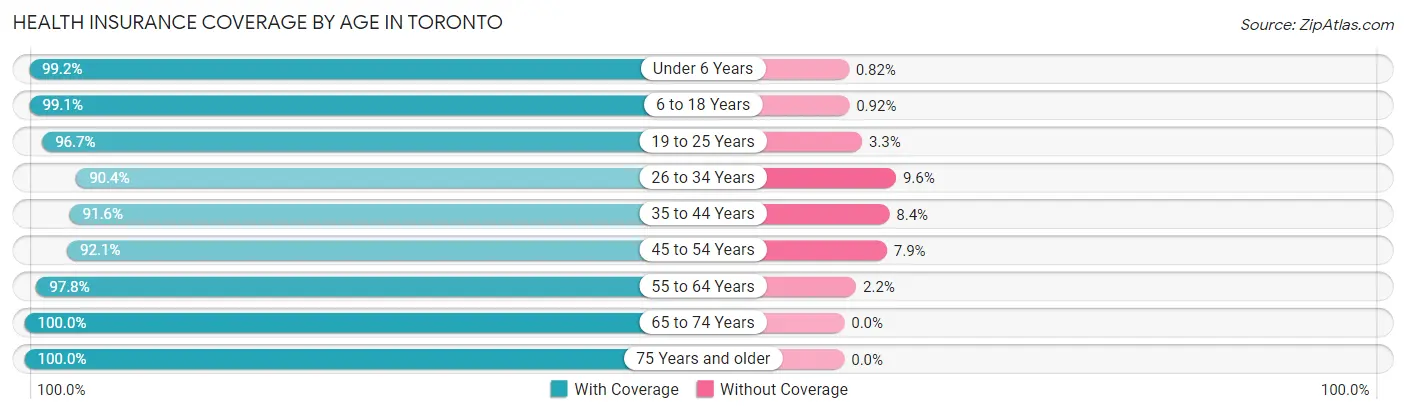
| Age Bracket | With Coverage | Without Coverage |
| Under 6 Years | 484 (99.2%) | 4 (0.8%) |
| 6 to 18 Years | 758 (99.1%) | 7 (0.9%) |
| 19 to 25 Years | 206 (96.7%) | 7 (3.3%) |
| 26 to 34 Years | 713 (90.4%) | 76 (9.6%) |
| 35 to 44 Years | 567 (91.6%) | 52 (8.4%) |
| 45 to 54 Years | 569 (92.1%) | 49 (7.9%) |
| 55 to 64 Years | 934 (97.8%) | 21 (2.2%) |
| 65 to 74 Years | 585 (100.0%) | 0 (0.0%) |
| 75 Years and older | 355 (100.0%) | 0 (0.0%) |
| Total | 5,171 (96.0%) | 216 (4.0%) |
Health Insurance Coverage by Citizenship Status in Toronto
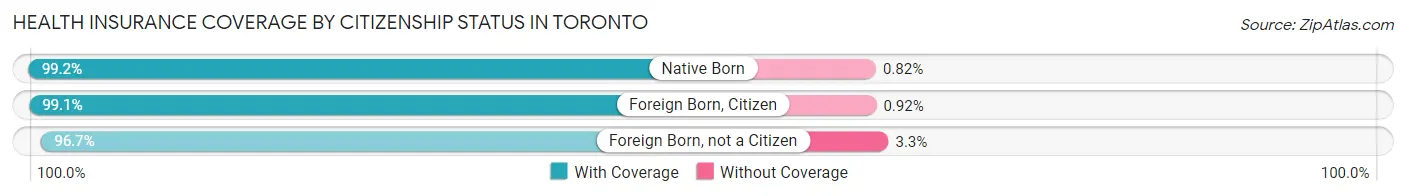
| Citizenship Status | With Coverage | Without Coverage |
| Native Born | 484 (99.2%) | 4 (0.8%) |
| Foreign Born, Citizen | 758 (99.1%) | 7 (0.9%) |
| Foreign Born, not a Citizen | 206 (96.7%) | 7 (3.3%) |
Health Insurance Coverage by Household Income in Toronto
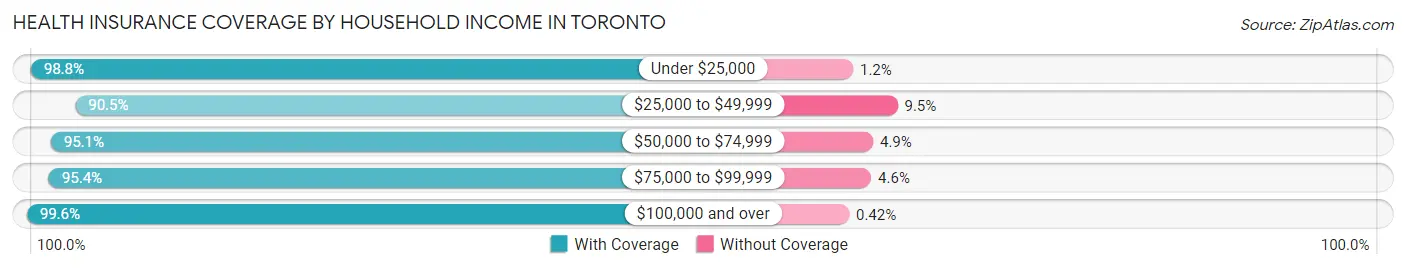
| Household Income | With Coverage | Without Coverage |
| Under $25,000 | 930 (98.8%) | 11 (1.2%) |
| $25,000 to $49,999 | 1,048 (90.5%) | 110 (9.5%) |
| $50,000 to $74,999 | 1,043 (95.1%) | 54 (4.9%) |
| $75,000 to $99,999 | 732 (95.4%) | 35 (4.6%) |
| $100,000 and over | 1,408 (99.6%) | 6 (0.4%) |
Public vs Private Health Insurance Coverage by Age in Toronto
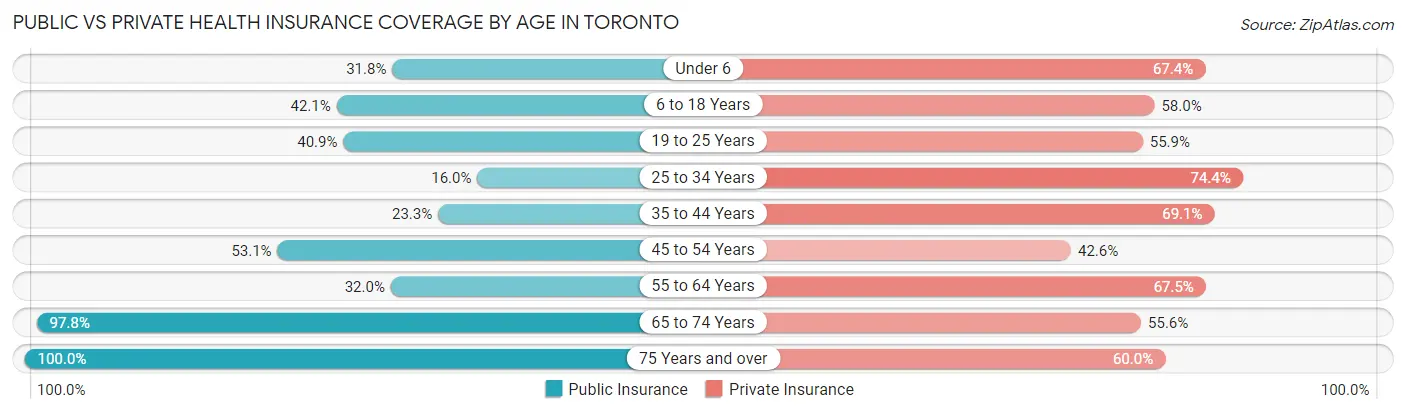
| Age Bracket | Public Insurance | Private Insurance |
| Under 6 | 155 (31.8%) | 329 (67.4%) |
| 6 to 18 Years | 322 (42.1%) | 444 (58.0%) |
| 19 to 25 Years | 87 (40.8%) | 119 (55.9%) |
| 25 to 34 Years | 126 (16.0%) | 587 (74.4%) |
| 35 to 44 Years | 144 (23.3%) | 428 (69.1%) |
| 45 to 54 Years | 328 (53.1%) | 263 (42.6%) |
| 55 to 64 Years | 306 (32.0%) | 645 (67.5%) |
| 65 to 74 Years | 572 (97.8%) | 325 (55.6%) |
| 75 Years and over | 355 (100.0%) | 213 (60.0%) |
| Total | 2,395 (44.5%) | 3,353 (62.2%) |
Disability Status by Sex by Age in Toronto
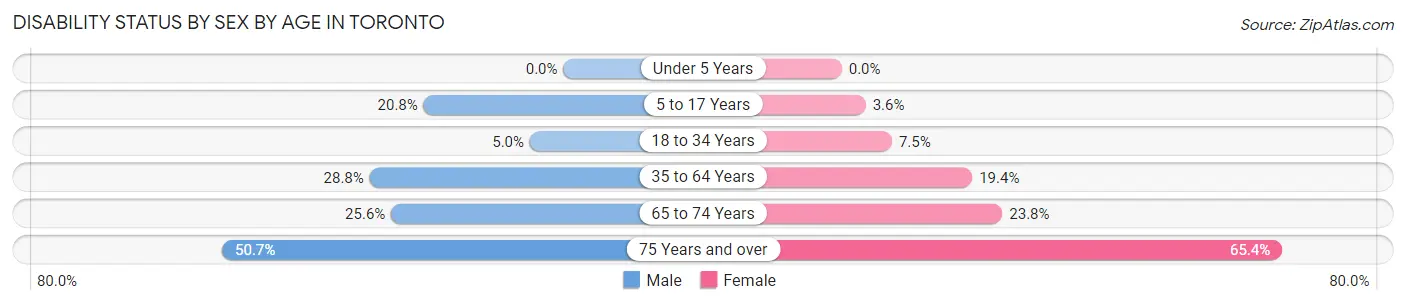
| Age Bracket | Male | Female |
| Under 5 Years | 0 (0.0%) | 0 (0.0%) |
| 5 to 17 Years | 105 (20.7%) | 14 (3.5%) |
| 18 to 34 Years | 23 (5.0%) | 42 (7.4%) |
| 35 to 64 Years | 286 (28.8%) | 232 (19.4%) |
| 65 to 74 Years | 67 (25.6%) | 77 (23.8%) |
| 75 Years and over | 76 (50.7%) | 134 (65.4%) |
Disability Class by Sex by Age in Toronto
Disability Class: Hearing Difficulty
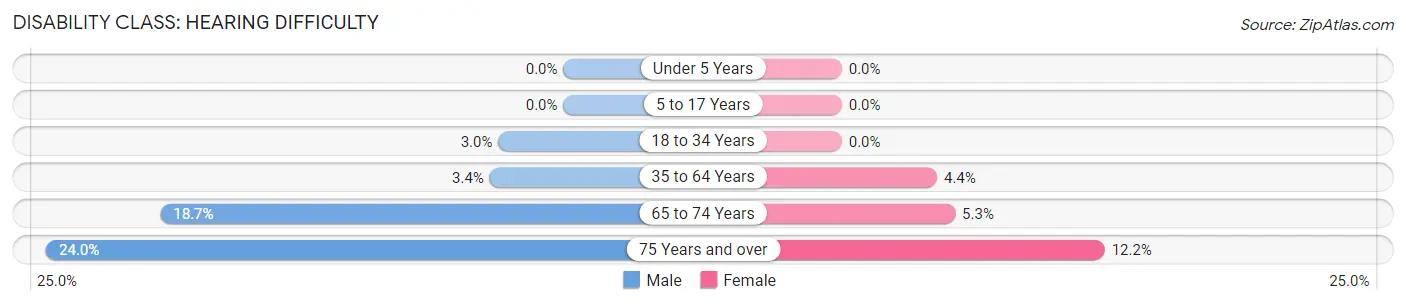
| Age Bracket | Male | Female |
| Under 5 Years | 0 (0.0%) | 0 (0.0%) |
| 5 to 17 Years | 0 (0.0%) | 0 (0.0%) |
| 18 to 34 Years | 14 (3.0%) | 0 (0.0%) |
| 35 to 64 Years | 34 (3.4%) | 53 (4.4%) |
| 65 to 74 Years | 49 (18.7%) | 17 (5.3%) |
| 75 Years and over | 36 (24.0%) | 25 (12.2%) |
Disability Class: Vision Difficulty
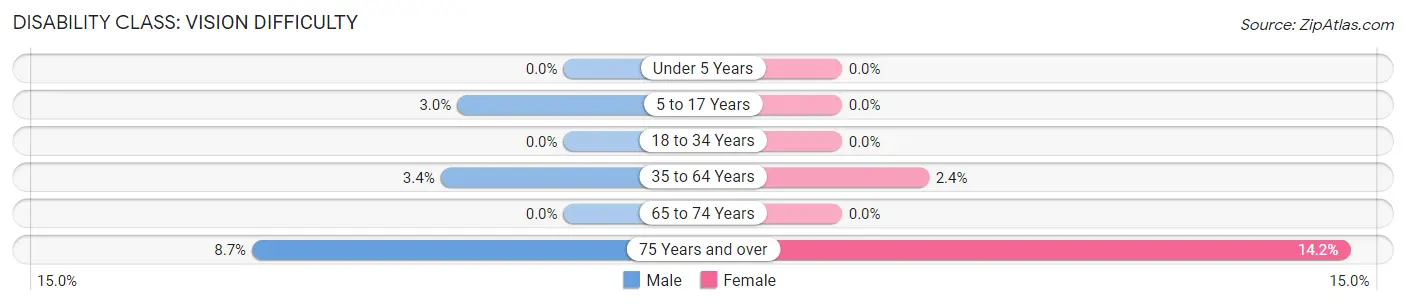
| Age Bracket | Male | Female |
| Under 5 Years | 0 (0.0%) | 0 (0.0%) |
| 5 to 17 Years | 15 (3.0%) | 0 (0.0%) |
| 18 to 34 Years | 0 (0.0%) | 0 (0.0%) |
| 35 to 64 Years | 34 (3.4%) | 29 (2.4%) |
| 65 to 74 Years | 0 (0.0%) | 0 (0.0%) |
| 75 Years and over | 13 (8.7%) | 29 (14.1%) |
Disability Class: Cognitive Difficulty
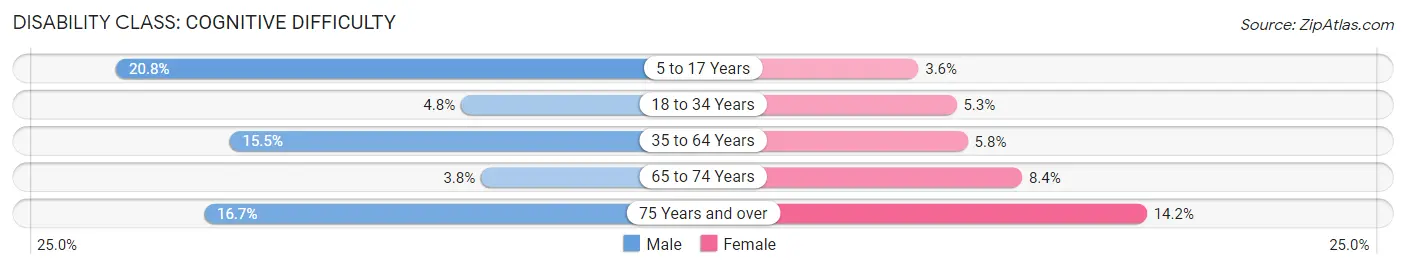
| Age Bracket | Male | Female |
| 5 to 17 Years | 105 (20.7%) | 14 (3.5%) |
| 18 to 34 Years | 22 (4.8%) | 30 (5.3%) |
| 35 to 64 Years | 154 (15.5%) | 70 (5.8%) |
| 65 to 74 Years | 10 (3.8%) | 27 (8.4%) |
| 75 Years and over | 25 (16.7%) | 29 (14.1%) |
Disability Class: Ambulatory Difficulty
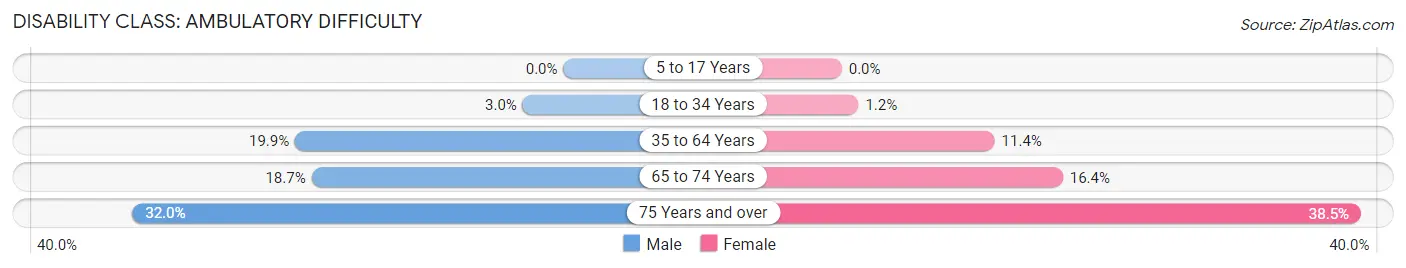
| Age Bracket | Male | Female |
| 5 to 17 Years | 0 (0.0%) | 0 (0.0%) |
| 18 to 34 Years | 14 (3.0%) | 7 (1.2%) |
| 35 to 64 Years | 198 (19.9%) | 136 (11.4%) |
| 65 to 74 Years | 49 (18.7%) | 53 (16.4%) |
| 75 Years and over | 48 (32.0%) | 79 (38.5%) |
Disability Class: Self-Care Difficulty
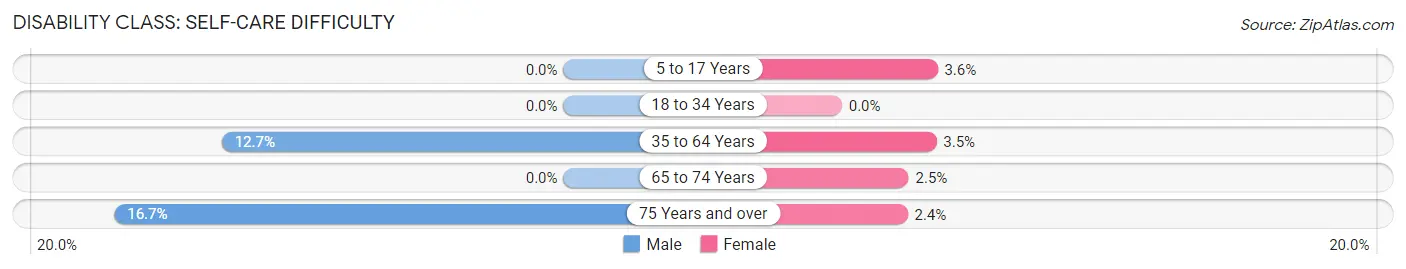
| Age Bracket | Male | Female |
| 5 to 17 Years | 0 (0.0%) | 14 (3.5%) |
| 18 to 34 Years | 0 (0.0%) | 0 (0.0%) |
| 35 to 64 Years | 126 (12.7%) | 42 (3.5%) |
| 65 to 74 Years | 0 (0.0%) | 8 (2.5%) |
| 75 Years and over | 25 (16.7%) | 5 (2.4%) |
Technology Access in Toronto
Computing Device Access in Toronto
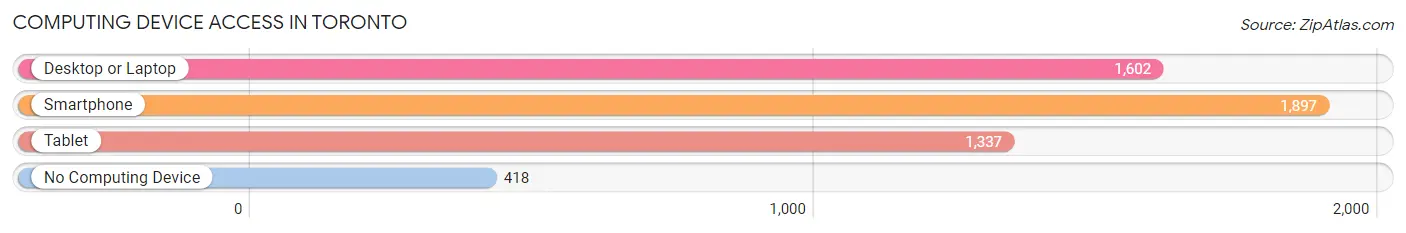
| Device Type | # Households | % Households |
| Desktop or Laptop | 1,602 | 66.3% |
| Smartphone | 1,897 | 78.5% |
| Tablet | 1,337 | 55.3% |
| No Computing Device | 418 | 17.3% |
| Total | 2,417 | 100.0% |
Internet Access in Toronto
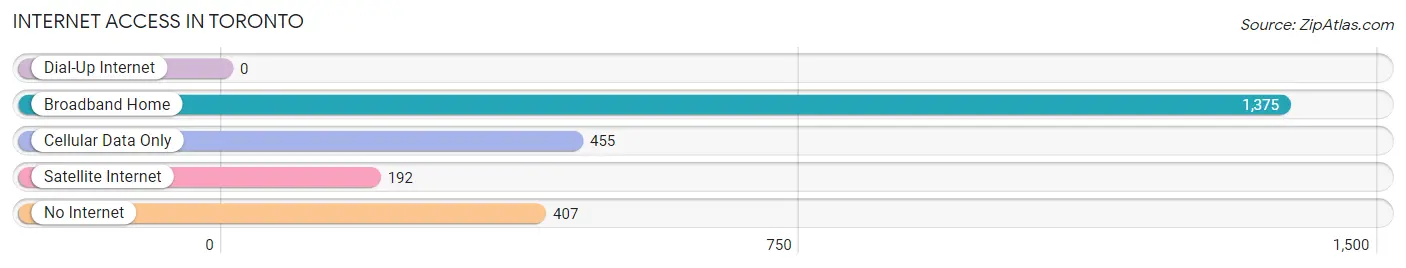
| Internet Type | # Households | % Households |
| Dial-Up Internet | 0 | 0.0% |
| Broadband Home | 1,375 | 56.9% |
| Cellular Data Only | 455 | 18.8% |
| Satellite Internet | 192 | 7.9% |
| No Internet | 407 | 16.8% |
| Total | 2,417 | 100.0% |
Toronto Summary
Toronto, Ohio is a small city located in Jefferson County, Ohio. It is situated on the banks of the Ohio River, approximately 30 miles west of Steubenville. The city has a population of approximately 2,000 people and is part of the Weirton-Steubenville Metropolitan Statistical Area.
History
The area that is now Toronto was first settled in 1797 by a group of settlers from Pennsylvania. The settlement was originally known as “The Forks” due to its location at the confluence of the Ohio and Beaver Rivers. In 1802, the settlement was renamed “Toronto” after the city of Toronto, Canada.
The city was officially incorporated in 1832 and quickly became a center of commerce and industry. The city was home to several factories, including a glassworks, a pottery, and a foundry. The city also had a thriving riverboat trade, with goods being shipped up and down the Ohio River.
In the late 19th century, the city experienced a period of growth and prosperity. The city was home to several banks, a newspaper, and a variety of stores and businesses. The city also had a thriving cultural scene, with several theaters, opera houses, and other entertainment venues.
Geography
Toronto is located in the eastern part of Jefferson County, Ohio. The city is situated on the banks of the Ohio River, approximately 30 miles west of Steubenville. The city is surrounded by rolling hills and farmland. The city is also located near several state parks, including the Jefferson Lake State Park and the Tappan Lake State Park.
Economy
The economy of Toronto is largely based on manufacturing and services. The city is home to several factories, including a glassworks, a pottery, and a foundry. The city also has a thriving riverboat trade, with goods being shipped up and down the Ohio River.
The city is also home to several banks, a newspaper, and a variety of stores and businesses. The city also has a thriving cultural scene, with several theaters, opera houses, and other entertainment venues.
Demographics
As of the 2010 census, the population of Toronto was 2,000 people. The racial makeup of the city was 97.5% White, 0.5% African American, 0.2% Native American, 0.2% Asian, 0.2% from other races, and 1.4% from two or more races. Hispanic or Latino of any race were 0.7% of the population.
The median income for a household in the city was $31,250, and the median income for a family was $37,500. The per capita income for the city was $17,857. About 11.2% of families and 13.2% of the population were below the poverty line, including 17.2% of those under age 18 and 8.3% of those age 65 or over.
Common Questions
What is Per Capita Income in Toronto?
Per Capita income in Toronto is $30,742.
What is the Median Family Income in Toronto?
Median Family Income in Toronto is $66,833.
What is the Median Household income in Toronto?
Median Household Income in Toronto is $48,287.
What is Income or Wage Gap in Toronto?
Income or Wage Gap in Toronto is 46.3%.
Women in Toronto earn 53.7 cents for every dollar earned by a man.
What is Inequality or Gini Index in Toronto?
Inequality or Gini Index in Toronto is 0.47.
What is the Total Population of Toronto?
Total Population of Toronto is 5,387.
What is the Total Male Population of Toronto?
Total Male Population of Toronto is 2,550.
What is the Total Female Population of Toronto?
Total Female Population of Toronto is 2,837.
What is the Ratio of Males per 100 Females in Toronto?
There are 89.88 Males per 100 Females in Toronto.
What is the Ratio of Females per 100 Males in Toronto?
There are 111.25 Females per 100 Males in Toronto.
What is the Median Population Age in Toronto?
Median Population Age in Toronto is 43.2 Years.
What is the Average Family Size in Toronto
Average Family Size in Toronto is 3.0 People.
What is the Average Household Size in Toronto
Average Household Size in Toronto is 2.2 People.
How Large is the Labor Force in Toronto?
There are 2,465 People in the Labor Forcein in Toronto.
What is the Percentage of People in the Labor Force in Toronto?
57.8% of People are in the Labor Force in Toronto.
What is the Unemployment Rate in Toronto?
Unemployment Rate in Toronto is 4.3%.