Tiro, OH Map & Demographics
Tiro Map
Tiro Overview
$21,360
PER CAPITA INCOME
$58,859
AVG FAMILY INCOME
$57,772
AVG HOUSEHOLD INCOME
10.3%
WAGE / INCOME GAP [ % ]
89.7¢/ $1
WAGE / INCOME GAP [ $ ]
0.28
INEQUALITY / GINI INDEX
242
TOTAL POPULATION
119
MALE POPULATION
123
FEMALE POPULATION
96.75
MALES / 100 FEMALES
103.36
FEMALES / 100 MALES
40.3
MEDIAN AGE
2.9
AVG FAMILY SIZE
2.5
AVG HOUSEHOLD SIZE
126
LABOR FORCE [ PEOPLE ]
67.4%
PERCENT IN LABOR FORCE
5.6%
UNEMPLOYMENT RATE
Tiro Zip Codes
Income in Tiro
Income Overview in Tiro
Per Capita Income in Tiro is $21,360, while median incomes of families and households are $58,859 and $57,772 respectively.
| Characteristic | Number | Measure |
| Per Capita Income | 242 | $21,360 |
| Median Family Income | 71 | $58,859 |
| Mean Family Income | 71 | $61,318 |
| Median Household Income | 95 | $57,772 |
| Mean Household Income | 95 | $55,834 |
| Income Deficit | 71 | $0 |
| Wage / Income Gap (%) | 242 | 10.34% |
| Wage / Income Gap ($) | 242 | 89.66¢ per $1 |
| Gini / Inequality Index | 242 | 0.28 |
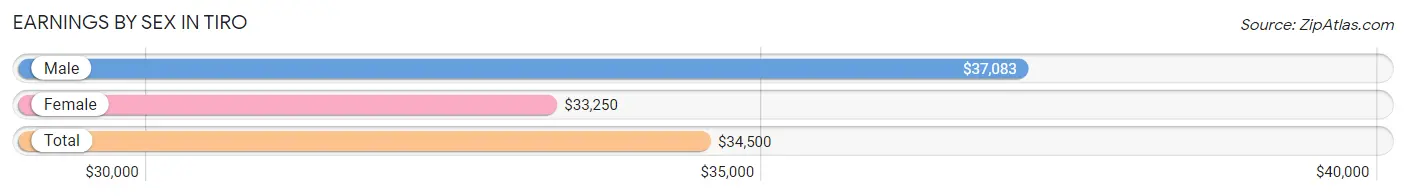
Earnings by Sex in Tiro
Average Earnings in Tiro are $34,500, $37,083 for men and $33,250 for women, a difference of 10.3%.
| Sex | Number | Average Earnings |
| Male | 83 (65.9%) | $37,083 |
| Female | 43 (34.1%) | $33,250 |
| Total | 126 (100.0%) | $34,500 |
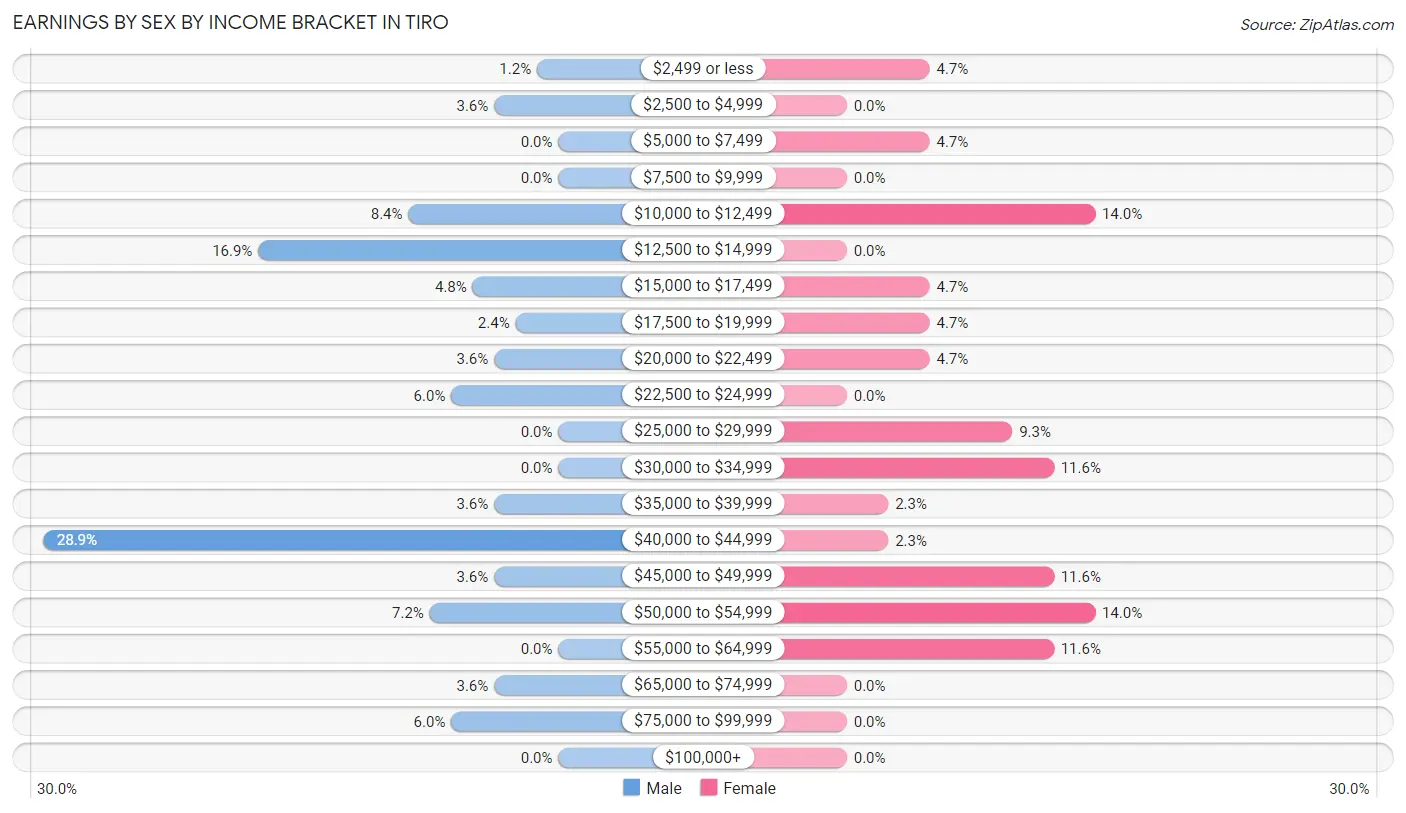
Earnings by Sex by Income Bracket in Tiro
The most common earnings brackets in Tiro are $40,000 to $44,999 for men (24 | 28.9%) and $10,000 to $12,499 for women (6 | 14.0%).
| Income | Male | Female |
| $2,499 or less | 1 (1.2%) | 2 (4.6%) |
| $2,500 to $4,999 | 3 (3.6%) | 0 (0.0%) |
| $5,000 to $7,499 | 0 (0.0%) | 2 (4.6%) |
| $7,500 to $9,999 | 0 (0.0%) | 0 (0.0%) |
| $10,000 to $12,499 | 7 (8.4%) | 6 (14.0%) |
| $12,500 to $14,999 | 14 (16.9%) | 0 (0.0%) |
| $15,000 to $17,499 | 4 (4.8%) | 2 (4.6%) |
| $17,500 to $19,999 | 2 (2.4%) | 2 (4.6%) |
| $20,000 to $22,499 | 3 (3.6%) | 2 (4.6%) |
| $22,500 to $24,999 | 5 (6.0%) | 0 (0.0%) |
| $25,000 to $29,999 | 0 (0.0%) | 4 (9.3%) |
| $30,000 to $34,999 | 0 (0.0%) | 5 (11.6%) |
| $35,000 to $39,999 | 3 (3.6%) | 1 (2.3%) |
| $40,000 to $44,999 | 24 (28.9%) | 1 (2.3%) |
| $45,000 to $49,999 | 3 (3.6%) | 5 (11.6%) |
| $50,000 to $54,999 | 6 (7.2%) | 6 (14.0%) |
| $55,000 to $64,999 | 0 (0.0%) | 5 (11.6%) |
| $65,000 to $74,999 | 3 (3.6%) | 0 (0.0%) |
| $75,000 to $99,999 | 5 (6.0%) | 0 (0.0%) |
| $100,000+ | 0 (0.0%) | 0 (0.0%) |
| Total | 83 (100.0%) | 43 (100.0%) |
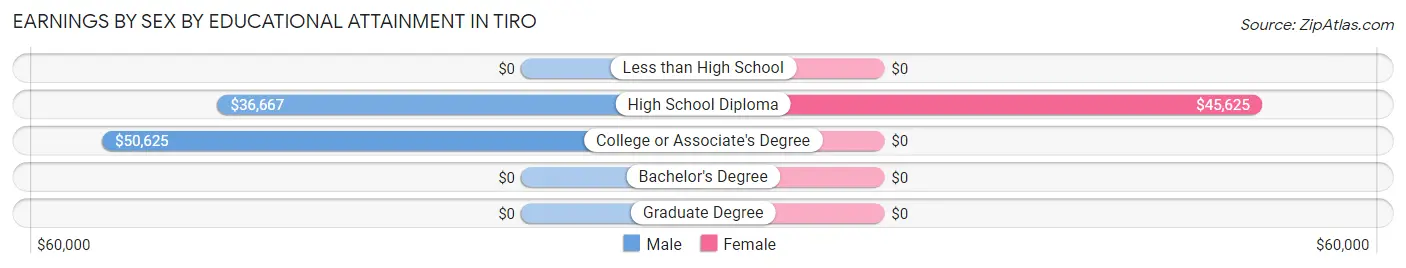
Earnings by Sex by Educational Attainment in Tiro
Average earnings in Tiro are $42,935 for men and $34,250 for women, a difference of 20.2%. Men with an educational attainment of college or associate's degree enjoy the highest average annual earnings of $50,625, while those with high school diploma education earn the least with $36,667. Women with an educational attainment of high school diploma earn the most with the average annual earnings of $45,625, while those with high school diploma education have the smallest earnings of $45,625.
| Educational Attainment | Male Income | Female Income |
| Less than High School | - | - |
| High School Diploma | $36,667 | $45,625 |
| College or Associate's Degree | $50,625 | $0 |
| Bachelor's Degree | - | - |
| Graduate Degree | - | - |
| Total | $42,935 | $34,250 |
Family Income in Tiro
Family Income Brackets in Tiro
According to the Tiro family income data, there are 41 families falling into the $50,000 to $74,999 income range, which is the most common income bracket and makes up 57.8% of all families.
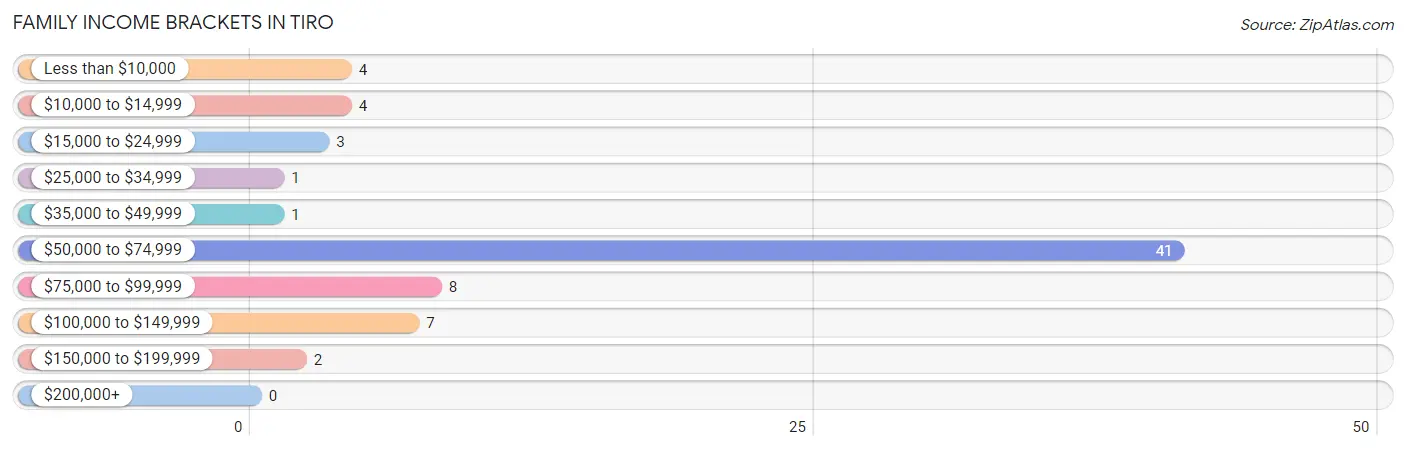
| Income Bracket | # Families | % Families |
| Less than $10,000 | 4 | 5.6% |
| $10,000 to $14,999 | 4 | 5.6% |
| $15,000 to $24,999 | 3 | 4.2% |
| $25,000 to $34,999 | 1 | 1.4% |
| $35,000 to $49,999 | 1 | 1.4% |
| $50,000 to $74,999 | 41 | 57.7% |
| $75,000 to $99,999 | 8 | 11.3% |
| $100,000 to $149,999 | 7 | 9.9% |
| $150,000 to $199,999 | 2 | 2.8% |
| $200,000+ | 0 | 0.0% |
Family Income by Famaliy Size in Tiro
3-person families (19 | 26.8%) account for the highest median family income in Tiro with $89,063 per family, while 3-person families (19 | 26.8%) have the highest median income of $29,688 per family member.
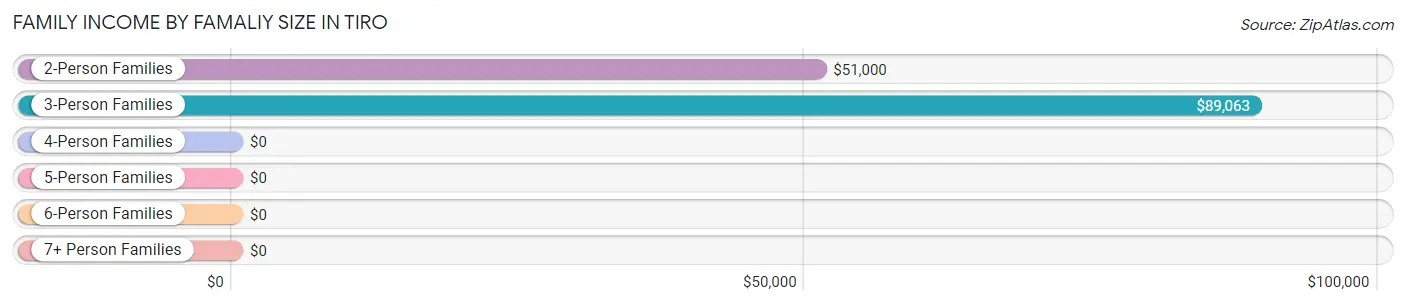
| Income Bracket | # Families | Median Income |
| 2-Person Families | 26 (36.6%) | $51,000 |
| 3-Person Families | 19 (26.8%) | $89,063 |
| 4-Person Families | 0 (0.0%) | $0 |
| 5-Person Families | 23 (32.4%) | $0 |
| 6-Person Families | 1 (1.4%) | $0 |
| 7+ Person Families | 2 (2.8%) | $0 |
| Total | 71 (100.0%) | $58,859 |
Family Income by Number of Earners in Tiro
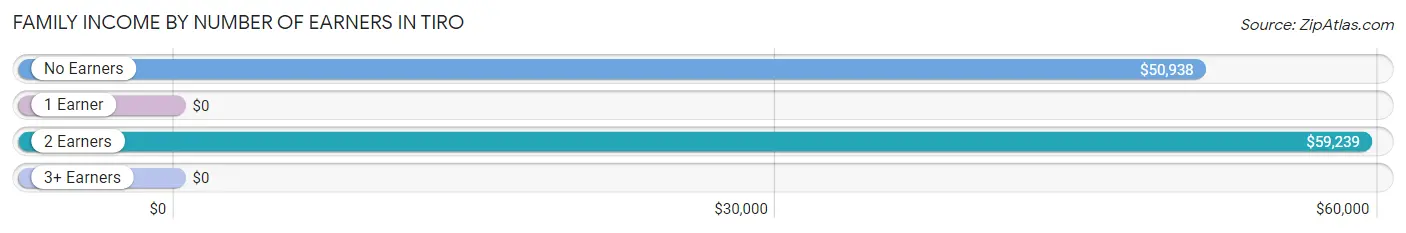
| Number of Earners | # Families | Median Income |
| No Earners | 9 (12.7%) | $50,938 |
| 1 Earner | 19 (26.8%) | $0 |
| 2 Earners | 36 (50.7%) | $59,239 |
| 3+ Earners | 7 (9.9%) | $0 |
| Total | 71 (100.0%) | $58,859 |
Household Income in Tiro
Household Income Brackets in Tiro
With 46 households falling in the category, the $50,000 to $74,999 income range is the most frequent in Tiro, accounting for 48.4% of all households.
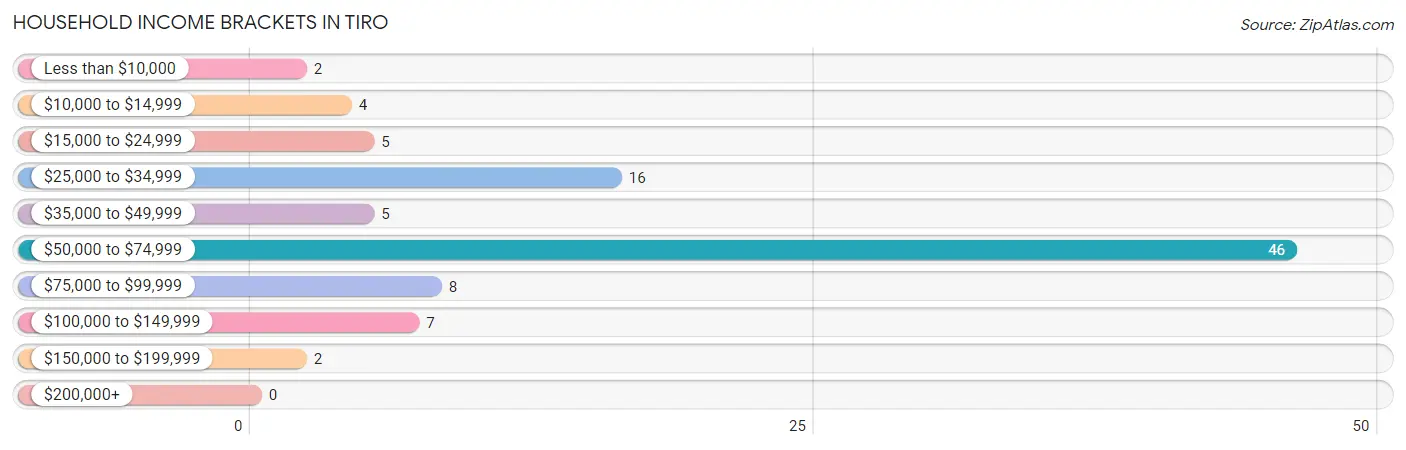
| Income Bracket | # Households | % Households |
| Less than $10,000 | 2 | 2.1% |
| $10,000 to $14,999 | 4 | 4.2% |
| $15,000 to $24,999 | 5 | 5.3% |
| $25,000 to $34,999 | 16 | 16.8% |
| $35,000 to $49,999 | 5 | 5.3% |
| $50,000 to $74,999 | 46 | 48.4% |
| $75,000 to $99,999 | 8 | 8.4% |
| $100,000 to $149,999 | 7 | 7.4% |
| $150,000 to $199,999 | 2 | 2.1% |
| $200,000+ | 0 | 0.0% |
Household Income by Householder Age in Tiro
The median household income in Tiro is $57,772, with the highest median household income of $58,804 found in the 45 to 64 years age bracket for the primary householder. A total of 44 households (46.3%) fall into this category.
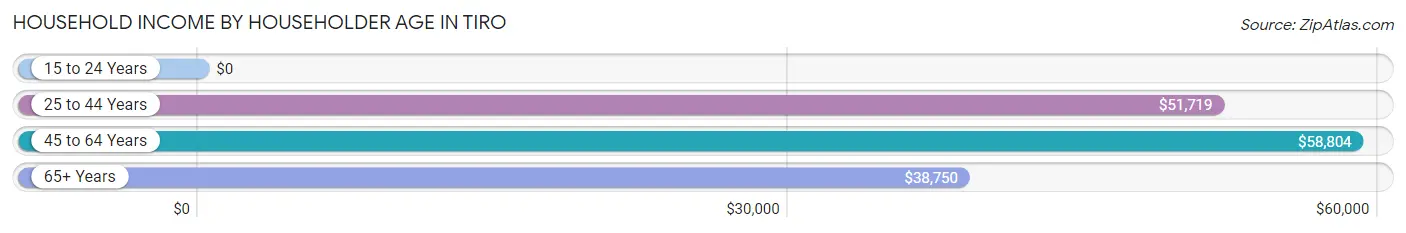
| Income Bracket | # Households | Median Income |
| 15 to 24 Years | 0 (0.0%) | $0 |
| 25 to 44 Years | 29 (30.5%) | $51,719 |
| 45 to 64 Years | 44 (46.3%) | $58,804 |
| 65+ Years | 22 (23.2%) | $38,750 |
| Total | 95 (100.0%) | $57,772 |
Poverty in Tiro
Income Below Poverty by Sex and Age in Tiro
With 10.3% poverty level for males and 15.4% for females among the residents of Tiro, 35 to 44 year old males and 16 and 17 year old females are the most vulnerable to poverty, with 3 males (100.0%) and 2 females (100.0%) in their respective age groups living below the poverty level.
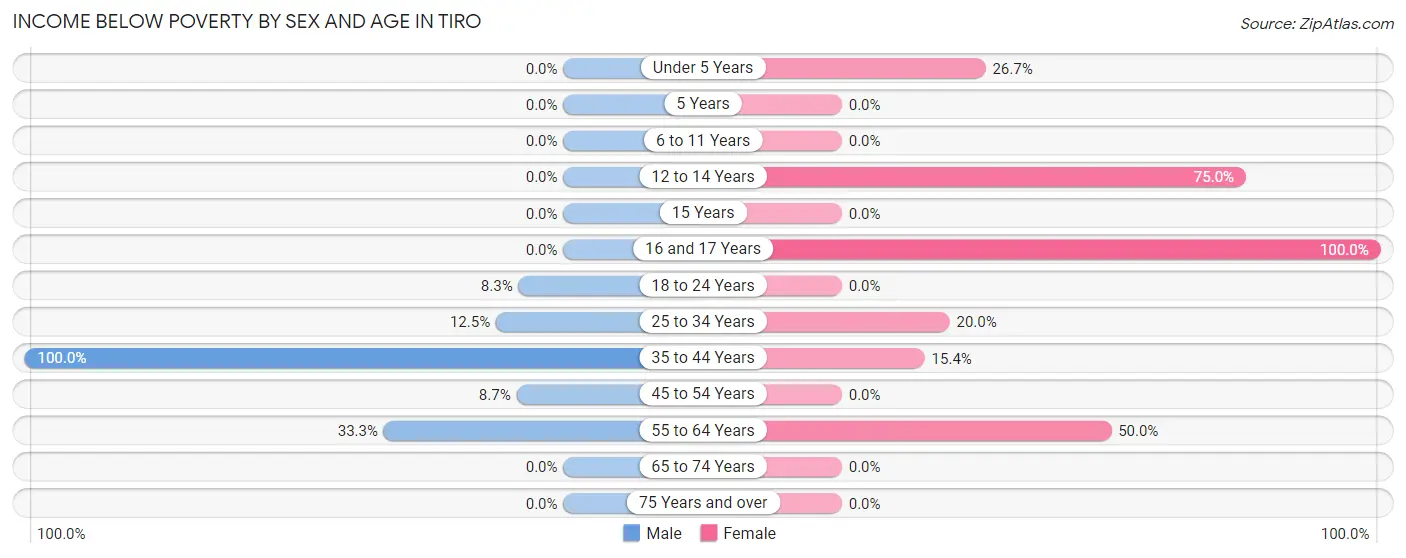
| Age Bracket | Male | Female |
| Under 5 Years | 0 (0.0%) | 4 (26.7%) |
| 5 Years | 0 (0.0%) | 0 (0.0%) |
| 6 to 11 Years | 0 (0.0%) | 0 (0.0%) |
| 12 to 14 Years | 0 (0.0%) | 6 (75.0%) |
| 15 Years | 0 (0.0%) | 0 (0.0%) |
| 16 and 17 Years | 0 (0.0%) | 2 (100.0%) |
| 18 to 24 Years | 1 (8.3%) | 0 (0.0%) |
| 25 to 34 Years | 3 (12.5%) | 2 (20.0%) |
| 35 to 44 Years | 3 (100.0%) | 2 (15.4%) |
| 45 to 54 Years | 4 (8.7%) | 0 (0.0%) |
| 55 to 64 Years | 1 (33.3%) | 3 (50.0%) |
| 65 to 74 Years | 0 (0.0%) | 0 (0.0%) |
| 75 Years and over | 0 (0.0%) | 0 (0.0%) |
| Total | 12 (10.3%) | 19 (15.4%) |
Income Above Poverty by Sex and Age in Tiro
According to the poverty statistics in Tiro, males aged under 5 years and females aged 6 to 11 years are the age groups that are most secure financially, with 100.0% of males and 100.0% of females in these age groups living above the poverty line.
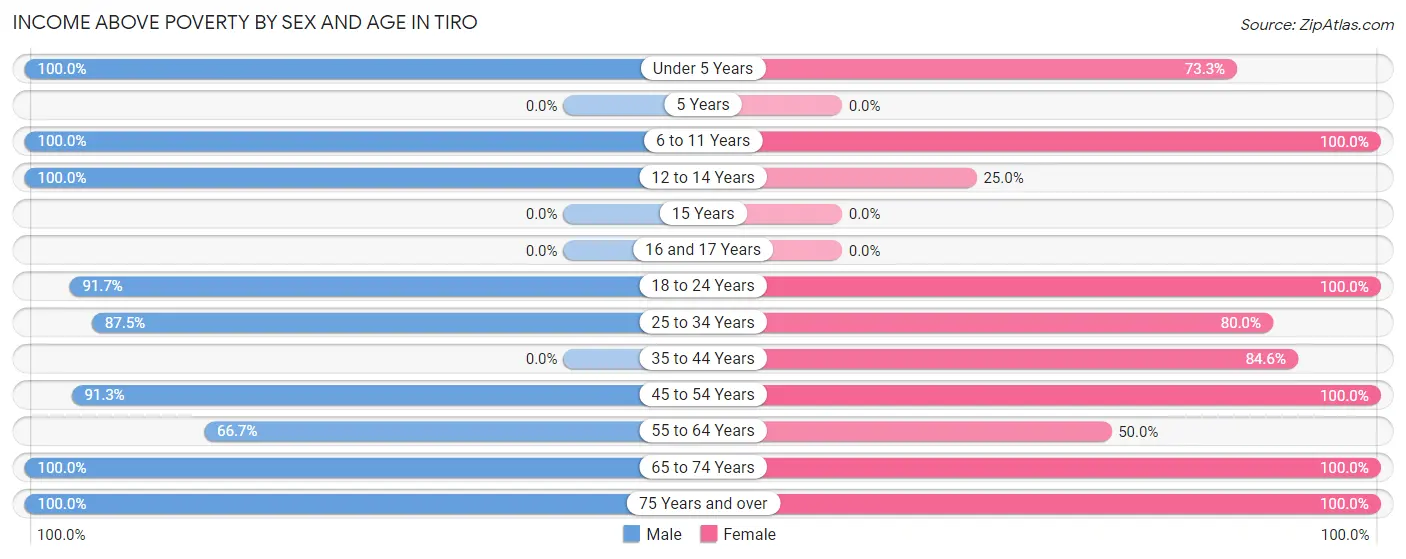
| Age Bracket | Male | Female |
| Under 5 Years | 8 (100.0%) | 11 (73.3%) |
| 5 Years | 0 (0.0%) | 0 (0.0%) |
| 6 to 11 Years | 5 (100.0%) | 15 (100.0%) |
| 12 to 14 Years | 2 (100.0%) | 2 (25.0%) |
| 15 Years | 0 (0.0%) | 0 (0.0%) |
| 16 and 17 Years | 0 (0.0%) | 0 (0.0%) |
| 18 to 24 Years | 11 (91.7%) | 11 (100.0%) |
| 25 to 34 Years | 21 (87.5%) | 8 (80.0%) |
| 35 to 44 Years | 0 (0.0%) | 11 (84.6%) |
| 45 to 54 Years | 42 (91.3%) | 27 (100.0%) |
| 55 to 64 Years | 2 (66.7%) | 3 (50.0%) |
| 65 to 74 Years | 7 (100.0%) | 8 (100.0%) |
| 75 Years and over | 7 (100.0%) | 8 (100.0%) |
| Total | 105 (89.7%) | 104 (84.6%) |
Income Below Poverty Among Married-Couple Families in Tiro
The poverty statistics for married-couple families in Tiro show that 7.8% or 4 of the total 51 families live below the poverty line. Families with 1 or 2 children have the highest poverty rate of 11.1%, comprising of 4 families. On the other hand, families with no children have the lowest poverty rate of 0.0%, which includes 0 families.
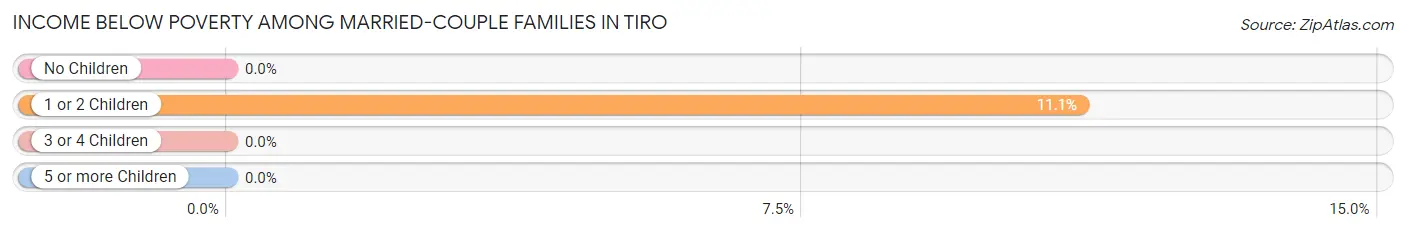
| Children | Above Poverty | Below Poverty |
| No Children | 12 (100.0%) | 0 (0.0%) |
| 1 or 2 Children | 32 (88.9%) | 4 (11.1%) |
| 3 or 4 Children | 3 (100.0%) | 0 (0.0%) |
| 5 or more Children | 0 (0.0%) | 0 (0.0%) |
| Total | 47 (92.2%) | 4 (7.8%) |
Income Below Poverty Among Single-Parent Households in Tiro
According to the poverty data in Tiro, 50.0% or 1 single-father households and 22.2% or 4 single-mother households are living below the poverty line. Among single-father households, those with 1 or 2 children have the highest poverty rate, with 1 households (100.0%) experiencing poverty. Likewise, among single-mother households, those with 1 or 2 children have the highest poverty rate, with 4 households (23.5%) falling below the poverty line.
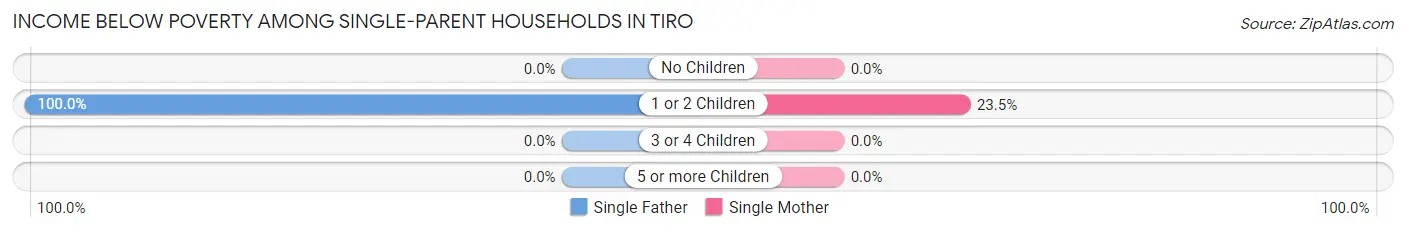
| Children | Single Father | Single Mother |
| No Children | 0 (0.0%) | 0 (0.0%) |
| 1 or 2 Children | 1 (100.0%) | 4 (23.5%) |
| 3 or 4 Children | 0 (0.0%) | 0 (0.0%) |
| 5 or more Children | 0 (0.0%) | 0 (0.0%) |
| Total | 1 (50.0%) | 4 (22.2%) |
Income Below Poverty Among Married-Couple vs Single-Parent Households in Tiro
The poverty data for Tiro shows that 4 of the married-couple family households (7.8%) and 5 of the single-parent households (25.0%) are living below the poverty level. Within the married-couple family households, those with 1 or 2 children have the highest poverty rate, with 4 households (11.1%) falling below the poverty line. Among the single-parent households, those with 1 or 2 children have the highest poverty rate, with 5 household (27.8%) living below poverty.
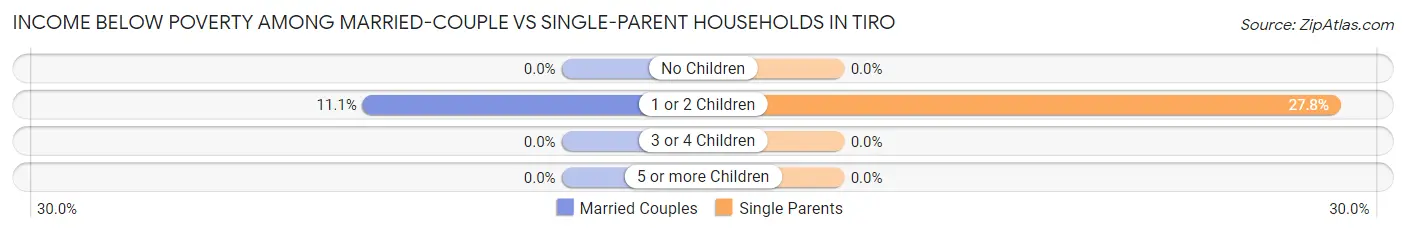
| Children | Married-Couple Families | Single-Parent Households |
| No Children | 0 (0.0%) | 0 (0.0%) |
| 1 or 2 Children | 4 (11.1%) | 5 (27.8%) |
| 3 or 4 Children | 0 (0.0%) | 0 (0.0%) |
| 5 or more Children | 0 (0.0%) | 0 (0.0%) |
| Total | 4 (7.8%) | 5 (25.0%) |
Race in Tiro
The most populous races in Tiro are White / Caucasian (158 | 65.3%), Hispanic or Latino (66 | 27.3%), and Some other Race (66 | 27.3%).
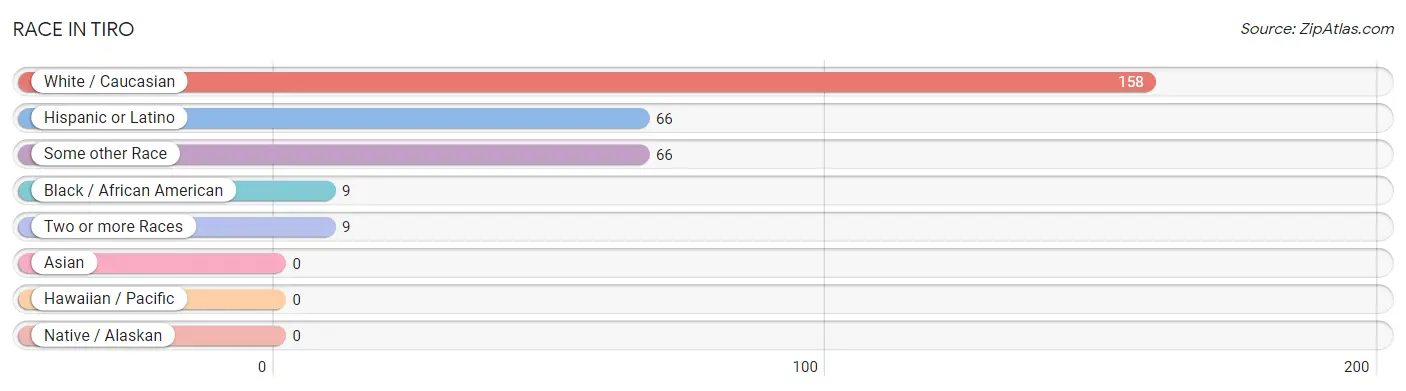
| Race | # Population | % Population |
| Asian | 0 | 0.0% |
| Black / African American | 9 | 3.7% |
| Hawaiian / Pacific | 0 | 0.0% |
| Hispanic or Latino | 66 | 27.3% |
| Native / Alaskan | 0 | 0.0% |
| White / Caucasian | 158 | 65.3% |
| Two or more Races | 9 | 3.7% |
| Some other Race | 66 | 27.3% |
| Total | 242 | 100.0% |
Ancestry in Tiro
The most populous ancestries reported in Tiro are Mexican (66 | 27.3%), German (49 | 20.3%), Irish (37 | 15.3%), American (13 | 5.4%), and Italian (11 | 4.5%), together accounting for 72.7% of all Tiro residents.
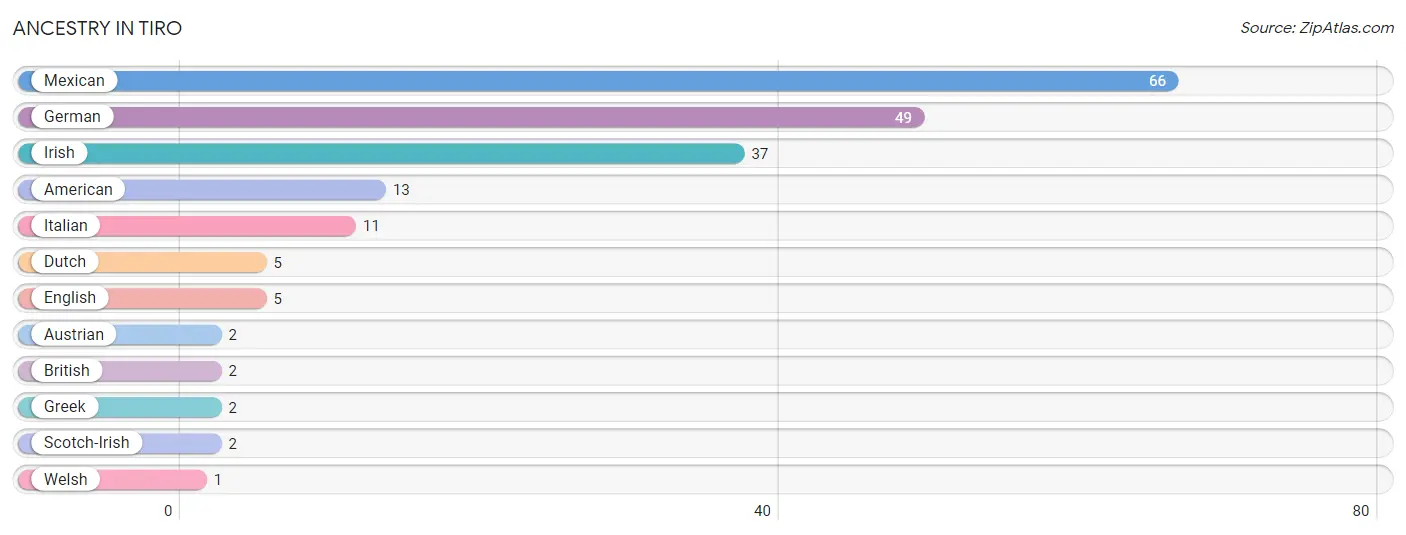
| Ancestry | # Population | % Population |
| American | 13 | 5.4% |
| Austrian | 2 | 0.8% |
| British | 2 | 0.8% |
| Dutch | 5 | 2.1% |
| English | 5 | 2.1% |
| German | 49 | 20.3% |
| Greek | 2 | 0.8% |
| Irish | 37 | 15.3% |
| Italian | 11 | 4.5% |
| Mexican | 66 | 27.3% |
| Scotch-Irish | 2 | 0.8% |
| Welsh | 1 | 0.4% | View All 12 Rows |
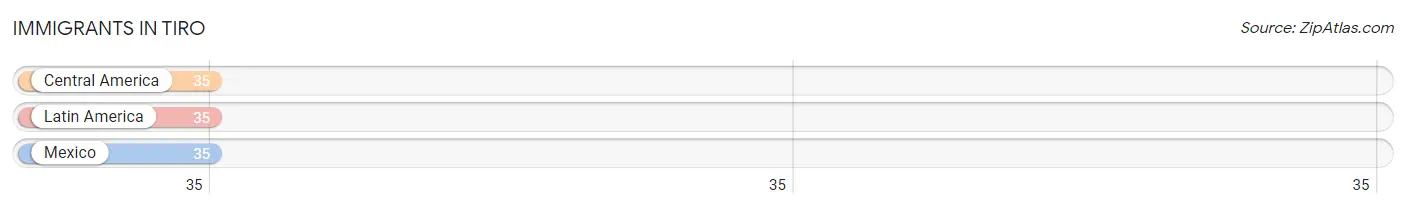
Immigrants in Tiro
The most numerous immigrant groups reported in Tiro came from Central America (35 | 14.5%), Latin America (35 | 14.5%), and Mexico (35 | 14.5%), together accounting for 43.4% of all Tiro residents.
| Immigration Origin | # Population | % Population |
| Central America | 35 | 14.5% |
| Latin America | 35 | 14.5% |
| Mexico | 35 | 14.5% | View All 3 Rows |
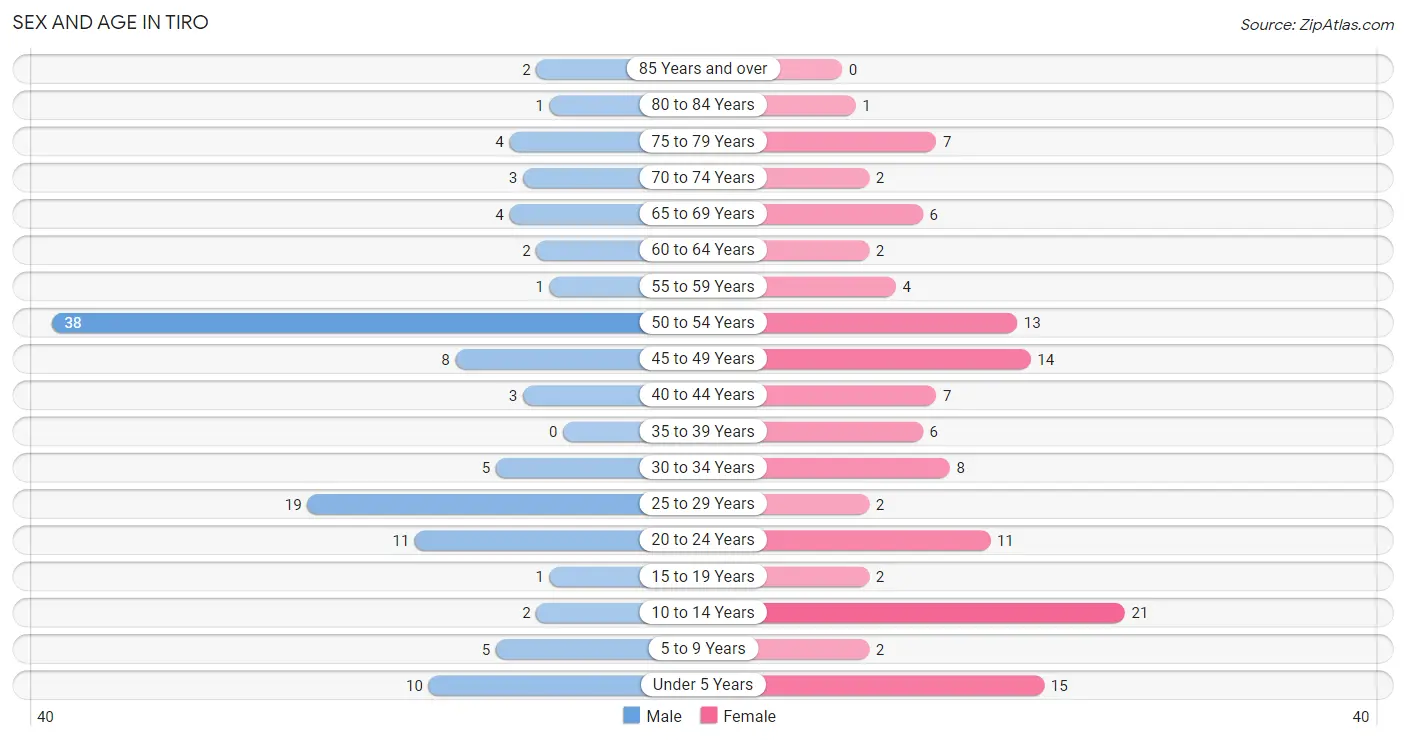
Sex and Age in Tiro
Sex and Age in Tiro
The most populous age groups in Tiro are 50 to 54 Years (38 | 31.9%) for men and 10 to 14 Years (21 | 17.1%) for women.
| Age Bracket | Male | Female |
| Under 5 Years | 10 (8.4%) | 15 (12.2%) |
| 5 to 9 Years | 5 (4.2%) | 2 (1.6%) |
| 10 to 14 Years | 2 (1.7%) | 21 (17.1%) |
| 15 to 19 Years | 1 (0.8%) | 2 (1.6%) |
| 20 to 24 Years | 11 (9.2%) | 11 (8.9%) |
| 25 to 29 Years | 19 (16.0%) | 2 (1.6%) |
| 30 to 34 Years | 5 (4.2%) | 8 (6.5%) |
| 35 to 39 Years | 0 (0.0%) | 6 (4.9%) |
| 40 to 44 Years | 3 (2.5%) | 7 (5.7%) |
| 45 to 49 Years | 8 (6.7%) | 14 (11.4%) |
| 50 to 54 Years | 38 (31.9%) | 13 (10.6%) |
| 55 to 59 Years | 1 (0.8%) | 4 (3.3%) |
| 60 to 64 Years | 2 (1.7%) | 2 (1.6%) |
| 65 to 69 Years | 4 (3.4%) | 6 (4.9%) |
| 70 to 74 Years | 3 (2.5%) | 2 (1.6%) |
| 75 to 79 Years | 4 (3.4%) | 7 (5.7%) |
| 80 to 84 Years | 1 (0.8%) | 1 (0.8%) |
| 85 Years and over | 2 (1.7%) | 0 (0.0%) |
| Total | 119 (100.0%) | 123 (100.0%) |
Families and Households in Tiro
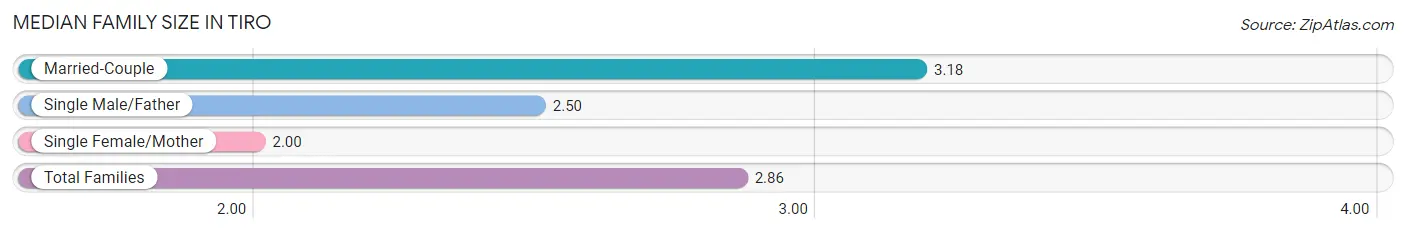
Median Family Size in Tiro
The median family size in Tiro is 2.86 persons per family, with married-couple families (51 | 71.8%) accounting for the largest median family size of 3.18 persons per family. On the other hand, single female/mother families (18 | 25.4%) represent the smallest median family size with 2.00 persons per family.
| Family Type | # Families | Family Size |
| Married-Couple | 51 (71.8%) | 3.18 |
| Single Male/Father | 2 (2.8%) | 2.50 |
| Single Female/Mother | 18 (25.4%) | 2.00 |
| Total Families | 71 (100.0%) | 2.86 |
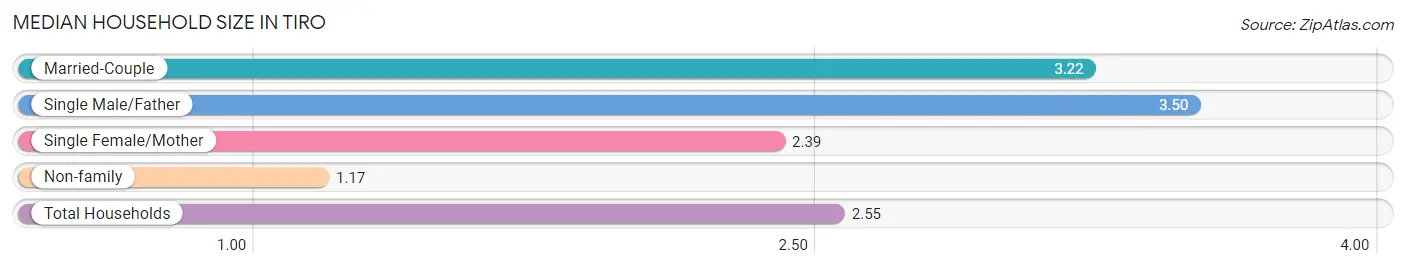
Median Household Size in Tiro
The median household size in Tiro is 2.55 persons per household, with single male/father households (2 | 2.1%) accounting for the largest median household size of 3.5 persons per household. non-family households (24 | 25.3%) represent the smallest median household size with 1.17 persons per household.
| Household Type | # Households | Household Size |
| Married-Couple | 51 (53.7%) | 3.22 |
| Single Male/Father | 2 (2.1%) | 3.50 |
| Single Female/Mother | 18 (19.0%) | 2.39 |
| Non-family | 24 (25.3%) | 1.17 |
| Total Households | 95 (100.0%) | 2.55 |
Household Size by Marriage Status in Tiro
Out of a total of 95 households in Tiro, 71 (74.7%) are family households, while 24 (25.3%) are nonfamily households. The most numerous type of family households are 5-person households, comprising 23, and the most common type of nonfamily households are 1-person households, comprising 19.
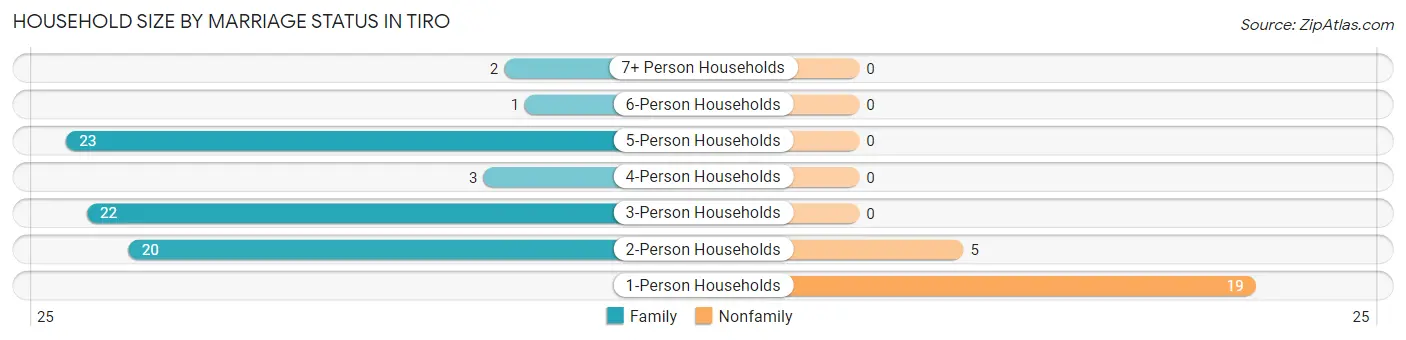
| Household Size | Family Households | Nonfamily Households |
| 1-Person Households | - | 19 (20.0%) |
| 2-Person Households | 20 (21.0%) | 5 (5.3%) |
| 3-Person Households | 22 (23.2%) | 0 (0.0%) |
| 4-Person Households | 3 (3.2%) | 0 (0.0%) |
| 5-Person Households | 23 (24.2%) | 0 (0.0%) |
| 6-Person Households | 1 (1.1%) | 0 (0.0%) |
| 7+ Person Households | 2 (2.1%) | 0 (0.0%) |
| Total | 71 (74.7%) | 24 (25.3%) |
Female Fertility in Tiro
Fertility by Age in Tiro
Average fertility rate in Tiro is 40.0 births per 1,000 women. Women in the age bracket of 20 to 34 years have the highest fertility rate with 95.0 births per 1,000 women. Women in the age bracket of 20 to 34 years acount for 100.0% of all women with births.
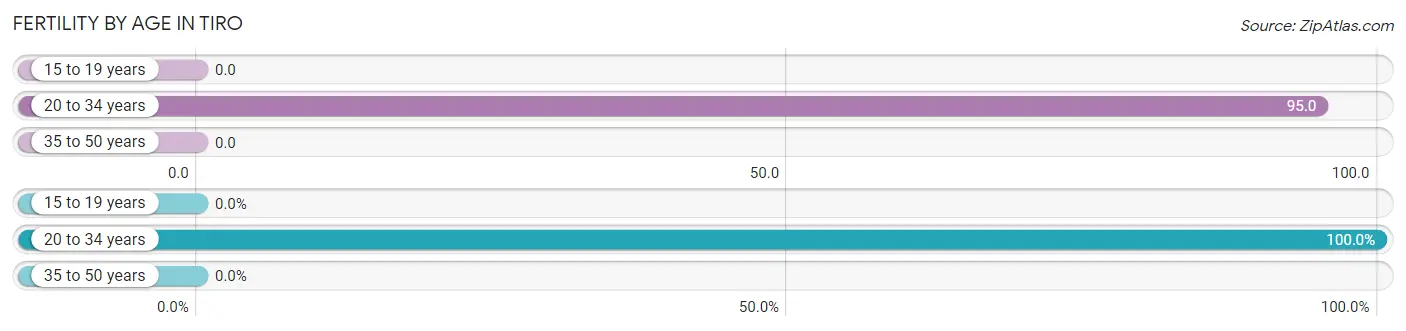
| Age Bracket | Women with Births | Births / 1,000 Women |
| 15 to 19 years | 0 (0.0%) | 0.0 |
| 20 to 34 years | 2 (100.0%) | 95.0 |
| 35 to 50 years | 0 (0.0%) | 0.0 |
| Total | 2 (100.0%) | 40.0 |
Fertility by Age by Marriage Status in Tiro
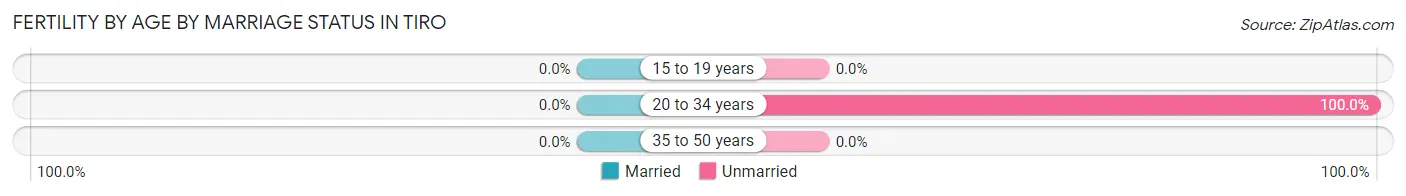
| Age Bracket | Married | Unmarried |
| 15 to 19 years | 0 (0.0%) | 0 (0.0%) |
| 20 to 34 years | 0 (0.0%) | 2 (100.0%) |
| 35 to 50 years | 0 (0.0%) | 0 (0.0%) |
| Total | 0 (0.0%) | 2 (100.0%) |
Fertility by Education in Tiro
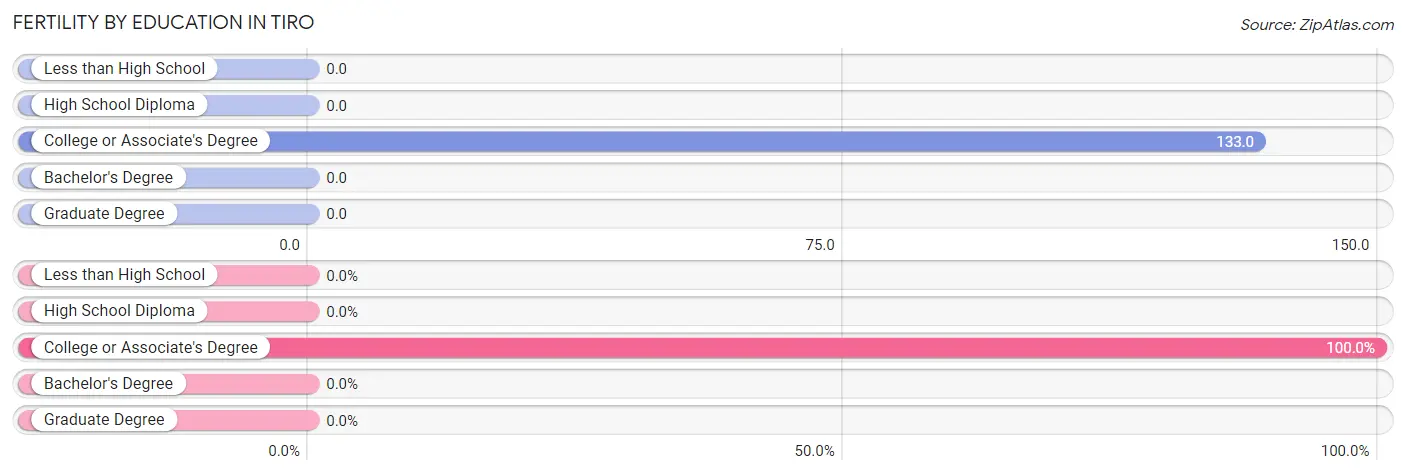
| Educational Attainment | Women with Births | Births / 1,000 Women |
| Less than High School | 0 (0.0%) | 0.0 |
| High School Diploma | 0 (0.0%) | 0.0 |
| College or Associate's Degree | 2 (100.0%) | 133.0 |
| Bachelor's Degree | 0 (0.0%) | 0.0 |
| Graduate Degree | 0 (0.0%) | 0.0 |
| Total | 2 (100.0%) | 40.0 |
Fertility by Education by Marriage Status in Tiro
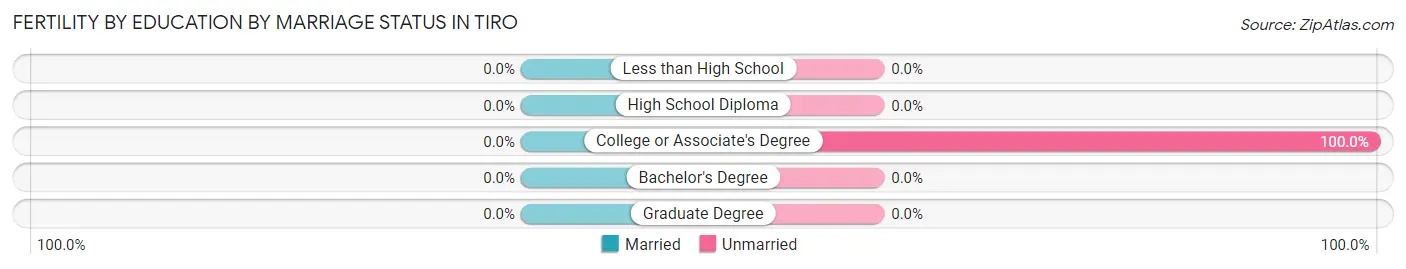
| Educational Attainment | Married | Unmarried |
| Less than High School | 0 (0.0%) | 0 (0.0%) |
| High School Diploma | 0 (0.0%) | 0 (0.0%) |
| College or Associate's Degree | 0 (0.0%) | 2 (100.0%) |
| Bachelor's Degree | 0 (0.0%) | 0 (0.0%) |
| Graduate Degree | 0 (0.0%) | 0 (0.0%) |
| Total | 0 (0.0%) | 2 (100.0%) |
Employment Characteristics in Tiro
Employment by Class of Employer in Tiro
Among the 119 employed individuals in Tiro, private company employees (93 | 78.1%), not-for-profit organizations (16 | 13.5%), and state government employees (7 | 5.9%) make up the most common classes of employment.
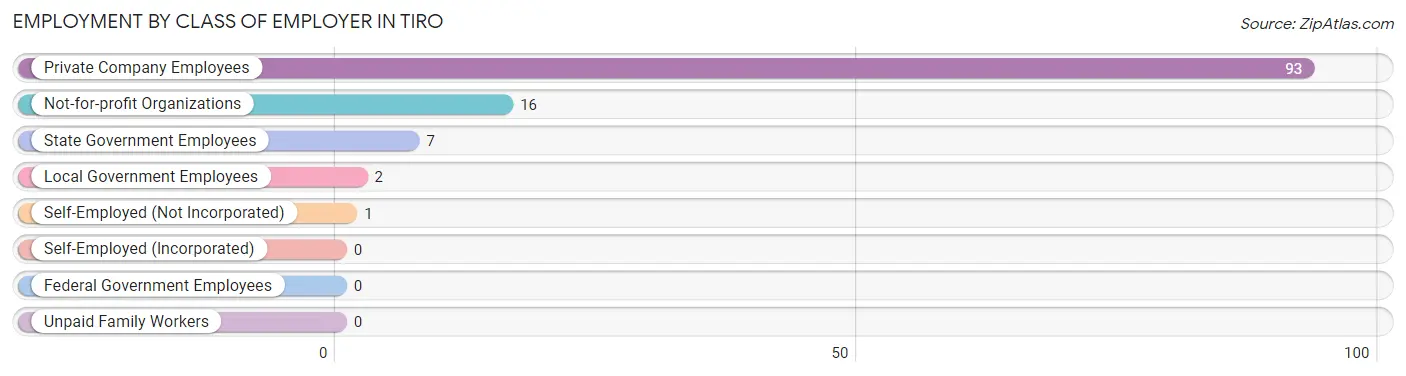
| Employer Class | # Employees | % Employees |
| Private Company Employees | 93 | 78.1% |
| Self-Employed (Incorporated) | 0 | 0.0% |
| Self-Employed (Not Incorporated) | 1 | 0.8% |
| Not-for-profit Organizations | 16 | 13.5% |
| Local Government Employees | 2 | 1.7% |
| State Government Employees | 7 | 5.9% |
| Federal Government Employees | 0 | 0.0% |
| Unpaid Family Workers | 0 | 0.0% |
| Total | 119 | 100.0% |
Employment Status by Age in Tiro
According to the labor force statistics for Tiro, out of the total population over 16 years of age (187), 67.4% or 126 individuals are in the labor force, with 5.6% or 7 of them unemployed. The age group with the highest labor force participation rate is 25 to 29 years, with 100.0% or 21 individuals in the labor force. Within the labor force, the 35 to 44 years age range has the highest percentage of unemployed individuals, with 21.4% or 3 of them being unemployed.
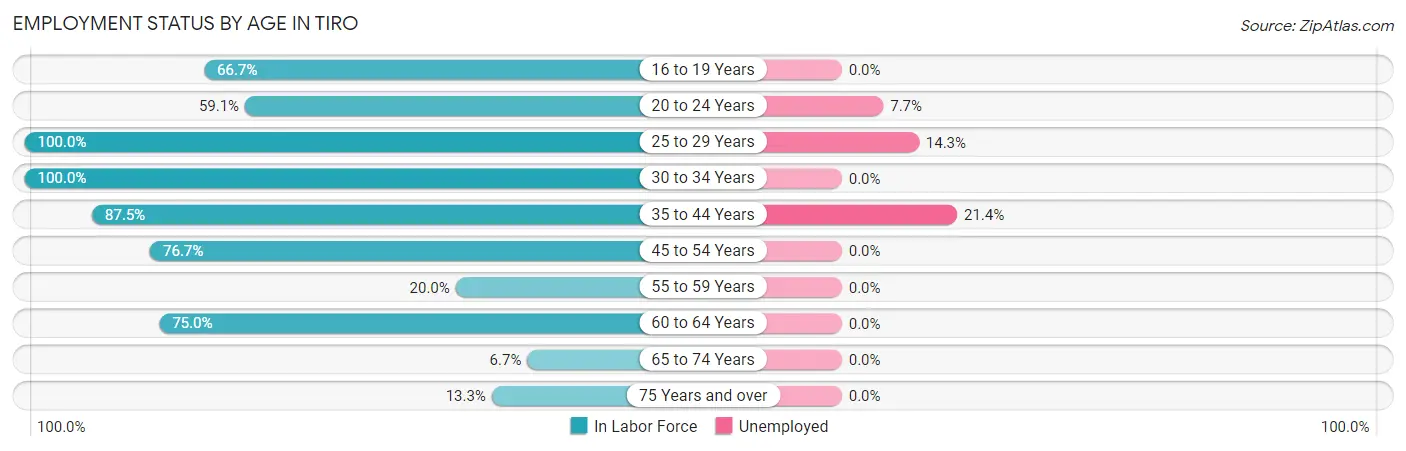
| Age Bracket | In Labor Force | Unemployed |
| 16 to 19 Years | 2 (66.7%) | 0 (0.0%) |
| 20 to 24 Years | 13 (59.1%) | 1 (7.7%) |
| 25 to 29 Years | 21 (100.0%) | 3 (14.3%) |
| 30 to 34 Years | 13 (100.0%) | 0 (0.0%) |
| 35 to 44 Years | 14 (87.5%) | 3 (21.4%) |
| 45 to 54 Years | 56 (76.7%) | 0 (0.0%) |
| 55 to 59 Years | 1 (20.0%) | 0 (0.0%) |
| 60 to 64 Years | 3 (75.0%) | 0 (0.0%) |
| 65 to 74 Years | 1 (6.7%) | 0 (0.0%) |
| 75 Years and over | 2 (13.3%) | 0 (0.0%) |
| Total | 126 (67.4%) | 7 (5.6%) |
Employment Status by Educational Attainment in Tiro
According to labor force statistics for Tiro, 81.8% of individuals (108) out of the total population between 25 and 64 years of age (132) are in the labor force, with 5.6% or 6 of them being unemployed. The group with the highest labor force participation rate are those with the educational attainment of college / associate degree, with 100.0% or 13 individuals in the labor force. Within the labor force, individuals with college / associate degree education have the highest percentage of unemployment, with 23.1% or 3 of them being unemployed.
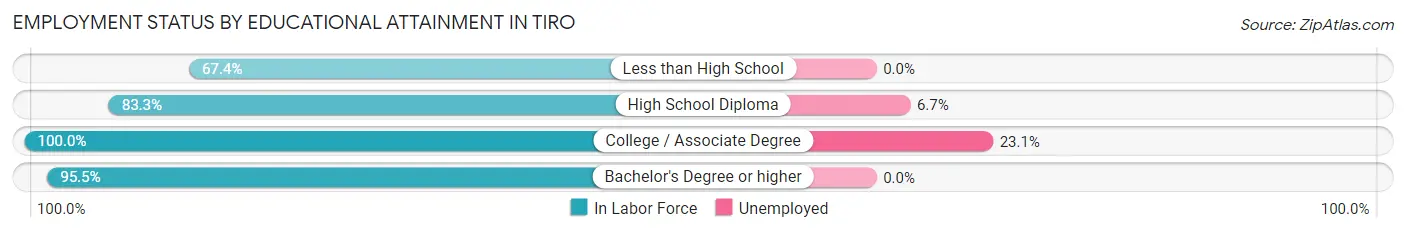
| Educational Attainment | In Labor Force | Unemployed |
| Less than High School | 29 (67.4%) | 0 (0.0%) |
| High School Diploma | 45 (83.3%) | 4 (6.7%) |
| College / Associate Degree | 13 (100.0%) | 3 (23.1%) |
| Bachelor's Degree or higher | 21 (95.5%) | 0 (0.0%) |
| Total | 108 (81.8%) | 7 (5.6%) |
Employment Occupations by Sex in Tiro
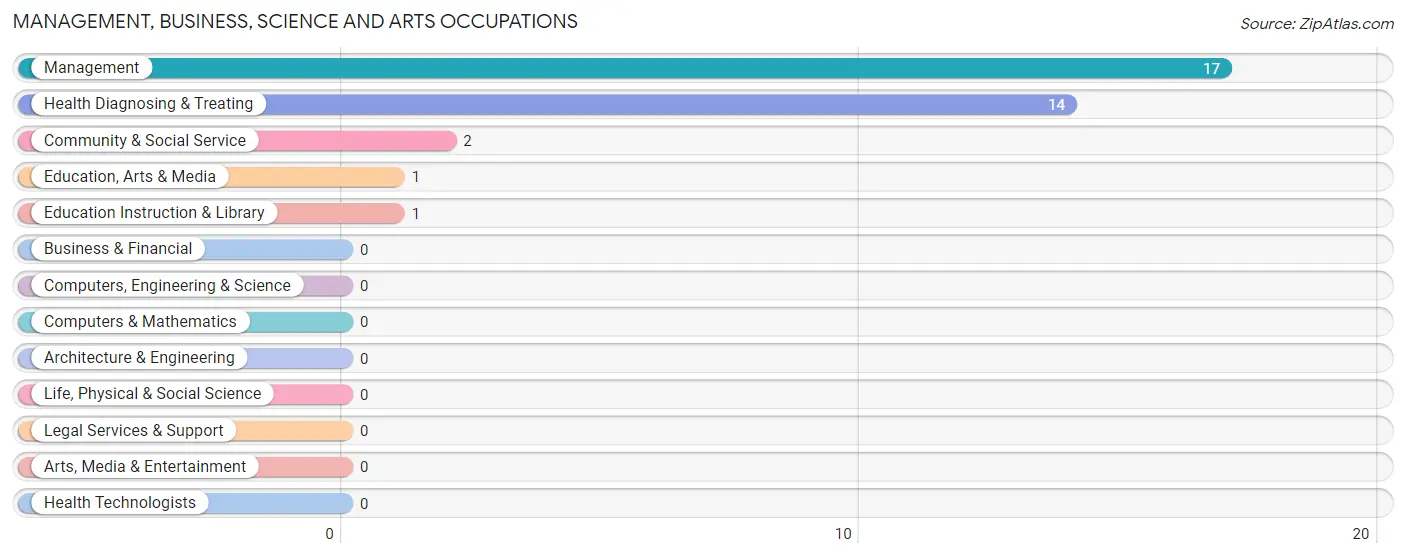
Management, Business, Science and Arts Occupations
The most common Management, Business, Science and Arts occupations in Tiro are Management (17 | 14.3%), Health Diagnosing & Treating (14 | 11.8%), Community & Social Service (2 | 1.7%), Education, Arts & Media (1 | 0.8%), and Education Instruction & Library (1 | 0.8%).
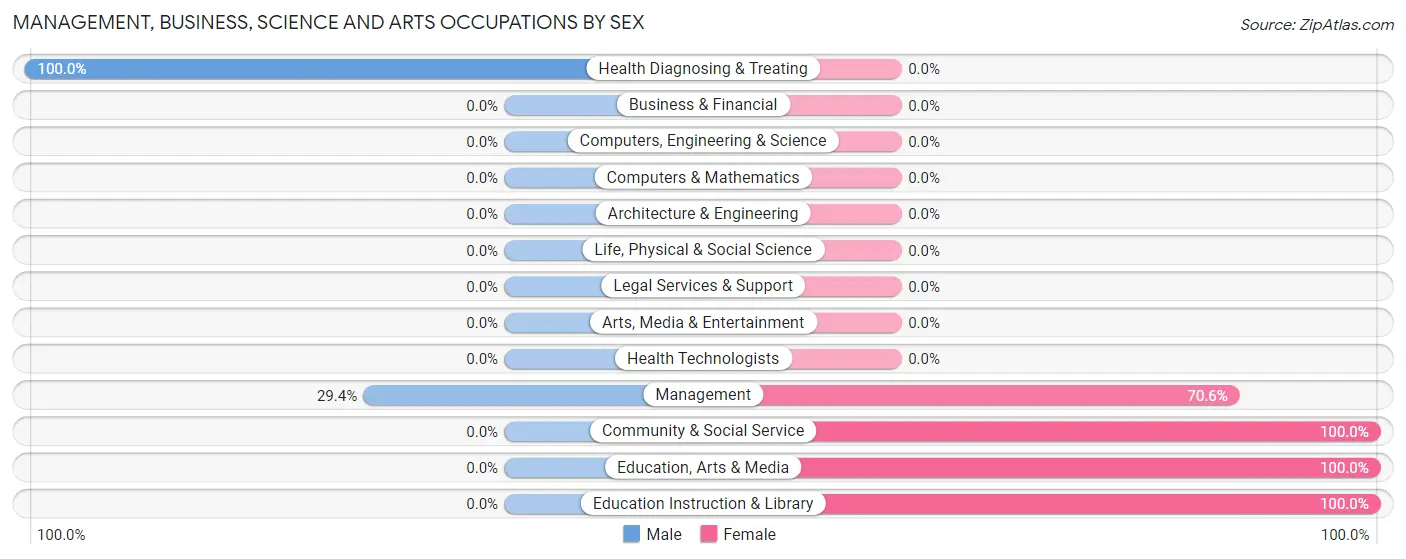
Management, Business, Science and Arts Occupations by Sex
Within the Management, Business, Science and Arts occupations in Tiro, the most male-oriented occupations are Health Diagnosing & Treating (100.0%), and Management (29.4%), while the most female-oriented occupations are Community & Social Service (100.0%), Education, Arts & Media (100.0%), and Education Instruction & Library (100.0%).
| Occupation | Male | Female |
| Management | 5 (29.4%) | 12 (70.6%) |
| Business & Financial | 0 (0.0%) | 0 (0.0%) |
| Computers, Engineering & Science | 0 (0.0%) | 0 (0.0%) |
| Computers & Mathematics | 0 (0.0%) | 0 (0.0%) |
| Architecture & Engineering | 0 (0.0%) | 0 (0.0%) |
| Life, Physical & Social Science | 0 (0.0%) | 0 (0.0%) |
| Community & Social Service | 0 (0.0%) | 2 (100.0%) |
| Education, Arts & Media | 0 (0.0%) | 1 (100.0%) |
| Legal Services & Support | 0 (0.0%) | 0 (0.0%) |
| Education Instruction & Library | 0 (0.0%) | 1 (100.0%) |
| Arts, Media & Entertainment | 0 (0.0%) | 0 (0.0%) |
| Health Diagnosing & Treating | 14 (100.0%) | 0 (0.0%) |
| Health Technologists | 0 (0.0%) | 0 (0.0%) |
| Total (Category) | 19 (57.6%) | 14 (42.4%) |
| Total (Overall) | 76 (63.9%) | 43 (36.1%) |
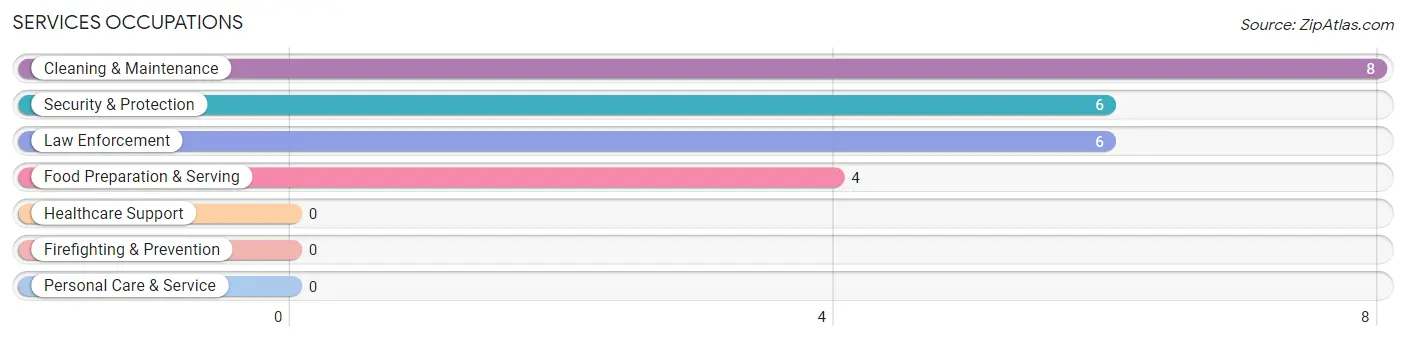
Services Occupations
The most common Services occupations in Tiro are Cleaning & Maintenance (8 | 6.7%), Security & Protection (6 | 5.0%), Law Enforcement (6 | 5.0%), and Food Preparation & Serving (4 | 3.4%).
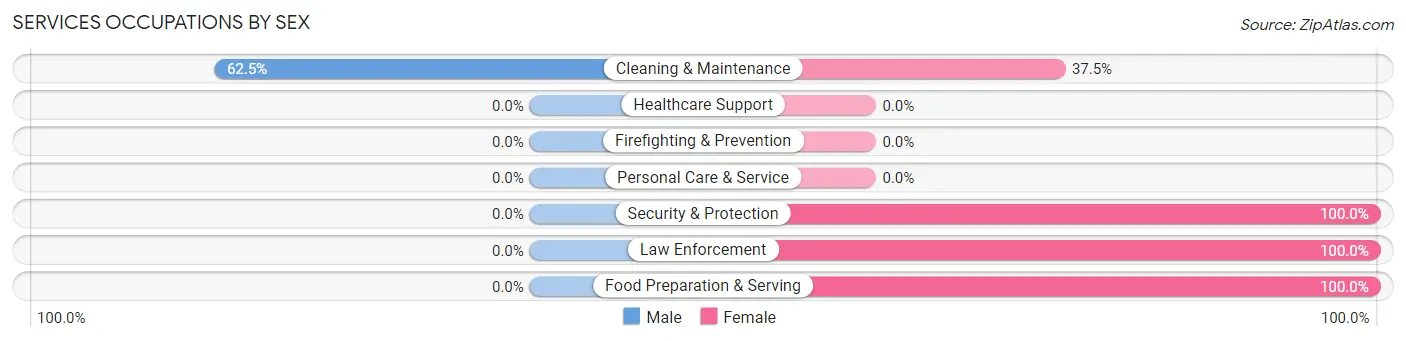
Services Occupations by Sex
| Occupation | Male | Female |
| Healthcare Support | 0 (0.0%) | 0 (0.0%) |
| Security & Protection | 0 (0.0%) | 6 (100.0%) |
| Firefighting & Prevention | 0 (0.0%) | 0 (0.0%) |
| Law Enforcement | 0 (0.0%) | 6 (100.0%) |
| Food Preparation & Serving | 0 (0.0%) | 4 (100.0%) |
| Cleaning & Maintenance | 5 (62.5%) | 3 (37.5%) |
| Personal Care & Service | 0 (0.0%) | 0 (0.0%) |
| Total (Category) | 5 (27.8%) | 13 (72.2%) |
| Total (Overall) | 76 (63.9%) | 43 (36.1%) |
Sales and Office Occupations
The most common Sales and Office occupations in Tiro are Sales & Related (6 | 5.0%), and Office & Administration (6 | 5.0%).
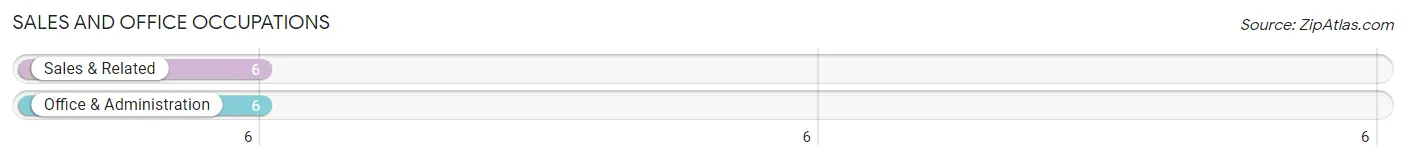
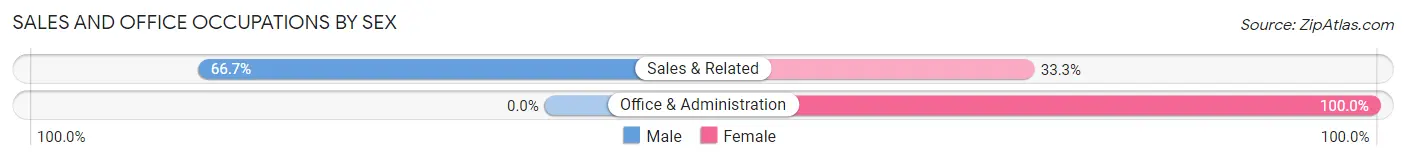
Sales and Office Occupations by Sex
| Occupation | Male | Female |
| Sales & Related | 4 (66.7%) | 2 (33.3%) |
| Office & Administration | 0 (0.0%) | 6 (100.0%) |
| Total (Category) | 4 (33.3%) | 8 (66.7%) |
| Total (Overall) | 76 (63.9%) | 43 (36.1%) |
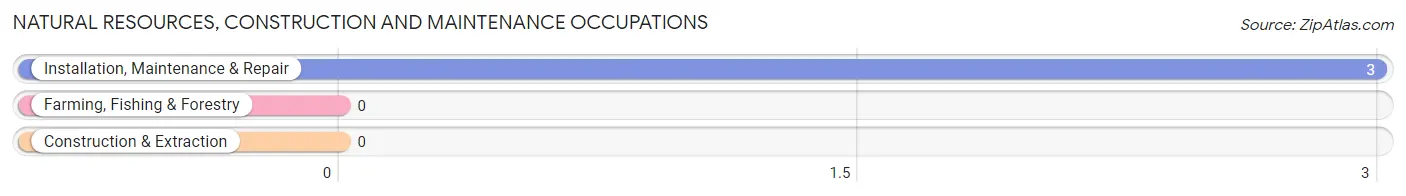
Natural Resources, Construction and Maintenance Occupations
The most common Natural Resources, Construction and Maintenance occupations in Tiro are , and Installation, Maintenance & Repair (3 | 2.5%).
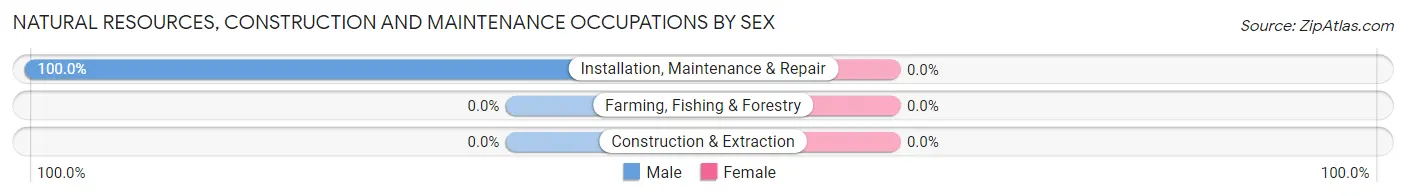
Natural Resources, Construction and Maintenance Occupations by Sex
| Occupation | Male | Female |
| Farming, Fishing & Forestry | 0 (0.0%) | 0 (0.0%) |
| Construction & Extraction | 0 (0.0%) | 0 (0.0%) |
| Installation, Maintenance & Repair | 3 (100.0%) | 0 (0.0%) |
| Total (Category) | 3 (100.0%) | 0 (0.0%) |
| Total (Overall) | 76 (63.9%) | 43 (36.1%) |
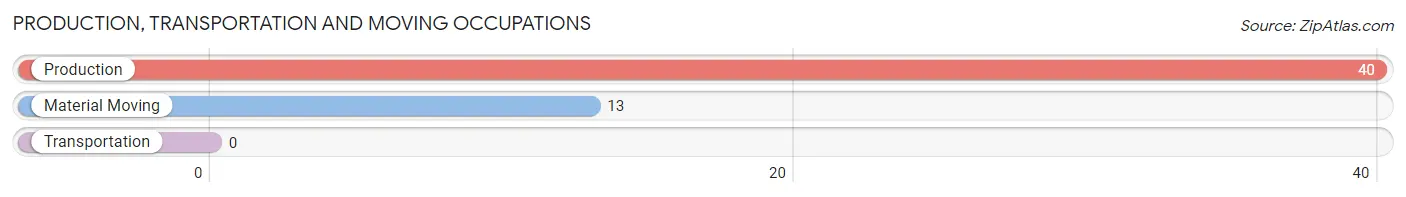
Production, Transportation and Moving Occupations
The most common Production, Transportation and Moving occupations in Tiro are Production (40 | 33.6%), and Material Moving (13 | 10.9%).
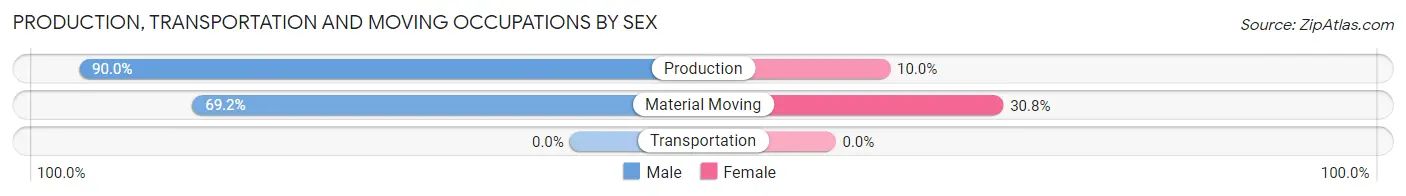
Production, Transportation and Moving Occupations by Sex
| Occupation | Male | Female |
| Production | 36 (90.0%) | 4 (10.0%) |
| Transportation | 0 (0.0%) | 0 (0.0%) |
| Material Moving | 9 (69.2%) | 4 (30.8%) |
| Total (Category) | 45 (84.9%) | 8 (15.1%) |
| Total (Overall) | 76 (63.9%) | 43 (36.1%) |
Employment Industries by Sex in Tiro
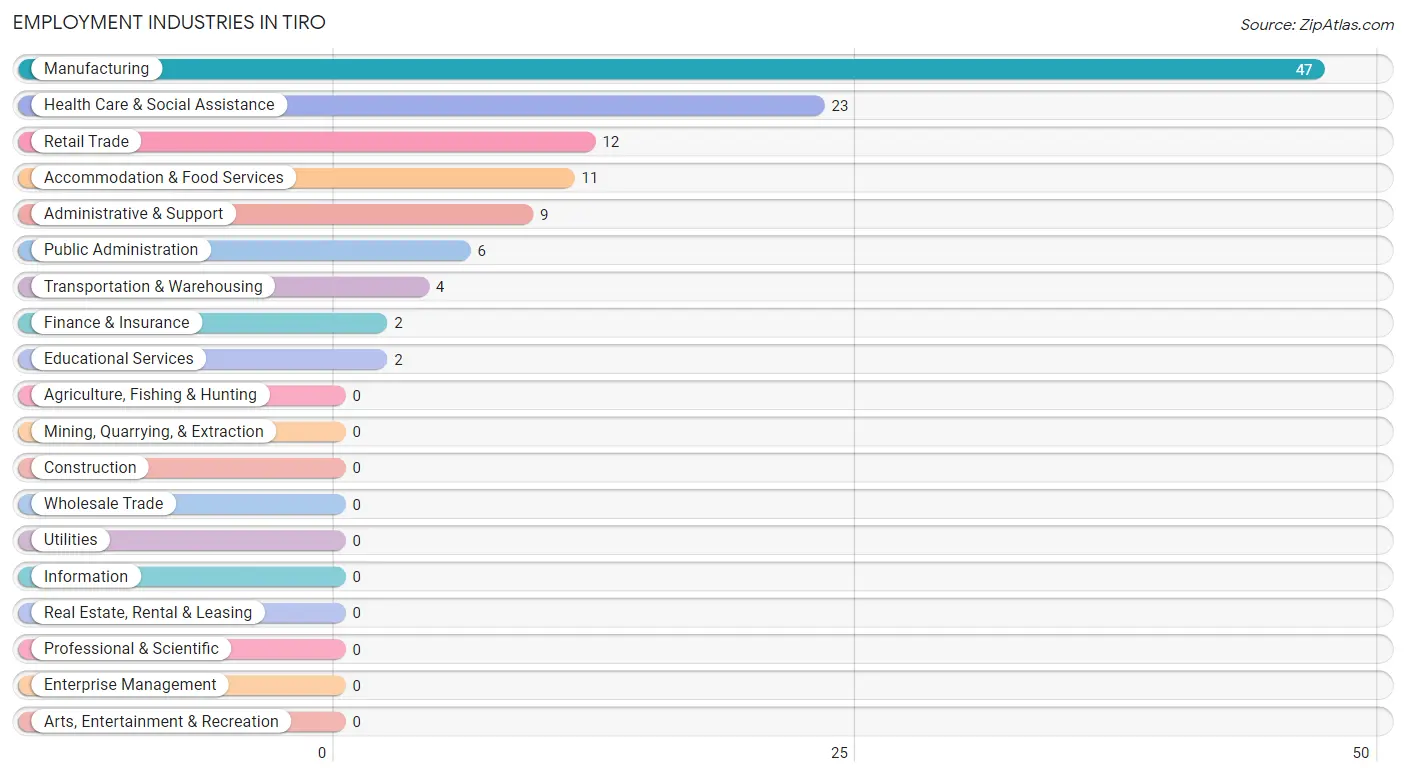
Employment Industries in Tiro
The major employment industries in Tiro include Manufacturing (47 | 39.5%), Health Care & Social Assistance (23 | 19.3%), Retail Trade (12 | 10.1%), Accommodation & Food Services (11 | 9.2%), and Administrative & Support (9 | 7.6%).
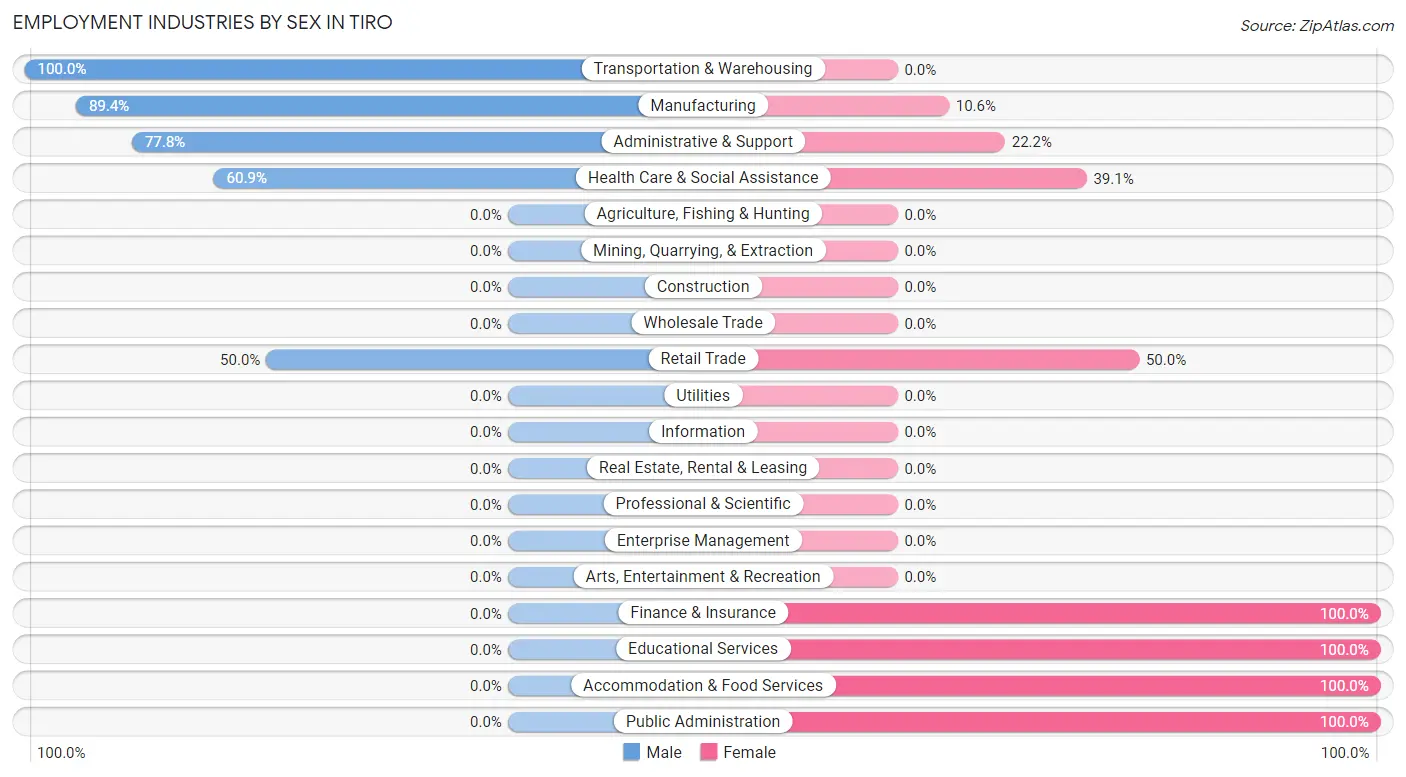
Employment Industries by Sex in Tiro
The Tiro industries that see more men than women are Transportation & Warehousing (100.0%), Manufacturing (89.4%), and Administrative & Support (77.8%), whereas the industries that tend to have a higher number of women are Finance & Insurance (100.0%), Educational Services (100.0%), and Accommodation & Food Services (100.0%).
| Industry | Male | Female |
| Agriculture, Fishing & Hunting | 0 (0.0%) | 0 (0.0%) |
| Mining, Quarrying, & Extraction | 0 (0.0%) | 0 (0.0%) |
| Construction | 0 (0.0%) | 0 (0.0%) |
| Manufacturing | 42 (89.4%) | 5 (10.6%) |
| Wholesale Trade | 0 (0.0%) | 0 (0.0%) |
| Retail Trade | 6 (50.0%) | 6 (50.0%) |
| Transportation & Warehousing | 4 (100.0%) | 0 (0.0%) |
| Utilities | 0 (0.0%) | 0 (0.0%) |
| Information | 0 (0.0%) | 0 (0.0%) |
| Finance & Insurance | 0 (0.0%) | 2 (100.0%) |
| Real Estate, Rental & Leasing | 0 (0.0%) | 0 (0.0%) |
| Professional & Scientific | 0 (0.0%) | 0 (0.0%) |
| Enterprise Management | 0 (0.0%) | 0 (0.0%) |
| Administrative & Support | 7 (77.8%) | 2 (22.2%) |
| Educational Services | 0 (0.0%) | 2 (100.0%) |
| Health Care & Social Assistance | 14 (60.9%) | 9 (39.1%) |
| Arts, Entertainment & Recreation | 0 (0.0%) | 0 (0.0%) |
| Accommodation & Food Services | 0 (0.0%) | 11 (100.0%) |
| Public Administration | 0 (0.0%) | 6 (100.0%) |
| Total | 76 (63.9%) | 43 (36.1%) |
Education in Tiro
School Enrollment in Tiro
The most common levels of schooling among the 50 students in Tiro are middle school (21 | 42.0%), college / undergraduate (12 | 24.0%), and nursery / preschool (6 | 12.0%).
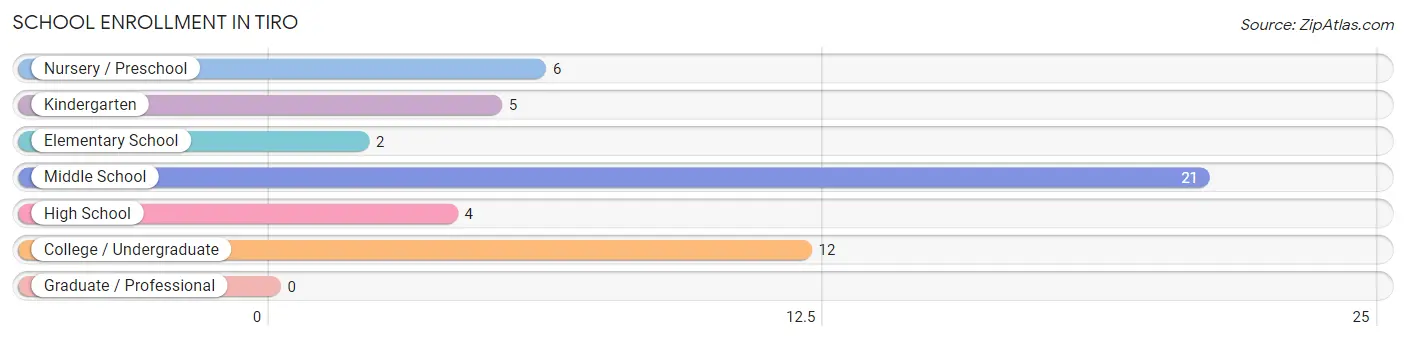
| School Level | # Students | % Students |
| Nursery / Preschool | 6 | 12.0% |
| Kindergarten | 5 | 10.0% |
| Elementary School | 2 | 4.0% |
| Middle School | 21 | 42.0% |
| High School | 4 | 8.0% |
| College / Undergraduate | 12 | 24.0% |
| Graduate / Professional | 0 | 0.0% |
| Total | 50 | 100.0% |
School Enrollment by Age by Funding Source in Tiro
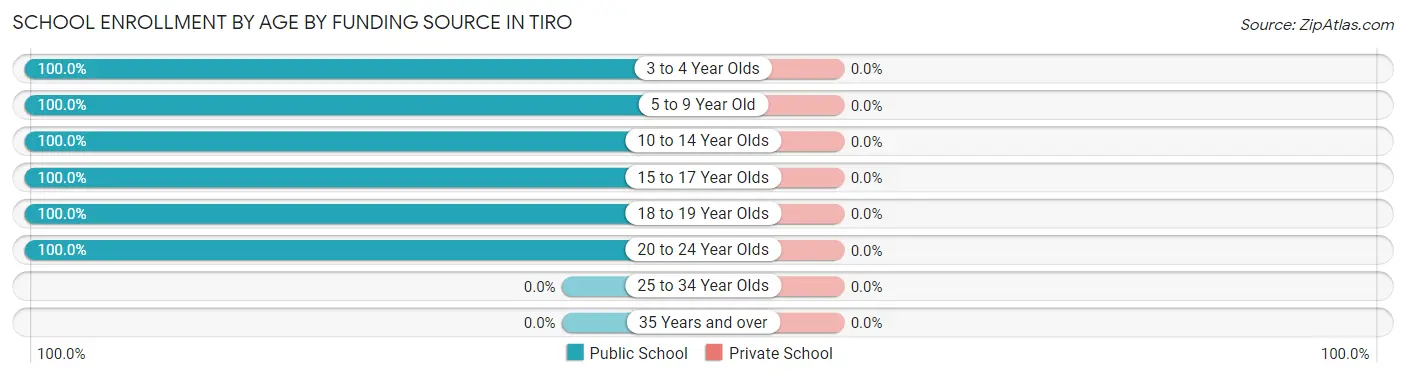
| Age Bracket | Public School | Private School |
| 3 to 4 Year Olds | 6 (100.0%) | 0 (0.0%) |
| 5 to 9 Year Old | 7 (100.0%) | 0 (0.0%) |
| 10 to 14 Year Olds | 23 (100.0%) | 0 (0.0%) |
| 15 to 17 Year Olds | 2 (100.0%) | 0 (0.0%) |
| 18 to 19 Year Olds | 1 (100.0%) | 0 (0.0%) |
| 20 to 24 Year Olds | 11 (100.0%) | 0 (0.0%) |
| 25 to 34 Year Olds | 0 (0.0%) | 0 (0.0%) |
| 35 Years and over | 0 (0.0%) | 0 (0.0%) |
| Total | 50 (100.0%) | 0 (0.0%) |
Educational Attainment by Field of Study in Tiro
Science & technology (15 | 68.2%), multidisciplinary studies (5 | 22.7%), business (1 | 4.5%), and education (1 | 4.5%) are the most common fields of study among 22 individuals in Tiro who have obtained a bachelor's degree or higher.
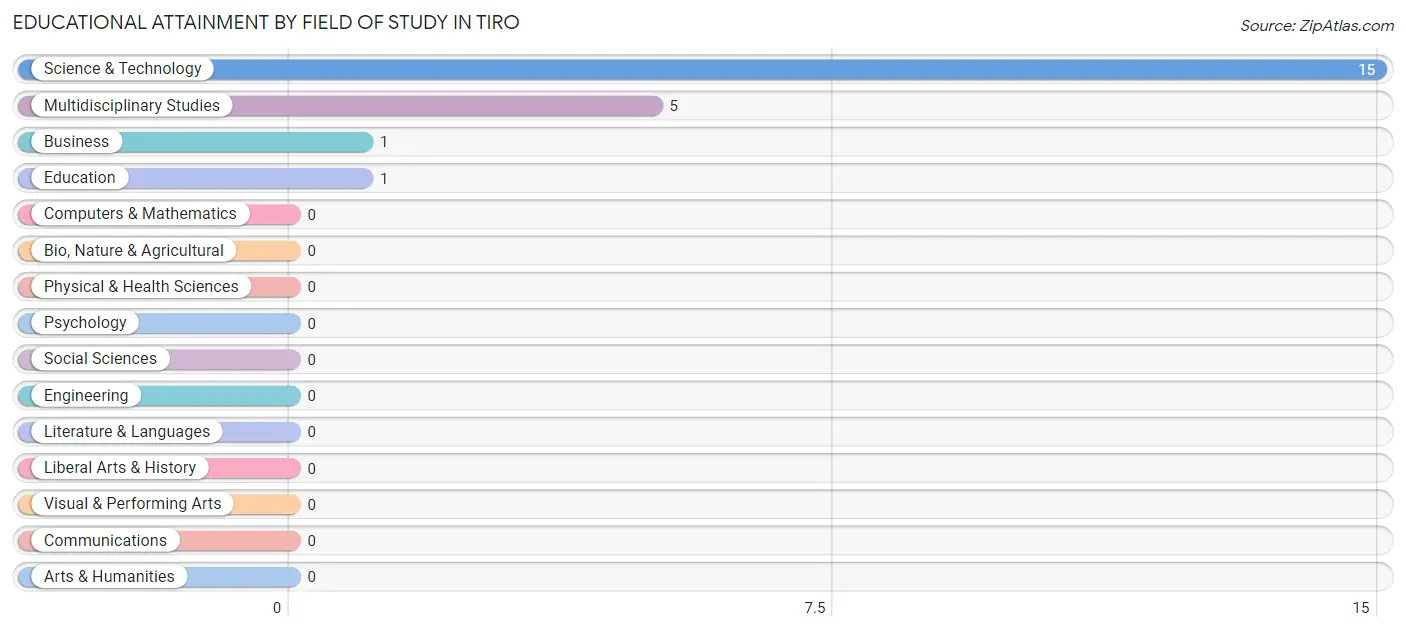
| Field of Study | # Graduates | % Graduates |
| Computers & Mathematics | 0 | 0.0% |
| Bio, Nature & Agricultural | 0 | 0.0% |
| Physical & Health Sciences | 0 | 0.0% |
| Psychology | 0 | 0.0% |
| Social Sciences | 0 | 0.0% |
| Engineering | 0 | 0.0% |
| Multidisciplinary Studies | 5 | 22.7% |
| Science & Technology | 15 | 68.2% |
| Business | 1 | 4.5% |
| Education | 1 | 4.5% |
| Literature & Languages | 0 | 0.0% |
| Liberal Arts & History | 0 | 0.0% |
| Visual & Performing Arts | 0 | 0.0% |
| Communications | 0 | 0.0% |
| Arts & Humanities | 0 | 0.0% |
| Total | 22 | 100.0% |
Transportation & Commute in Tiro
Vehicle Availability by Sex in Tiro
The most prevalent vehicle ownership categories in Tiro are males with 4 vehicles (45, accounting for 59.2%) and females with 4 vehicles (7, making up 104.6%).
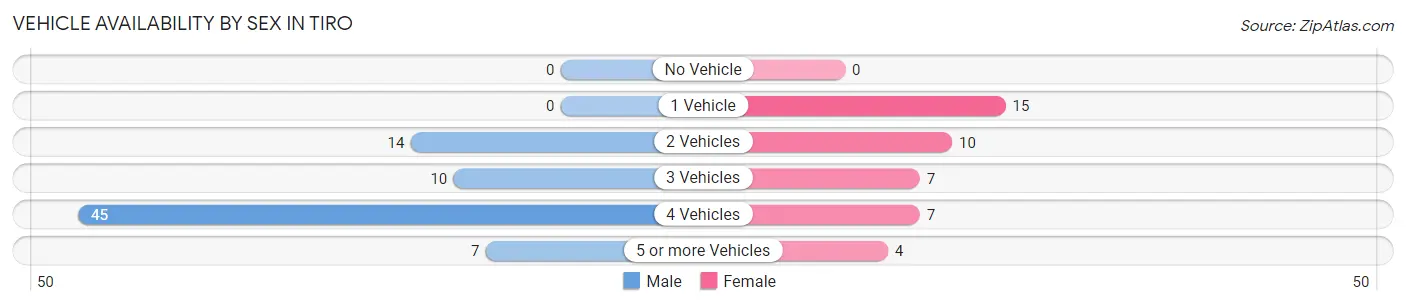
| Vehicles Available | Male | Female |
| No Vehicle | 0 (0.0%) | 0 (0.0%) |
| 1 Vehicle | 0 (0.0%) | 15 (34.9%) |
| 2 Vehicles | 14 (18.4%) | 10 (23.3%) |
| 3 Vehicles | 10 (13.2%) | 7 (16.3%) |
| 4 Vehicles | 45 (59.2%) | 7 (16.3%) |
| 5 or more Vehicles | 7 (9.2%) | 4 (9.3%) |
| Total | 76 (100.0%) | 43 (100.0%) |
Commute Time in Tiro
The most frequently occuring commute durations in Tiro are 45 to 59 minutes (34 commuters, 28.8%), 25 to 29 minutes (28 commuters, 23.7%), and 20 to 24 minutes (22 commuters, 18.6%).
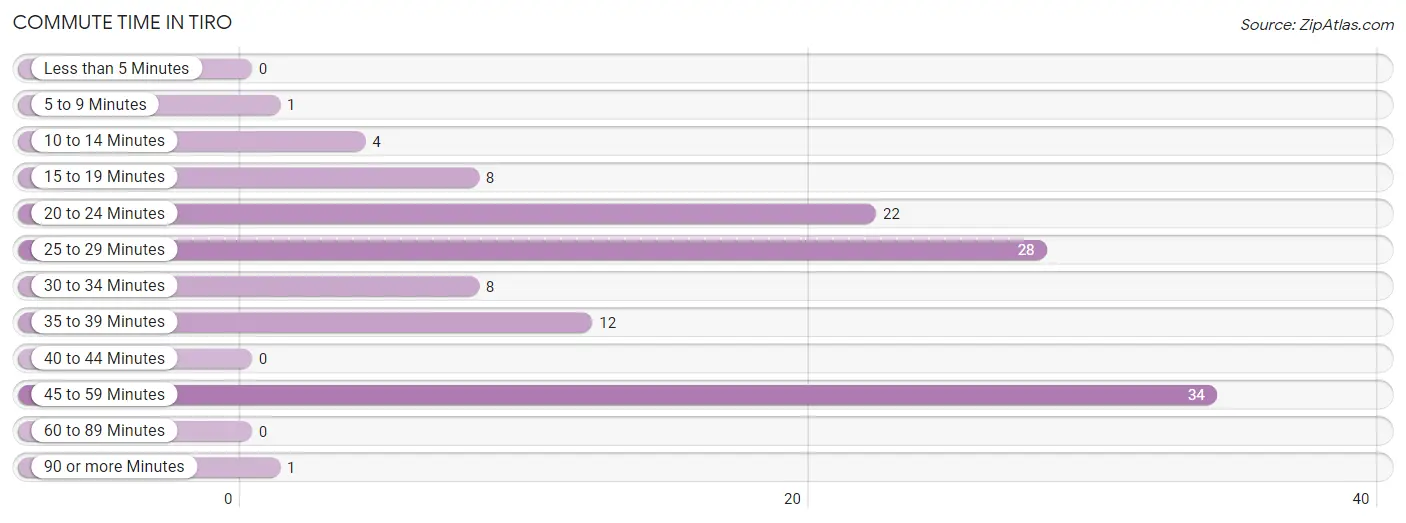
| Commute Time | # Commuters | % Commuters |
| Less than 5 Minutes | 0 | 0.0% |
| 5 to 9 Minutes | 1 | 0.9% |
| 10 to 14 Minutes | 4 | 3.4% |
| 15 to 19 Minutes | 8 | 6.8% |
| 20 to 24 Minutes | 22 | 18.6% |
| 25 to 29 Minutes | 28 | 23.7% |
| 30 to 34 Minutes | 8 | 6.8% |
| 35 to 39 Minutes | 12 | 10.2% |
| 40 to 44 Minutes | 0 | 0.0% |
| 45 to 59 Minutes | 34 | 28.8% |
| 60 to 89 Minutes | 0 | 0.0% |
| 90 or more Minutes | 1 | 0.9% |
Commute Time by Sex in Tiro
The most common commute times in Tiro are 25 to 29 minutes (23 commuters, 30.3%) for males and 20 to 24 minutes (13 commuters, 30.9%) for females.
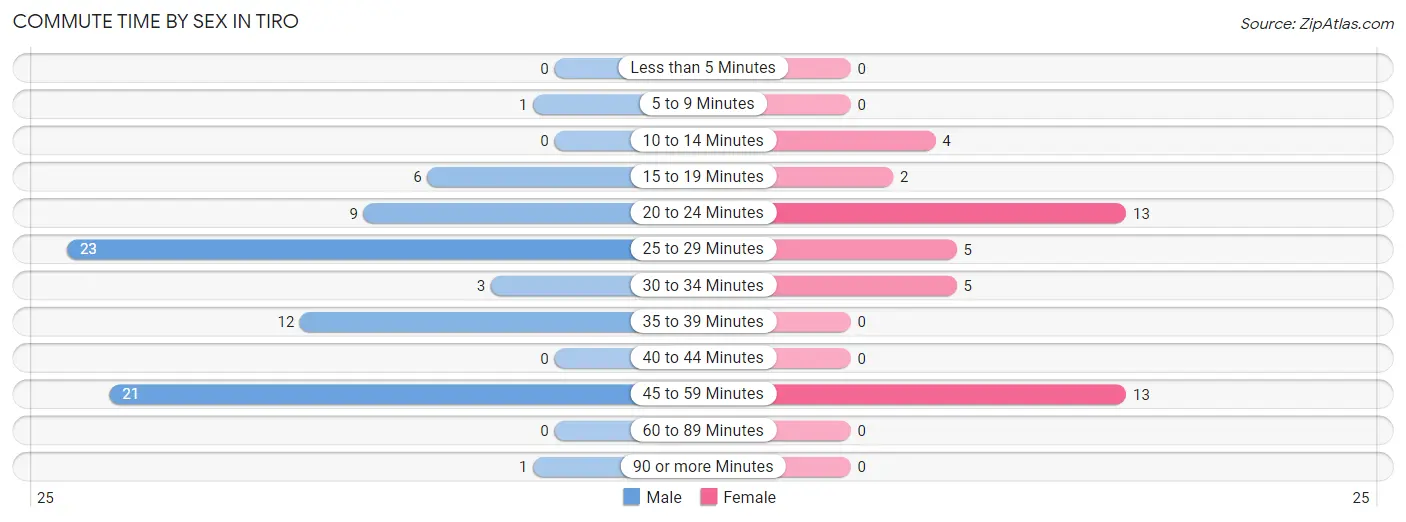
| Commute Time | Male | Female |
| Less than 5 Minutes | 0 (0.0%) | 0 (0.0%) |
| 5 to 9 Minutes | 1 (1.3%) | 0 (0.0%) |
| 10 to 14 Minutes | 0 (0.0%) | 4 (9.5%) |
| 15 to 19 Minutes | 6 (7.9%) | 2 (4.8%) |
| 20 to 24 Minutes | 9 (11.8%) | 13 (30.9%) |
| 25 to 29 Minutes | 23 (30.3%) | 5 (11.9%) |
| 30 to 34 Minutes | 3 (4.0%) | 5 (11.9%) |
| 35 to 39 Minutes | 12 (15.8%) | 0 (0.0%) |
| 40 to 44 Minutes | 0 (0.0%) | 0 (0.0%) |
| 45 to 59 Minutes | 21 (27.6%) | 13 (30.9%) |
| 60 to 89 Minutes | 0 (0.0%) | 0 (0.0%) |
| 90 or more Minutes | 1 (1.3%) | 0 (0.0%) |
Time of Departure to Work by Sex in Tiro
The most frequent times of departure to work in Tiro are 5:00 AM to 5:29 AM (31, 40.8%) for males and 6:00 AM to 6:29 AM (9, 21.4%) for females.
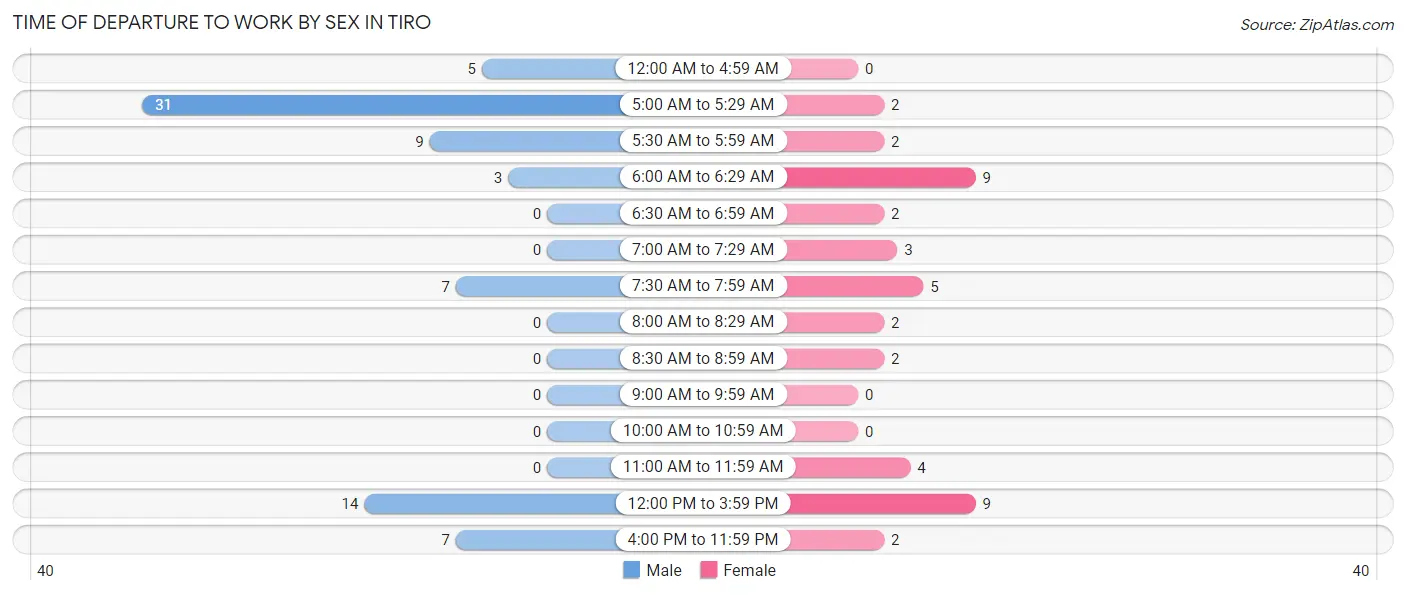
| Time of Departure | Male | Female |
| 12:00 AM to 4:59 AM | 5 (6.6%) | 0 (0.0%) |
| 5:00 AM to 5:29 AM | 31 (40.8%) | 2 (4.8%) |
| 5:30 AM to 5:59 AM | 9 (11.8%) | 2 (4.8%) |
| 6:00 AM to 6:29 AM | 3 (4.0%) | 9 (21.4%) |
| 6:30 AM to 6:59 AM | 0 (0.0%) | 2 (4.8%) |
| 7:00 AM to 7:29 AM | 0 (0.0%) | 3 (7.1%) |
| 7:30 AM to 7:59 AM | 7 (9.2%) | 5 (11.9%) |
| 8:00 AM to 8:29 AM | 0 (0.0%) | 2 (4.8%) |
| 8:30 AM to 8:59 AM | 0 (0.0%) | 2 (4.8%) |
| 9:00 AM to 9:59 AM | 0 (0.0%) | 0 (0.0%) |
| 10:00 AM to 10:59 AM | 0 (0.0%) | 0 (0.0%) |
| 11:00 AM to 11:59 AM | 0 (0.0%) | 4 (9.5%) |
| 12:00 PM to 3:59 PM | 14 (18.4%) | 9 (21.4%) |
| 4:00 PM to 11:59 PM | 7 (9.2%) | 2 (4.8%) |
| Total | 76 (100.0%) | 42 (100.0%) |
Housing Occupancy in Tiro
Occupancy by Ownership in Tiro
Of the total 95 dwellings in Tiro, owner-occupied units account for 86 (90.5%), while renter-occupied units make up 9 (9.5%).
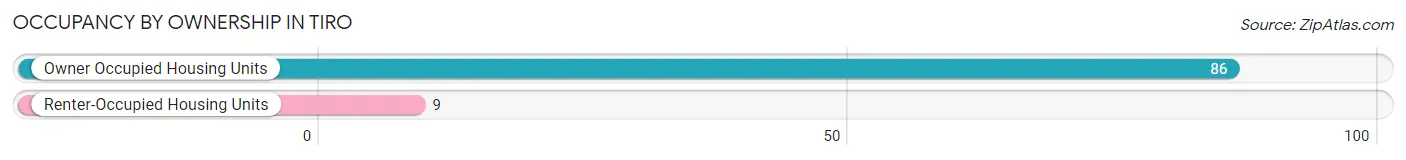
| Occupancy | # Housing Units | % Housing Units |
| Owner Occupied Housing Units | 86 | 90.5% |
| Renter-Occupied Housing Units | 9 | 9.5% |
| Total Occupied Housing Units | 95 | 100.0% |
Occupancy by Household Size in Tiro
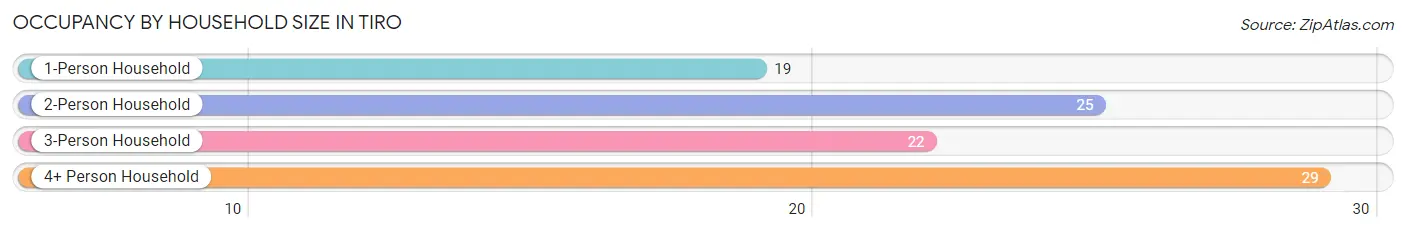
| Household Size | # Housing Units | % Housing Units |
| 1-Person Household | 19 | 20.0% |
| 2-Person Household | 25 | 26.3% |
| 3-Person Household | 22 | 23.2% |
| 4+ Person Household | 29 | 30.5% |
| Total Housing Units | 95 | 100.0% |
Occupancy by Ownership by Household Size in Tiro
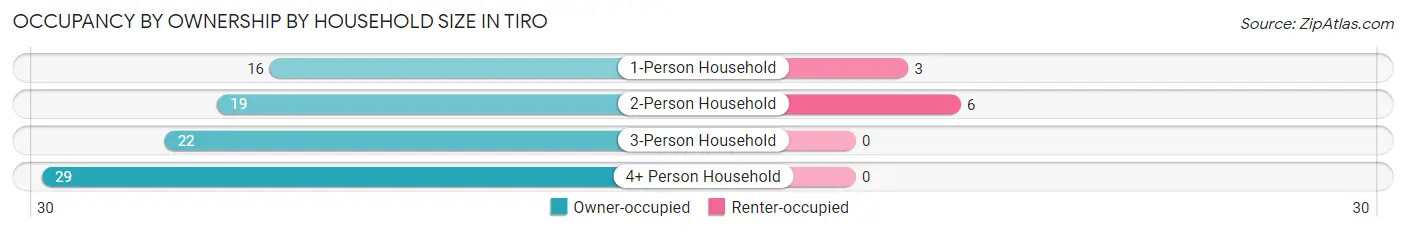
| Household Size | Owner-occupied | Renter-occupied |
| 1-Person Household | 16 (84.2%) | 3 (15.8%) |
| 2-Person Household | 19 (76.0%) | 6 (24.0%) |
| 3-Person Household | 22 (100.0%) | 0 (0.0%) |
| 4+ Person Household | 29 (100.0%) | 0 (0.0%) |
| Total Housing Units | 86 (90.5%) | 9 (9.5%) |
Occupancy by Educational Attainment in Tiro
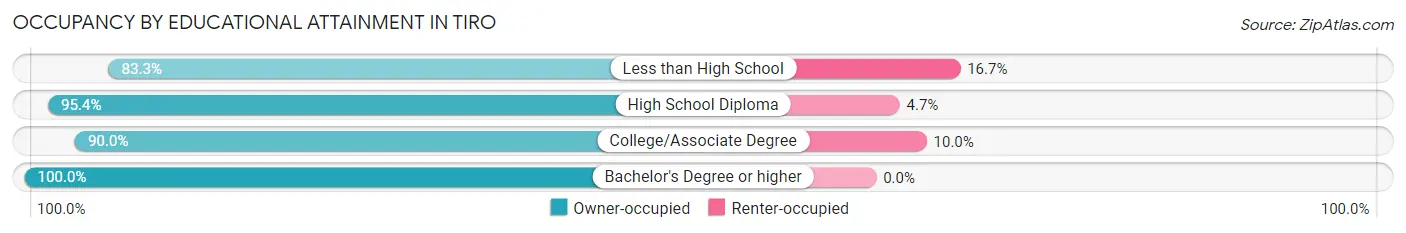
| Household Size | Owner-occupied | Renter-occupied |
| Less than High School | 30 (83.3%) | 6 (16.7%) |
| High School Diploma | 41 (95.4%) | 2 (4.6%) |
| College/Associate Degree | 9 (90.0%) | 1 (10.0%) |
| Bachelor's Degree or higher | 6 (100.0%) | 0 (0.0%) |
Occupancy by Age of Householder in Tiro
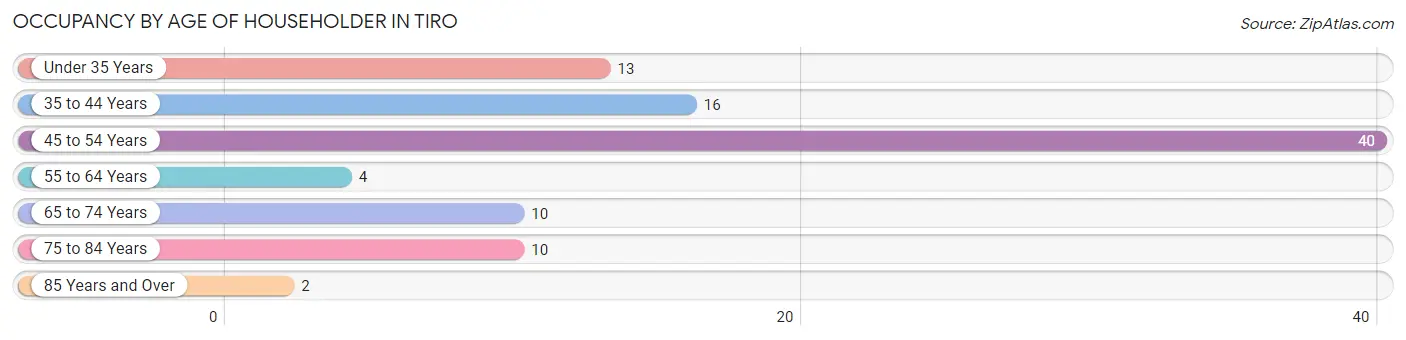
| Age Bracket | # Households | % Households |
| Under 35 Years | 13 | 13.7% |
| 35 to 44 Years | 16 | 16.8% |
| 45 to 54 Years | 40 | 42.1% |
| 55 to 64 Years | 4 | 4.2% |
| 65 to 74 Years | 10 | 10.5% |
| 75 to 84 Years | 10 | 10.5% |
| 85 Years and Over | 2 | 2.1% |
| Total | 95 | 100.0% |
Housing Finances in Tiro
Median Income by Occupancy in Tiro
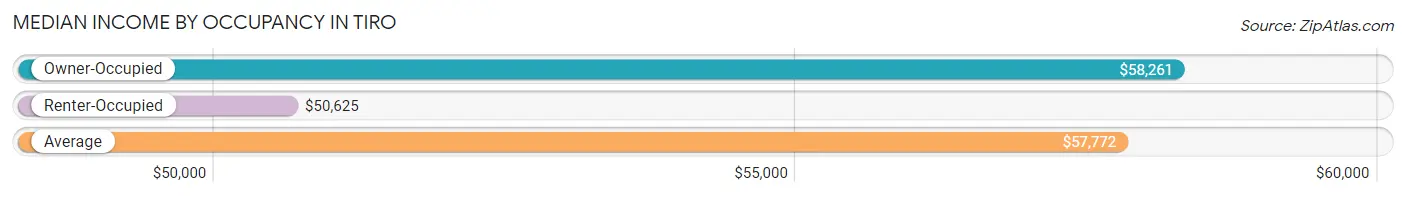
| Occupancy Type | # Households | Median Income |
| Owner-Occupied | 86 (90.5%) | $58,261 |
| Renter-Occupied | 9 (9.5%) | $50,625 |
| Average | 95 (100.0%) | $57,772 |
Occupancy by Householder Income Bracket in Tiro
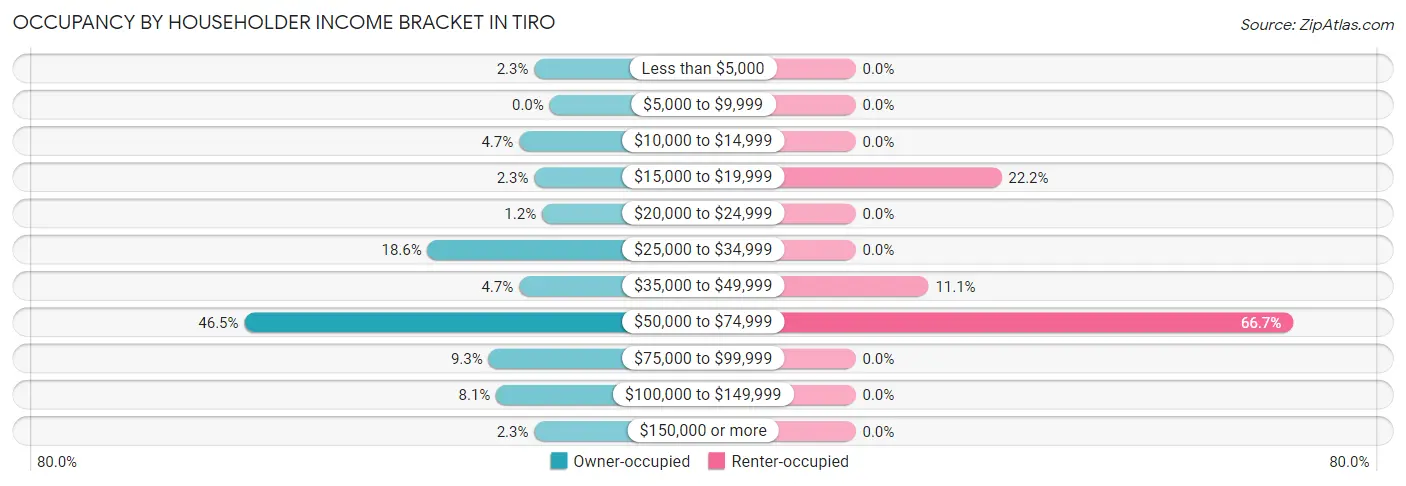
| Income Bracket | Owner-occupied | Renter-occupied |
| Less than $5,000 | 2 (2.3%) | 0 (0.0%) |
| $5,000 to $9,999 | 0 (0.0%) | 0 (0.0%) |
| $10,000 to $14,999 | 4 (4.6%) | 0 (0.0%) |
| $15,000 to $19,999 | 2 (2.3%) | 2 (22.2%) |
| $20,000 to $24,999 | 1 (1.2%) | 0 (0.0%) |
| $25,000 to $34,999 | 16 (18.6%) | 0 (0.0%) |
| $35,000 to $49,999 | 4 (4.6%) | 1 (11.1%) |
| $50,000 to $74,999 | 40 (46.5%) | 6 (66.7%) |
| $75,000 to $99,999 | 8 (9.3%) | 0 (0.0%) |
| $100,000 to $149,999 | 7 (8.1%) | 0 (0.0%) |
| $150,000 or more | 2 (2.3%) | 0 (0.0%) |
| Total | 86 (100.0%) | 9 (100.0%) |
Monthly Housing Cost Tiers in Tiro
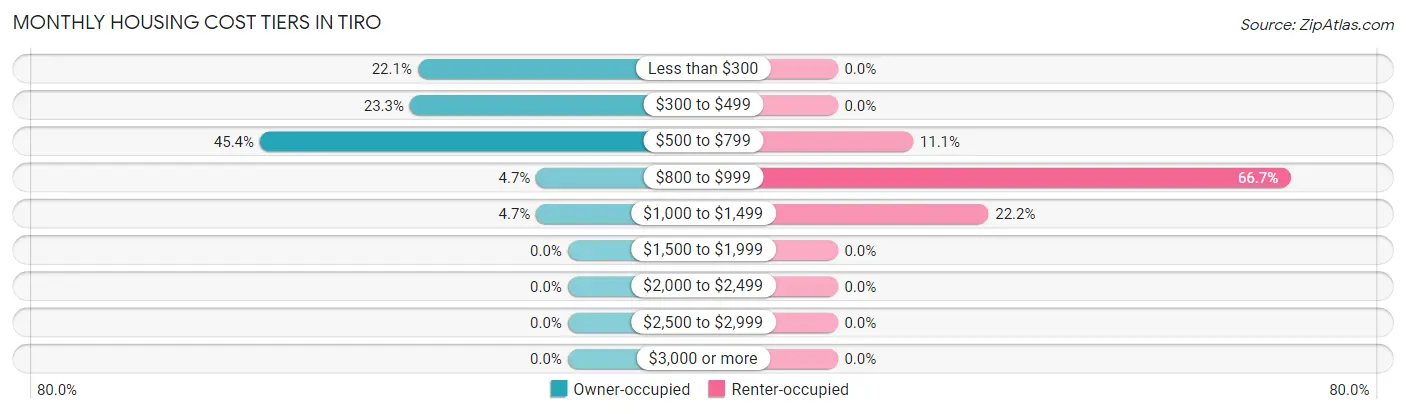
| Monthly Cost | Owner-occupied | Renter-occupied |
| Less than $300 | 19 (22.1%) | 0 (0.0%) |
| $300 to $499 | 20 (23.3%) | 0 (0.0%) |
| $500 to $799 | 39 (45.4%) | 1 (11.1%) |
| $800 to $999 | 4 (4.6%) | 6 (66.7%) |
| $1,000 to $1,499 | 4 (4.6%) | 2 (22.2%) |
| $1,500 to $1,999 | 0 (0.0%) | 0 (0.0%) |
| $2,000 to $2,499 | 0 (0.0%) | 0 (0.0%) |
| $2,500 to $2,999 | 0 (0.0%) | 0 (0.0%) |
| $3,000 or more | 0 (0.0%) | 0 (0.0%) |
| Total | 86 (100.0%) | 9 (100.0%) |
Physical Housing Characteristics in Tiro
Housing Structures in Tiro
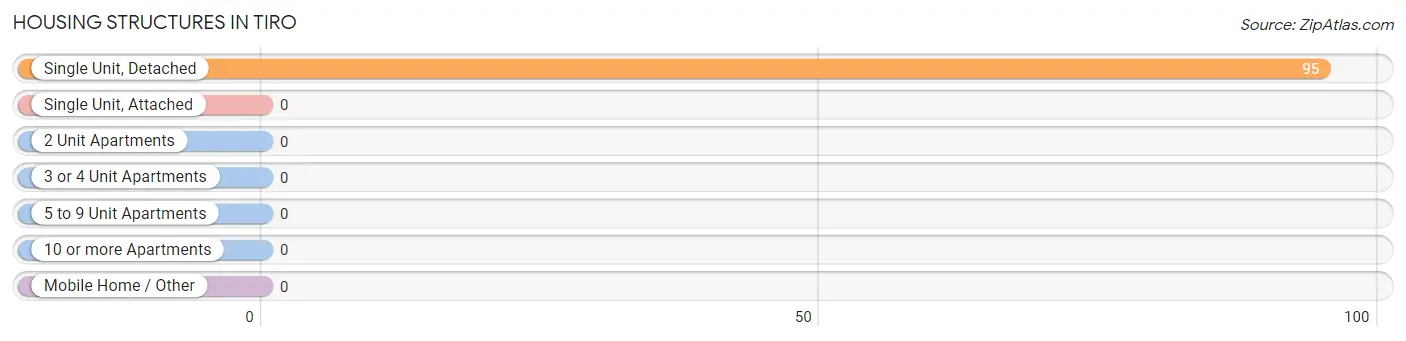
| Structure Type | # Housing Units | % Housing Units |
| Single Unit, Detached | 95 | 100.0% |
| Single Unit, Attached | 0 | 0.0% |
| 2 Unit Apartments | 0 | 0.0% |
| 3 or 4 Unit Apartments | 0 | 0.0% |
| 5 to 9 Unit Apartments | 0 | 0.0% |
| 10 or more Apartments | 0 | 0.0% |
| Mobile Home / Other | 0 | 0.0% |
| Total | 95 | 100.0% |
Housing Structures by Occupancy in Tiro
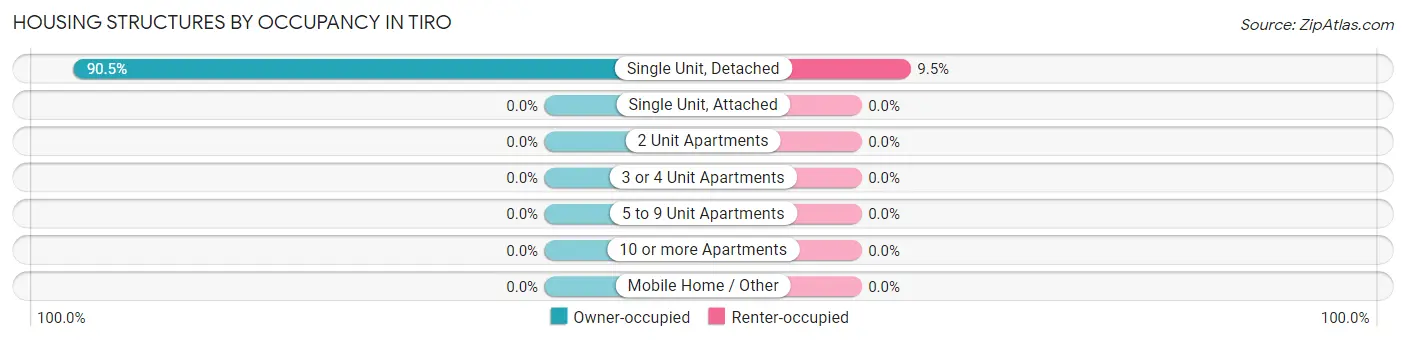
| Structure Type | Owner-occupied | Renter-occupied |
| Single Unit, Detached | 86 (90.5%) | 9 (9.5%) |
| Single Unit, Attached | 0 (0.0%) | 0 (0.0%) |
| 2 Unit Apartments | 0 (0.0%) | 0 (0.0%) |
| 3 or 4 Unit Apartments | 0 (0.0%) | 0 (0.0%) |
| 5 to 9 Unit Apartments | 0 (0.0%) | 0 (0.0%) |
| 10 or more Apartments | 0 (0.0%) | 0 (0.0%) |
| Mobile Home / Other | 0 (0.0%) | 0 (0.0%) |
| Total | 86 (90.5%) | 9 (9.5%) |
Housing Structures by Number of Rooms in Tiro
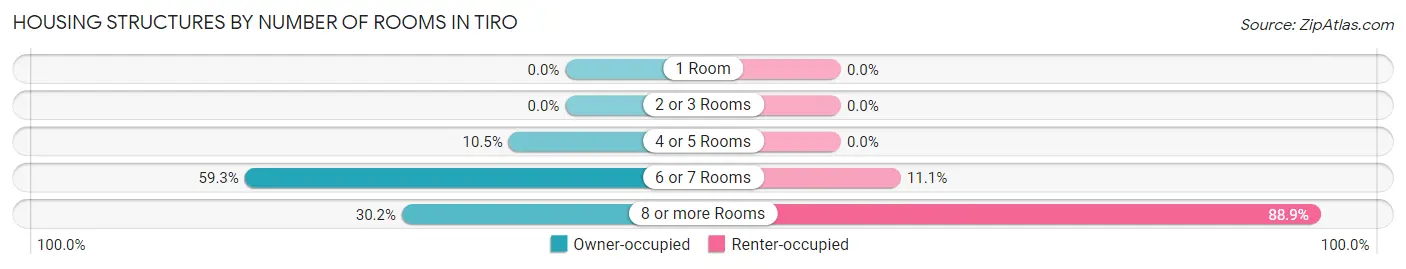
| Number of Rooms | Owner-occupied | Renter-occupied |
| 1 Room | 0 (0.0%) | 0 (0.0%) |
| 2 or 3 Rooms | 0 (0.0%) | 0 (0.0%) |
| 4 or 5 Rooms | 9 (10.5%) | 0 (0.0%) |
| 6 or 7 Rooms | 51 (59.3%) | 1 (11.1%) |
| 8 or more Rooms | 26 (30.2%) | 8 (88.9%) |
| Total | 86 (100.0%) | 9 (100.0%) |
Housing Structure by Heating Type in Tiro
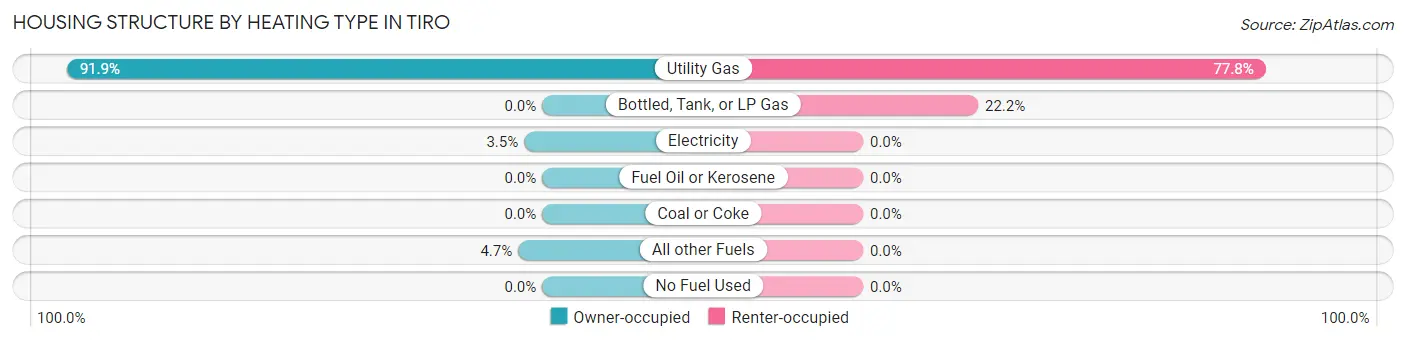
| Heating Type | Owner-occupied | Renter-occupied |
| Utility Gas | 79 (91.9%) | 7 (77.8%) |
| Bottled, Tank, or LP Gas | 0 (0.0%) | 2 (22.2%) |
| Electricity | 3 (3.5%) | 0 (0.0%) |
| Fuel Oil or Kerosene | 0 (0.0%) | 0 (0.0%) |
| Coal or Coke | 0 (0.0%) | 0 (0.0%) |
| All other Fuels | 4 (4.6%) | 0 (0.0%) |
| No Fuel Used | 0 (0.0%) | 0 (0.0%) |
| Total | 86 (100.0%) | 9 (100.0%) |
Household Vehicle Usage in Tiro
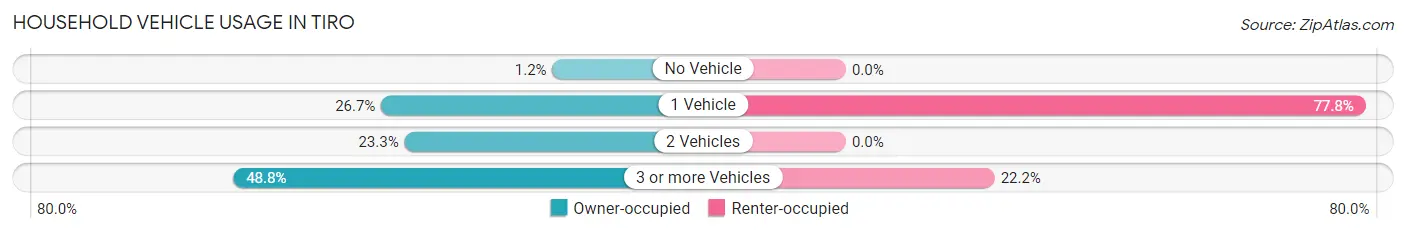
| Vehicles per Household | Owner-occupied | Renter-occupied |
| No Vehicle | 1 (1.2%) | 0 (0.0%) |
| 1 Vehicle | 23 (26.7%) | 7 (77.8%) |
| 2 Vehicles | 20 (23.3%) | 0 (0.0%) |
| 3 or more Vehicles | 42 (48.8%) | 2 (22.2%) |
| Total | 86 (100.0%) | 9 (100.0%) |
Real Estate & Mortgages in Tiro
Real Estate and Mortgage Overview in Tiro
| Characteristic | Without Mortgage | With Mortgage |
| Housing Units | 48 | 38 |
| Median Property Value | $38,300 | $57,000 |
| Median Household Income | $48,750 | $0 |
| Monthly Housing Costs | $328 | $0 |
| Real Estate Taxes | $543 | $4 |
Property Value by Mortgage Status in Tiro
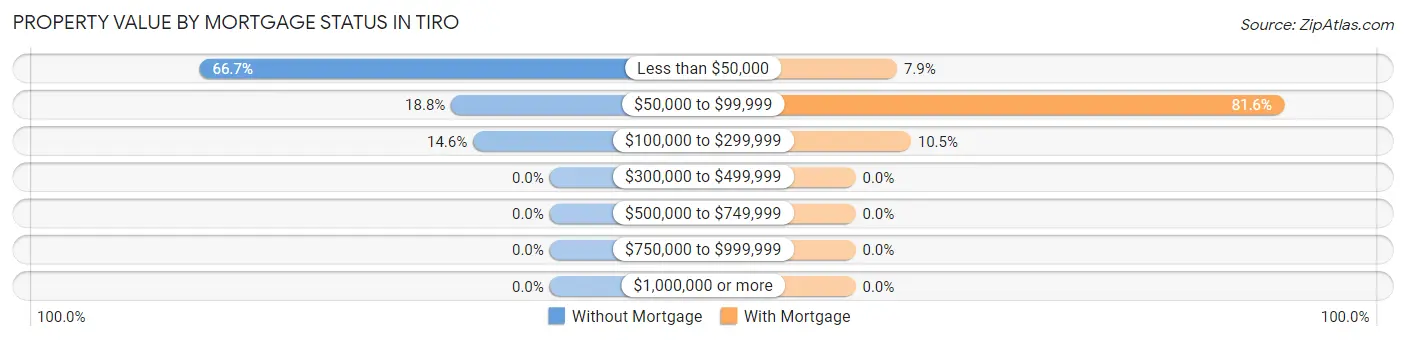
| Property Value | Without Mortgage | With Mortgage |
| Less than $50,000 | 32 (66.7%) | 3 (7.9%) |
| $50,000 to $99,999 | 9 (18.8%) | 31 (81.6%) |
| $100,000 to $299,999 | 7 (14.6%) | 4 (10.5%) |
| $300,000 to $499,999 | 0 (0.0%) | 0 (0.0%) |
| $500,000 to $749,999 | 0 (0.0%) | 0 (0.0%) |
| $750,000 to $999,999 | 0 (0.0%) | 0 (0.0%) |
| $1,000,000 or more | 0 (0.0%) | 0 (0.0%) |
| Total | 48 (100.0%) | 38 (100.0%) |
Household Income by Mortgage Status in Tiro
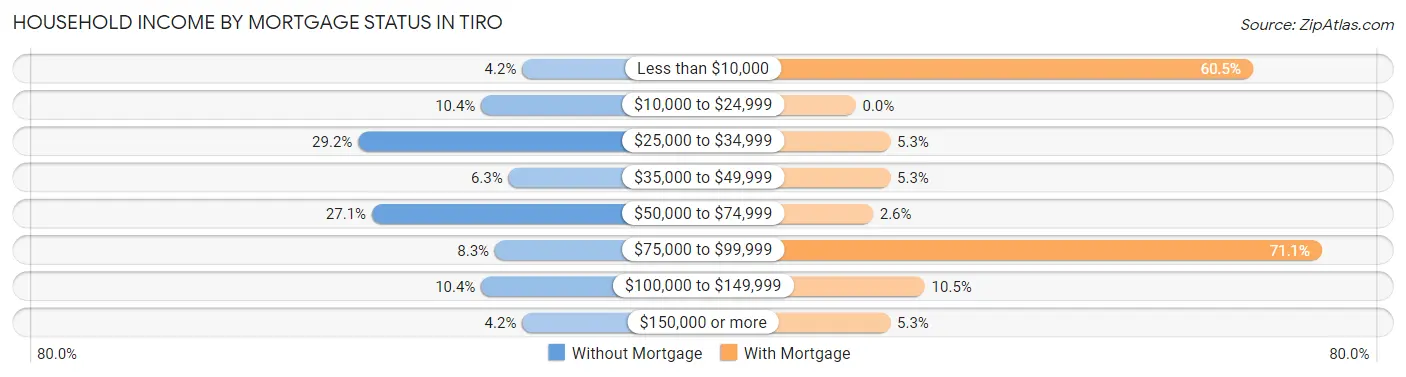
| Household Income | Without Mortgage | With Mortgage |
| Less than $10,000 | 2 (4.2%) | 23 (60.5%) |
| $10,000 to $24,999 | 5 (10.4%) | 0 (0.0%) |
| $25,000 to $34,999 | 14 (29.2%) | 2 (5.3%) |
| $35,000 to $49,999 | 3 (6.2%) | 2 (5.3%) |
| $50,000 to $74,999 | 13 (27.1%) | 1 (2.6%) |
| $75,000 to $99,999 | 4 (8.3%) | 27 (71.1%) |
| $100,000 to $149,999 | 5 (10.4%) | 4 (10.5%) |
| $150,000 or more | 2 (4.2%) | 2 (5.3%) |
| Total | 48 (100.0%) | 38 (100.0%) |
Property Value to Household Income Ratio in Tiro
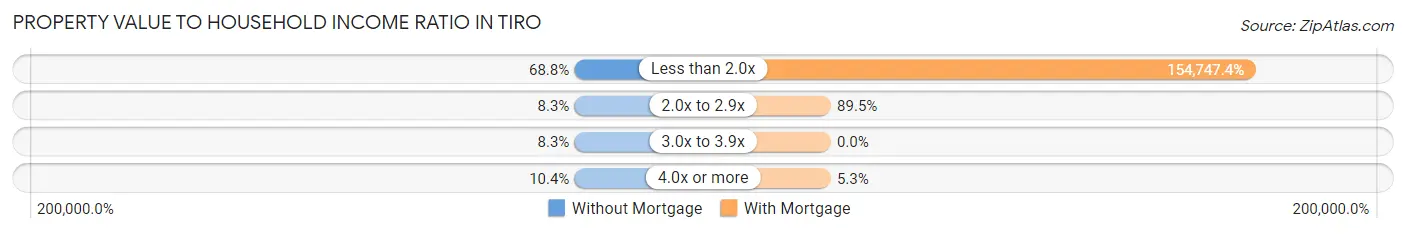
| Value-to-Income Ratio | Without Mortgage | With Mortgage |
| Less than 2.0x | 33 (68.8%) | 58,804 (154,747.4%) |
| 2.0x to 2.9x | 4 (8.3%) | 34 (89.5%) |
| 3.0x to 3.9x | 4 (8.3%) | 0 (0.0%) |
| 4.0x or more | 5 (10.4%) | 2 (5.3%) |
| Total | 48 (100.0%) | 38 (100.0%) |
Real Estate Taxes by Mortgage Status in Tiro
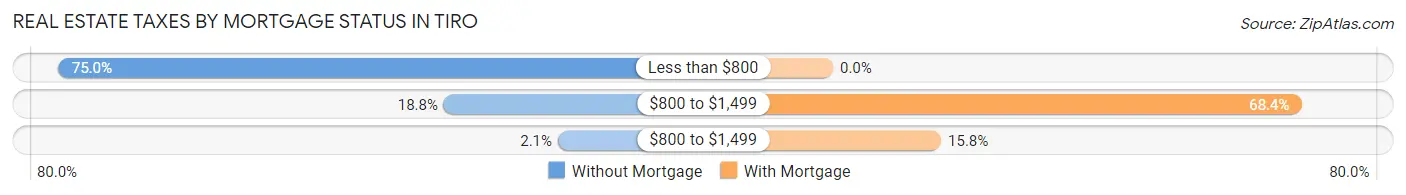
| Property Taxes | Without Mortgage | With Mortgage |
| Less than $800 | 36 (75.0%) | 0 (0.0%) |
| $800 to $1,499 | 9 (18.8%) | 26 (68.4%) |
| $800 to $1,499 | 1 (2.1%) | 6 (15.8%) |
| Total | 48 (100.0%) | 38 (100.0%) |
Health & Disability in Tiro
Health Insurance Coverage by Age in Tiro
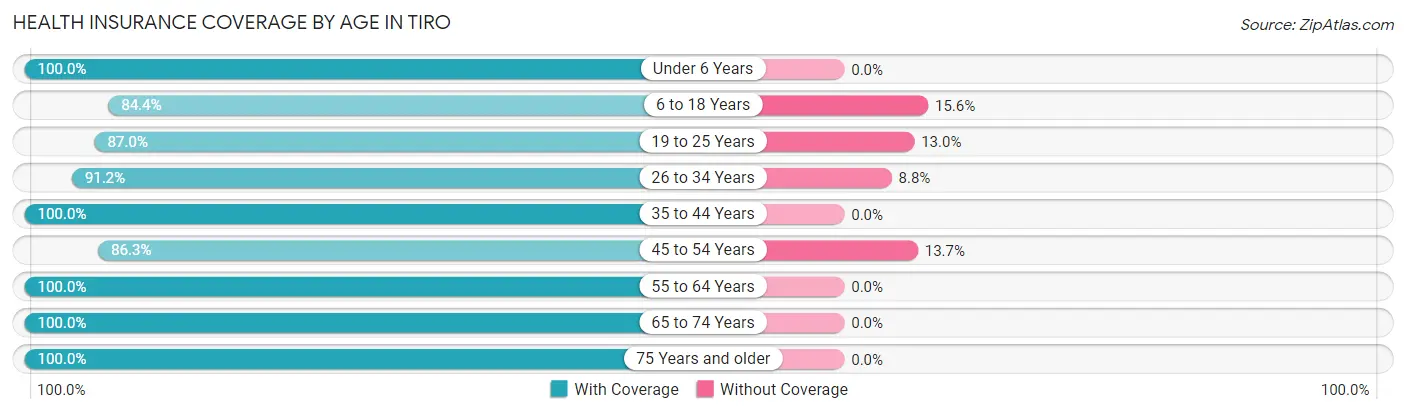
| Age Bracket | With Coverage | Without Coverage |
| Under 6 Years | 25 (100.0%) | 0 (0.0%) |
| 6 to 18 Years | 27 (84.4%) | 5 (15.6%) |
| 19 to 25 Years | 20 (87.0%) | 3 (13.0%) |
| 26 to 34 Years | 31 (91.2%) | 3 (8.8%) |
| 35 to 44 Years | 16 (100.0%) | 0 (0.0%) |
| 45 to 54 Years | 63 (86.3%) | 10 (13.7%) |
| 55 to 64 Years | 9 (100.0%) | 0 (0.0%) |
| 65 to 74 Years | 15 (100.0%) | 0 (0.0%) |
| 75 Years and older | 15 (100.0%) | 0 (0.0%) |
| Total | 221 (91.3%) | 21 (8.7%) |
Health Insurance Coverage by Citizenship Status in Tiro
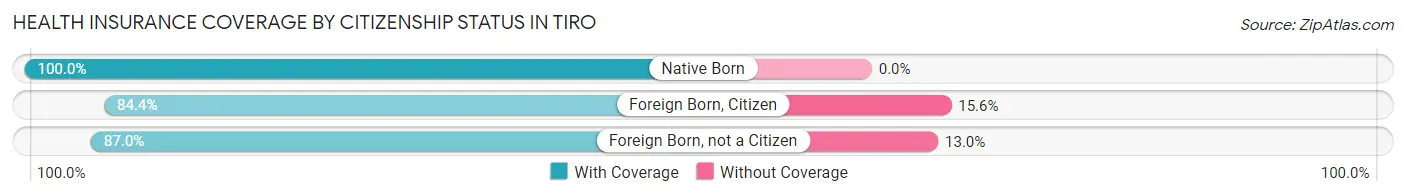
| Citizenship Status | With Coverage | Without Coverage |
| Native Born | 25 (100.0%) | 0 (0.0%) |
| Foreign Born, Citizen | 27 (84.4%) | 5 (15.6%) |
| Foreign Born, not a Citizen | 20 (87.0%) | 3 (13.0%) |
Health Insurance Coverage by Household Income in Tiro
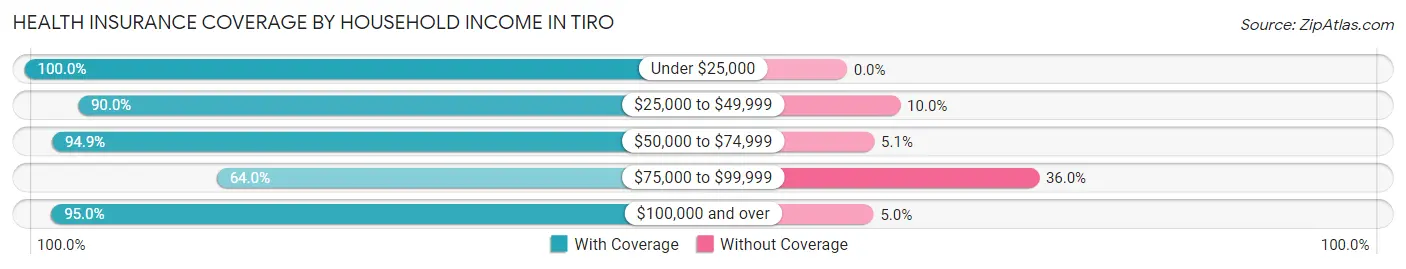
| Household Income | With Coverage | Without Coverage |
| Under $25,000 | 20 (100.0%) | 0 (0.0%) |
| $25,000 to $49,999 | 36 (90.0%) | 4 (10.0%) |
| $50,000 to $74,999 | 111 (94.9%) | 6 (5.1%) |
| $75,000 to $99,999 | 16 (64.0%) | 9 (36.0%) |
| $100,000 and over | 38 (95.0%) | 2 (5.0%) |
Public vs Private Health Insurance Coverage by Age in Tiro
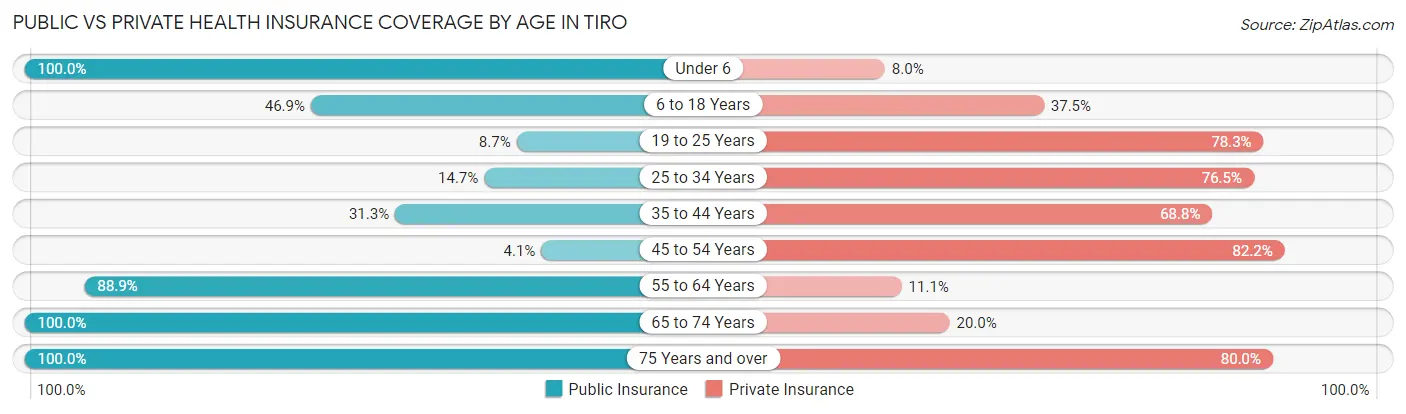
| Age Bracket | Public Insurance | Private Insurance |
| Under 6 | 25 (100.0%) | 2 (8.0%) |
| 6 to 18 Years | 15 (46.9%) | 12 (37.5%) |
| 19 to 25 Years | 2 (8.7%) | 18 (78.3%) |
| 25 to 34 Years | 5 (14.7%) | 26 (76.5%) |
| 35 to 44 Years | 5 (31.2%) | 11 (68.8%) |
| 45 to 54 Years | 3 (4.1%) | 60 (82.2%) |
| 55 to 64 Years | 8 (88.9%) | 1 (11.1%) |
| 65 to 74 Years | 15 (100.0%) | 3 (20.0%) |
| 75 Years and over | 15 (100.0%) | 12 (80.0%) |
| Total | 93 (38.4%) | 145 (59.9%) |
Disability Status by Sex by Age in Tiro
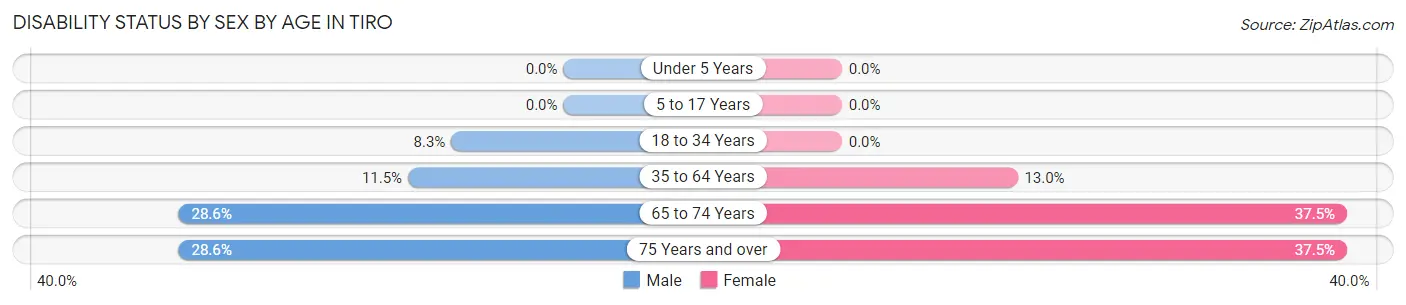
| Age Bracket | Male | Female |
| Under 5 Years | 0 (0.0%) | 0 (0.0%) |
| 5 to 17 Years | 0 (0.0%) | 0 (0.0%) |
| 18 to 34 Years | 3 (8.3%) | 0 (0.0%) |
| 35 to 64 Years | 6 (11.5%) | 6 (13.0%) |
| 65 to 74 Years | 2 (28.6%) | 3 (37.5%) |
| 75 Years and over | 2 (28.6%) | 3 (37.5%) |
Disability Class by Sex by Age in Tiro
Disability Class: Hearing Difficulty
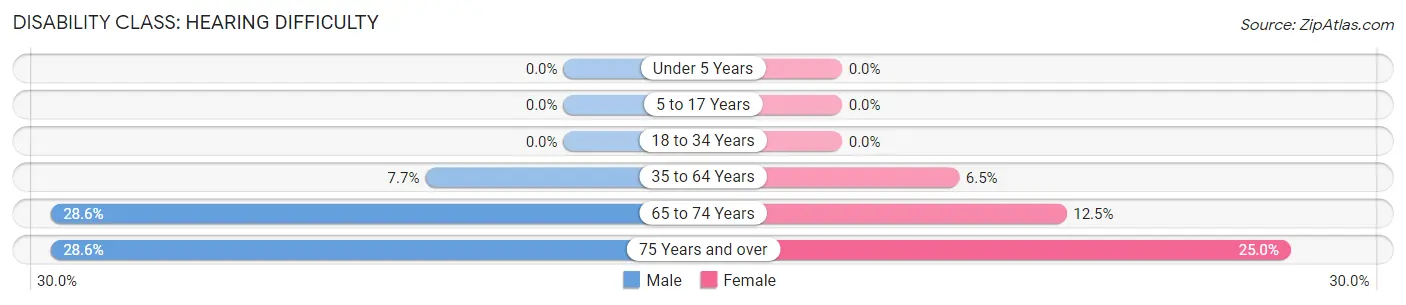
| Age Bracket | Male | Female |
| Under 5 Years | 0 (0.0%) | 0 (0.0%) |
| 5 to 17 Years | 0 (0.0%) | 0 (0.0%) |
| 18 to 34 Years | 0 (0.0%) | 0 (0.0%) |
| 35 to 64 Years | 4 (7.7%) | 3 (6.5%) |
| 65 to 74 Years | 2 (28.6%) | 1 (12.5%) |
| 75 Years and over | 2 (28.6%) | 2 (25.0%) |
Disability Class: Vision Difficulty
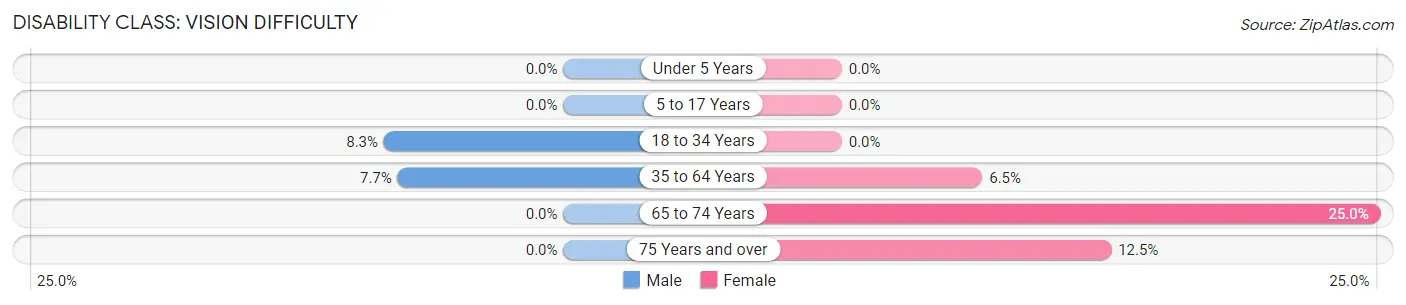
| Age Bracket | Male | Female |
| Under 5 Years | 0 (0.0%) | 0 (0.0%) |
| 5 to 17 Years | 0 (0.0%) | 0 (0.0%) |
| 18 to 34 Years | 3 (8.3%) | 0 (0.0%) |
| 35 to 64 Years | 4 (7.7%) | 3 (6.5%) |
| 65 to 74 Years | 0 (0.0%) | 2 (25.0%) |
| 75 Years and over | 0 (0.0%) | 1 (12.5%) |
Disability Class: Cognitive Difficulty
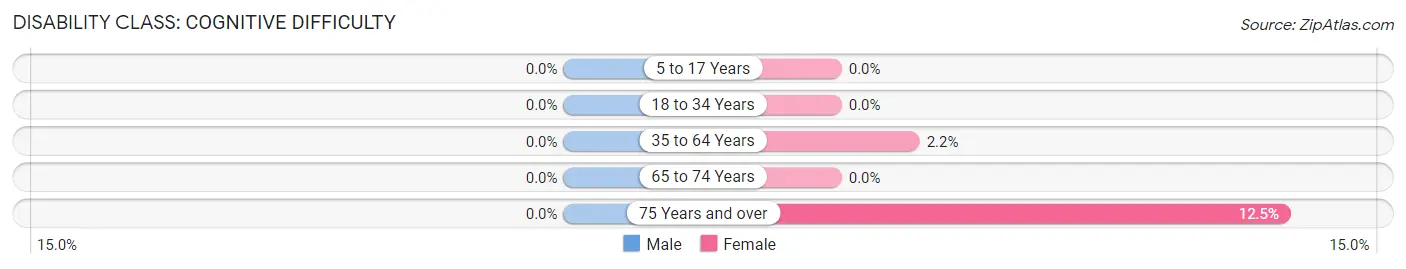
| Age Bracket | Male | Female |
| 5 to 17 Years | 0 (0.0%) | 0 (0.0%) |
| 18 to 34 Years | 0 (0.0%) | 0 (0.0%) |
| 35 to 64 Years | 0 (0.0%) | 1 (2.2%) |
| 65 to 74 Years | 0 (0.0%) | 0 (0.0%) |
| 75 Years and over | 0 (0.0%) | 1 (12.5%) |
Disability Class: Ambulatory Difficulty
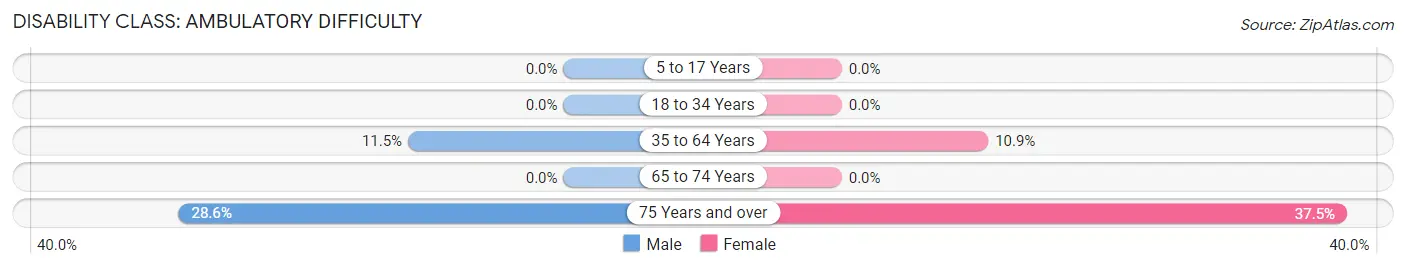
| Age Bracket | Male | Female |
| 5 to 17 Years | 0 (0.0%) | 0 (0.0%) |
| 18 to 34 Years | 0 (0.0%) | 0 (0.0%) |
| 35 to 64 Years | 6 (11.5%) | 5 (10.9%) |
| 65 to 74 Years | 0 (0.0%) | 0 (0.0%) |
| 75 Years and over | 2 (28.6%) | 3 (37.5%) |
Disability Class: Self-Care Difficulty
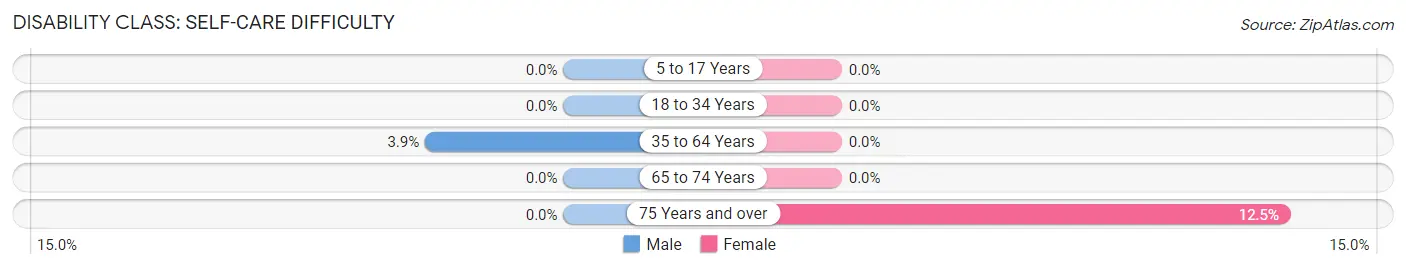
| Age Bracket | Male | Female |
| 5 to 17 Years | 0 (0.0%) | 0 (0.0%) |
| 18 to 34 Years | 0 (0.0%) | 0 (0.0%) |
| 35 to 64 Years | 2 (3.8%) | 0 (0.0%) |
| 65 to 74 Years | 0 (0.0%) | 0 (0.0%) |
| 75 Years and over | 0 (0.0%) | 1 (12.5%) |
Technology Access in Tiro
Computing Device Access in Tiro
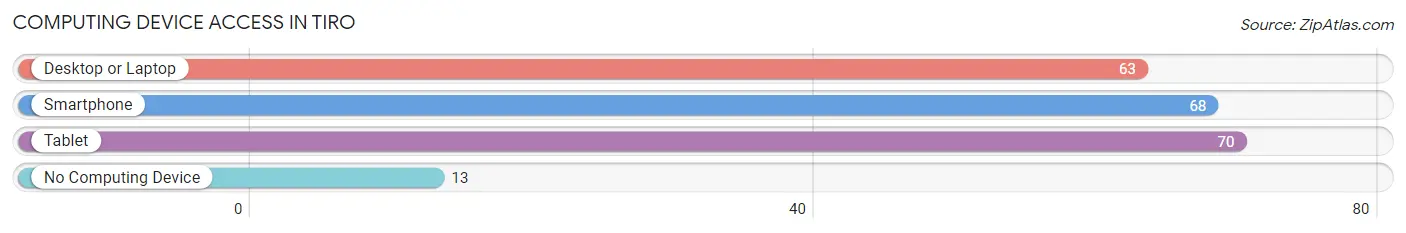
| Device Type | # Households | % Households |
| Desktop or Laptop | 63 | 66.3% |
| Smartphone | 68 | 71.6% |
| Tablet | 70 | 73.7% |
| No Computing Device | 13 | 13.7% |
| Total | 95 | 100.0% |
Internet Access in Tiro
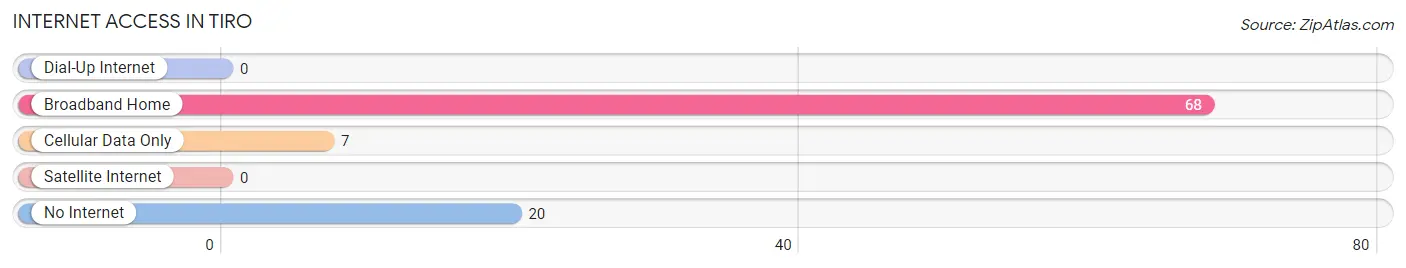
| Internet Type | # Households | % Households |
| Dial-Up Internet | 0 | 0.0% |
| Broadband Home | 68 | 71.6% |
| Cellular Data Only | 7 | 7.4% |
| Satellite Internet | 0 | 0.0% |
| No Internet | 20 | 21.0% |
| Total | 95 | 100.0% |
Tiro Summary
Tiro is a small village located in Crawford County, Ohio. It is situated on the banks of the Sandusky River, approximately 10 miles south of Bucyrus. The village has a population of approximately 500 people and is part of the Bucyrus Micropolitan Statistical Area.
History
Tiro was founded in 1817 by a group of settlers from Pennsylvania. The village was named after the Tiro Indians, a Native American tribe that once lived in the area. The first settlers were mostly farmers and the village grew slowly over the years. In 1837, the village was incorporated and the first post office was established.
In the late 19th century, Tiro became a popular tourist destination due to its proximity to the Sandusky River. The village was home to several resorts and hotels, as well as a number of restaurants and stores.
In the early 20th century, Tiro experienced a period of growth and development. The village was connected to the outside world by the Ohio Central Railroad in 1906. This allowed for the transportation of goods and people to and from the village.
In the 1950s, Tiro experienced a decline in population as many of its residents moved away in search of better job opportunities. The village has since experienced a slow but steady population growth.
Geography
Tiro is located in the western part of Crawford County, Ohio. It is situated on the banks of the Sandusky River, approximately 10 miles south of Bucyrus. The village is surrounded by rolling hills and farmland. The climate in Tiro is humid continental, with hot summers and cold winters.
Economy
Tiro’s economy is largely based on agriculture. The village is home to several farms, which produce a variety of crops, including corn, soybeans, and wheat. The village also has a few small businesses, including a grocery store, a hardware store, and a few restaurants.
Demographics
As of the 2010 census, Tiro had a population of 498 people. The racial makeup of the village was 97.6% White, 0.2% African American, 0.2% Native American, 0.2% Asian, 0.2% from other races, and 1.6% from two or more races. The median household income was $37,500 and the median family income was $45,000.
Tiro is a small village with a rich history and a strong sense of community. The village is home to a diverse population and offers a variety of amenities and services. The village is a great place to live, work, and raise a family.
Common Questions
What is Per Capita Income in Tiro?
Per Capita income in Tiro is $21,360.
What is the Median Family Income in Tiro?
Median Family Income in Tiro is $58,859.
What is the Median Household income in Tiro?
Median Household Income in Tiro is $57,772.
What is Income or Wage Gap in Tiro?
Income or Wage Gap in Tiro is 10.3%.
Women in Tiro earn 89.7 cents for every dollar earned by a man.
What is Inequality or Gini Index in Tiro?
Inequality or Gini Index in Tiro is 0.28.
What is the Total Population of Tiro?
Total Population of Tiro is 242.
What is the Total Male Population of Tiro?
Total Male Population of Tiro is 119.
What is the Total Female Population of Tiro?
Total Female Population of Tiro is 123.
What is the Ratio of Males per 100 Females in Tiro?
There are 96.75 Males per 100 Females in Tiro.
What is the Ratio of Females per 100 Males in Tiro?
There are 103.36 Females per 100 Males in Tiro.
What is the Median Population Age in Tiro?
Median Population Age in Tiro is 40.3 Years.
What is the Average Family Size in Tiro
Average Family Size in Tiro is 2.9 People.
What is the Average Household Size in Tiro
Average Household Size in Tiro is 2.5 People.
How Large is the Labor Force in Tiro?
There are 126 People in the Labor Forcein in Tiro.
What is the Percentage of People in the Labor Force in Tiro?
67.4% of People are in the Labor Force in Tiro.
What is the Unemployment Rate in Tiro?
Unemployment Rate in Tiro is 5.6%.