Sycamore, OH Map & Demographics
Sycamore Map
Sycamore Overview
$29,731
PER CAPITA INCOME
$68,542
AVG FAMILY INCOME
$58,309
AVG HOUSEHOLD INCOME
52.8%
WAGE / INCOME GAP [ % ]
47.2¢/ $1
WAGE / INCOME GAP [ $ ]
0.35
INEQUALITY / GINI INDEX
733
TOTAL POPULATION
341
MALE POPULATION
392
FEMALE POPULATION
86.99
MALES / 100 FEMALES
114.96
FEMALES / 100 MALES
50.4
MEDIAN AGE
2.6
AVG FAMILY SIZE
2.2
AVG HOUSEHOLD SIZE
412
LABOR FORCE [ PEOPLE ]
65.5%
PERCENT IN LABOR FORCE
3.4%
UNEMPLOYMENT RATE
Sycamore Zip Codes
Sycamore Area Codes
Income in Sycamore
Income Overview in Sycamore
Per Capita Income in Sycamore is $29,731, while median incomes of families and households are $68,542 and $58,309 respectively.
| Characteristic | Number | Measure |
| Per Capita Income | 733 | $29,731 |
| Median Family Income | 225 | $68,542 |
| Mean Family Income | 225 | $70,933 |
| Median Household Income | 339 | $58,309 |
| Mean Household Income | 339 | $62,735 |
| Income Deficit | 225 | $0 |
| Wage / Income Gap (%) | 733 | 52.75% |
| Wage / Income Gap ($) | 733 | 47.25¢ per $1 |
| Gini / Inequality Index | 733 | 0.35 |
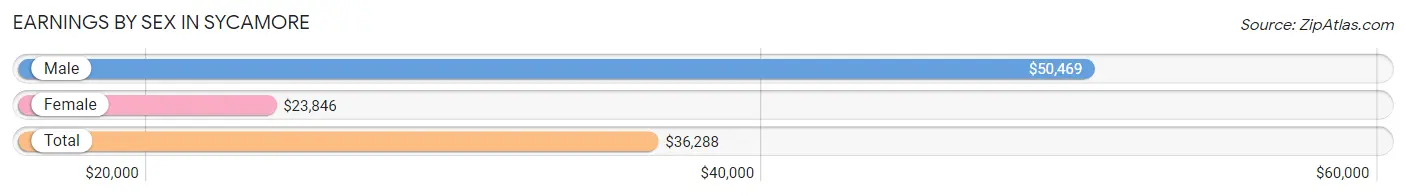
Earnings by Sex in Sycamore
Average Earnings in Sycamore are $36,288, $50,469 for men and $23,846 for women, a difference of 52.7%.
| Sex | Number | Average Earnings |
| Male | 212 (50.7%) | $50,469 |
| Female | 206 (49.3%) | $23,846 |
| Total | 418 (100.0%) | $36,288 |
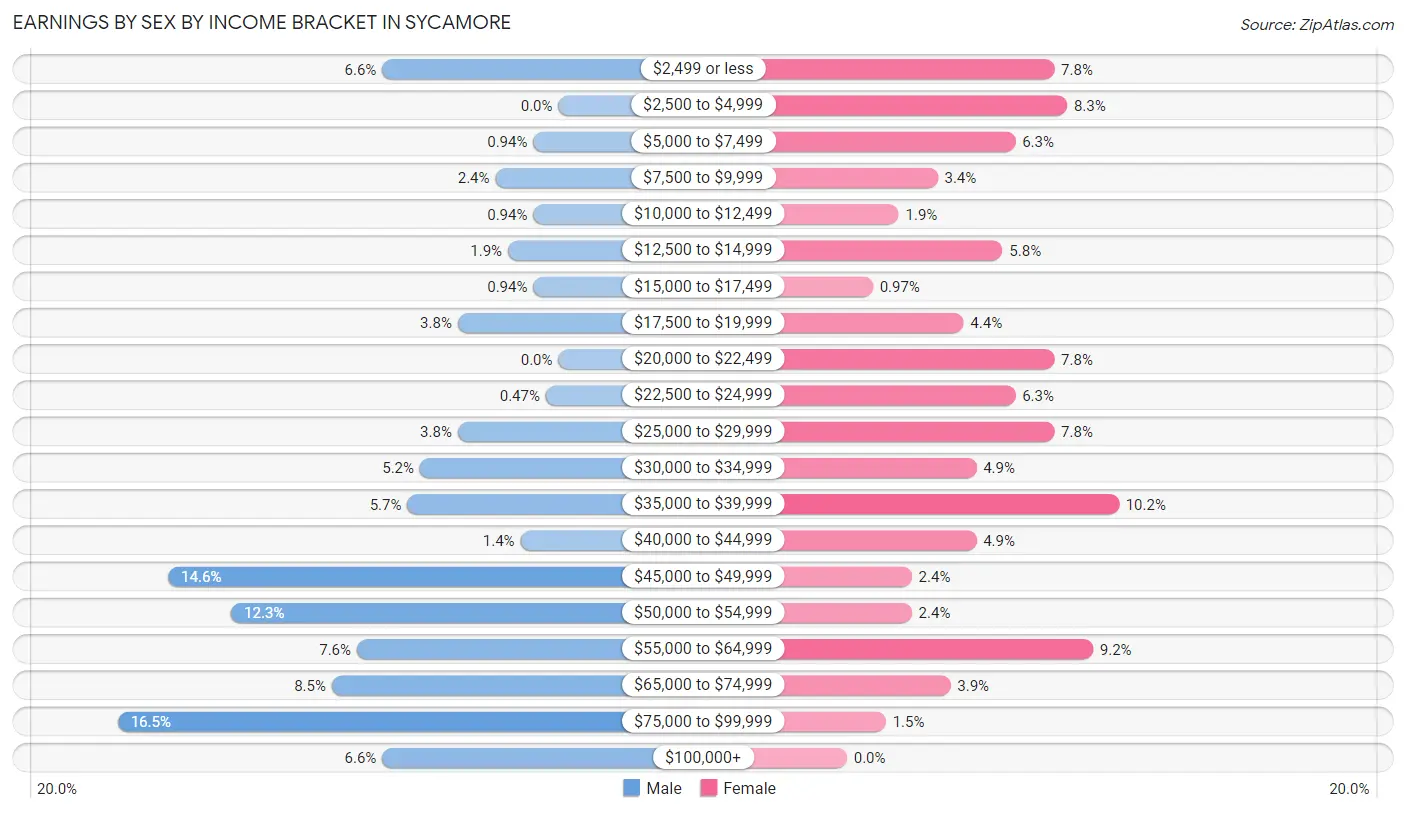
Earnings by Sex by Income Bracket in Sycamore
The most common earnings brackets in Sycamore are $75,000 to $99,999 for men (35 | 16.5%) and $35,000 to $39,999 for women (21 | 10.2%).
| Income | Male | Female |
| $2,499 or less | 14 (6.6%) | 16 (7.8%) |
| $2,500 to $4,999 | 0 (0.0%) | 17 (8.3%) |
| $5,000 to $7,499 | 2 (0.9%) | 13 (6.3%) |
| $7,500 to $9,999 | 5 (2.4%) | 7 (3.4%) |
| $10,000 to $12,499 | 2 (0.9%) | 4 (1.9%) |
| $12,500 to $14,999 | 4 (1.9%) | 12 (5.8%) |
| $15,000 to $17,499 | 2 (0.9%) | 2 (1.0%) |
| $17,500 to $19,999 | 8 (3.8%) | 9 (4.4%) |
| $20,000 to $22,499 | 0 (0.0%) | 16 (7.8%) |
| $22,500 to $24,999 | 1 (0.5%) | 13 (6.3%) |
| $25,000 to $29,999 | 8 (3.8%) | 16 (7.8%) |
| $30,000 to $34,999 | 11 (5.2%) | 10 (4.9%) |
| $35,000 to $39,999 | 12 (5.7%) | 21 (10.2%) |
| $40,000 to $44,999 | 3 (1.4%) | 10 (4.9%) |
| $45,000 to $49,999 | 31 (14.6%) | 5 (2.4%) |
| $50,000 to $54,999 | 26 (12.3%) | 5 (2.4%) |
| $55,000 to $64,999 | 16 (7.5%) | 19 (9.2%) |
| $65,000 to $74,999 | 18 (8.5%) | 8 (3.9%) |
| $75,000 to $99,999 | 35 (16.5%) | 3 (1.5%) |
| $100,000+ | 14 (6.6%) | 0 (0.0%) |
| Total | 212 (100.0%) | 206 (100.0%) |
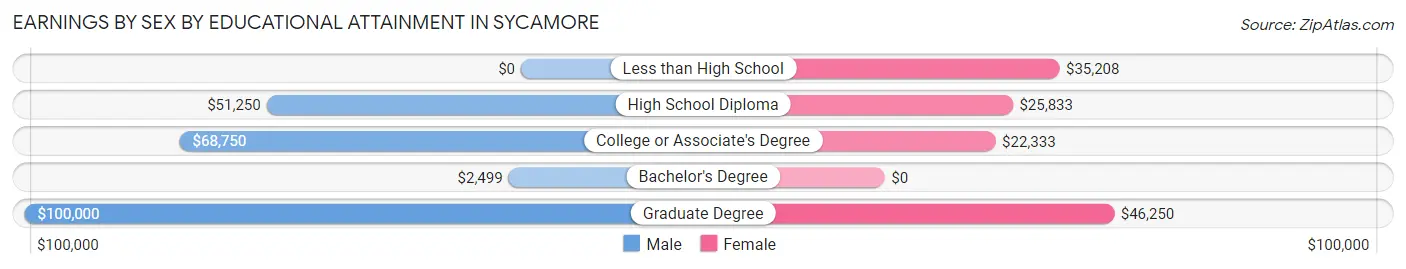
Earnings by Sex by Educational Attainment in Sycamore
Average earnings in Sycamore are $52,344 for men and $27,917 for women, a difference of 46.7%. Men with an educational attainment of graduate degree enjoy the highest average annual earnings of $100,000, while those with bachelor's degree education earn the least with $2,499. Women with an educational attainment of graduate degree earn the most with the average annual earnings of $46,250, while those with college or associate's degree education have the smallest earnings of $22,333.
| Educational Attainment | Male Income | Female Income |
| Less than High School | - | - |
| High School Diploma | $51,250 | $25,833 |
| College or Associate's Degree | $68,750 | $22,333 |
| Bachelor's Degree | $2,499 | $0 |
| Graduate Degree | $100,000 | $46,250 |
| Total | $52,344 | $27,917 |
Family Income in Sycamore
Family Income Brackets in Sycamore
According to the Sycamore family income data, there are 57 families falling into the $75,000 to $99,999 income range, which is the most common income bracket and makes up 25.3% of all families.
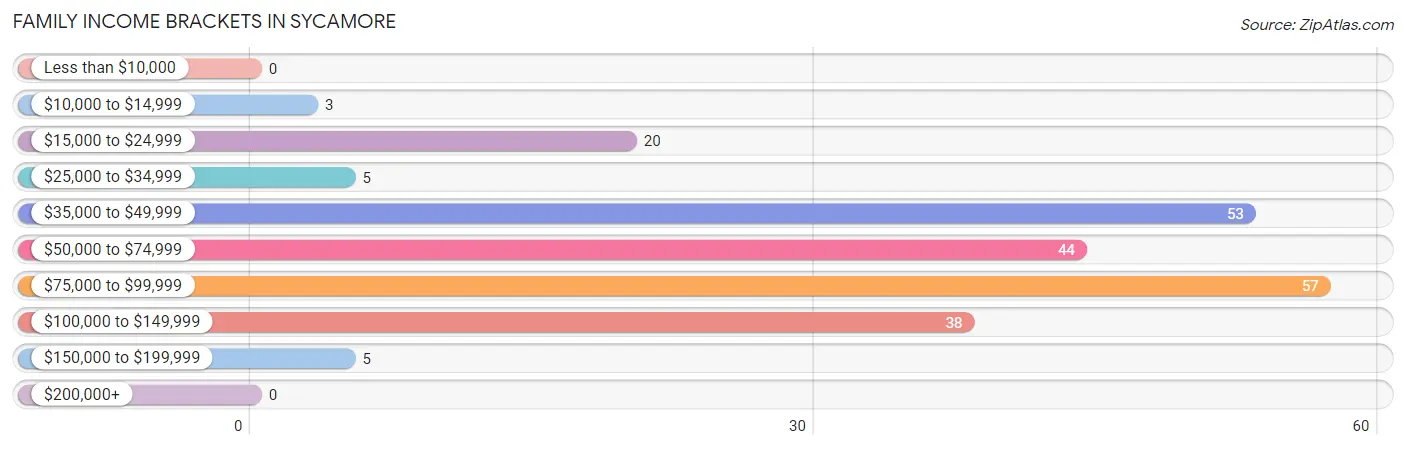
| Income Bracket | # Families | % Families |
| Less than $10,000 | 0 | 0.0% |
| $10,000 to $14,999 | 3 | 1.3% |
| $15,000 to $24,999 | 20 | 8.9% |
| $25,000 to $34,999 | 5 | 2.2% |
| $35,000 to $49,999 | 53 | 23.6% |
| $50,000 to $74,999 | 44 | 19.6% |
| $75,000 to $99,999 | 57 | 25.3% |
| $100,000 to $149,999 | 38 | 16.9% |
| $150,000 to $199,999 | 5 | 2.2% |
| $200,000+ | 0 | 0.0% |
Family Income by Famaliy Size in Sycamore
5-person families (5 | 2.2%) account for the highest median family income in Sycamore with $112,917 per family, while 2-person families (142 | 63.1%) have the highest median income of $29,250 per family member.
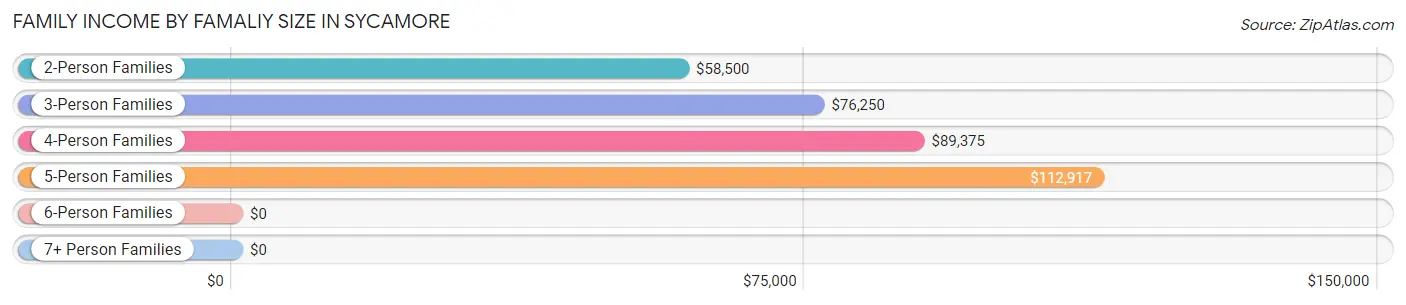
| Income Bracket | # Families | Median Income |
| 2-Person Families | 142 (63.1%) | $58,500 |
| 3-Person Families | 56 (24.9%) | $76,250 |
| 4-Person Families | 20 (8.9%) | $89,375 |
| 5-Person Families | 5 (2.2%) | $112,917 |
| 6-Person Families | 2 (0.9%) | $0 |
| 7+ Person Families | 0 (0.0%) | $0 |
| Total | 225 (100.0%) | $68,542 |
Family Income by Number of Earners in Sycamore
The median family income in Sycamore is $68,542, with families comprising 3+ earners (19) having the highest median family income of $133,750, while families with no earners (44) have the lowest median family income of $36,000, accounting for 8.4% and 19.6% of families, respectively.
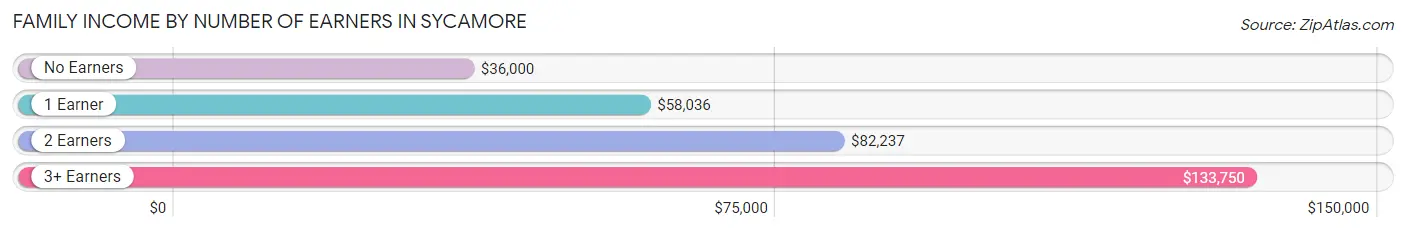
| Number of Earners | # Families | Median Income |
| No Earners | 44 (19.6%) | $36,000 |
| 1 Earner | 68 (30.2%) | $58,036 |
| 2 Earners | 94 (41.8%) | $82,237 |
| 3+ Earners | 19 (8.4%) | $133,750 |
| Total | 225 (100.0%) | $68,542 |
Household Income in Sycamore
Household Income Brackets in Sycamore
With 73 households falling in the category, the $75,000 to $99,999 income range is the most frequent in Sycamore, accounting for 21.5% of all households.
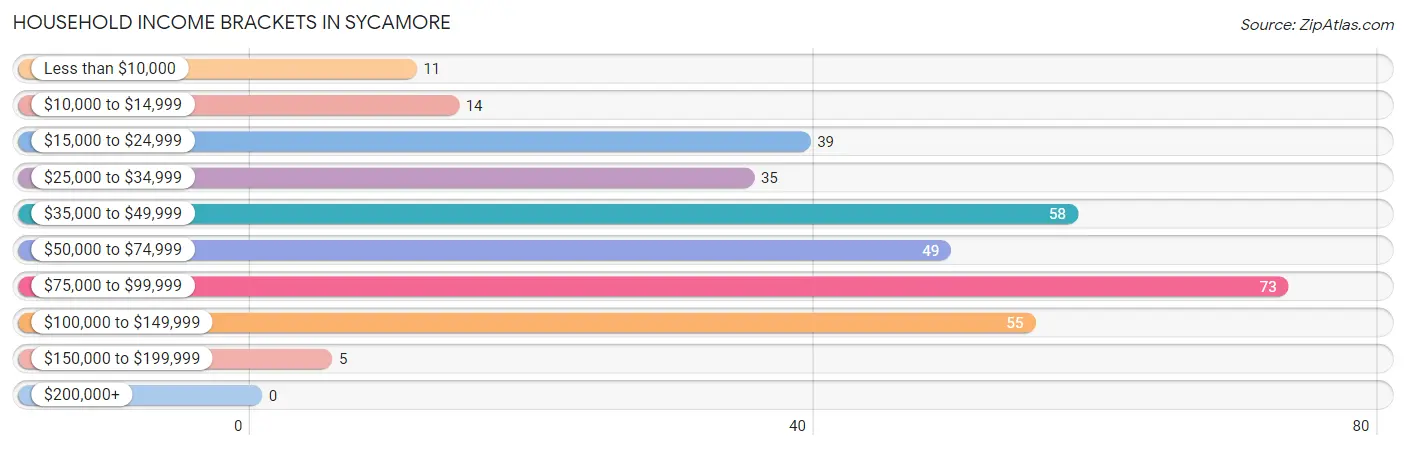
| Income Bracket | # Households | % Households |
| Less than $10,000 | 11 | 3.2% |
| $10,000 to $14,999 | 14 | 4.1% |
| $15,000 to $24,999 | 39 | 11.5% |
| $25,000 to $34,999 | 35 | 10.3% |
| $35,000 to $49,999 | 58 | 17.1% |
| $50,000 to $74,999 | 49 | 14.5% |
| $75,000 to $99,999 | 73 | 21.5% |
| $100,000 to $149,999 | 55 | 16.2% |
| $150,000 to $199,999 | 5 | 1.5% |
| $200,000+ | 0 | 0.0% |
Household Income by Householder Age in Sycamore
The median household income in Sycamore is $58,309, with the highest median household income of $80,461 found in the 45 to 64 years age bracket for the primary householder. A total of 143 households (42.2%) fall into this category. Meanwhile, the 15 to 24 years age bracket for the primary householder has the lowest median household income of $0, with 11 households (3.2%) in this group.
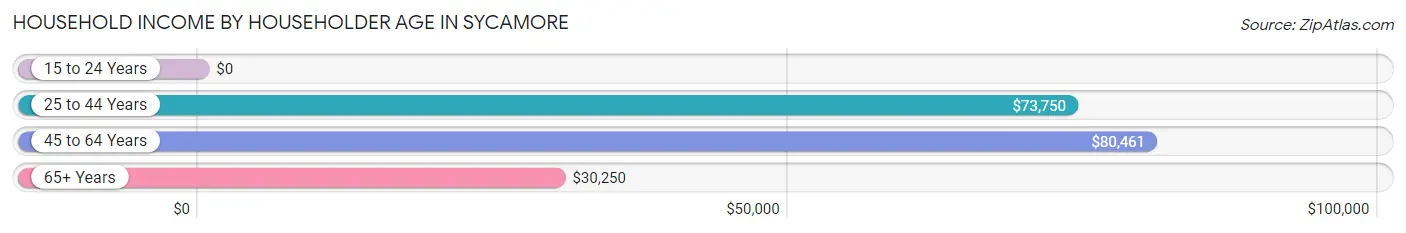
| Income Bracket | # Households | Median Income |
| 15 to 24 Years | 11 (3.2%) | $0 |
| 25 to 44 Years | 76 (22.4%) | $73,750 |
| 45 to 64 Years | 143 (42.2%) | $80,461 |
| 65+ Years | 109 (32.2%) | $30,250 |
| Total | 339 (100.0%) | $58,309 |
Poverty in Sycamore
Income Below Poverty by Sex and Age in Sycamore
With 6.5% poverty level for males and 10.0% for females among the residents of Sycamore, 55 to 64 year old males and 18 to 24 year old females are the most vulnerable to poverty, with 10 males (19.2%) and 9 females (33.3%) in their respective age groups living below the poverty level.
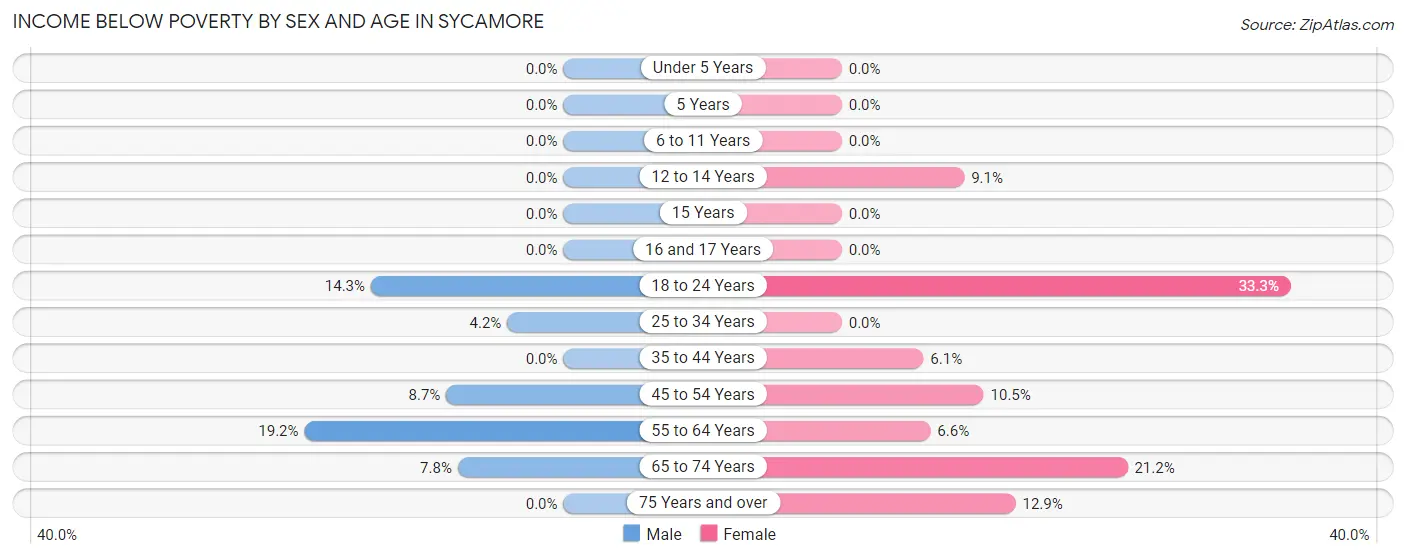
| Age Bracket | Male | Female |
| Under 5 Years | 0 (0.0%) | 0 (0.0%) |
| 5 Years | 0 (0.0%) | 0 (0.0%) |
| 6 to 11 Years | 0 (0.0%) | 0 (0.0%) |
| 12 to 14 Years | 0 (0.0%) | 2 (9.1%) |
| 15 Years | 0 (0.0%) | 0 (0.0%) |
| 16 and 17 Years | 0 (0.0%) | 0 (0.0%) |
| 18 to 24 Years | 4 (14.3%) | 9 (33.3%) |
| 25 to 34 Years | 2 (4.2%) | 0 (0.0%) |
| 35 to 44 Years | 0 (0.0%) | 2 (6.1%) |
| 45 to 54 Years | 2 (8.7%) | 6 (10.5%) |
| 55 to 64 Years | 10 (19.2%) | 5 (6.6%) |
| 65 to 74 Years | 4 (7.8%) | 7 (21.2%) |
| 75 Years and over | 0 (0.0%) | 8 (12.9%) |
| Total | 22 (6.5%) | 39 (10.0%) |
Income Above Poverty by Sex and Age in Sycamore
According to the poverty statistics in Sycamore, males aged under 5 years and females aged under 5 years are the age groups that are most secure financially, with 100.0% of males and 100.0% of females in these age groups living above the poverty line.
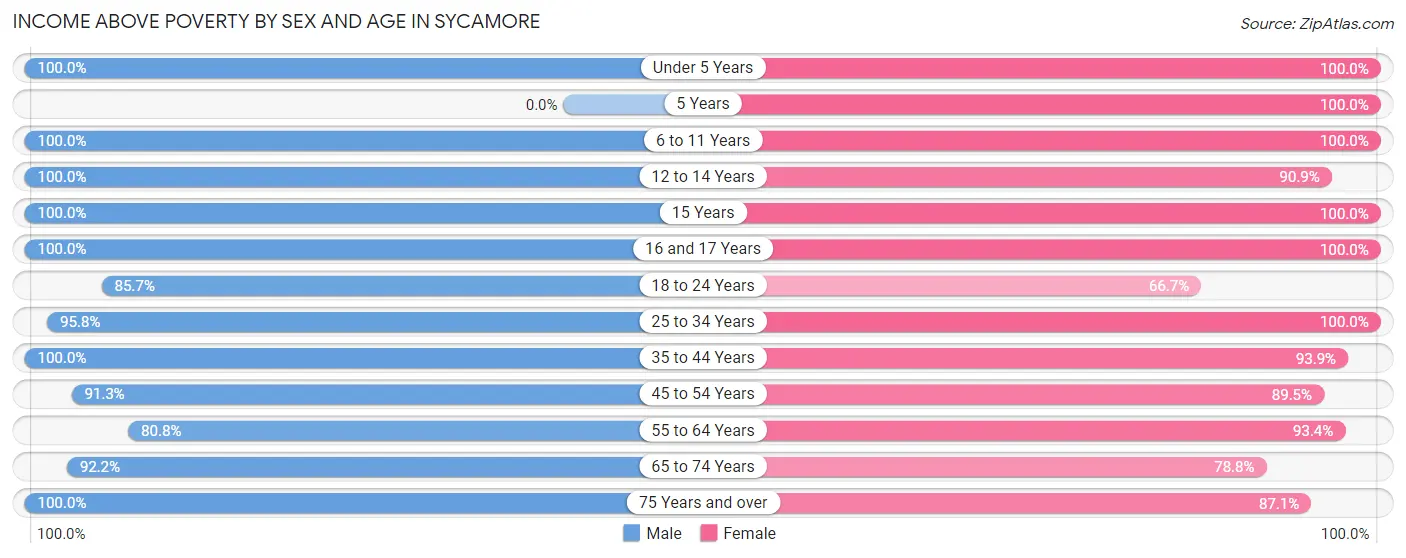
| Age Bracket | Male | Female |
| Under 5 Years | 2 (100.0%) | 10 (100.0%) |
| 5 Years | 0 (0.0%) | 9 (100.0%) |
| 6 to 11 Years | 26 (100.0%) | 12 (100.0%) |
| 12 to 14 Years | 12 (100.0%) | 20 (90.9%) |
| 15 Years | 3 (100.0%) | 4 (100.0%) |
| 16 and 17 Years | 7 (100.0%) | 10 (100.0%) |
| 18 to 24 Years | 24 (85.7%) | 18 (66.7%) |
| 25 to 34 Years | 46 (95.8%) | 37 (100.0%) |
| 35 to 44 Years | 51 (100.0%) | 31 (93.9%) |
| 45 to 54 Years | 21 (91.3%) | 51 (89.5%) |
| 55 to 64 Years | 42 (80.8%) | 71 (93.4%) |
| 65 to 74 Years | 47 (92.2%) | 26 (78.8%) |
| 75 Years and over | 34 (100.0%) | 54 (87.1%) |
| Total | 315 (93.5%) | 353 (90.0%) |
Income Below Poverty Among Married-Couple Families in Sycamore
The poverty statistics for married-couple families in Sycamore show that 4.9% or 8 of the total 163 families live below the poverty line. Families with no children have the highest poverty rate of 5.8%, comprising of 8 families. On the other hand, families with 1 or 2 children have the lowest poverty rate of 0.0%, which includes 0 families.
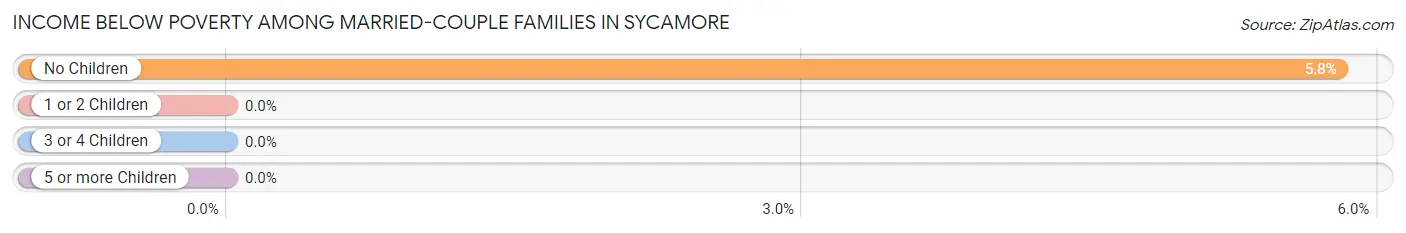
| Children | Above Poverty | Below Poverty |
| No Children | 130 (94.2%) | 8 (5.8%) |
| 1 or 2 Children | 19 (100.0%) | 0 (0.0%) |
| 3 or 4 Children | 6 (100.0%) | 0 (0.0%) |
| 5 or more Children | 0 (0.0%) | 0 (0.0%) |
| Total | 155 (95.1%) | 8 (4.9%) |
Income Below Poverty Among Single-Parent Households in Sycamore
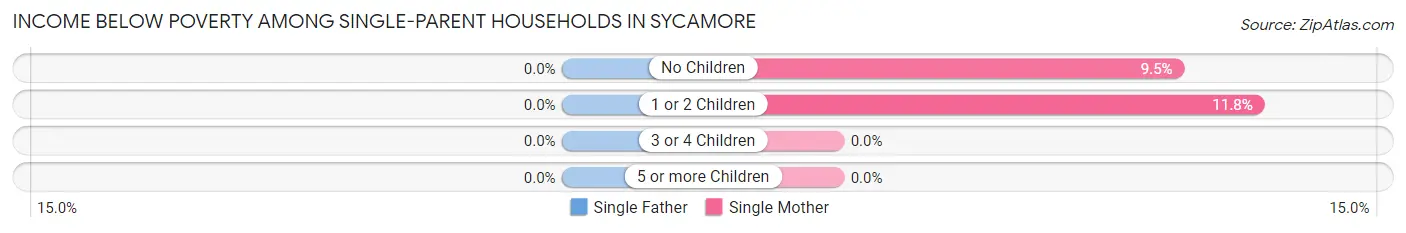
| Children | Single Father | Single Mother |
| No Children | 0 (0.0%) | 2 (9.5%) |
| 1 or 2 Children | 0 (0.0%) | 2 (11.8%) |
| 3 or 4 Children | 0 (0.0%) | 0 (0.0%) |
| 5 or more Children | 0 (0.0%) | 0 (0.0%) |
| Total | 0 (0.0%) | 4 (9.5%) |
Income Below Poverty Among Married-Couple vs Single-Parent Households in Sycamore
The poverty data for Sycamore shows that 8 of the married-couple family households (4.9%) and 4 of the single-parent households (6.5%) are living below the poverty level. Within the married-couple family households, those with no children have the highest poverty rate, with 8 households (5.8%) falling below the poverty line. Among the single-parent households, those with no children have the highest poverty rate, with 2 household (8.0%) living below poverty.
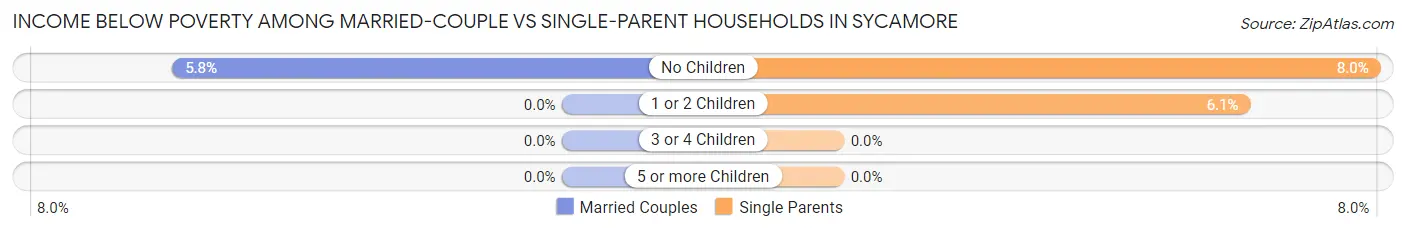
| Children | Married-Couple Families | Single-Parent Households |
| No Children | 8 (5.8%) | 2 (8.0%) |
| 1 or 2 Children | 0 (0.0%) | 2 (6.1%) |
| 3 or 4 Children | 0 (0.0%) | 0 (0.0%) |
| 5 or more Children | 0 (0.0%) | 0 (0.0%) |
| Total | 8 (4.9%) | 4 (6.5%) |
Race in Sycamore
The most populous races in Sycamore are White / Caucasian (694 | 94.7%), Hispanic or Latino (26 | 3.5%), and Some other Race (16 | 2.2%).
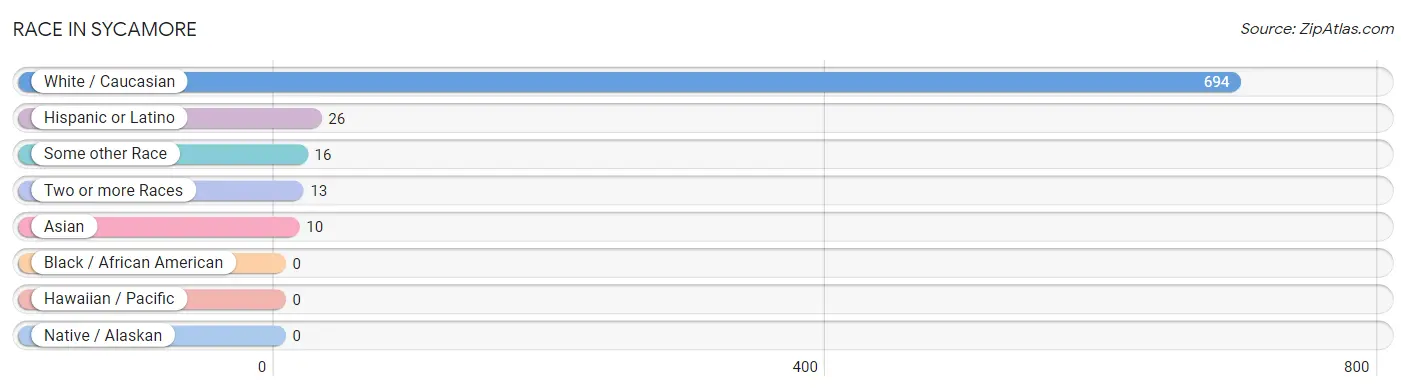
| Race | # Population | % Population |
| Asian | 10 | 1.4% |
| Black / African American | 0 | 0.0% |
| Hawaiian / Pacific | 0 | 0.0% |
| Hispanic or Latino | 26 | 3.5% |
| Native / Alaskan | 0 | 0.0% |
| White / Caucasian | 694 | 94.7% |
| Two or more Races | 13 | 1.8% |
| Some other Race | 16 | 2.2% |
| Total | 733 | 100.0% |
Ancestry in Sycamore
The most populous ancestries reported in Sycamore are German (271 | 37.0%), Irish (71 | 9.7%), English (46 | 6.3%), American (39 | 5.3%), and French (25 | 3.4%), together accounting for 61.7% of all Sycamore residents.
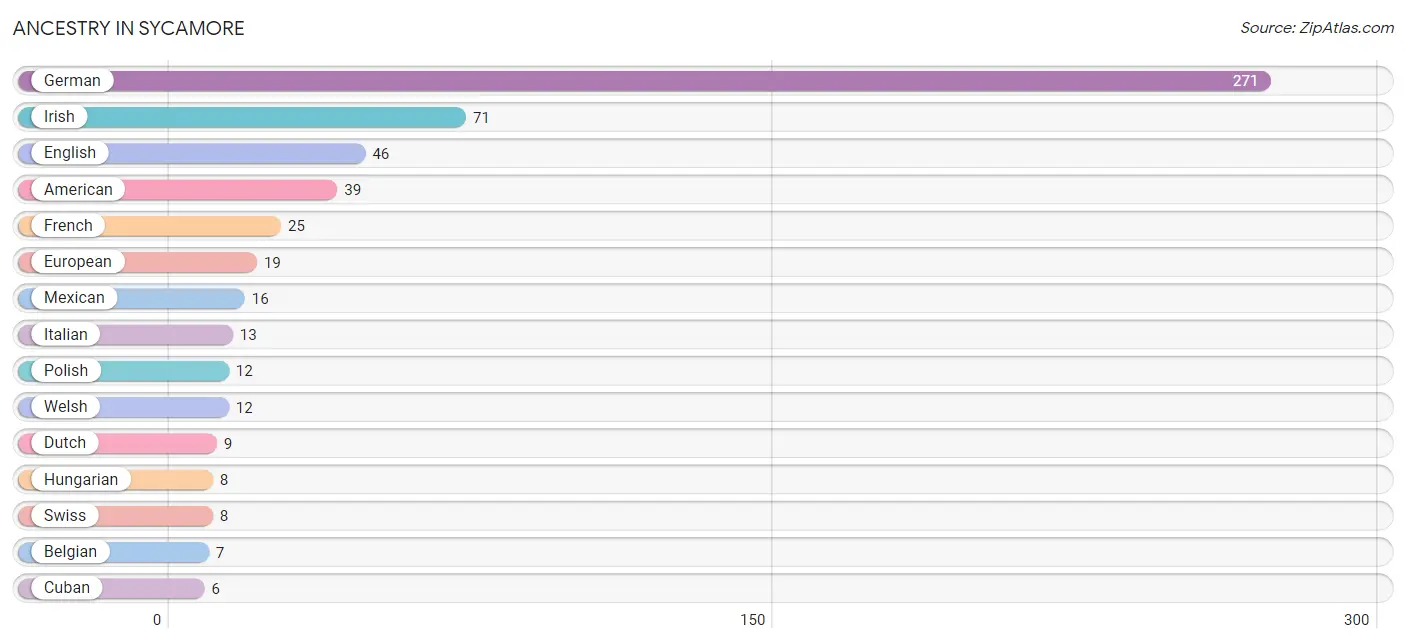
| Ancestry | # Population | % Population |
| American | 39 | 5.3% |
| Belgian | 7 | 0.9% |
| Burmese | 4 | 0.5% |
| Canadian | 2 | 0.3% |
| Cuban | 6 | 0.8% |
| Czechoslovakian | 3 | 0.4% |
| Dutch | 9 | 1.2% |
| English | 46 | 6.3% |
| European | 19 | 2.6% |
| French | 25 | 3.4% |
| French Canadian | 3 | 0.4% |
| German | 271 | 37.0% |
| Hungarian | 8 | 1.1% |
| Irish | 71 | 9.7% |
| Italian | 13 | 1.8% |
| Mexican | 16 | 2.2% |
| Norwegian | 3 | 0.4% |
| Pennsylvania German | 1 | 0.1% |
| Polish | 12 | 1.6% |
| Puerto Rican | 4 | 0.5% |
| Scottish | 6 | 0.8% |
| Sri Lankan | 2 | 0.3% |
| Swiss | 8 | 1.1% |
| Thai | 4 | 0.5% |
| Welsh | 12 | 1.6% | View All 25 Rows |
Immigrants in Sycamore

| Immigration Origin | # Population | % Population | View All 0 Rows |
Sex and Age in Sycamore
Sex and Age in Sycamore
The most populous age groups in Sycamore are 5 to 9 Years (30 | 8.8%) for men and 60 to 64 Years (52 | 13.3%) for women.
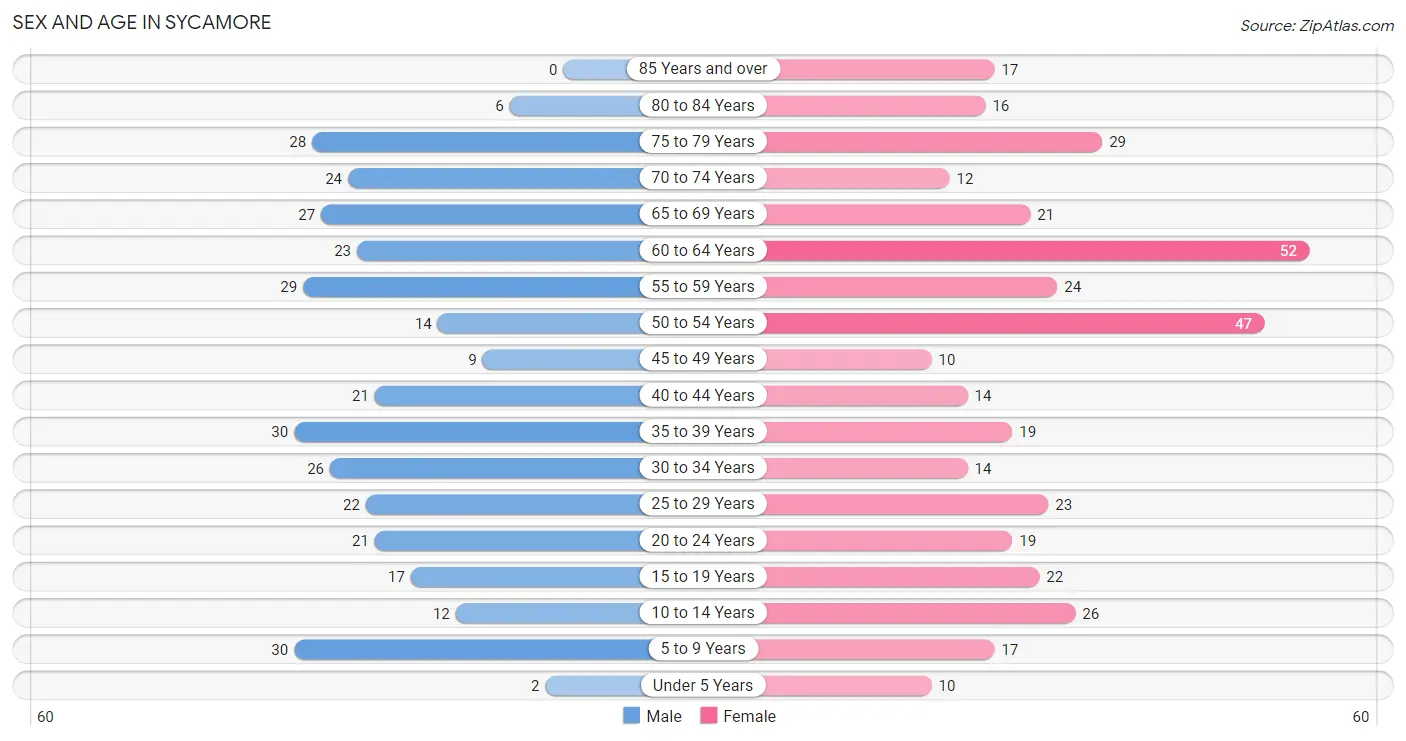
| Age Bracket | Male | Female |
| Under 5 Years | 2 (0.6%) | 10 (2.5%) |
| 5 to 9 Years | 30 (8.8%) | 17 (4.3%) |
| 10 to 14 Years | 12 (3.5%) | 26 (6.6%) |
| 15 to 19 Years | 17 (5.0%) | 22 (5.6%) |
| 20 to 24 Years | 21 (6.2%) | 19 (4.9%) |
| 25 to 29 Years | 22 (6.5%) | 23 (5.9%) |
| 30 to 34 Years | 26 (7.6%) | 14 (3.6%) |
| 35 to 39 Years | 30 (8.8%) | 19 (4.9%) |
| 40 to 44 Years | 21 (6.2%) | 14 (3.6%) |
| 45 to 49 Years | 9 (2.6%) | 10 (2.5%) |
| 50 to 54 Years | 14 (4.1%) | 47 (12.0%) |
| 55 to 59 Years | 29 (8.5%) | 24 (6.1%) |
| 60 to 64 Years | 23 (6.7%) | 52 (13.3%) |
| 65 to 69 Years | 27 (7.9%) | 21 (5.4%) |
| 70 to 74 Years | 24 (7.0%) | 12 (3.1%) |
| 75 to 79 Years | 28 (8.2%) | 29 (7.4%) |
| 80 to 84 Years | 6 (1.8%) | 16 (4.1%) |
| 85 Years and over | 0 (0.0%) | 17 (4.3%) |
| Total | 341 (100.0%) | 392 (100.0%) |
Families and Households in Sycamore
Median Family Size in Sycamore
The median family size in Sycamore is 2.57 persons per family, with single female/mother families (42 | 18.7%) accounting for the largest median family size of 2.9 persons per family. On the other hand, married-couple families (163 | 72.4%) represent the smallest median family size with 2.50 persons per family.
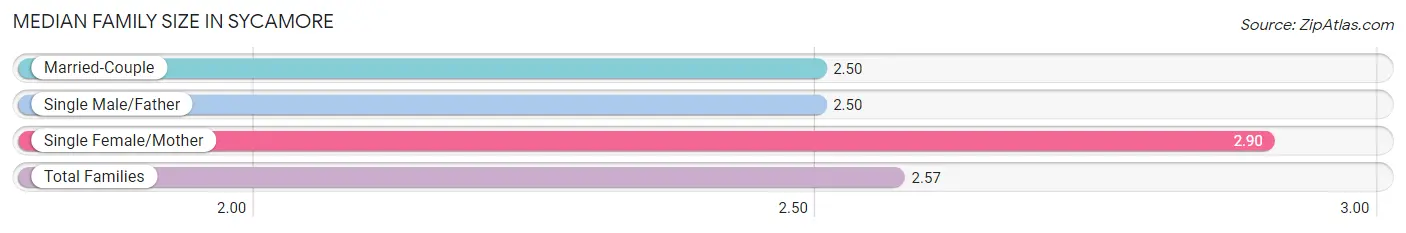
| Family Type | # Families | Family Size |
| Married-Couple | 163 (72.4%) | 2.50 |
| Single Male/Father | 20 (8.9%) | 2.50 |
| Single Female/Mother | 42 (18.7%) | 2.90 |
| Total Families | 225 (100.0%) | 2.57 |
Median Household Size in Sycamore
The median household size in Sycamore is 2.16 persons per household, with single female/mother households (42 | 12.4%) accounting for the largest median household size of 3.19 persons per household. non-family households (114 | 33.6%) represent the smallest median household size with 1.18 persons per household.
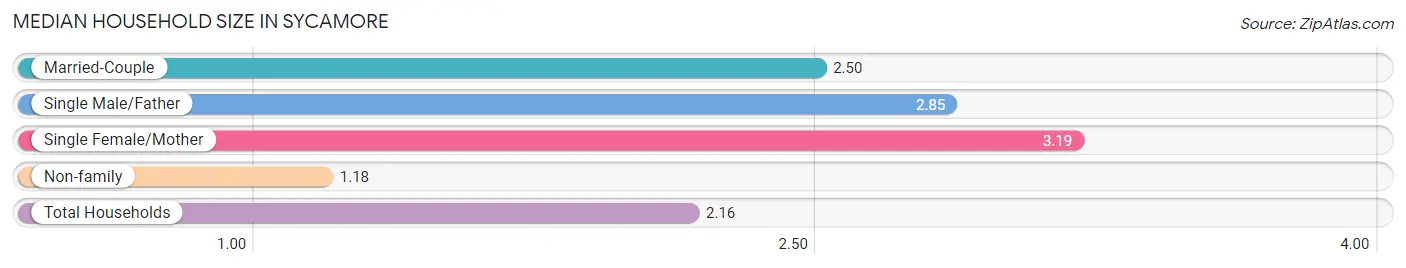
| Household Type | # Households | Household Size |
| Married-Couple | 163 (48.1%) | 2.50 |
| Single Male/Father | 20 (5.9%) | 2.85 |
| Single Female/Mother | 42 (12.4%) | 3.19 |
| Non-family | 114 (33.6%) | 1.18 |
| Total Households | 339 (100.0%) | 2.16 |
Household Size by Marriage Status in Sycamore
Out of a total of 339 households in Sycamore, 225 (66.4%) are family households, while 114 (33.6%) are nonfamily households. The most numerous type of family households are 2-person households, comprising 136, and the most common type of nonfamily households are 1-person households, comprising 101.
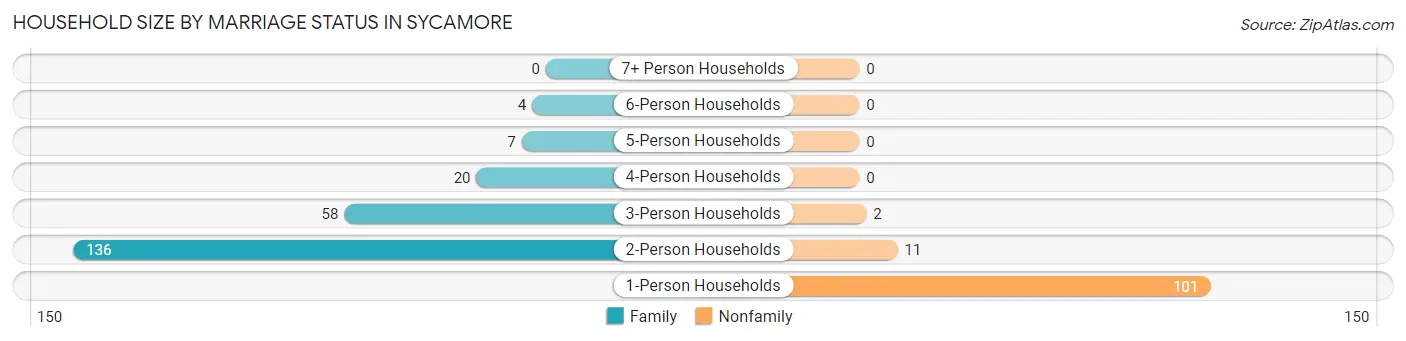
| Household Size | Family Households | Nonfamily Households |
| 1-Person Households | - | 101 (29.8%) |
| 2-Person Households | 136 (40.1%) | 11 (3.2%) |
| 3-Person Households | 58 (17.1%) | 2 (0.6%) |
| 4-Person Households | 20 (5.9%) | 0 (0.0%) |
| 5-Person Households | 7 (2.1%) | 0 (0.0%) |
| 6-Person Households | 4 (1.2%) | 0 (0.0%) |
| 7+ Person Households | 0 (0.0%) | 0 (0.0%) |
| Total | 225 (66.4%) | 114 (33.6%) |
Female Fertility in Sycamore
Fertility by Age in Sycamore
Average fertility rate in Sycamore is 47.0 births per 1,000 women. Women in the age bracket of 20 to 34 years have the highest fertility rate with 71.0 births per 1,000 women. Women in the age bracket of 20 to 34 years acount for 66.7% of all women with births.
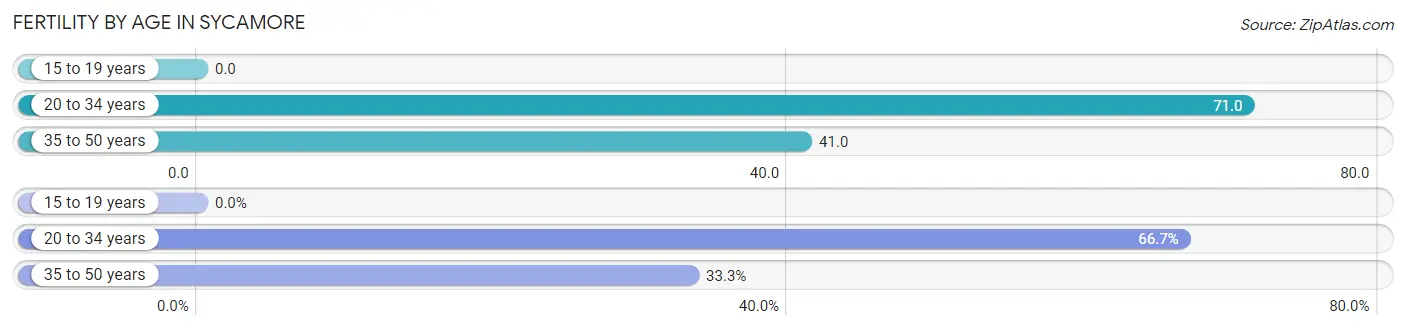
| Age Bracket | Women with Births | Births / 1,000 Women |
| 15 to 19 years | 0 (0.0%) | 0.0 |
| 20 to 34 years | 4 (66.7%) | 71.0 |
| 35 to 50 years | 2 (33.3%) | 41.0 |
| Total | 6 (100.0%) | 47.0 |
Fertility by Age by Marriage Status in Sycamore
33.3% of women with births (6) in Sycamore are married. The highest percentage of unmarried women with births falls into 35 to 50 years age bracket with 100.0% of them unmarried at the time of birth, while the lowest percentage of unmarried women with births belong to 20 to 34 years age bracket with 50.0% of them unmarried.
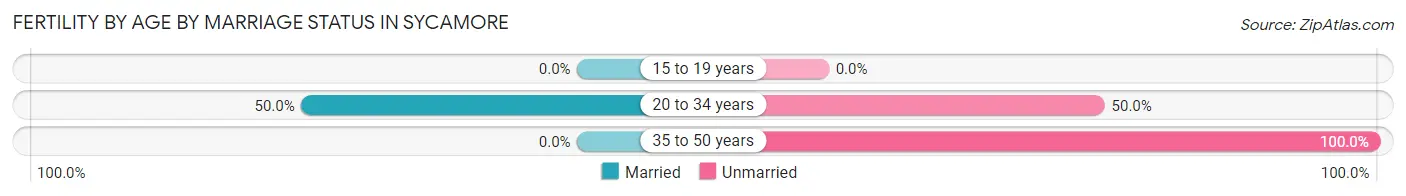
| Age Bracket | Married | Unmarried |
| 15 to 19 years | 0 (0.0%) | 0 (0.0%) |
| 20 to 34 years | 2 (50.0%) | 2 (50.0%) |
| 35 to 50 years | 0 (0.0%) | 2 (100.0%) |
| Total | 2 (33.3%) | 4 (66.7%) |
Fertility by Education in Sycamore
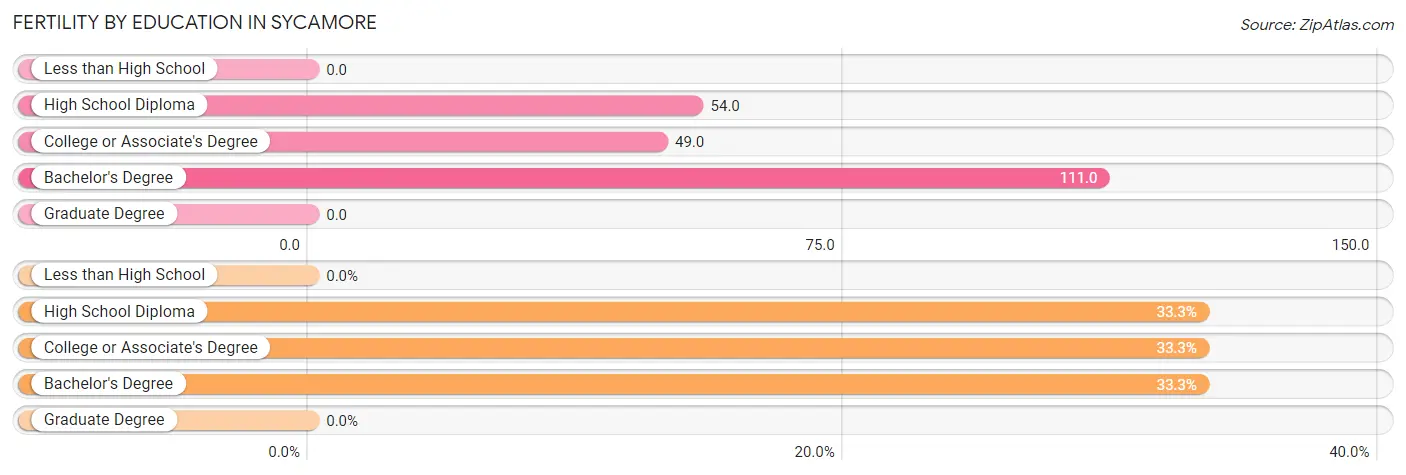
| Educational Attainment | Women with Births | Births / 1,000 Women |
| Less than High School | 0 (0.0%) | 0.0 |
| High School Diploma | 2 (33.3%) | 54.0 |
| College or Associate's Degree | 2 (33.3%) | 49.0 |
| Bachelor's Degree | 2 (33.3%) | 111.0 |
| Graduate Degree | 0 (0.0%) | 0.0 |
| Total | 6 (100.0%) | 47.0 |
Fertility by Education by Marriage Status in Sycamore
66.7% of women with births in Sycamore are unmarried. Women with the educational attainment of bachelor's degree are most likely to be married with 100.0% of them married at childbirth, while women with the educational attainment of high school diploma are least likely to be married with 100.0% of them unmarried at childbirth.
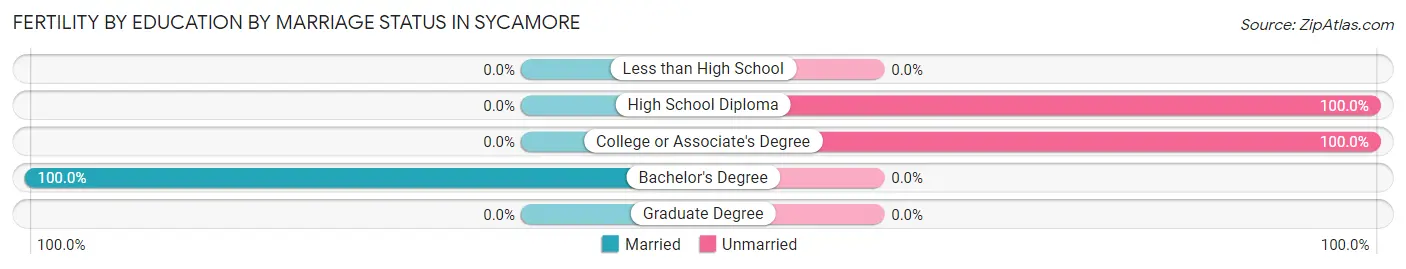
| Educational Attainment | Married | Unmarried |
| Less than High School | 0 (0.0%) | 0 (0.0%) |
| High School Diploma | 0 (0.0%) | 2 (100.0%) |
| College or Associate's Degree | 0 (0.0%) | 2 (100.0%) |
| Bachelor's Degree | 2 (100.0%) | 0 (0.0%) |
| Graduate Degree | 0 (0.0%) | 0 (0.0%) |
| Total | 2 (33.3%) | 4 (66.7%) |
Employment Characteristics in Sycamore
Employment by Class of Employer in Sycamore
Among the 395 employed individuals in Sycamore, private company employees (322 | 81.5%), local government employees (28 | 7.1%), and not-for-profit organizations (23 | 5.8%) make up the most common classes of employment.
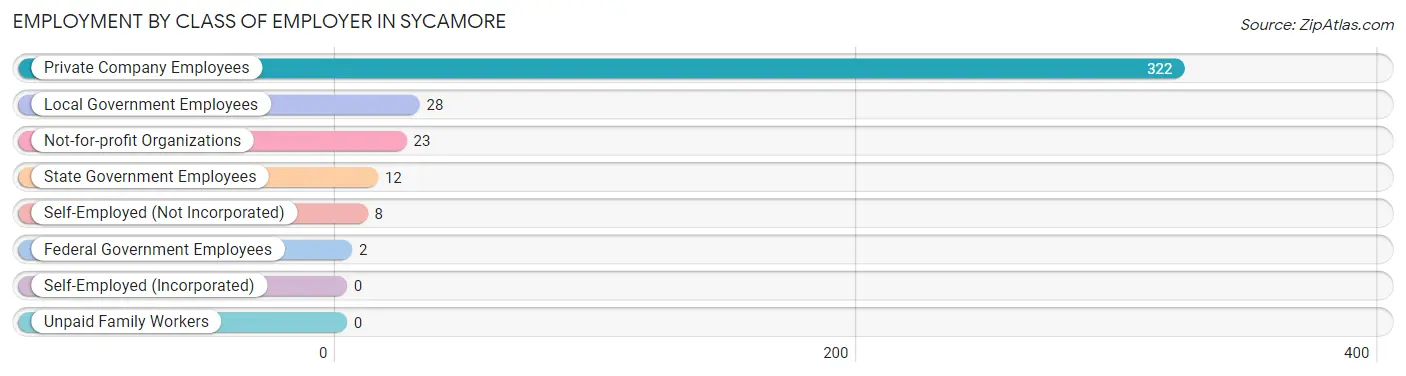
| Employer Class | # Employees | % Employees |
| Private Company Employees | 322 | 81.5% |
| Self-Employed (Incorporated) | 0 | 0.0% |
| Self-Employed (Not Incorporated) | 8 | 2.0% |
| Not-for-profit Organizations | 23 | 5.8% |
| Local Government Employees | 28 | 7.1% |
| State Government Employees | 12 | 3.0% |
| Federal Government Employees | 2 | 0.5% |
| Unpaid Family Workers | 0 | 0.0% |
| Total | 395 | 100.0% |
Employment Status by Age in Sycamore
According to the labor force statistics for Sycamore, out of the total population over 16 years of age (629), 65.5% or 412 individuals are in the labor force, with 3.4% or 14 of them unemployed. The age group with the highest labor force participation rate is 35 to 44 years, with 95.2% or 80 individuals in the labor force. Within the labor force, the 75 years and over age range has the highest percentage of unemployed individuals, with 24.1% or 7 of them being unemployed.
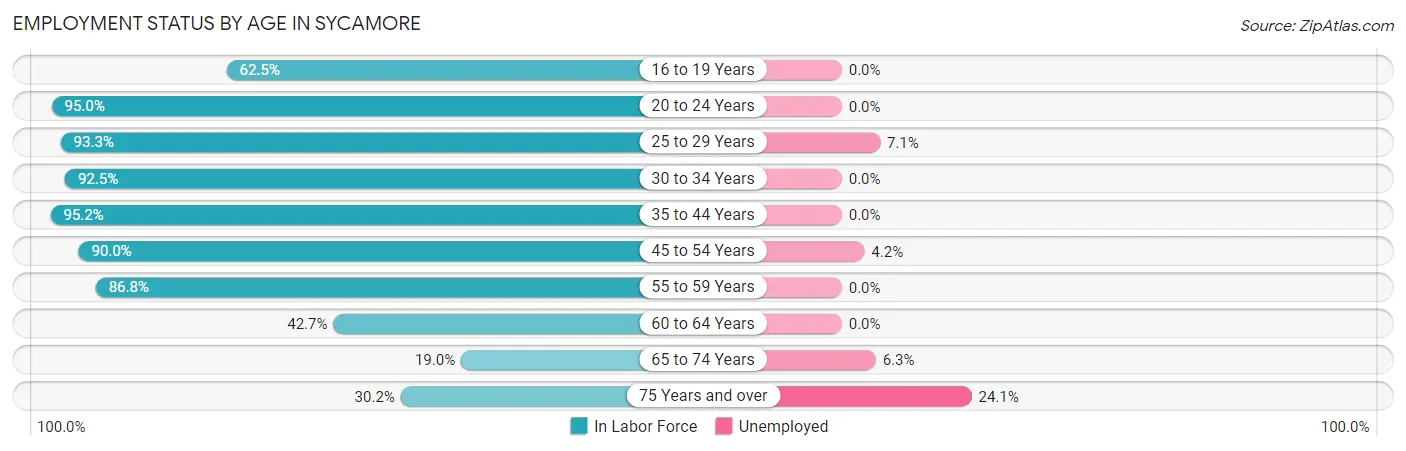
| Age Bracket | In Labor Force | Unemployed |
| 16 to 19 Years | 20 (62.5%) | 0 (0.0%) |
| 20 to 24 Years | 38 (95.0%) | 0 (0.0%) |
| 25 to 29 Years | 42 (93.3%) | 3 (7.1%) |
| 30 to 34 Years | 37 (92.5%) | 0 (0.0%) |
| 35 to 44 Years | 80 (95.2%) | 0 (0.0%) |
| 45 to 54 Years | 72 (90.0%) | 3 (4.2%) |
| 55 to 59 Years | 46 (86.8%) | 0 (0.0%) |
| 60 to 64 Years | 32 (42.7%) | 0 (0.0%) |
| 65 to 74 Years | 16 (19.0%) | 1 (6.3%) |
| 75 Years and over | 29 (30.2%) | 7 (24.1%) |
| Total | 412 (65.5%) | 14 (3.4%) |
Employment Status by Educational Attainment in Sycamore
According to labor force statistics for Sycamore, 82.0% of individuals (309) out of the total population between 25 and 64 years of age (377) are in the labor force, with 1.9% or 6 of them being unemployed. The group with the highest labor force participation rate are those with the educational attainment of bachelor's degree or higher, with 93.4% or 57 individuals in the labor force. Within the labor force, individuals with bachelor's degree or higher education have the highest percentage of unemployment, with 5.3% or 3 of them being unemployed.
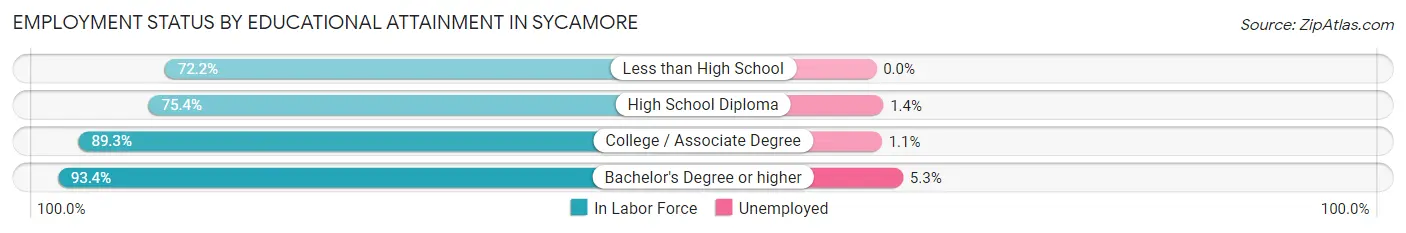
| Educational Attainment | In Labor Force | Unemployed |
| Less than High School | 13 (72.2%) | 0 (0.0%) |
| High School Diploma | 147 (75.4%) | 3 (1.4%) |
| College / Associate Degree | 92 (89.3%) | 1 (1.1%) |
| Bachelor's Degree or higher | 57 (93.4%) | 3 (5.3%) |
| Total | 309 (82.0%) | 7 (1.9%) |
Employment Occupations by Sex in Sycamore
Management, Business, Science and Arts Occupations
The most common Management, Business, Science and Arts occupations in Sycamore are Community & Social Service (40 | 10.1%), Education Instruction & Library (37 | 9.3%), Computers, Engineering & Science (20 | 5.0%), Health Diagnosing & Treating (16 | 4.0%), and Business & Financial (15 | 3.8%).
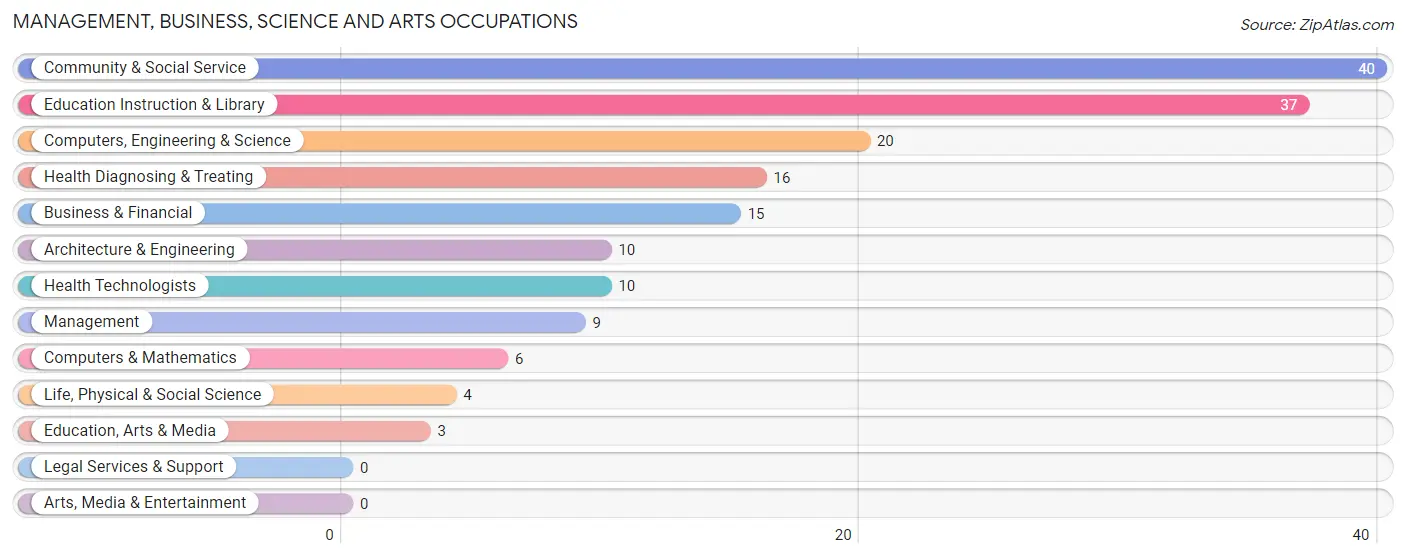
Management, Business, Science and Arts Occupations by Sex
Within the Management, Business, Science and Arts occupations in Sycamore, the most male-oriented occupations are Life, Physical & Social Science (100.0%), Management (88.9%), and Computers, Engineering & Science (70.0%), while the most female-oriented occupations are Education, Arts & Media (100.0%), Community & Social Service (87.5%), and Business & Financial (86.7%).
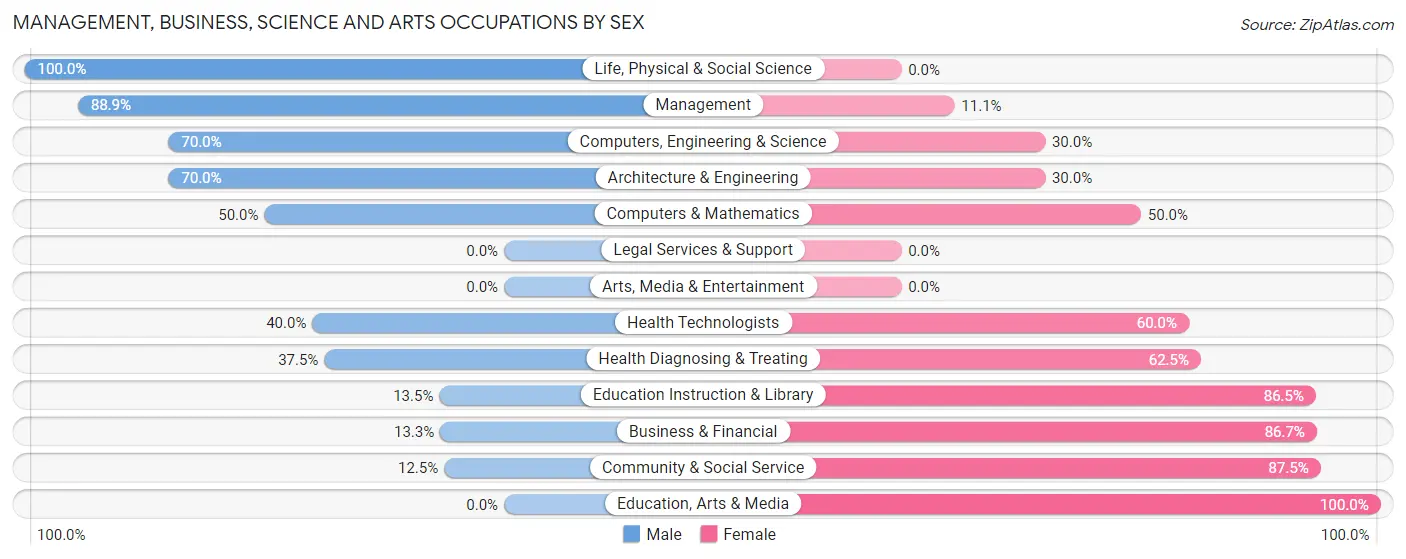
| Occupation | Male | Female |
| Management | 8 (88.9%) | 1 (11.1%) |
| Business & Financial | 2 (13.3%) | 13 (86.7%) |
| Computers, Engineering & Science | 14 (70.0%) | 6 (30.0%) |
| Computers & Mathematics | 3 (50.0%) | 3 (50.0%) |
| Architecture & Engineering | 7 (70.0%) | 3 (30.0%) |
| Life, Physical & Social Science | 4 (100.0%) | 0 (0.0%) |
| Community & Social Service | 5 (12.5%) | 35 (87.5%) |
| Education, Arts & Media | 0 (0.0%) | 3 (100.0%) |
| Legal Services & Support | 0 (0.0%) | 0 (0.0%) |
| Education Instruction & Library | 5 (13.5%) | 32 (86.5%) |
| Arts, Media & Entertainment | 0 (0.0%) | 0 (0.0%) |
| Health Diagnosing & Treating | 6 (37.5%) | 10 (62.5%) |
| Health Technologists | 4 (40.0%) | 6 (60.0%) |
| Total (Category) | 35 (35.0%) | 65 (65.0%) |
| Total (Overall) | 203 (51.0%) | 195 (49.0%) |
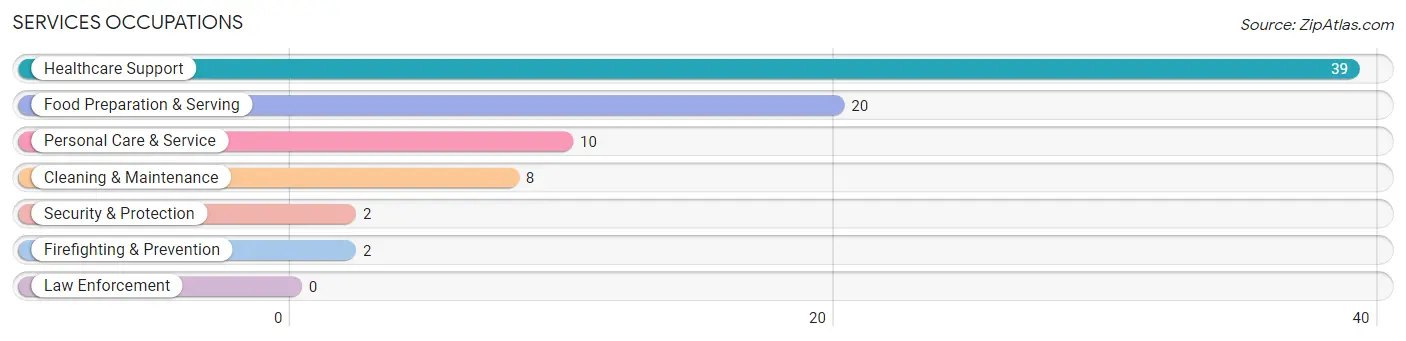
Services Occupations
The most common Services occupations in Sycamore are Healthcare Support (39 | 9.8%), Food Preparation & Serving (20 | 5.0%), Personal Care & Service (10 | 2.5%), Cleaning & Maintenance (8 | 2.0%), and Security & Protection (2 | 0.5%).
Services Occupations by Sex
Within the Services occupations in Sycamore, the most male-oriented occupations are Cleaning & Maintenance (25.0%), Food Preparation & Serving (20.0%), and Personal Care & Service (20.0%), while the most female-oriented occupations are Security & Protection (100.0%), Firefighting & Prevention (100.0%), and Healthcare Support (82.1%).
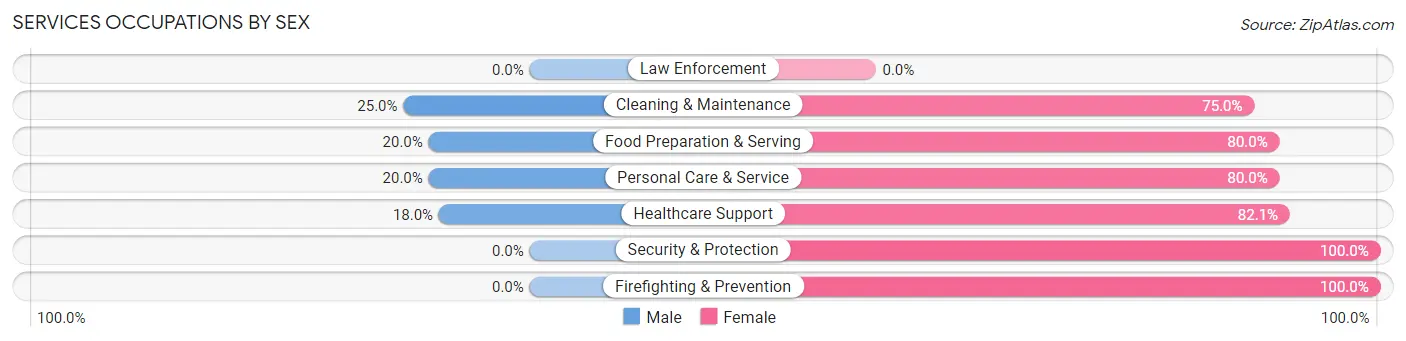
| Occupation | Male | Female |
| Healthcare Support | 7 (17.9%) | 32 (82.1%) |
| Security & Protection | 0 (0.0%) | 2 (100.0%) |
| Firefighting & Prevention | 0 (0.0%) | 2 (100.0%) |
| Law Enforcement | 0 (0.0%) | 0 (0.0%) |
| Food Preparation & Serving | 4 (20.0%) | 16 (80.0%) |
| Cleaning & Maintenance | 2 (25.0%) | 6 (75.0%) |
| Personal Care & Service | 2 (20.0%) | 8 (80.0%) |
| Total (Category) | 15 (19.0%) | 64 (81.0%) |
| Total (Overall) | 203 (51.0%) | 195 (49.0%) |
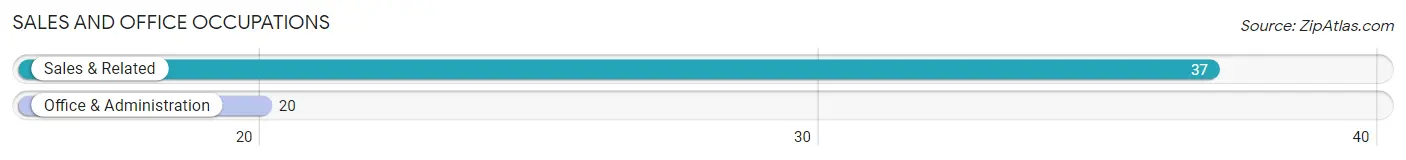
Sales and Office Occupations
The most common Sales and Office occupations in Sycamore are Sales & Related (37 | 9.3%), and Office & Administration (20 | 5.0%).
Sales and Office Occupations by Sex
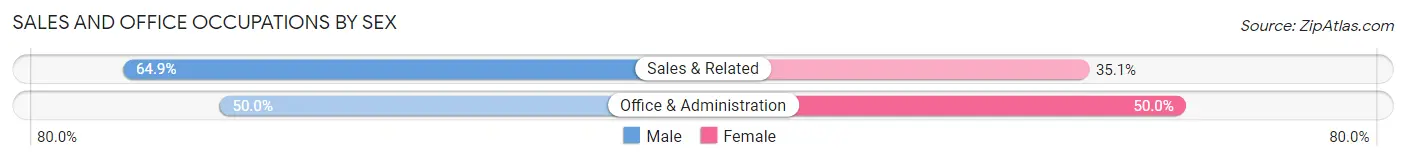
| Occupation | Male | Female |
| Sales & Related | 24 (64.9%) | 13 (35.1%) |
| Office & Administration | 10 (50.0%) | 10 (50.0%) |
| Total (Category) | 34 (59.7%) | 23 (40.4%) |
| Total (Overall) | 203 (51.0%) | 195 (49.0%) |
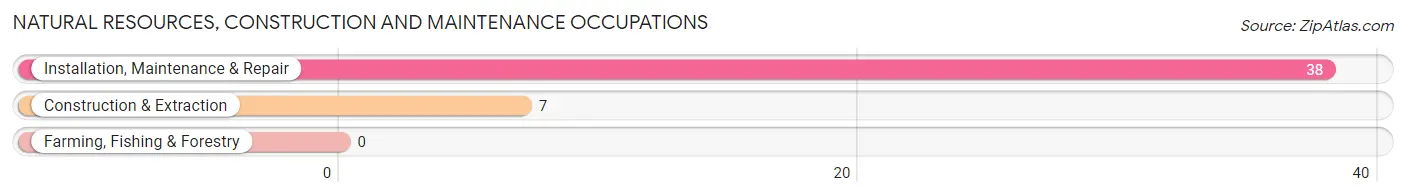
Natural Resources, Construction and Maintenance Occupations
The most common Natural Resources, Construction and Maintenance occupations in Sycamore are Installation, Maintenance & Repair (38 | 9.6%), and Construction & Extraction (7 | 1.8%).
Natural Resources, Construction and Maintenance Occupations by Sex
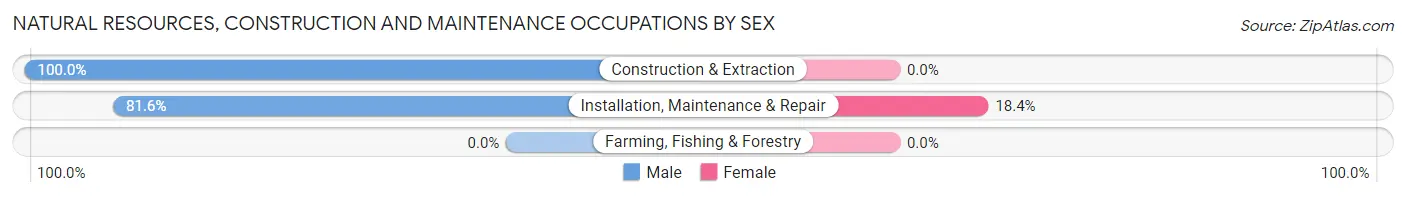
| Occupation | Male | Female |
| Farming, Fishing & Forestry | 0 (0.0%) | 0 (0.0%) |
| Construction & Extraction | 7 (100.0%) | 0 (0.0%) |
| Installation, Maintenance & Repair | 31 (81.6%) | 7 (18.4%) |
| Total (Category) | 38 (84.4%) | 7 (15.6%) |
| Total (Overall) | 203 (51.0%) | 195 (49.0%) |
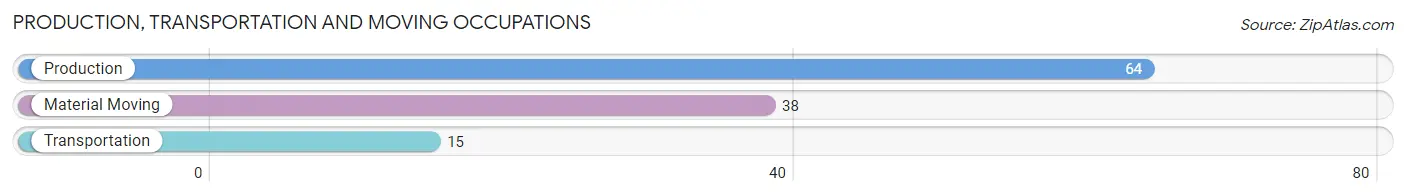
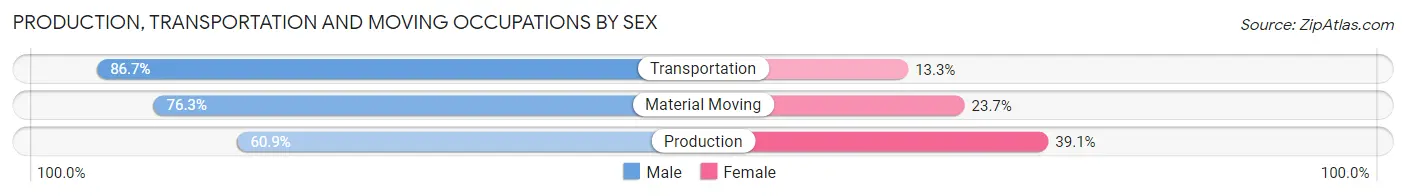
Production, Transportation and Moving Occupations
The most common Production, Transportation and Moving occupations in Sycamore are Production (64 | 16.1%), Material Moving (38 | 9.6%), and Transportation (15 | 3.8%).
Production, Transportation and Moving Occupations by Sex
| Occupation | Male | Female |
| Production | 39 (60.9%) | 25 (39.1%) |
| Transportation | 13 (86.7%) | 2 (13.3%) |
| Material Moving | 29 (76.3%) | 9 (23.7%) |
| Total (Category) | 81 (69.2%) | 36 (30.8%) |
| Total (Overall) | 203 (51.0%) | 195 (49.0%) |
Employment Industries by Sex in Sycamore
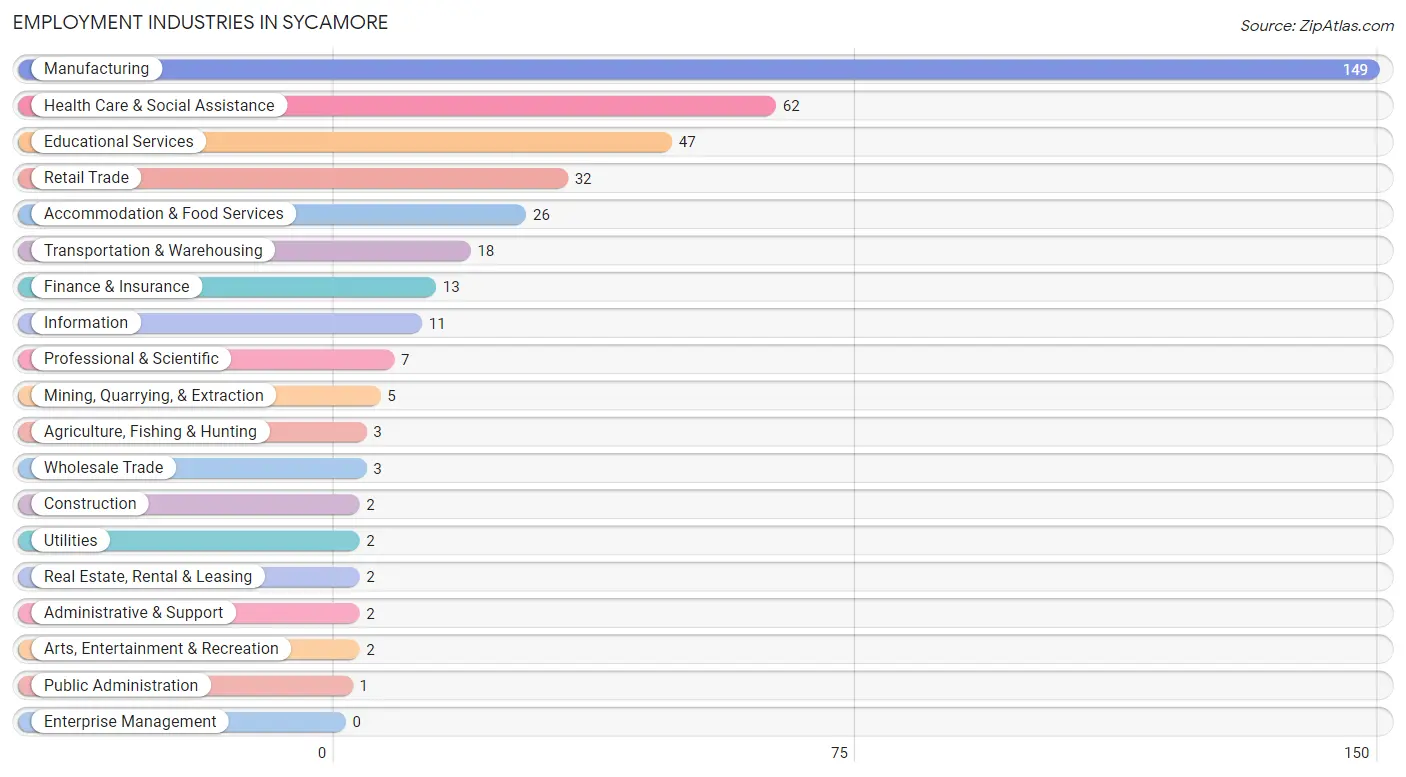
Employment Industries in Sycamore
The major employment industries in Sycamore include Manufacturing (149 | 37.4%), Health Care & Social Assistance (62 | 15.6%), Educational Services (47 | 11.8%), Retail Trade (32 | 8.0%), and Accommodation & Food Services (26 | 6.5%).
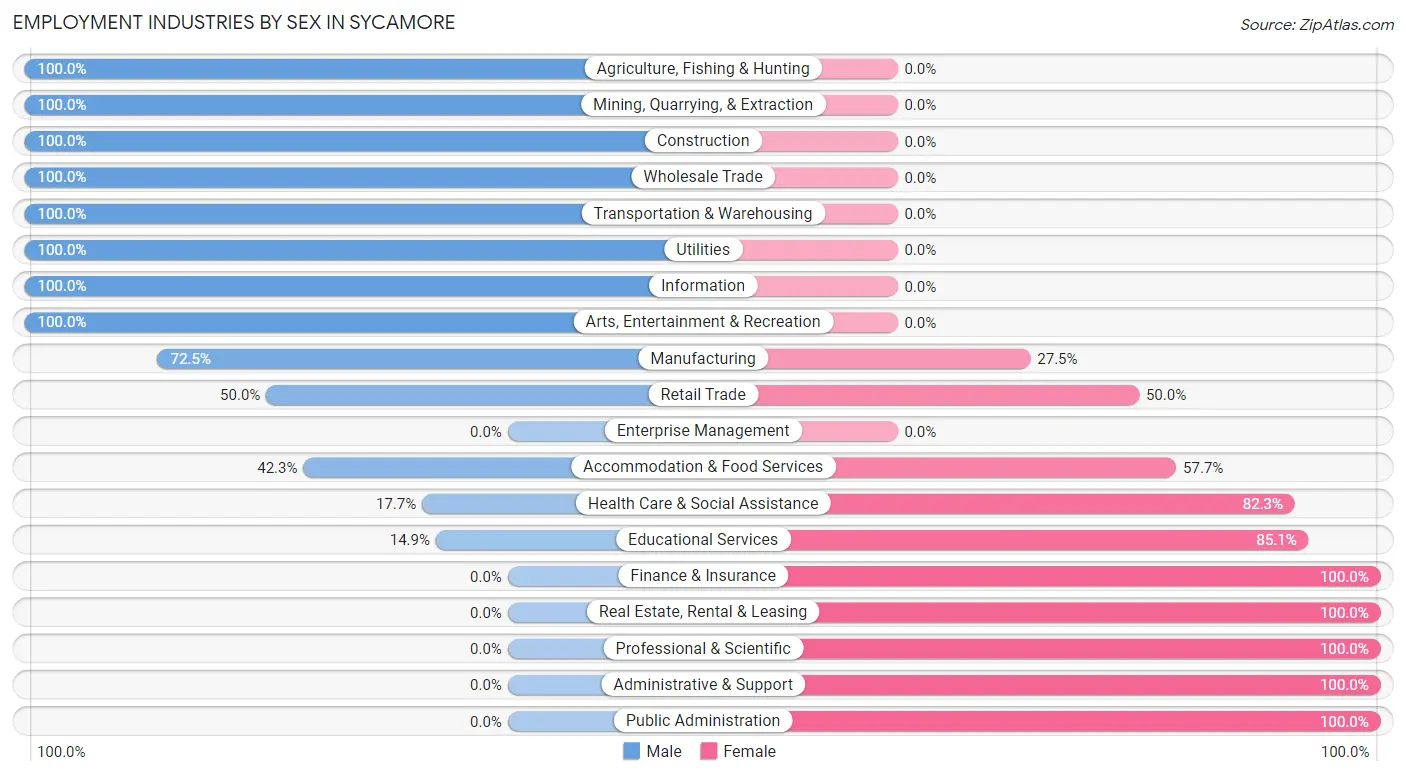
Employment Industries by Sex in Sycamore
The Sycamore industries that see more men than women are Agriculture, Fishing & Hunting (100.0%), Mining, Quarrying, & Extraction (100.0%), and Construction (100.0%), whereas the industries that tend to have a higher number of women are Finance & Insurance (100.0%), Real Estate, Rental & Leasing (100.0%), and Professional & Scientific (100.0%).
| Industry | Male | Female |
| Agriculture, Fishing & Hunting | 3 (100.0%) | 0 (0.0%) |
| Mining, Quarrying, & Extraction | 5 (100.0%) | 0 (0.0%) |
| Construction | 2 (100.0%) | 0 (0.0%) |
| Manufacturing | 108 (72.5%) | 41 (27.5%) |
| Wholesale Trade | 3 (100.0%) | 0 (0.0%) |
| Retail Trade | 16 (50.0%) | 16 (50.0%) |
| Transportation & Warehousing | 18 (100.0%) | 0 (0.0%) |
| Utilities | 2 (100.0%) | 0 (0.0%) |
| Information | 11 (100.0%) | 0 (0.0%) |
| Finance & Insurance | 0 (0.0%) | 13 (100.0%) |
| Real Estate, Rental & Leasing | 0 (0.0%) | 2 (100.0%) |
| Professional & Scientific | 0 (0.0%) | 7 (100.0%) |
| Enterprise Management | 0 (0.0%) | 0 (0.0%) |
| Administrative & Support | 0 (0.0%) | 2 (100.0%) |
| Educational Services | 7 (14.9%) | 40 (85.1%) |
| Health Care & Social Assistance | 11 (17.7%) | 51 (82.3%) |
| Arts, Entertainment & Recreation | 2 (100.0%) | 0 (0.0%) |
| Accommodation & Food Services | 11 (42.3%) | 15 (57.7%) |
| Public Administration | 0 (0.0%) | 1 (100.0%) |
| Total | 203 (51.0%) | 195 (49.0%) |
Education in Sycamore
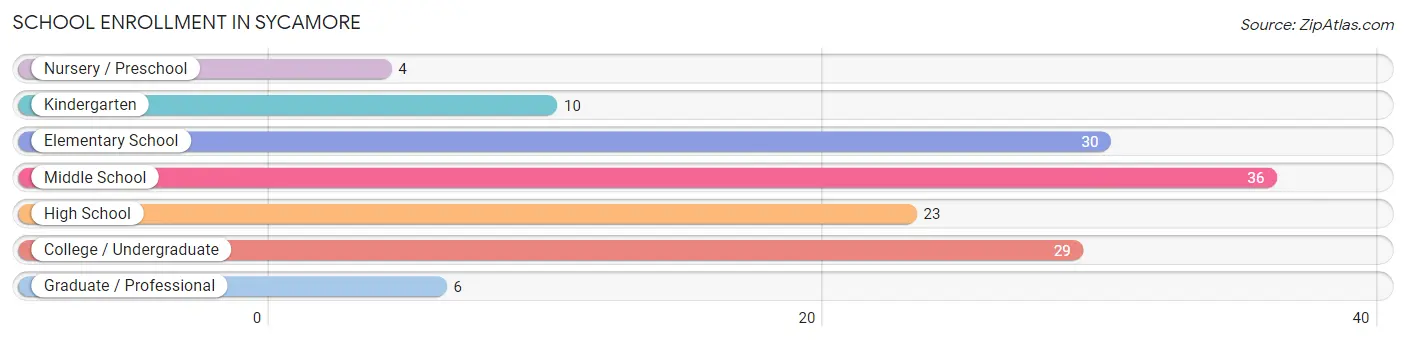
School Enrollment in Sycamore
The most common levels of schooling among the 138 students in Sycamore are middle school (36 | 26.1%), elementary school (30 | 21.7%), and college / undergraduate (29 | 21.0%).
| School Level | # Students | % Students |
| Nursery / Preschool | 4 | 2.9% |
| Kindergarten | 10 | 7.2% |
| Elementary School | 30 | 21.7% |
| Middle School | 36 | 26.1% |
| High School | 23 | 16.7% |
| College / Undergraduate | 29 | 21.0% |
| Graduate / Professional | 6 | 4.3% |
| Total | 138 | 100.0% |
School Enrollment by Age by Funding Source in Sycamore
Out of a total of 138 students who are enrolled in schools in Sycamore, 5 (3.6%) attend a private institution, while the remaining 133 (96.4%) are enrolled in public schools. The age group of 25 to 34 year olds has the highest likelihood of being enrolled in private schools, with 3 (50.0% in the age bracket) enrolled. Conversely, the age group of 3 to 4 year olds has the lowest likelihood of being enrolled in a private school, with 4 (100.0% in the age bracket) attending a public institution.
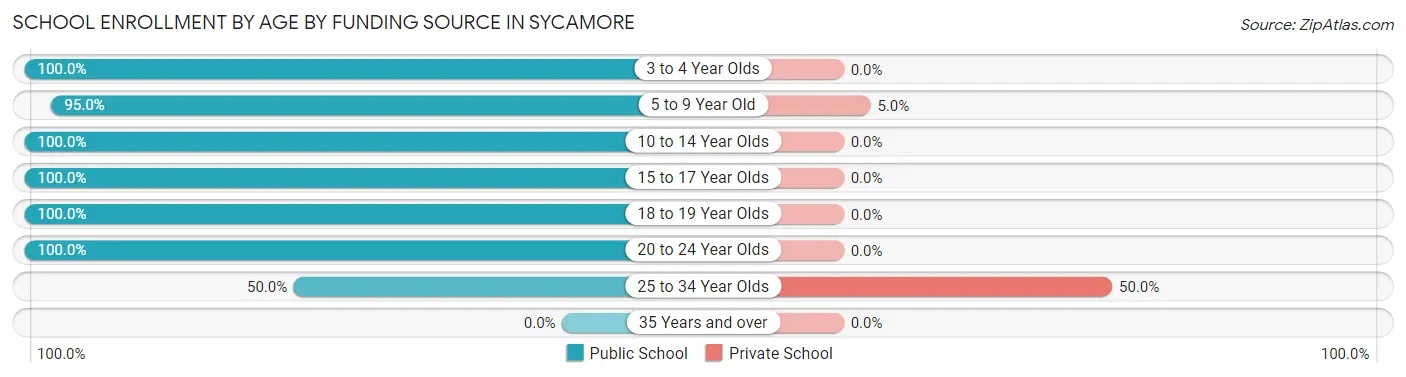
| Age Bracket | Public School | Private School |
| 3 to 4 Year Olds | 4 (100.0%) | 0 (0.0%) |
| 5 to 9 Year Old | 38 (95.0%) | 2 (5.0%) |
| 10 to 14 Year Olds | 38 (100.0%) | 0 (0.0%) |
| 15 to 17 Year Olds | 24 (100.0%) | 0 (0.0%) |
| 18 to 19 Year Olds | 7 (100.0%) | 0 (0.0%) |
| 20 to 24 Year Olds | 19 (100.0%) | 0 (0.0%) |
| 25 to 34 Year Olds | 3 (50.0%) | 3 (50.0%) |
| 35 Years and over | 0 (0.0%) | 0 (0.0%) |
| Total | 133 (96.4%) | 5 (3.6%) |
Educational Attainment by Field of Study in Sycamore
Education (35 | 37.6%), business (16 | 17.2%), science & technology (13 | 14.0%), arts & humanities (11 | 11.8%), and bio, nature & agricultural (7 | 7.5%) are the most common fields of study among 93 individuals in Sycamore who have obtained a bachelor's degree or higher.
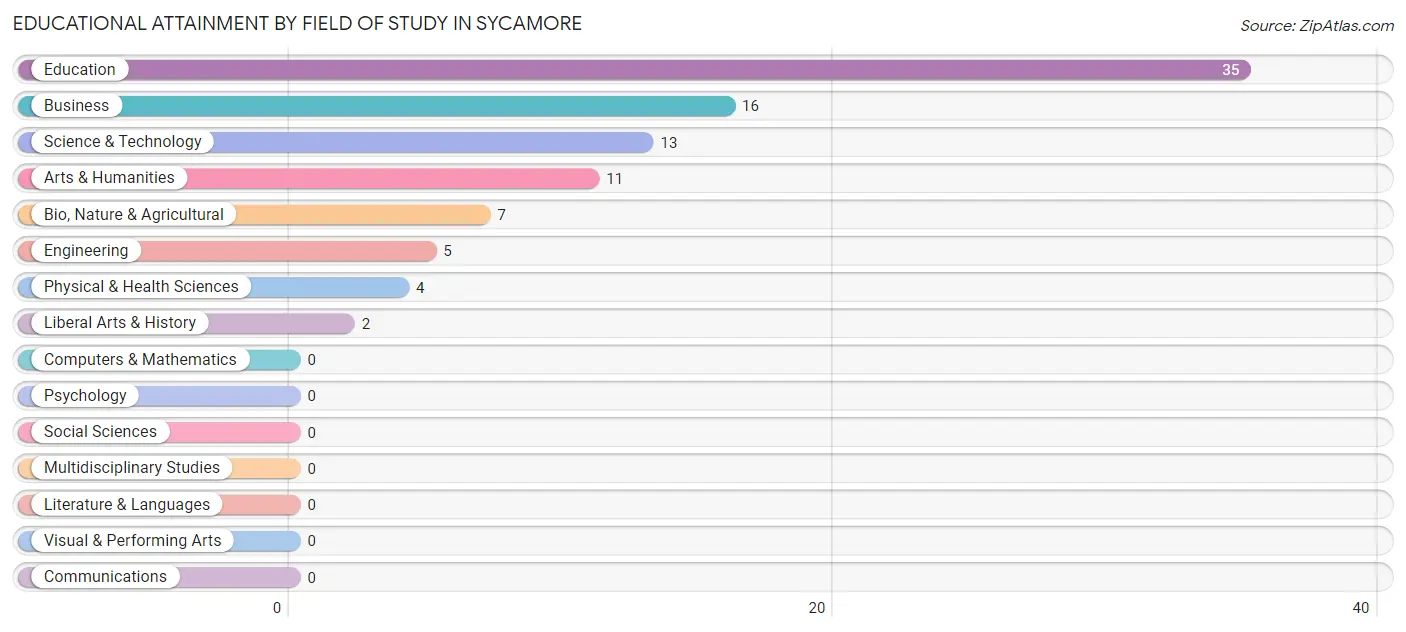
| Field of Study | # Graduates | % Graduates |
| Computers & Mathematics | 0 | 0.0% |
| Bio, Nature & Agricultural | 7 | 7.5% |
| Physical & Health Sciences | 4 | 4.3% |
| Psychology | 0 | 0.0% |
| Social Sciences | 0 | 0.0% |
| Engineering | 5 | 5.4% |
| Multidisciplinary Studies | 0 | 0.0% |
| Science & Technology | 13 | 14.0% |
| Business | 16 | 17.2% |
| Education | 35 | 37.6% |
| Literature & Languages | 0 | 0.0% |
| Liberal Arts & History | 2 | 2.1% |
| Visual & Performing Arts | 0 | 0.0% |
| Communications | 0 | 0.0% |
| Arts & Humanities | 11 | 11.8% |
| Total | 93 | 100.0% |
Transportation & Commute in Sycamore
Vehicle Availability by Sex in Sycamore
The most prevalent vehicle ownership categories in Sycamore are males with 3 vehicles (79, accounting for 38.9%) and females with 3 vehicles (68, making up 41.1%).
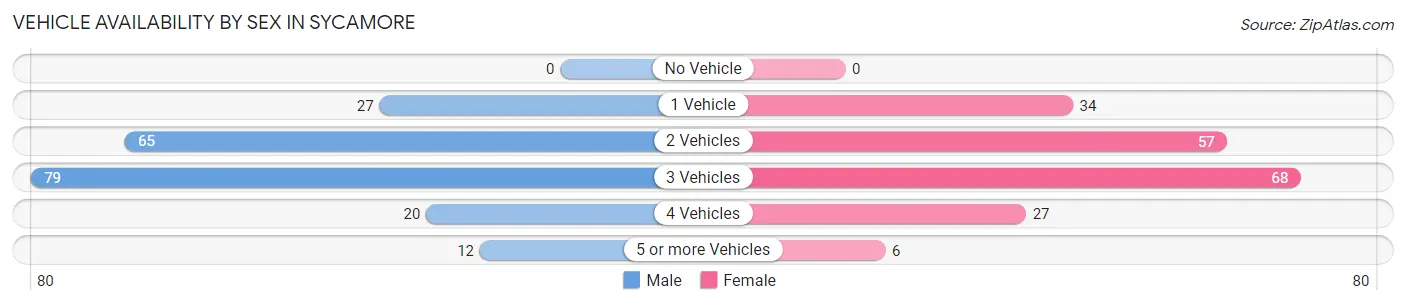
| Vehicles Available | Male | Female |
| No Vehicle | 0 (0.0%) | 0 (0.0%) |
| 1 Vehicle | 27 (13.3%) | 34 (17.7%) |
| 2 Vehicles | 65 (32.0%) | 57 (29.7%) |
| 3 Vehicles | 79 (38.9%) | 68 (35.4%) |
| 4 Vehicles | 20 (9.9%) | 27 (14.1%) |
| 5 or more Vehicles | 12 (5.9%) | 6 (3.1%) |
| Total | 203 (100.0%) | 192 (100.0%) |
Commute Time in Sycamore
The most frequently occuring commute durations in Sycamore are 20 to 24 minutes (95 commuters, 24.2%), 15 to 19 minutes (67 commuters, 17.1%), and 5 to 9 minutes (52 commuters, 13.2%).
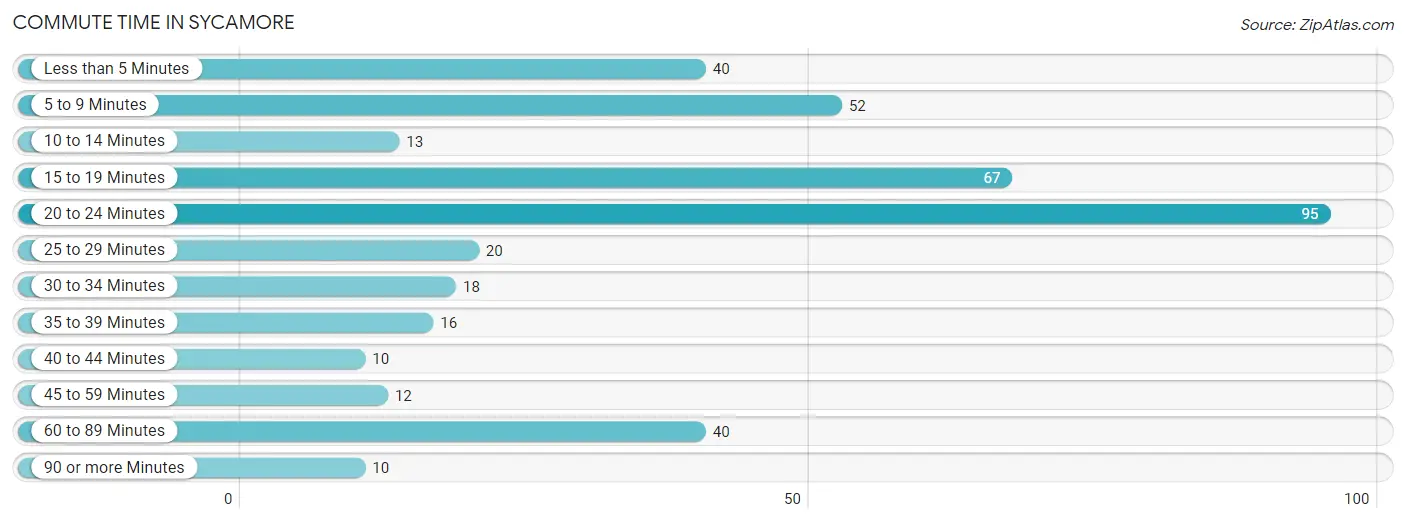
| Commute Time | # Commuters | % Commuters |
| Less than 5 Minutes | 40 | 10.2% |
| 5 to 9 Minutes | 52 | 13.2% |
| 10 to 14 Minutes | 13 | 3.3% |
| 15 to 19 Minutes | 67 | 17.1% |
| 20 to 24 Minutes | 95 | 24.2% |
| 25 to 29 Minutes | 20 | 5.1% |
| 30 to 34 Minutes | 18 | 4.6% |
| 35 to 39 Minutes | 16 | 4.1% |
| 40 to 44 Minutes | 10 | 2.5% |
| 45 to 59 Minutes | 12 | 3.0% |
| 60 to 89 Minutes | 40 | 10.2% |
| 90 or more Minutes | 10 | 2.5% |
Commute Time by Sex in Sycamore
The most common commute times in Sycamore are 20 to 24 minutes (57 commuters, 28.4%) for males and 5 to 9 minutes (42 commuters, 21.9%) for females.
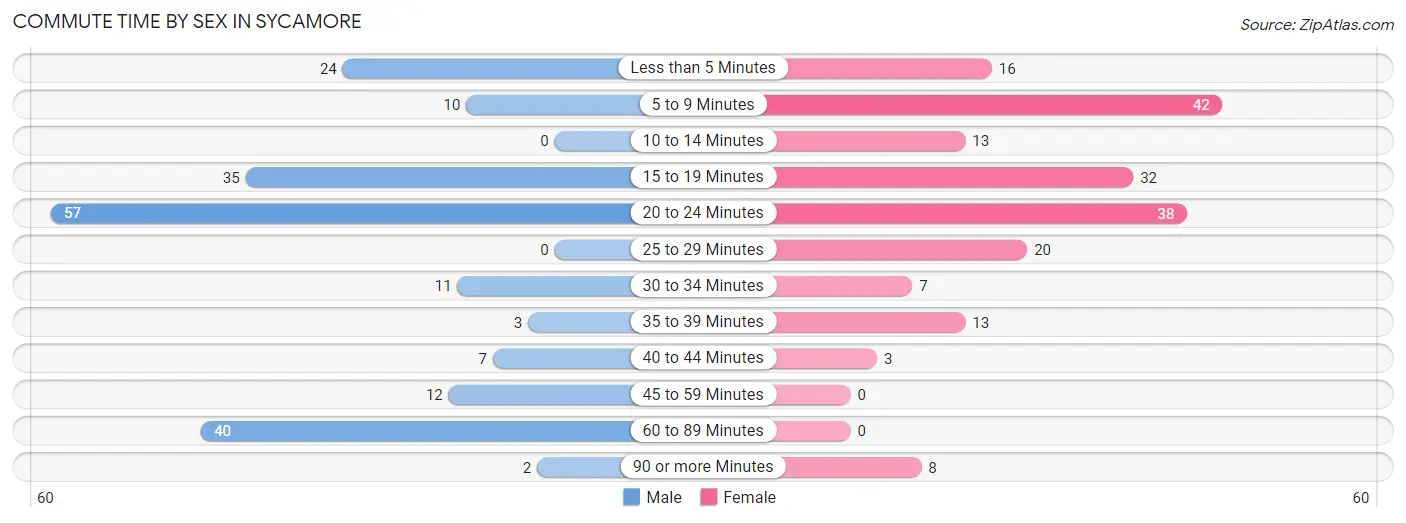
| Commute Time | Male | Female |
| Less than 5 Minutes | 24 (11.9%) | 16 (8.3%) |
| 5 to 9 Minutes | 10 (5.0%) | 42 (21.9%) |
| 10 to 14 Minutes | 0 (0.0%) | 13 (6.8%) |
| 15 to 19 Minutes | 35 (17.4%) | 32 (16.7%) |
| 20 to 24 Minutes | 57 (28.4%) | 38 (19.8%) |
| 25 to 29 Minutes | 0 (0.0%) | 20 (10.4%) |
| 30 to 34 Minutes | 11 (5.5%) | 7 (3.6%) |
| 35 to 39 Minutes | 3 (1.5%) | 13 (6.8%) |
| 40 to 44 Minutes | 7 (3.5%) | 3 (1.6%) |
| 45 to 59 Minutes | 12 (6.0%) | 0 (0.0%) |
| 60 to 89 Minutes | 40 (19.9%) | 0 (0.0%) |
| 90 or more Minutes | 2 (1.0%) | 8 (4.2%) |
Time of Departure to Work by Sex in Sycamore
The most frequent times of departure to work in Sycamore are 6:00 AM to 6:29 AM (32, 15.9%) for males and 7:00 AM to 7:29 AM (49, 25.5%) for females.
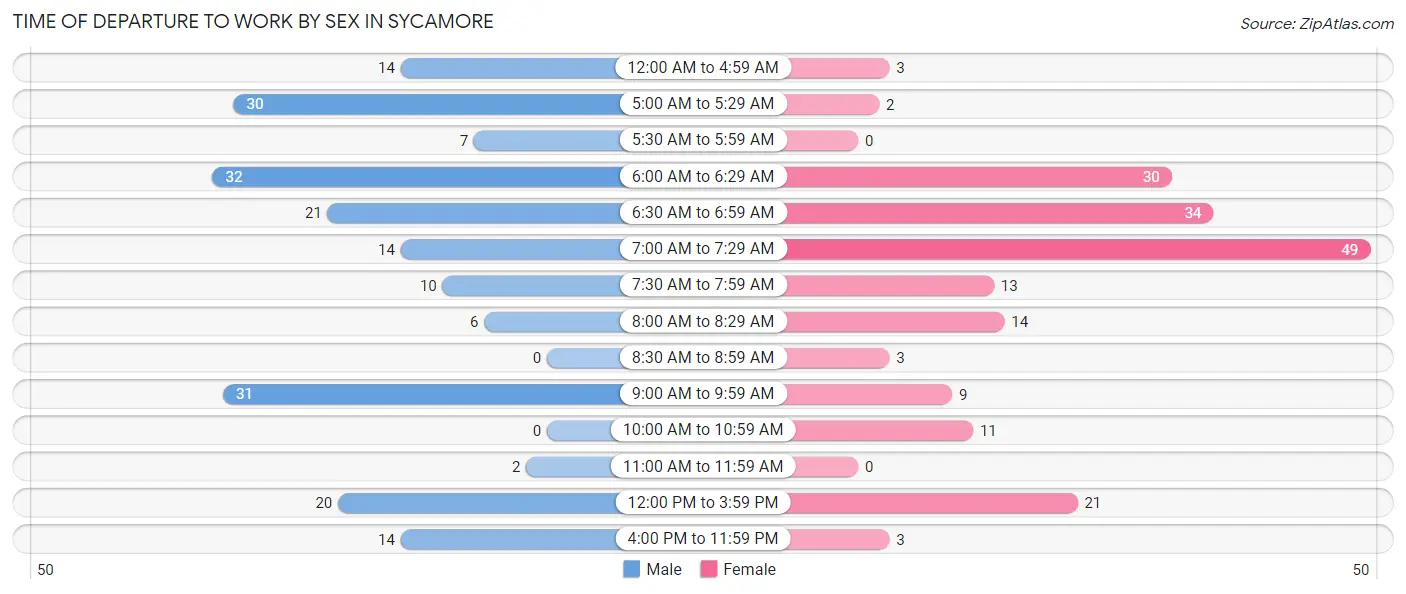
| Time of Departure | Male | Female |
| 12:00 AM to 4:59 AM | 14 (7.0%) | 3 (1.6%) |
| 5:00 AM to 5:29 AM | 30 (14.9%) | 2 (1.0%) |
| 5:30 AM to 5:59 AM | 7 (3.5%) | 0 (0.0%) |
| 6:00 AM to 6:29 AM | 32 (15.9%) | 30 (15.6%) |
| 6:30 AM to 6:59 AM | 21 (10.4%) | 34 (17.7%) |
| 7:00 AM to 7:29 AM | 14 (7.0%) | 49 (25.5%) |
| 7:30 AM to 7:59 AM | 10 (5.0%) | 13 (6.8%) |
| 8:00 AM to 8:29 AM | 6 (3.0%) | 14 (7.3%) |
| 8:30 AM to 8:59 AM | 0 (0.0%) | 3 (1.6%) |
| 9:00 AM to 9:59 AM | 31 (15.4%) | 9 (4.7%) |
| 10:00 AM to 10:59 AM | 0 (0.0%) | 11 (5.7%) |
| 11:00 AM to 11:59 AM | 2 (1.0%) | 0 (0.0%) |
| 12:00 PM to 3:59 PM | 20 (10.0%) | 21 (10.9%) |
| 4:00 PM to 11:59 PM | 14 (7.0%) | 3 (1.6%) |
| Total | 201 (100.0%) | 192 (100.0%) |
Housing Occupancy in Sycamore
Occupancy by Ownership in Sycamore
Of the total 339 dwellings in Sycamore, owner-occupied units account for 245 (72.3%), while renter-occupied units make up 94 (27.7%).
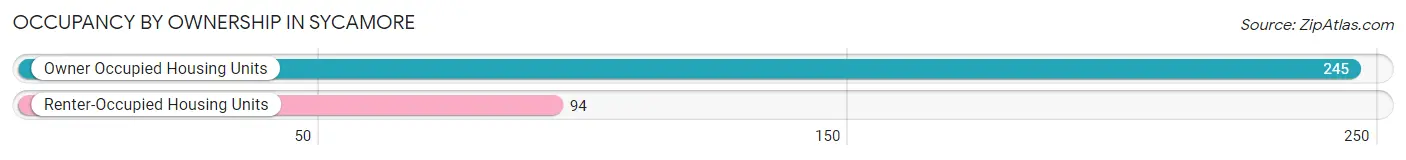
| Occupancy | # Housing Units | % Housing Units |
| Owner Occupied Housing Units | 245 | 72.3% |
| Renter-Occupied Housing Units | 94 | 27.7% |
| Total Occupied Housing Units | 339 | 100.0% |
Occupancy by Household Size in Sycamore
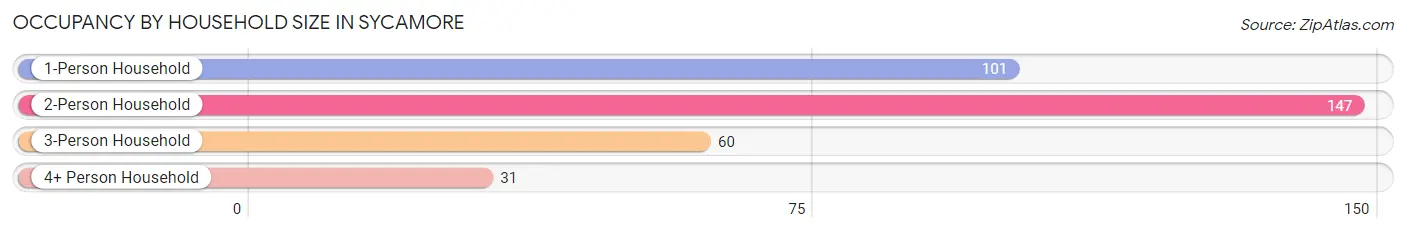
| Household Size | # Housing Units | % Housing Units |
| 1-Person Household | 101 | 29.8% |
| 2-Person Household | 147 | 43.4% |
| 3-Person Household | 60 | 17.7% |
| 4+ Person Household | 31 | 9.1% |
| Total Housing Units | 339 | 100.0% |
Occupancy by Ownership by Household Size in Sycamore
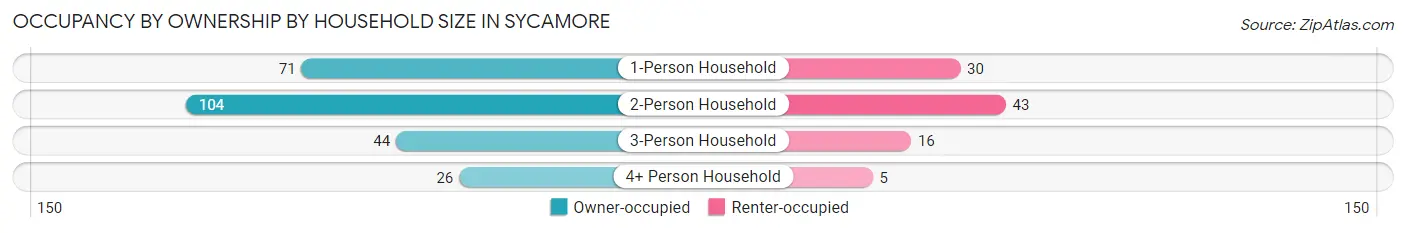
| Household Size | Owner-occupied | Renter-occupied |
| 1-Person Household | 71 (70.3%) | 30 (29.7%) |
| 2-Person Household | 104 (70.8%) | 43 (29.2%) |
| 3-Person Household | 44 (73.3%) | 16 (26.7%) |
| 4+ Person Household | 26 (83.9%) | 5 (16.1%) |
| Total Housing Units | 245 (72.3%) | 94 (27.7%) |
Occupancy by Educational Attainment in Sycamore
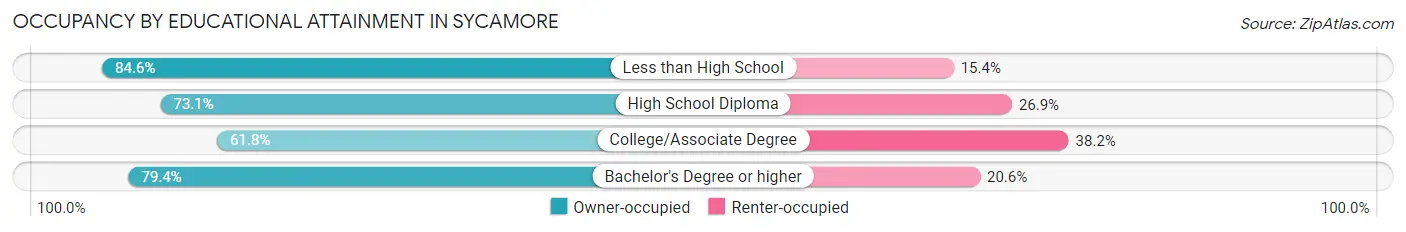
| Household Size | Owner-occupied | Renter-occupied |
| Less than High School | 11 (84.6%) | 2 (15.4%) |
| High School Diploma | 133 (73.1%) | 49 (26.9%) |
| College/Associate Degree | 47 (61.8%) | 29 (38.2%) |
| Bachelor's Degree or higher | 54 (79.4%) | 14 (20.6%) |
Occupancy by Age of Householder in Sycamore
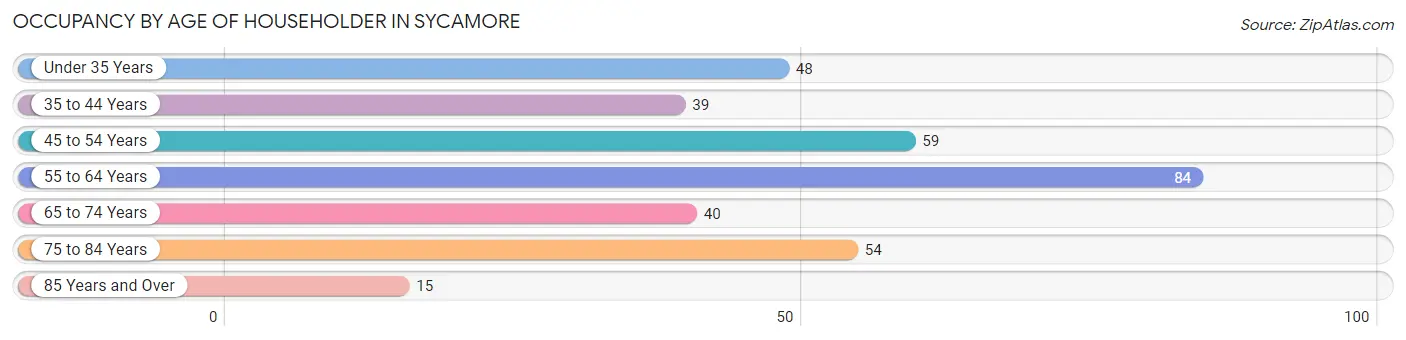
| Age Bracket | # Households | % Households |
| Under 35 Years | 48 | 14.2% |
| 35 to 44 Years | 39 | 11.5% |
| 45 to 54 Years | 59 | 17.4% |
| 55 to 64 Years | 84 | 24.8% |
| 65 to 74 Years | 40 | 11.8% |
| 75 to 84 Years | 54 | 15.9% |
| 85 Years and Over | 15 | 4.4% |
| Total | 339 | 100.0% |
Housing Finances in Sycamore
Median Income by Occupancy in Sycamore
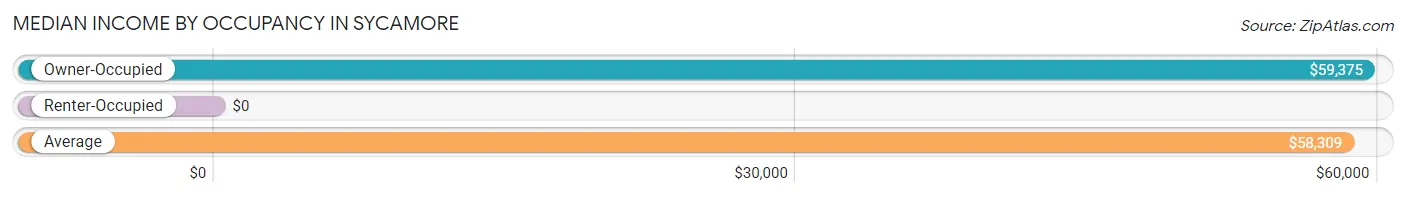
| Occupancy Type | # Households | Median Income |
| Owner-Occupied | 245 (72.3%) | $59,375 |
| Renter-Occupied | 94 (27.7%) | $0 |
| Average | 339 (100.0%) | $58,309 |
Occupancy by Householder Income Bracket in Sycamore
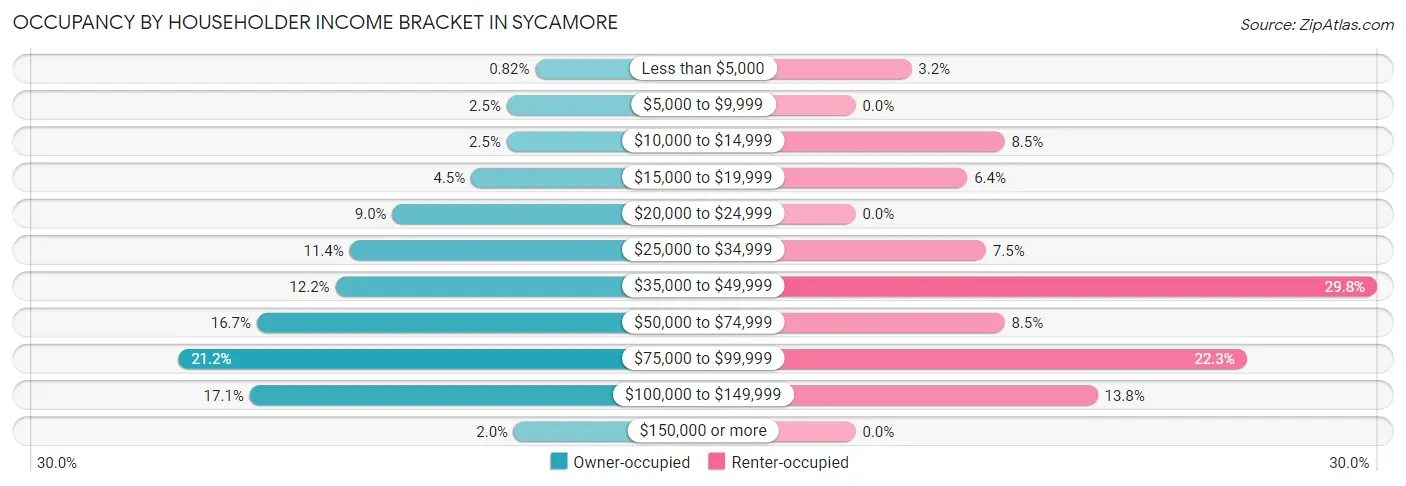
| Income Bracket | Owner-occupied | Renter-occupied |
| Less than $5,000 | 2 (0.8%) | 3 (3.2%) |
| $5,000 to $9,999 | 6 (2.5%) | 0 (0.0%) |
| $10,000 to $14,999 | 6 (2.5%) | 8 (8.5%) |
| $15,000 to $19,999 | 11 (4.5%) | 6 (6.4%) |
| $20,000 to $24,999 | 22 (9.0%) | 0 (0.0%) |
| $25,000 to $34,999 | 28 (11.4%) | 7 (7.4%) |
| $35,000 to $49,999 | 30 (12.2%) | 28 (29.8%) |
| $50,000 to $74,999 | 41 (16.7%) | 8 (8.5%) |
| $75,000 to $99,999 | 52 (21.2%) | 21 (22.3%) |
| $100,000 to $149,999 | 42 (17.1%) | 13 (13.8%) |
| $150,000 or more | 5 (2.0%) | 0 (0.0%) |
| Total | 245 (100.0%) | 94 (100.0%) |
Monthly Housing Cost Tiers in Sycamore
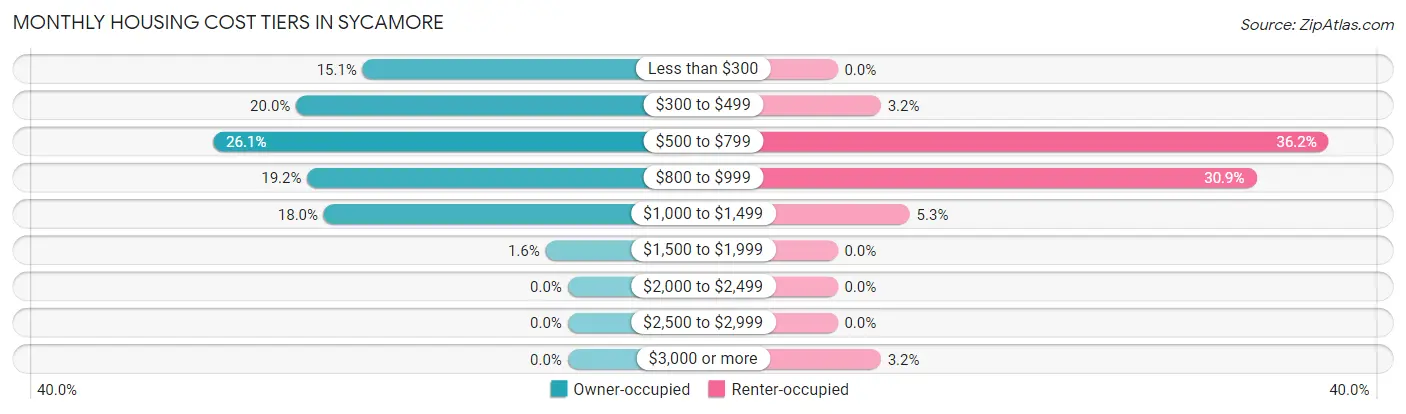
| Monthly Cost | Owner-occupied | Renter-occupied |
| Less than $300 | 37 (15.1%) | 0 (0.0%) |
| $300 to $499 | 49 (20.0%) | 3 (3.2%) |
| $500 to $799 | 64 (26.1%) | 34 (36.2%) |
| $800 to $999 | 47 (19.2%) | 29 (30.8%) |
| $1,000 to $1,499 | 44 (18.0%) | 5 (5.3%) |
| $1,500 to $1,999 | 4 (1.6%) | 0 (0.0%) |
| $2,000 to $2,499 | 0 (0.0%) | 0 (0.0%) |
| $2,500 to $2,999 | 0 (0.0%) | 0 (0.0%) |
| $3,000 or more | 0 (0.0%) | 3 (3.2%) |
| Total | 245 (100.0%) | 94 (100.0%) |
Physical Housing Characteristics in Sycamore
Housing Structures in Sycamore
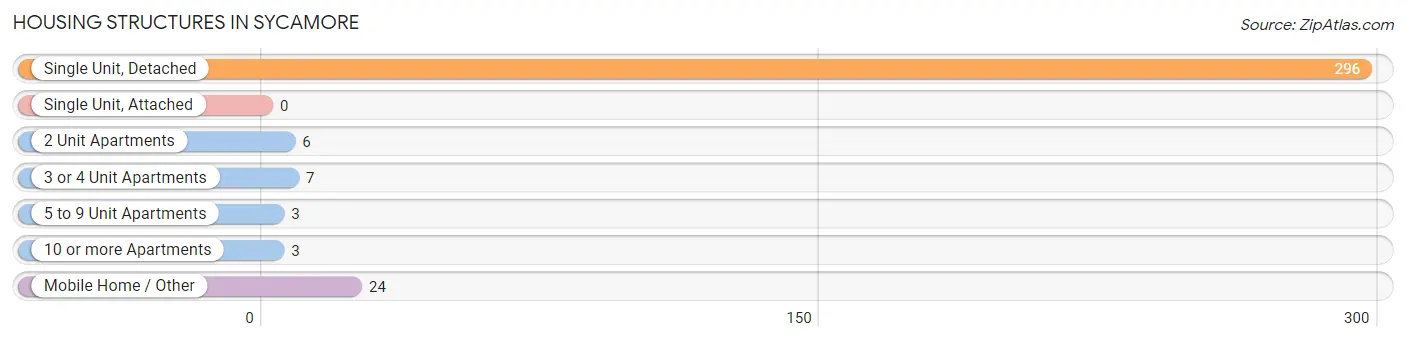
| Structure Type | # Housing Units | % Housing Units |
| Single Unit, Detached | 296 | 87.3% |
| Single Unit, Attached | 0 | 0.0% |
| 2 Unit Apartments | 6 | 1.8% |
| 3 or 4 Unit Apartments | 7 | 2.1% |
| 5 to 9 Unit Apartments | 3 | 0.9% |
| 10 or more Apartments | 3 | 0.9% |
| Mobile Home / Other | 24 | 7.1% |
| Total | 339 | 100.0% |
Housing Structures by Occupancy in Sycamore
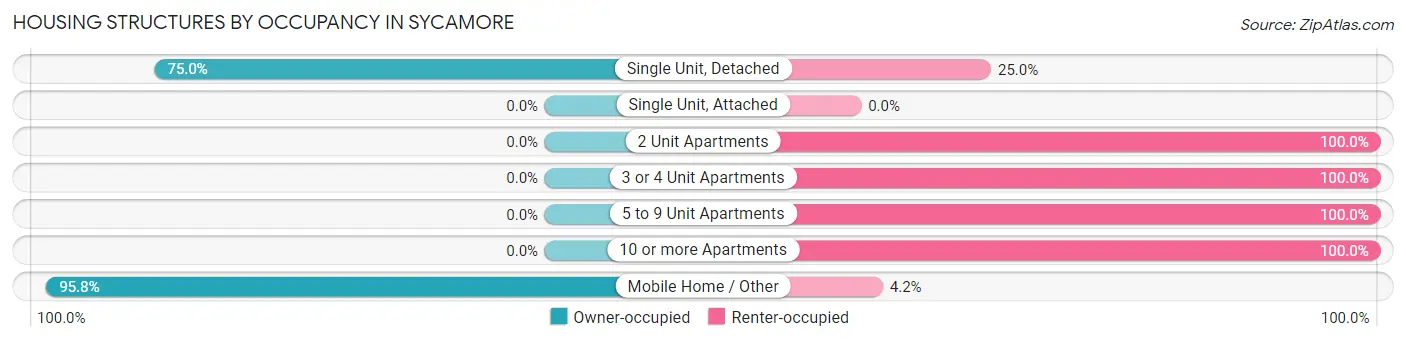
| Structure Type | Owner-occupied | Renter-occupied |
| Single Unit, Detached | 222 (75.0%) | 74 (25.0%) |
| Single Unit, Attached | 0 (0.0%) | 0 (0.0%) |
| 2 Unit Apartments | 0 (0.0%) | 6 (100.0%) |
| 3 or 4 Unit Apartments | 0 (0.0%) | 7 (100.0%) |
| 5 to 9 Unit Apartments | 0 (0.0%) | 3 (100.0%) |
| 10 or more Apartments | 0 (0.0%) | 3 (100.0%) |
| Mobile Home / Other | 23 (95.8%) | 1 (4.2%) |
| Total | 245 (72.3%) | 94 (27.7%) |
Housing Structures by Number of Rooms in Sycamore
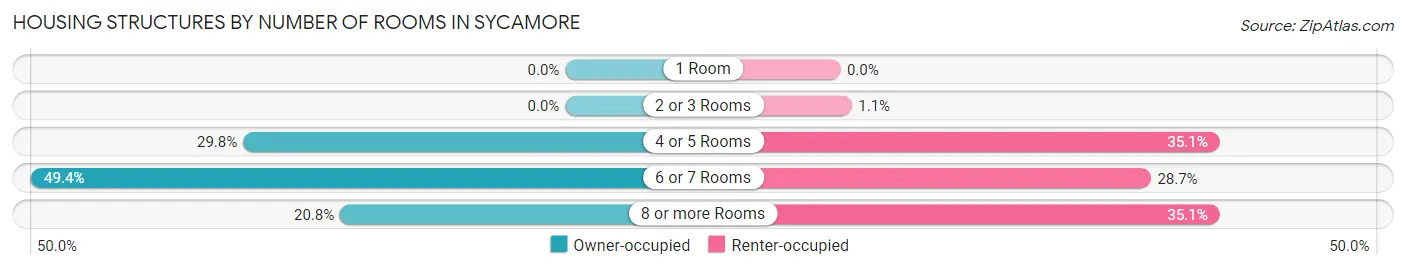
| Number of Rooms | Owner-occupied | Renter-occupied |
| 1 Room | 0 (0.0%) | 0 (0.0%) |
| 2 or 3 Rooms | 0 (0.0%) | 1 (1.1%) |
| 4 or 5 Rooms | 73 (29.8%) | 33 (35.1%) |
| 6 or 7 Rooms | 121 (49.4%) | 27 (28.7%) |
| 8 or more Rooms | 51 (20.8%) | 33 (35.1%) |
| Total | 245 (100.0%) | 94 (100.0%) |
Housing Structure by Heating Type in Sycamore
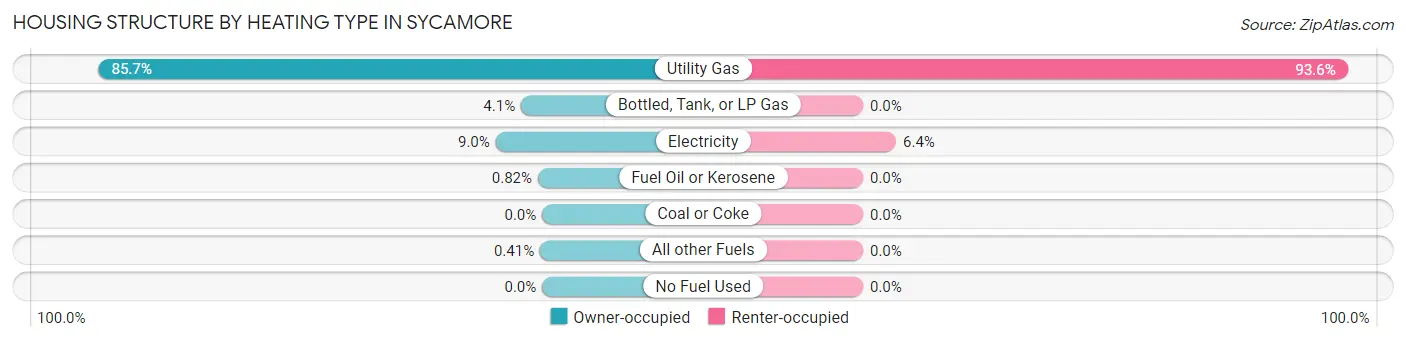
| Heating Type | Owner-occupied | Renter-occupied |
| Utility Gas | 210 (85.7%) | 88 (93.6%) |
| Bottled, Tank, or LP Gas | 10 (4.1%) | 0 (0.0%) |
| Electricity | 22 (9.0%) | 6 (6.4%) |
| Fuel Oil or Kerosene | 2 (0.8%) | 0 (0.0%) |
| Coal or Coke | 0 (0.0%) | 0 (0.0%) |
| All other Fuels | 1 (0.4%) | 0 (0.0%) |
| No Fuel Used | 0 (0.0%) | 0 (0.0%) |
| Total | 245 (100.0%) | 94 (100.0%) |
Household Vehicle Usage in Sycamore
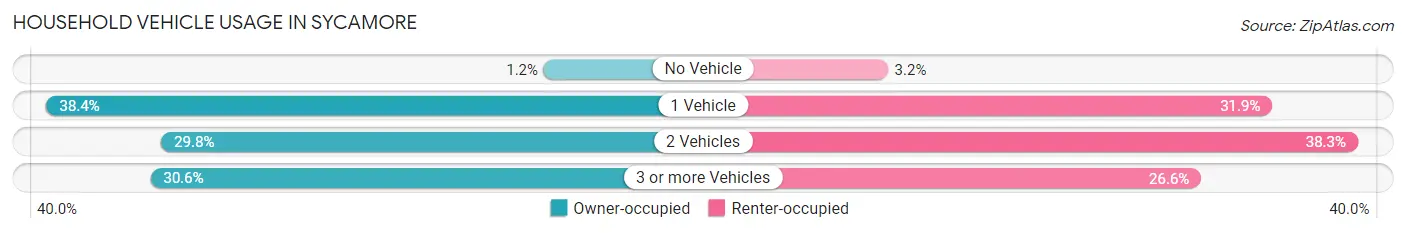
| Vehicles per Household | Owner-occupied | Renter-occupied |
| No Vehicle | 3 (1.2%) | 3 (3.2%) |
| 1 Vehicle | 94 (38.4%) | 30 (31.9%) |
| 2 Vehicles | 73 (29.8%) | 36 (38.3%) |
| 3 or more Vehicles | 75 (30.6%) | 25 (26.6%) |
| Total | 245 (100.0%) | 94 (100.0%) |
Real Estate & Mortgages in Sycamore
Real Estate and Mortgage Overview in Sycamore
| Characteristic | Without Mortgage | With Mortgage |
| Housing Units | 103 | 142 |
| Median Property Value | $96,300 | $94,800 |
| Median Household Income | $33,750 | $2 |
| Monthly Housing Costs | $352 | $0 |
| Real Estate Taxes | $686 | $4 |
Property Value by Mortgage Status in Sycamore
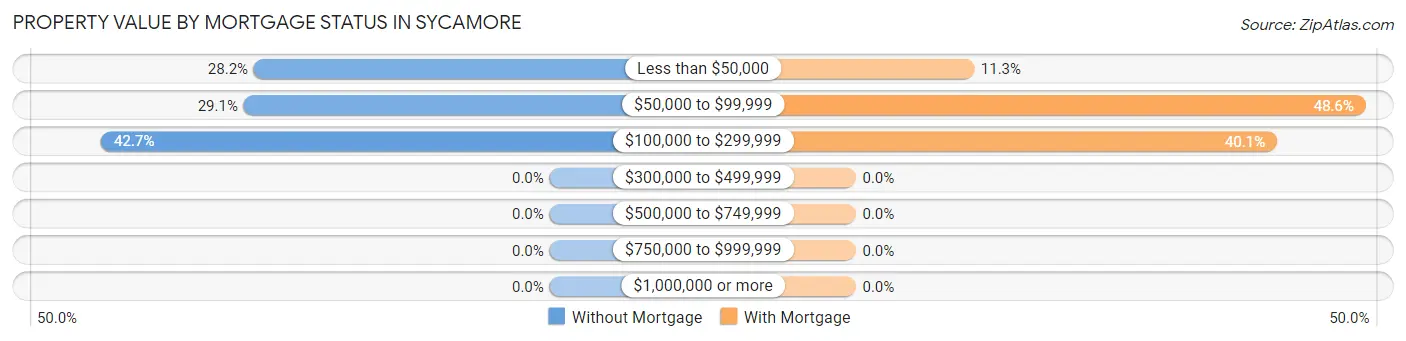
| Property Value | Without Mortgage | With Mortgage |
| Less than $50,000 | 29 (28.2%) | 16 (11.3%) |
| $50,000 to $99,999 | 30 (29.1%) | 69 (48.6%) |
| $100,000 to $299,999 | 44 (42.7%) | 57 (40.1%) |
| $300,000 to $499,999 | 0 (0.0%) | 0 (0.0%) |
| $500,000 to $749,999 | 0 (0.0%) | 0 (0.0%) |
| $750,000 to $999,999 | 0 (0.0%) | 0 (0.0%) |
| $1,000,000 or more | 0 (0.0%) | 0 (0.0%) |
| Total | 103 (100.0%) | 142 (100.0%) |
Household Income by Mortgage Status in Sycamore
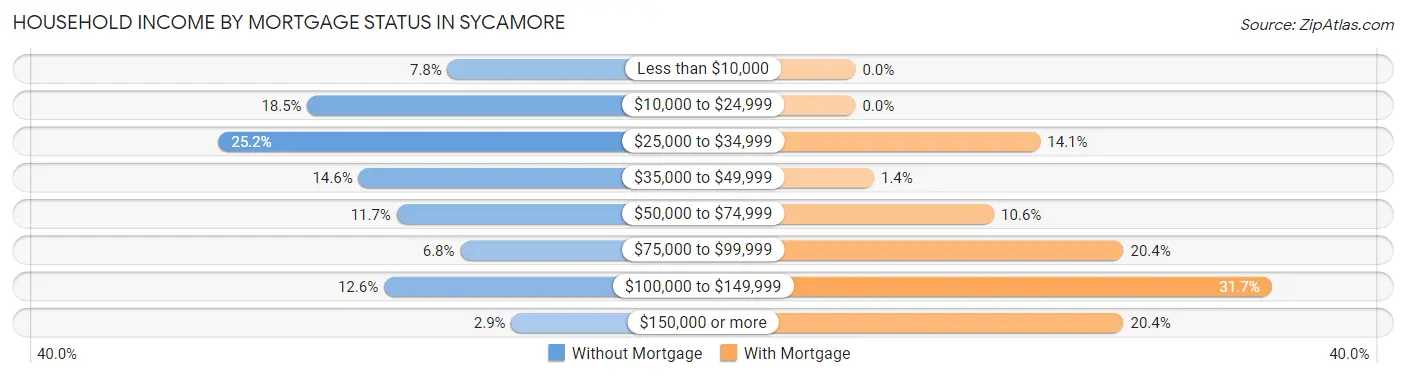
| Household Income | Without Mortgage | With Mortgage |
| Less than $10,000 | 8 (7.8%) | 0 (0.0%) |
| $10,000 to $24,999 | 19 (18.4%) | 0 (0.0%) |
| $25,000 to $34,999 | 26 (25.2%) | 20 (14.1%) |
| $35,000 to $49,999 | 15 (14.6%) | 2 (1.4%) |
| $50,000 to $74,999 | 12 (11.7%) | 15 (10.6%) |
| $75,000 to $99,999 | 7 (6.8%) | 29 (20.4%) |
| $100,000 to $149,999 | 13 (12.6%) | 45 (31.7%) |
| $150,000 or more | 3 (2.9%) | 29 (20.4%) |
| Total | 103 (100.0%) | 142 (100.0%) |
Property Value to Household Income Ratio in Sycamore
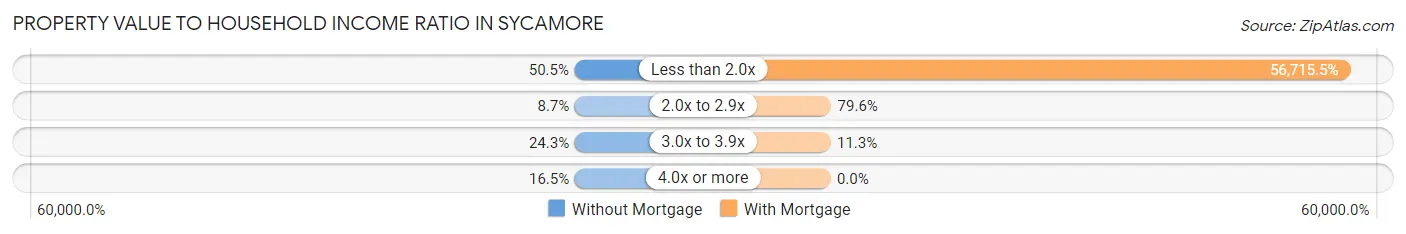
| Value-to-Income Ratio | Without Mortgage | With Mortgage |
| Less than 2.0x | 52 (50.5%) | 80,536 (56,715.5%) |
| 2.0x to 2.9x | 9 (8.7%) | 113 (79.6%) |
| 3.0x to 3.9x | 25 (24.3%) | 16 (11.3%) |
| 4.0x or more | 17 (16.5%) | 0 (0.0%) |
| Total | 103 (100.0%) | 142 (100.0%) |
Real Estate Taxes by Mortgage Status in Sycamore
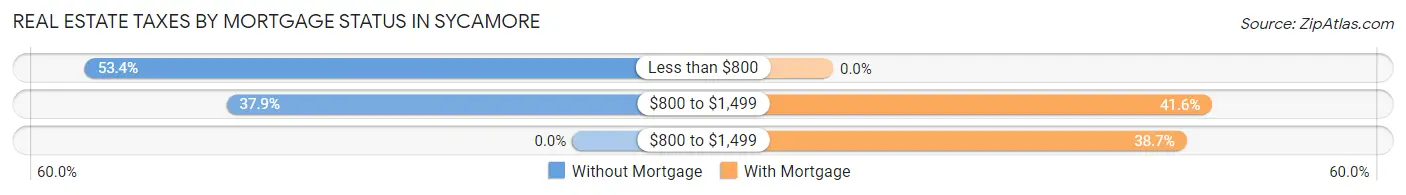
| Property Taxes | Without Mortgage | With Mortgage |
| Less than $800 | 55 (53.4%) | 0 (0.0%) |
| $800 to $1,499 | 39 (37.9%) | 59 (41.5%) |
| $800 to $1,499 | 0 (0.0%) | 55 (38.7%) |
| Total | 103 (100.0%) | 142 (100.0%) |
Health & Disability in Sycamore
Health Insurance Coverage by Age in Sycamore
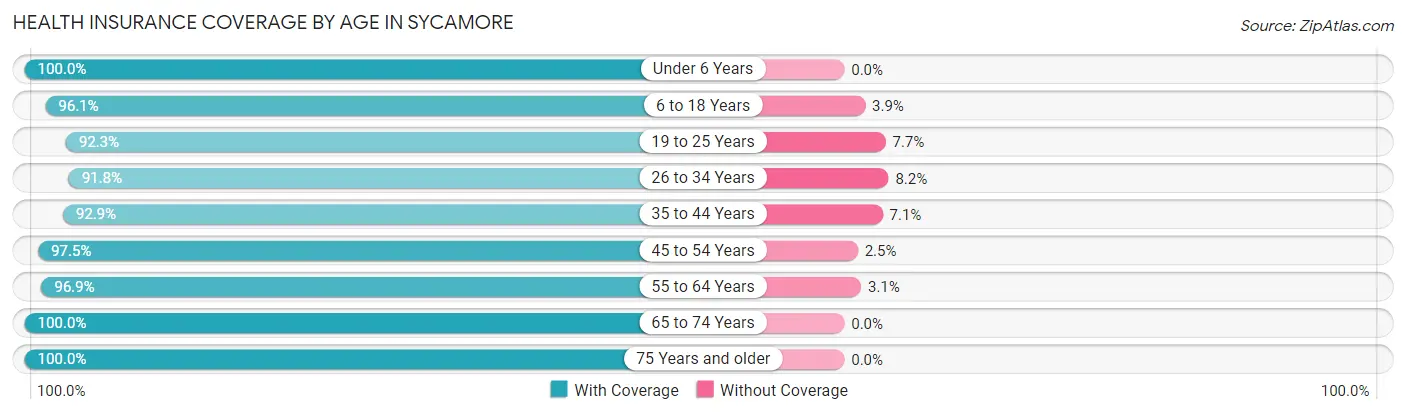
| Age Bracket | With Coverage | Without Coverage |
| Under 6 Years | 21 (100.0%) | 0 (0.0%) |
| 6 to 18 Years | 99 (96.1%) | 4 (3.9%) |
| 19 to 25 Years | 48 (92.3%) | 4 (7.7%) |
| 26 to 34 Years | 78 (91.8%) | 7 (8.2%) |
| 35 to 44 Years | 78 (92.9%) | 6 (7.1%) |
| 45 to 54 Years | 78 (97.5%) | 2 (2.5%) |
| 55 to 64 Years | 124 (96.9%) | 4 (3.1%) |
| 65 to 74 Years | 84 (100.0%) | 0 (0.0%) |
| 75 Years and older | 96 (100.0%) | 0 (0.0%) |
| Total | 706 (96.3%) | 27 (3.7%) |
Health Insurance Coverage by Citizenship Status in Sycamore
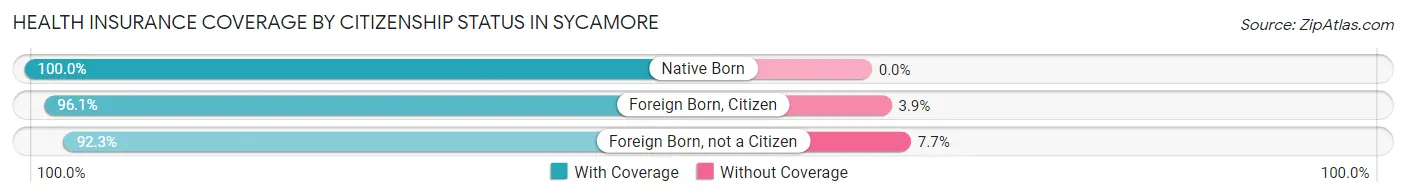
| Citizenship Status | With Coverage | Without Coverage |
| Native Born | 21 (100.0%) | 0 (0.0%) |
| Foreign Born, Citizen | 99 (96.1%) | 4 (3.9%) |
| Foreign Born, not a Citizen | 48 (92.3%) | 4 (7.7%) |
Health Insurance Coverage by Household Income in Sycamore
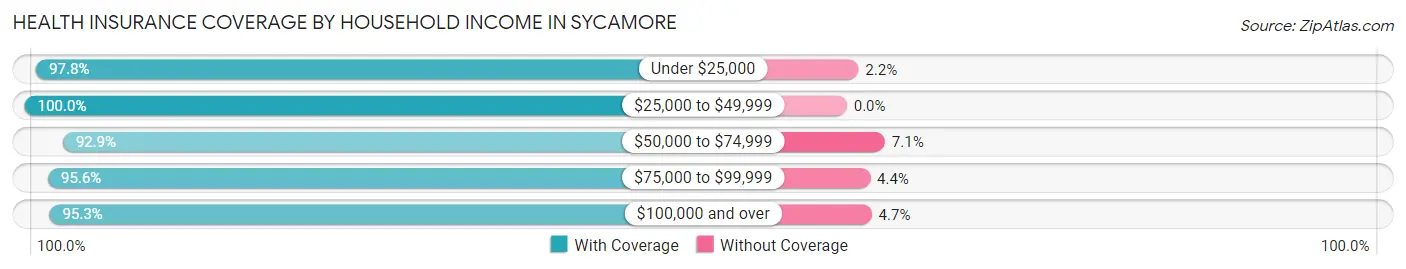
| Household Income | With Coverage | Without Coverage |
| Under $25,000 | 90 (97.8%) | 2 (2.2%) |
| $25,000 to $49,999 | 153 (100.0%) | 0 (0.0%) |
| $50,000 to $74,999 | 104 (92.9%) | 8 (7.1%) |
| $75,000 to $99,999 | 175 (95.6%) | 8 (4.4%) |
| $100,000 and over | 184 (95.3%) | 9 (4.7%) |
Public vs Private Health Insurance Coverage by Age in Sycamore
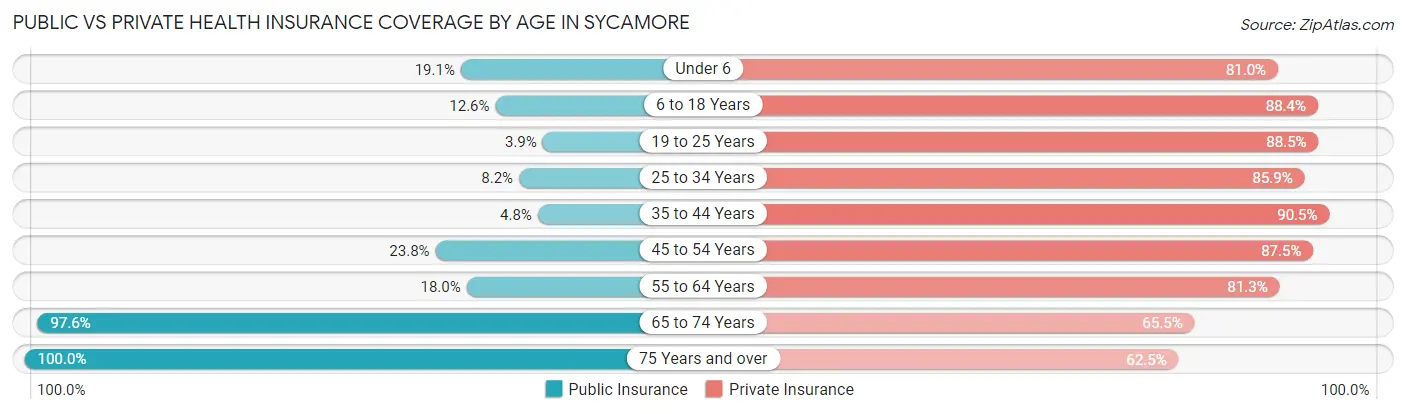
| Age Bracket | Public Insurance | Private Insurance |
| Under 6 | 4 (19.1%) | 17 (80.9%) |
| 6 to 18 Years | 13 (12.6%) | 91 (88.3%) |
| 19 to 25 Years | 2 (3.8%) | 46 (88.5%) |
| 25 to 34 Years | 7 (8.2%) | 73 (85.9%) |
| 35 to 44 Years | 4 (4.8%) | 76 (90.5%) |
| 45 to 54 Years | 19 (23.7%) | 70 (87.5%) |
| 55 to 64 Years | 23 (18.0%) | 104 (81.2%) |
| 65 to 74 Years | 82 (97.6%) | 55 (65.5%) |
| 75 Years and over | 96 (100.0%) | 60 (62.5%) |
| Total | 250 (34.1%) | 592 (80.8%) |
Disability Status by Sex by Age in Sycamore
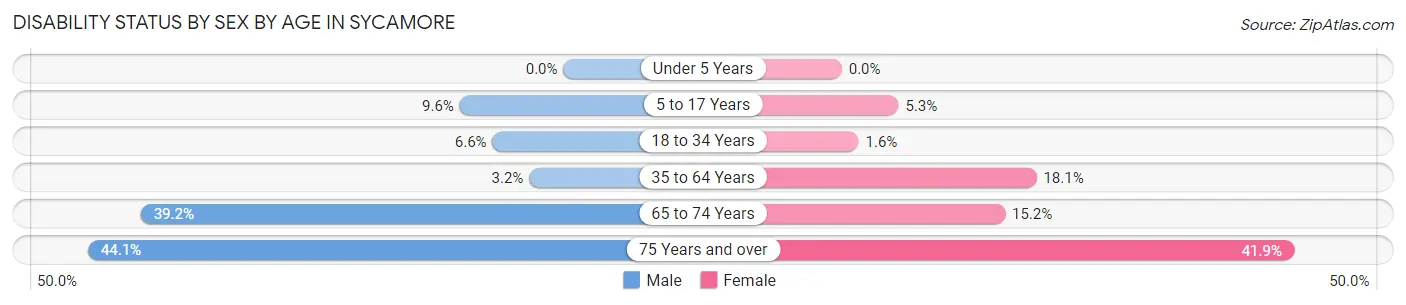
| Age Bracket | Male | Female |
| Under 5 Years | 0 (0.0%) | 0 (0.0%) |
| 5 to 17 Years | 5 (9.6%) | 3 (5.3%) |
| 18 to 34 Years | 5 (6.6%) | 1 (1.6%) |
| 35 to 64 Years | 4 (3.2%) | 30 (18.1%) |
| 65 to 74 Years | 20 (39.2%) | 5 (15.1%) |
| 75 Years and over | 15 (44.1%) | 26 (41.9%) |
Disability Class by Sex by Age in Sycamore
Disability Class: Hearing Difficulty
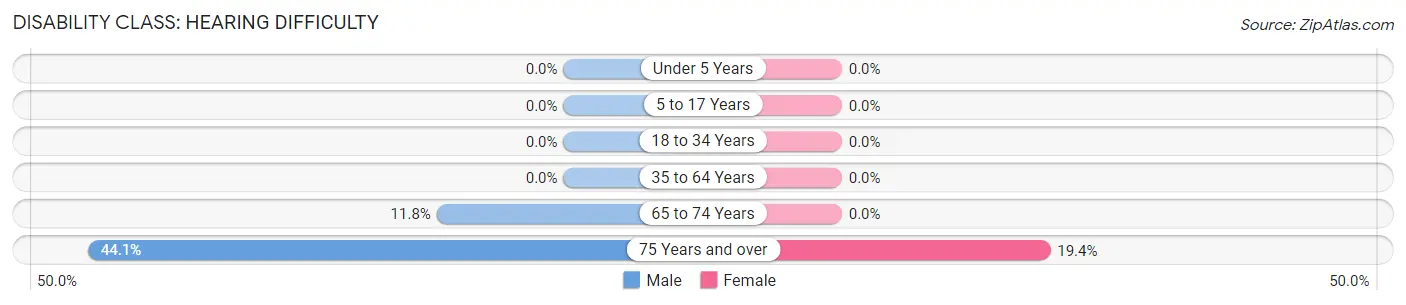
| Age Bracket | Male | Female |
| Under 5 Years | 0 (0.0%) | 0 (0.0%) |
| 5 to 17 Years | 0 (0.0%) | 0 (0.0%) |
| 18 to 34 Years | 0 (0.0%) | 0 (0.0%) |
| 35 to 64 Years | 0 (0.0%) | 0 (0.0%) |
| 65 to 74 Years | 6 (11.8%) | 0 (0.0%) |
| 75 Years and over | 15 (44.1%) | 12 (19.4%) |
Disability Class: Vision Difficulty

| Age Bracket | Male | Female |
| Under 5 Years | 0 (0.0%) | 0 (0.0%) |
| 5 to 17 Years | 0 (0.0%) | 0 (0.0%) |
| 18 to 34 Years | 2 (2.6%) | 1 (1.6%) |
| 35 to 64 Years | 2 (1.6%) | 4 (2.4%) |
| 65 to 74 Years | 2 (3.9%) | 0 (0.0%) |
| 75 Years and over | 11 (32.4%) | 0 (0.0%) |
Disability Class: Cognitive Difficulty
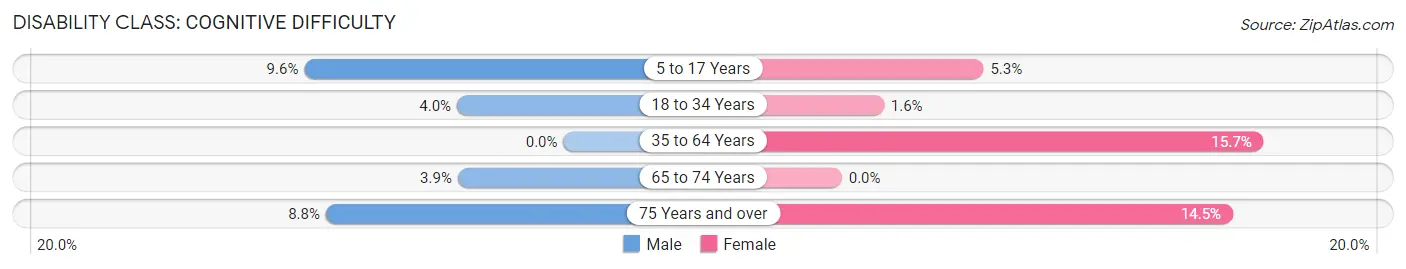
| Age Bracket | Male | Female |
| 5 to 17 Years | 5 (9.6%) | 3 (5.3%) |
| 18 to 34 Years | 3 (4.0%) | 1 (1.6%) |
| 35 to 64 Years | 0 (0.0%) | 26 (15.7%) |
| 65 to 74 Years | 2 (3.9%) | 0 (0.0%) |
| 75 Years and over | 3 (8.8%) | 9 (14.5%) |
Disability Class: Ambulatory Difficulty
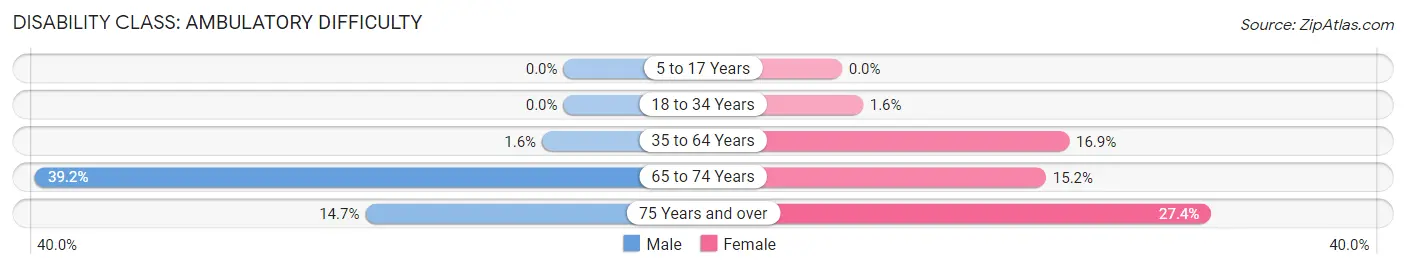
| Age Bracket | Male | Female |
| 5 to 17 Years | 0 (0.0%) | 0 (0.0%) |
| 18 to 34 Years | 0 (0.0%) | 1 (1.6%) |
| 35 to 64 Years | 2 (1.6%) | 28 (16.9%) |
| 65 to 74 Years | 20 (39.2%) | 5 (15.1%) |
| 75 Years and over | 5 (14.7%) | 17 (27.4%) |
Disability Class: Self-Care Difficulty
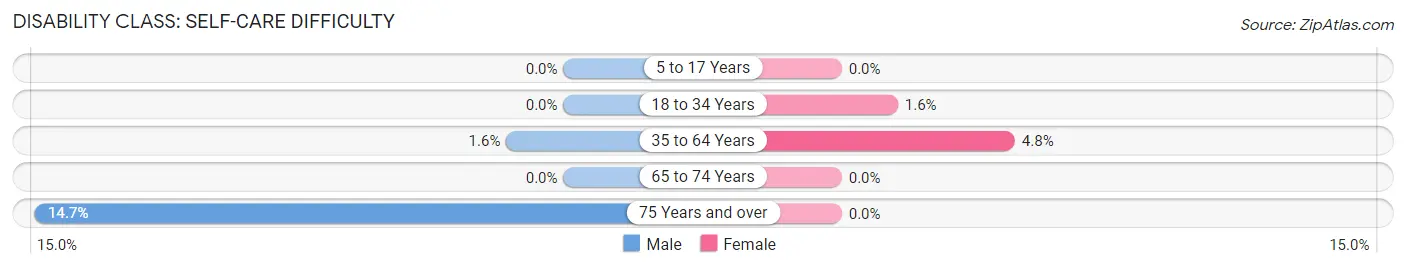
| Age Bracket | Male | Female |
| 5 to 17 Years | 0 (0.0%) | 0 (0.0%) |
| 18 to 34 Years | 0 (0.0%) | 1 (1.6%) |
| 35 to 64 Years | 2 (1.6%) | 8 (4.8%) |
| 65 to 74 Years | 0 (0.0%) | 0 (0.0%) |
| 75 Years and over | 5 (14.7%) | 0 (0.0%) |
Technology Access in Sycamore
Computing Device Access in Sycamore
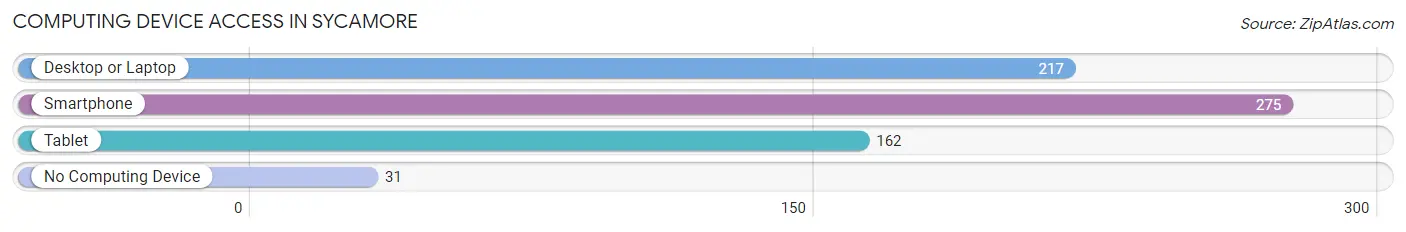
| Device Type | # Households | % Households |
| Desktop or Laptop | 217 | 64.0% |
| Smartphone | 275 | 81.1% |
| Tablet | 162 | 47.8% |
| No Computing Device | 31 | 9.1% |
| Total | 339 | 100.0% |
Internet Access in Sycamore
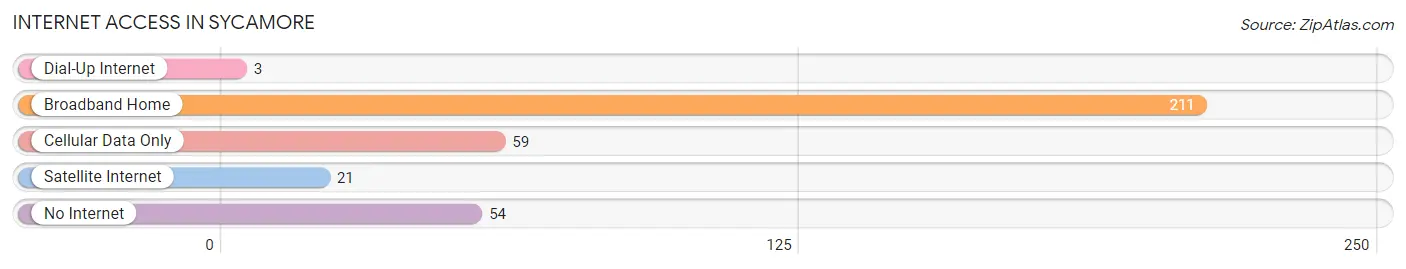
| Internet Type | # Households | % Households |
| Dial-Up Internet | 3 | 0.9% |
| Broadband Home | 211 | 62.2% |
| Cellular Data Only | 59 | 17.4% |
| Satellite Internet | 21 | 6.2% |
| No Internet | 54 | 15.9% |
| Total | 339 | 100.0% |
Sycamore Summary
Sycamore, Ohio is a small village located in Wyandot County, Ohio. It is situated on the banks of the Sandusky River, approximately 30 miles northwest of the city of Findlay. The village has a population of approximately 1,000 people and is part of the Upper Sandusky Micropolitan Statistical Area.
History
The area that is now Sycamore was first settled in 1817 by a group of settlers from Pennsylvania. The village was originally known as “Sycamore Mills” and was named after the sycamore trees that grew along the banks of the Sandusky River. The village was officially incorporated in 1837 and was the first village in Wyandot County.
In the early years, Sycamore was a thriving agricultural community. The village was home to several mills, including a grist mill, a saw mill, and a woolen mill. The village also had a blacksmith shop, a general store, and a post office.
In the late 19th century, Sycamore began to experience a period of growth and development. The village was connected to the outside world by the Toledo, St. Louis and Kansas City Railroad in 1881. This allowed for the shipment of goods and services to and from the village. In addition, the village was home to several businesses, including a furniture factory, a brickyard, and a canning factory.
Geography
Sycamore is located in Wyandot County, Ohio. The village is situated on the banks of the Sandusky River, approximately 30 miles northwest of the city of Findlay. The village has a total area of 0.6 square miles, all of which is land.
The village is located in a rural area and is surrounded by farmland. The nearest major city is Findlay, which is approximately 30 miles to the southeast. The nearest interstate highway is Interstate 75, which is approximately 25 miles to the east.
Economy
The economy of Sycamore is largely based on agriculture. The village is home to several farms, which produce a variety of crops, including corn, soybeans, and wheat. In addition, the village is home to several businesses, including a furniture factory, a brickyard, and a canning factory.
The village is also home to several small businesses, including restaurants, shops, and other services. The village is also home to a branch of the Wyandot County Bank.
Demographics
As of the 2010 census, the population of Sycamore was 1,000. The racial makeup of the village was 97.7% White, 0.3% African American, 0.2% Native American, 0.2% Asian, 0.1% from other races, and 1.5% from two or more races. Hispanic or Latino of any race were 0.7% of the population.
The median household income in Sycamore was $41,250, and the median family income was $48,750. The per capita income for the village was $19,945. About 8.3% of families and 10.2% of the population were below the poverty line, including 14.3% of those under age 18 and 6.3% of those age 65 or over.
Common Questions
What is Per Capita Income in Sycamore?
Per Capita income in Sycamore is $29,731.
What is the Median Family Income in Sycamore?
Median Family Income in Sycamore is $68,542.
What is the Median Household income in Sycamore?
Median Household Income in Sycamore is $58,309.
What is Income or Wage Gap in Sycamore?
Income or Wage Gap in Sycamore is 52.8%.
Women in Sycamore earn 47.2 cents for every dollar earned by a man.
What is Inequality or Gini Index in Sycamore?
Inequality or Gini Index in Sycamore is 0.35.
What is the Total Population of Sycamore?
Total Population of Sycamore is 733.
What is the Total Male Population of Sycamore?
Total Male Population of Sycamore is 341.
What is the Total Female Population of Sycamore?
Total Female Population of Sycamore is 392.
What is the Ratio of Males per 100 Females in Sycamore?
There are 86.99 Males per 100 Females in Sycamore.
What is the Ratio of Females per 100 Males in Sycamore?
There are 114.96 Females per 100 Males in Sycamore.
What is the Median Population Age in Sycamore?
Median Population Age in Sycamore is 50.4 Years.
What is the Average Family Size in Sycamore
Average Family Size in Sycamore is 2.6 People.
What is the Average Household Size in Sycamore
Average Household Size in Sycamore is 2.2 People.
How Large is the Labor Force in Sycamore?
There are 412 People in the Labor Forcein in Sycamore.
What is the Percentage of People in the Labor Force in Sycamore?
65.5% of People are in the Labor Force in Sycamore.
What is the Unemployment Rate in Sycamore?
Unemployment Rate in Sycamore is 3.4%.