South Salem, OH Map & Demographics
South Salem Map
South Salem Overview
$24,961
PER CAPITA INCOME
$81,000
AVG FAMILY INCOME
$75,278
AVG HOUSEHOLD INCOME
57.6%
WAGE / INCOME GAP [ % ]
42.4¢/ $1
WAGE / INCOME GAP [ $ ]
0.40
INEQUALITY / GINI INDEX
192
TOTAL POPULATION
91
MALE POPULATION
101
FEMALE POPULATION
90.10
MALES / 100 FEMALES
110.99
FEMALES / 100 MALES
30.9
MEDIAN AGE
2.9
AVG FAMILY SIZE
2.5
AVG HOUSEHOLD SIZE
104
LABOR FORCE [ PEOPLE ]
73.2%
PERCENT IN LABOR FORCE
11.5%
UNEMPLOYMENT RATE
South Salem Zip Codes
South Salem Area Codes
Income in South Salem
Income Overview in South Salem
Per Capita Income in South Salem is $24,961, while median incomes of families and households are $81,000 and $75,278 respectively.
| Characteristic | Number | Measure |
| Per Capita Income | 192 | $24,961 |
| Median Family Income | 56 | $81,000 |
| Mean Family Income | 56 | $78,455 |
| Median Household Income | 76 | $75,278 |
| Mean Household Income | 76 | $67,104 |
| Income Deficit | 56 | $0 |
| Wage / Income Gap (%) | 192 | 57.64% |
| Wage / Income Gap ($) | 192 | 42.36¢ per $1 |
| Gini / Inequality Index | 192 | 0.40 |
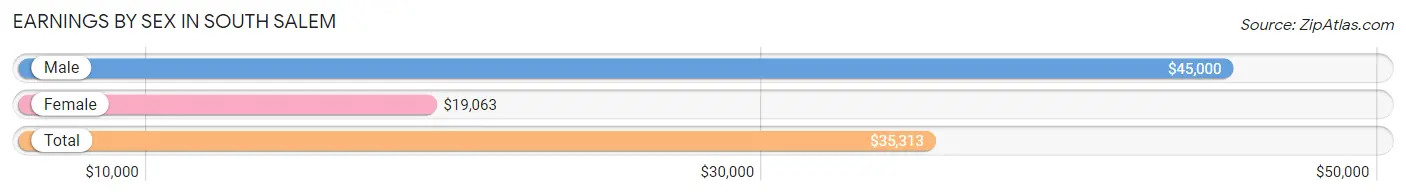
Earnings by Sex in South Salem
Average Earnings in South Salem are $35,313, $45,000 for men and $19,063 for women, a difference of 57.6%.
| Sex | Number | Average Earnings |
| Male | 54 (51.4%) | $45,000 |
| Female | 51 (48.6%) | $19,063 |
| Total | 105 (100.0%) | $35,313 |
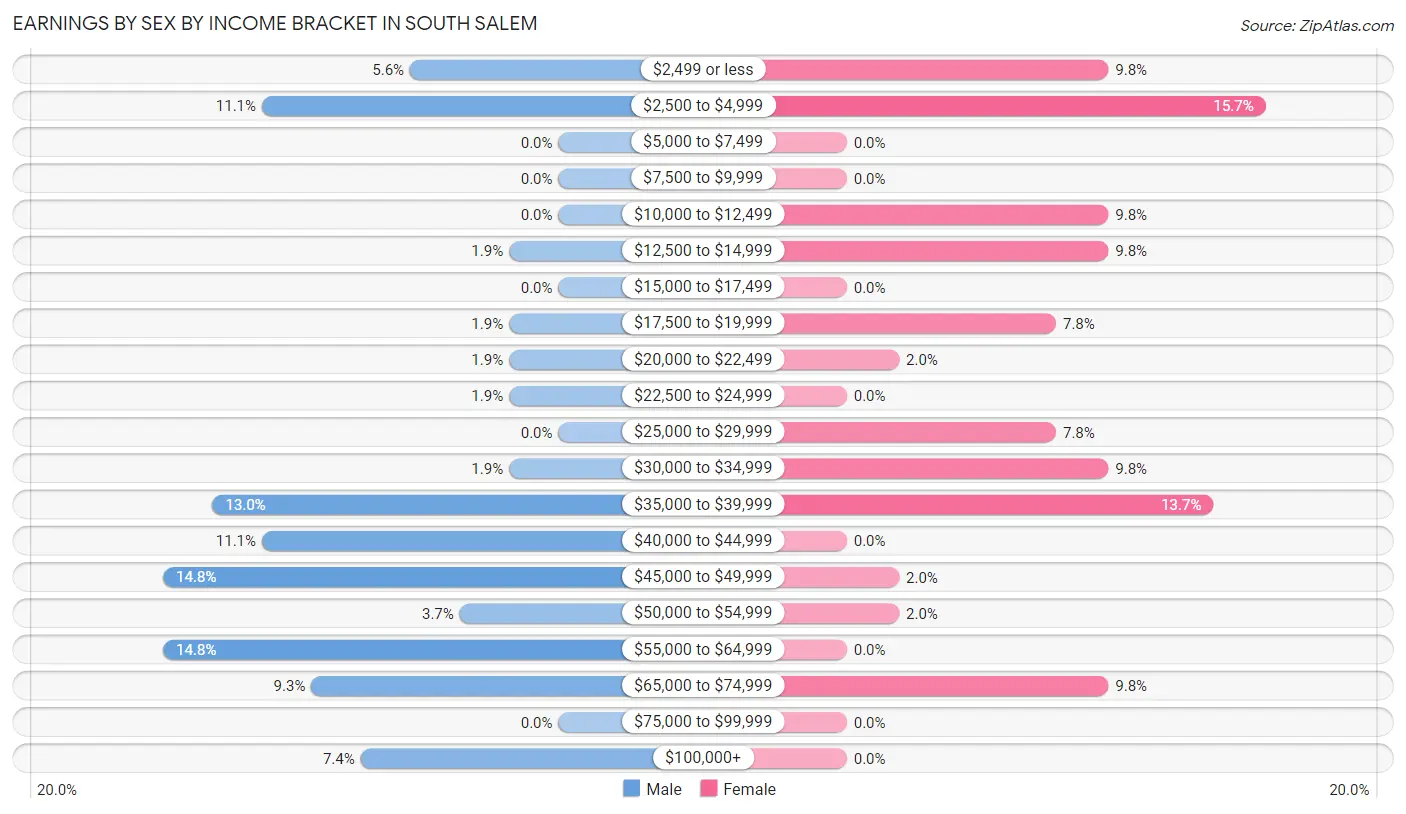
Earnings by Sex by Income Bracket in South Salem
The most common earnings brackets in South Salem are $45,000 to $49,999 for men (8 | 14.8%) and $2,500 to $4,999 for women (8 | 15.7%).
| Income | Male | Female |
| $2,499 or less | 3 (5.6%) | 5 (9.8%) |
| $2,500 to $4,999 | 6 (11.1%) | 8 (15.7%) |
| $5,000 to $7,499 | 0 (0.0%) | 0 (0.0%) |
| $7,500 to $9,999 | 0 (0.0%) | 0 (0.0%) |
| $10,000 to $12,499 | 0 (0.0%) | 5 (9.8%) |
| $12,500 to $14,999 | 1 (1.8%) | 5 (9.8%) |
| $15,000 to $17,499 | 0 (0.0%) | 0 (0.0%) |
| $17,500 to $19,999 | 1 (1.8%) | 4 (7.8%) |
| $20,000 to $22,499 | 1 (1.8%) | 1 (2.0%) |
| $22,500 to $24,999 | 1 (1.8%) | 0 (0.0%) |
| $25,000 to $29,999 | 0 (0.0%) | 4 (7.8%) |
| $30,000 to $34,999 | 1 (1.8%) | 5 (9.8%) |
| $35,000 to $39,999 | 7 (13.0%) | 7 (13.7%) |
| $40,000 to $44,999 | 6 (11.1%) | 0 (0.0%) |
| $45,000 to $49,999 | 8 (14.8%) | 1 (2.0%) |
| $50,000 to $54,999 | 2 (3.7%) | 1 (2.0%) |
| $55,000 to $64,999 | 8 (14.8%) | 0 (0.0%) |
| $65,000 to $74,999 | 5 (9.3%) | 5 (9.8%) |
| $75,000 to $99,999 | 0 (0.0%) | 0 (0.0%) |
| $100,000+ | 4 (7.4%) | 0 (0.0%) |
| Total | 54 (100.0%) | 51 (100.0%) |
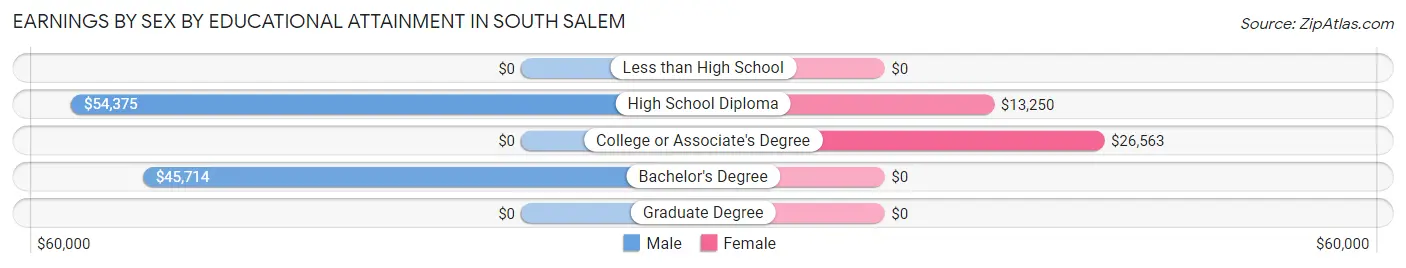
Earnings by Sex by Educational Attainment in South Salem
Average earnings in South Salem are $45,625 for men and $19,063 for women, a difference of 58.2%. Men with an educational attainment of high school diploma enjoy the highest average annual earnings of $54,375, while those with bachelor's degree education earn the least with $45,714. Women with an educational attainment of college or associate's degree earn the most with the average annual earnings of $26,563, while those with high school diploma education have the smallest earnings of $13,250.
| Educational Attainment | Male Income | Female Income |
| Less than High School | - | - |
| High School Diploma | $54,375 | $13,250 |
| College or Associate's Degree | - | - |
| Bachelor's Degree | $45,714 | $0 |
| Graduate Degree | - | - |
| Total | $45,625 | $19,063 |
Family Income in South Salem
Family Income Brackets in South Salem
According to the South Salem family income data, there are 21 families falling into the $75,000 to $99,999 income range, which is the most common income bracket and makes up 37.5% of all families.
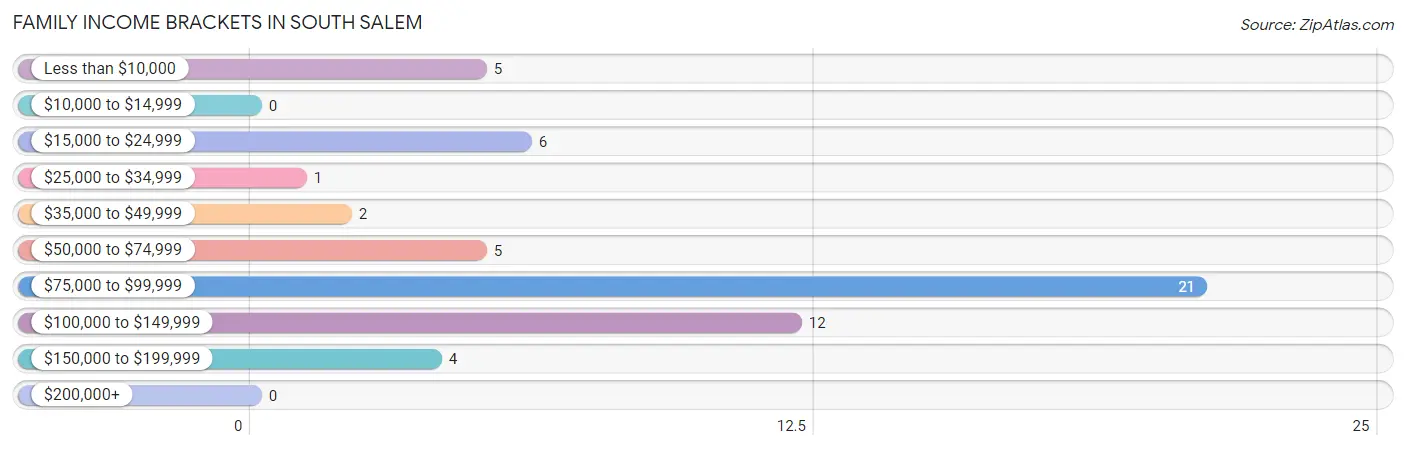
| Income Bracket | # Families | % Families |
| Less than $10,000 | 5 | 8.9% |
| $10,000 to $14,999 | 0 | 0.0% |
| $15,000 to $24,999 | 6 | 10.7% |
| $25,000 to $34,999 | 1 | 1.8% |
| $35,000 to $49,999 | 2 | 3.6% |
| $50,000 to $74,999 | 5 | 8.9% |
| $75,000 to $99,999 | 21 | 37.5% |
| $100,000 to $149,999 | 12 | 21.4% |
| $150,000 to $199,999 | 4 | 7.1% |
| $200,000+ | 0 | 0.0% |
Family Income by Famaliy Size in South Salem
2-person families (27 | 48.2%) account for the highest median family income in South Salem with $76,964 per family, while 2-person families (27 | 48.2%) have the highest median income of $38,482 per family member.
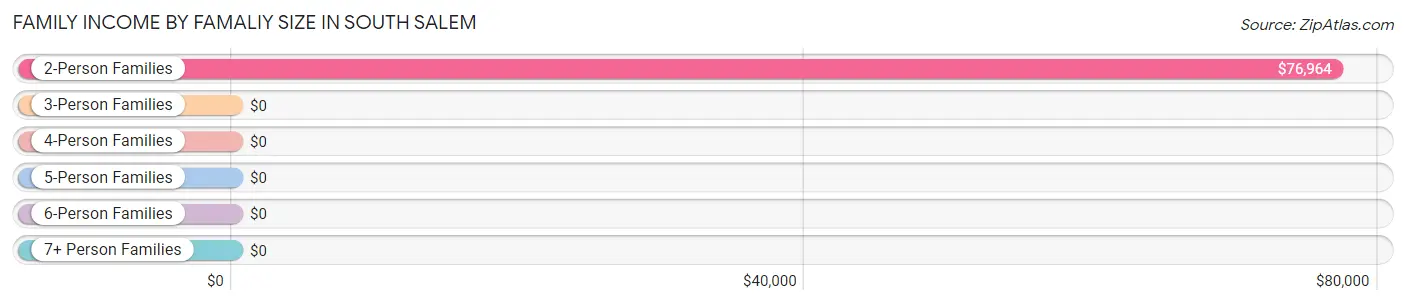
| Income Bracket | # Families | Median Income |
| 2-Person Families | 27 (48.2%) | $76,964 |
| 3-Person Families | 12 (21.4%) | $0 |
| 4-Person Families | 11 (19.6%) | $0 |
| 5-Person Families | 4 (7.1%) | $0 |
| 6-Person Families | 0 (0.0%) | $0 |
| 7+ Person Families | 2 (3.6%) | $0 |
| Total | 56 (100.0%) | $81,000 |
Family Income by Number of Earners in South Salem
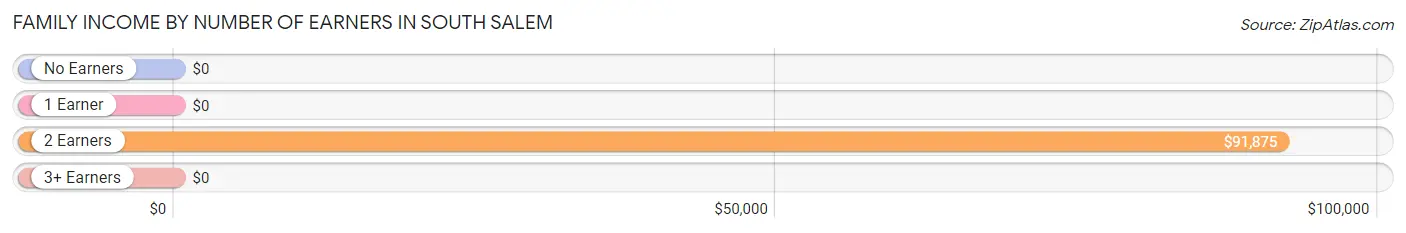
| Number of Earners | # Families | Median Income |
| No Earners | 8 (14.3%) | $0 |
| 1 Earner | 12 (21.4%) | $0 |
| 2 Earners | 31 (55.4%) | $91,875 |
| 3+ Earners | 5 (8.9%) | $0 |
| Total | 56 (100.0%) | $81,000 |
Household Income in South Salem
Household Income Brackets in South Salem
With 21 households falling in the category, the $75,000 to $99,999 income range is the most frequent in South Salem, accounting for 27.6% of all households.
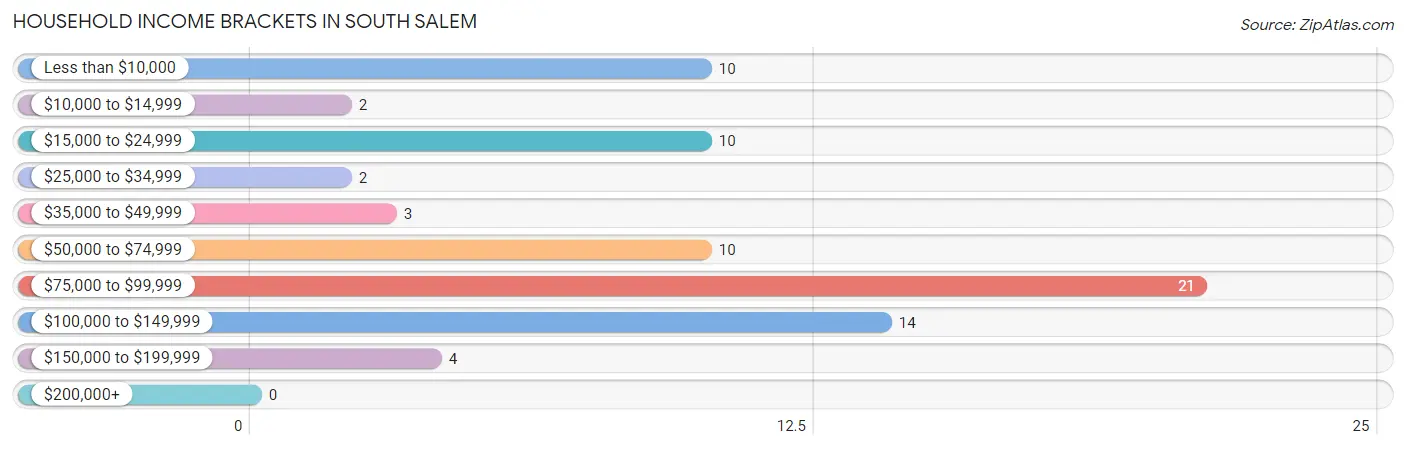
| Income Bracket | # Households | % Households |
| Less than $10,000 | 10 | 13.2% |
| $10,000 to $14,999 | 2 | 2.6% |
| $15,000 to $24,999 | 10 | 13.2% |
| $25,000 to $34,999 | 2 | 2.6% |
| $35,000 to $49,999 | 3 | 3.9% |
| $50,000 to $74,999 | 10 | 13.2% |
| $75,000 to $99,999 | 21 | 27.6% |
| $100,000 to $149,999 | 14 | 18.4% |
| $150,000 to $199,999 | 4 | 5.3% |
| $200,000+ | 0 | 0.0% |
Household Income by Householder Age in South Salem
The median household income in South Salem is $75,278, with the highest median household income of $81,000 found in the 25 to 44 years age bracket for the primary householder. A total of 40 households (52.6%) fall into this category.
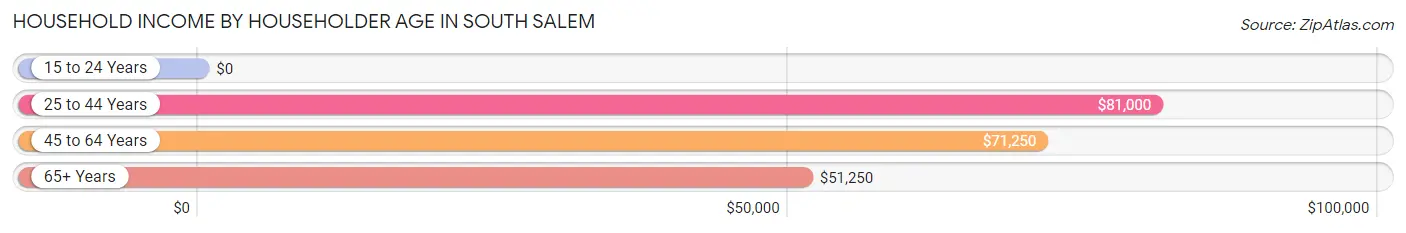
| Income Bracket | # Households | Median Income |
| 15 to 24 Years | 0 (0.0%) | $0 |
| 25 to 44 Years | 40 (52.6%) | $81,000 |
| 45 to 64 Years | 22 (28.9%) | $71,250 |
| 65+ Years | 14 (18.4%) | $51,250 |
| Total | 76 (100.0%) | $75,278 |
Poverty in South Salem
Income Below Poverty by Sex and Age in South Salem
With 20.9% poverty level for males and 34.6% for females among the residents of South Salem, 16 and 17 year old males and 12 to 14 year old females are the most vulnerable to poverty, with 3 males (100.0%) and 5 females (83.3%) in their respective age groups living below the poverty level.
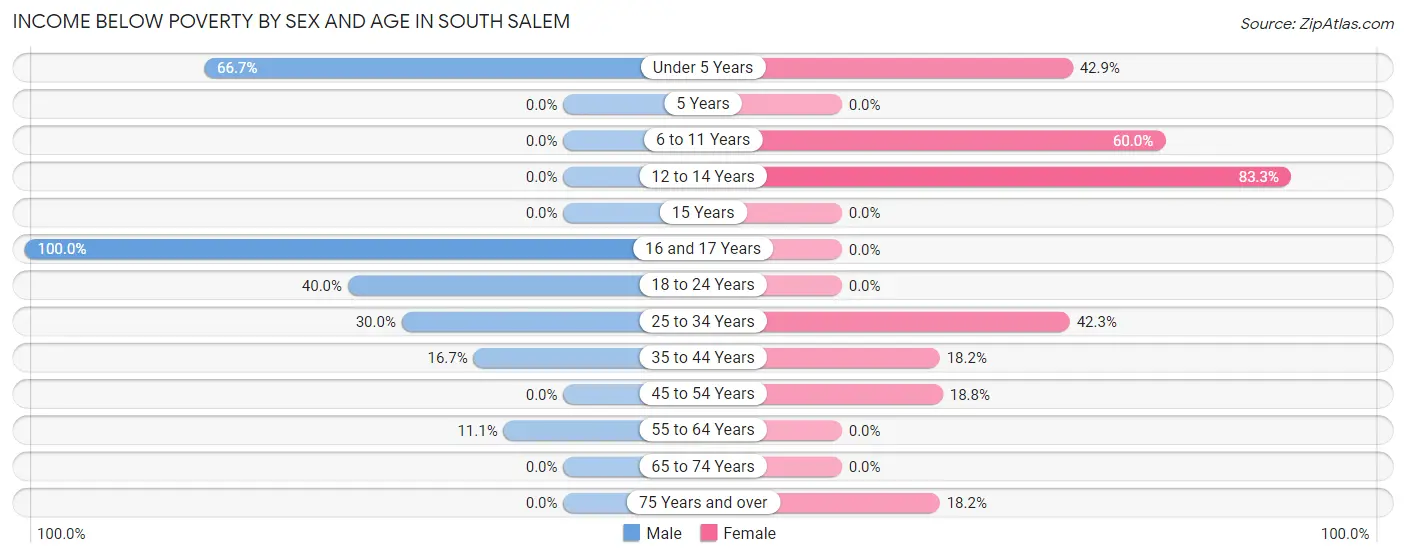
| Age Bracket | Male | Female |
| Under 5 Years | 2 (66.7%) | 3 (42.9%) |
| 5 Years | 0 (0.0%) | 0 (0.0%) |
| 6 to 11 Years | 0 (0.0%) | 9 (60.0%) |
| 12 to 14 Years | 0 (0.0%) | 5 (83.3%) |
| 15 Years | 0 (0.0%) | 0 (0.0%) |
| 16 and 17 Years | 3 (100.0%) | 0 (0.0%) |
| 18 to 24 Years | 2 (40.0%) | 0 (0.0%) |
| 25 to 34 Years | 9 (30.0%) | 11 (42.3%) |
| 35 to 44 Years | 2 (16.7%) | 2 (18.2%) |
| 45 to 54 Years | 0 (0.0%) | 3 (18.8%) |
| 55 to 64 Years | 1 (11.1%) | 0 (0.0%) |
| 65 to 74 Years | 0 (0.0%) | 0 (0.0%) |
| 75 Years and over | 0 (0.0%) | 2 (18.2%) |
| Total | 19 (20.9%) | 35 (34.6%) |
Income Above Poverty by Sex and Age in South Salem
According to the poverty statistics in South Salem, males aged 5 years and females aged 16 and 17 years are the age groups that are most secure financially, with 100.0% of males and 100.0% of females in these age groups living above the poverty line.
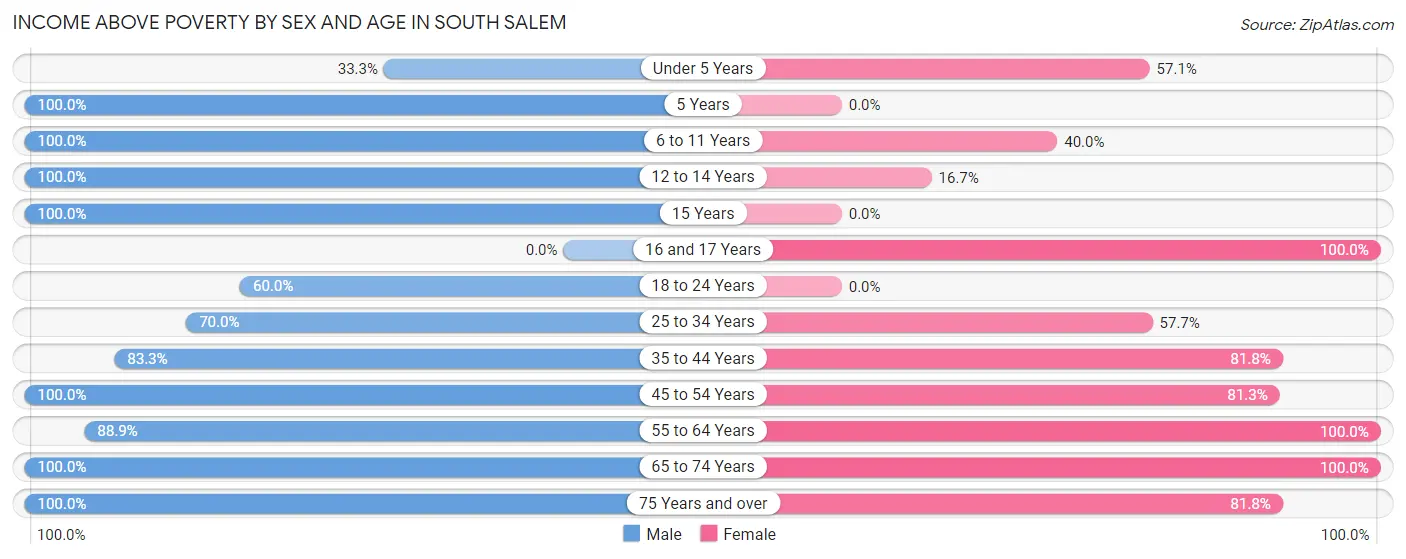
| Age Bracket | Male | Female |
| Under 5 Years | 1 (33.3%) | 4 (57.1%) |
| 5 Years | 1 (100.0%) | 0 (0.0%) |
| 6 to 11 Years | 15 (100.0%) | 6 (40.0%) |
| 12 to 14 Years | 2 (100.0%) | 1 (16.7%) |
| 15 Years | 1 (100.0%) | 0 (0.0%) |
| 16 and 17 Years | 0 (0.0%) | 2 (100.0%) |
| 18 to 24 Years | 3 (60.0%) | 0 (0.0%) |
| 25 to 34 Years | 21 (70.0%) | 15 (57.7%) |
| 35 to 44 Years | 10 (83.3%) | 9 (81.8%) |
| 45 to 54 Years | 4 (100.0%) | 13 (81.2%) |
| 55 to 64 Years | 8 (88.9%) | 4 (100.0%) |
| 65 to 74 Years | 1 (100.0%) | 3 (100.0%) |
| 75 Years and over | 5 (100.0%) | 9 (81.8%) |
| Total | 72 (79.1%) | 66 (65.3%) |
Income Below Poverty Among Married-Couple Families in South Salem
The poverty statistics for married-couple families in South Salem show that 12.2% or 5 of the total 41 families live below the poverty line. Families with 1 or 2 children have the highest poverty rate of 26.3%, comprising of 5 families. On the other hand, families with no children have the lowest poverty rate of 0.0%, which includes 0 families.
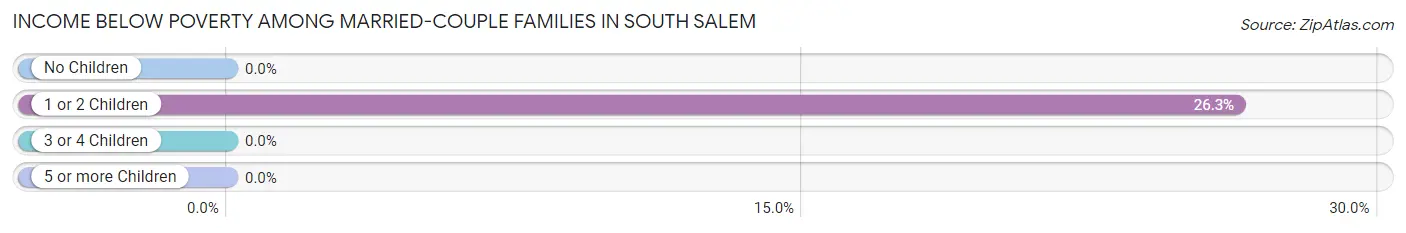
| Children | Above Poverty | Below Poverty |
| No Children | 20 (100.0%) | 0 (0.0%) |
| 1 or 2 Children | 14 (73.7%) | 5 (26.3%) |
| 3 or 4 Children | 0 (0.0%) | 0 (0.0%) |
| 5 or more Children | 2 (100.0%) | 0 (0.0%) |
| Total | 36 (87.8%) | 5 (12.2%) |
Income Below Poverty Among Single-Parent Households in South Salem
According to the poverty data in South Salem, 33.3% or 1 single-father households and 41.7% or 5 single-mother households are living below the poverty line. Among single-father households, those with 1 or 2 children have the highest poverty rate, with 1 households (33.3%) experiencing poverty. Likewise, among single-mother households, those with 1 or 2 children have the highest poverty rate, with 3 households (100.0%) falling below the poverty line.
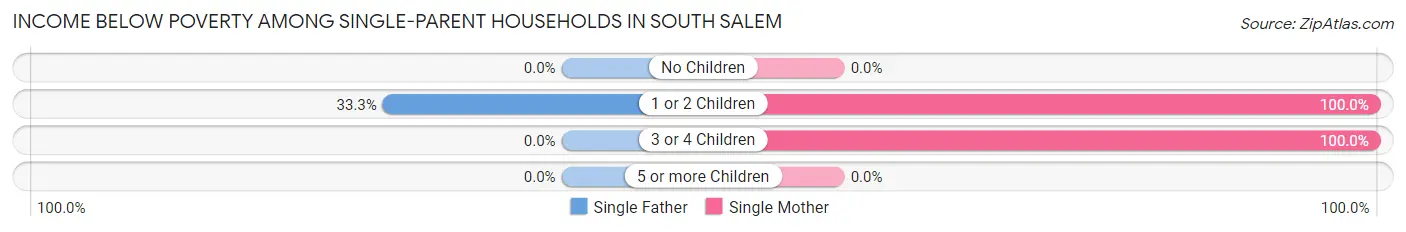
| Children | Single Father | Single Mother |
| No Children | 0 (0.0%) | 0 (0.0%) |
| 1 or 2 Children | 1 (33.3%) | 3 (100.0%) |
| 3 or 4 Children | 0 (0.0%) | 2 (100.0%) |
| 5 or more Children | 0 (0.0%) | 0 (0.0%) |
| Total | 1 (33.3%) | 5 (41.7%) |
Income Below Poverty Among Married-Couple vs Single-Parent Households in South Salem
The poverty data for South Salem shows that 5 of the married-couple family households (12.2%) and 6 of the single-parent households (40.0%) are living below the poverty level. Within the married-couple family households, those with 1 or 2 children have the highest poverty rate, with 5 households (26.3%) falling below the poverty line. Among the single-parent households, those with 3 or 4 children have the highest poverty rate, with 2 household (100.0%) living below poverty.
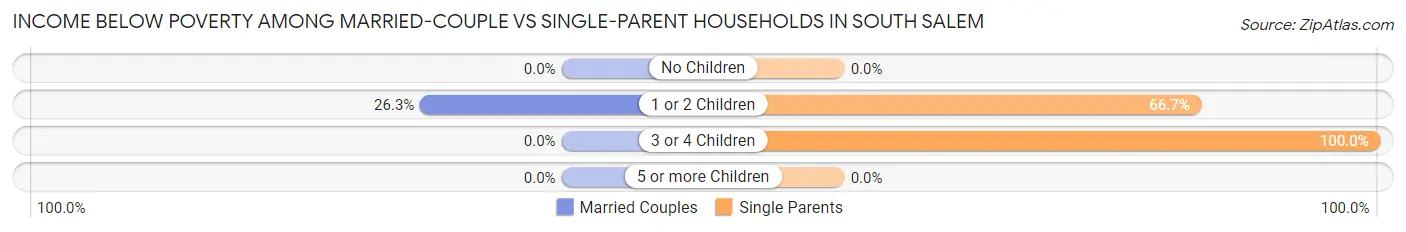
| Children | Married-Couple Families | Single-Parent Households |
| No Children | 0 (0.0%) | 0 (0.0%) |
| 1 or 2 Children | 5 (26.3%) | 4 (66.7%) |
| 3 or 4 Children | 0 (0.0%) | 2 (100.0%) |
| 5 or more Children | 0 (0.0%) | 0 (0.0%) |
| Total | 5 (12.2%) | 6 (40.0%) |
Race in South Salem
The most populous races in South Salem are White / Caucasian (184 | 95.8%), Two or more Races (8 | 4.2%), and Hispanic or Latino (4 | 2.1%).
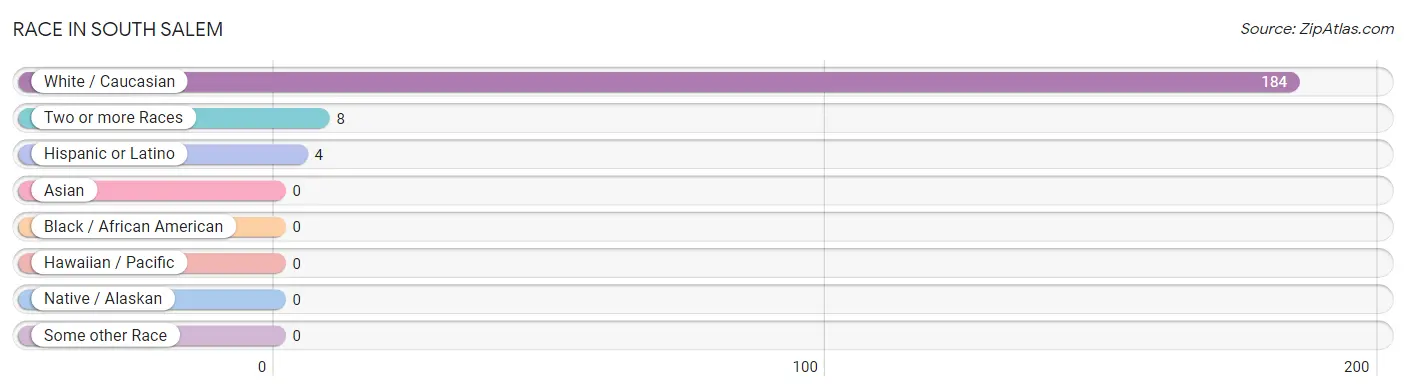
| Race | # Population | % Population |
| Asian | 0 | 0.0% |
| Black / African American | 0 | 0.0% |
| Hawaiian / Pacific | 0 | 0.0% |
| Hispanic or Latino | 4 | 2.1% |
| Native / Alaskan | 0 | 0.0% |
| White / Caucasian | 184 | 95.8% |
| Two or more Races | 8 | 4.2% |
| Some other Race | 0 | 0.0% |
| Total | 192 | 100.0% |
Ancestry in South Salem
The most populous ancestries reported in South Salem are English (45 | 23.4%), Irish (26 | 13.5%), German (24 | 12.5%), American (13 | 6.8%), and Italian (9 | 4.7%), together accounting for 60.9% of all South Salem residents.
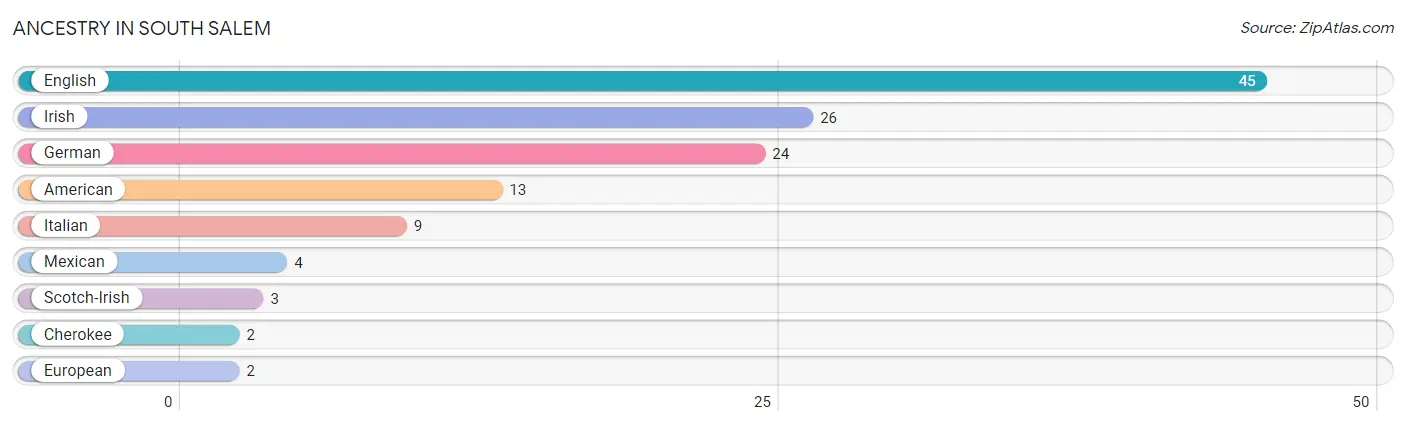
| Ancestry | # Population | % Population |
| American | 13 | 6.8% |
| Cherokee | 2 | 1.0% |
| English | 45 | 23.4% |
| European | 2 | 1.0% |
| German | 24 | 12.5% |
| Irish | 26 | 13.5% |
| Italian | 9 | 4.7% |
| Mexican | 4 | 2.1% |
| Scotch-Irish | 3 | 1.6% | View All 9 Rows |
Immigrants in South Salem

| Immigration Origin | # Population | % Population | View All 0 Rows |
Sex and Age in South Salem
Sex and Age in South Salem
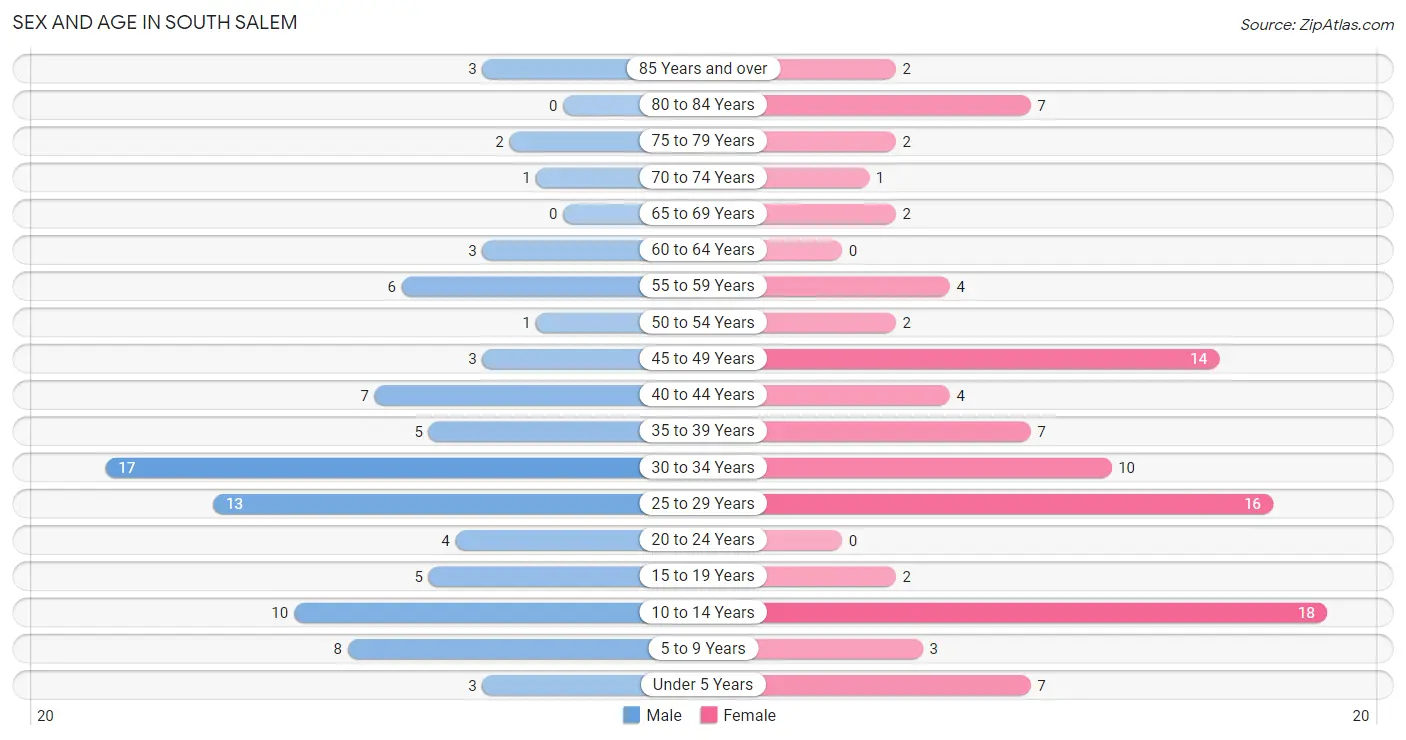
The most populous age groups in South Salem are 30 to 34 Years (17 | 18.7%) for men and 10 to 14 Years (18 | 17.8%) for women.
| Age Bracket | Male | Female |
| Under 5 Years | 3 (3.3%) | 7 (6.9%) |
| 5 to 9 Years | 8 (8.8%) | 3 (3.0%) |
| 10 to 14 Years | 10 (11.0%) | 18 (17.8%) |
| 15 to 19 Years | 5 (5.5%) | 2 (2.0%) |
| 20 to 24 Years | 4 (4.4%) | 0 (0.0%) |
| 25 to 29 Years | 13 (14.3%) | 16 (15.8%) |
| 30 to 34 Years | 17 (18.7%) | 10 (9.9%) |
| 35 to 39 Years | 5 (5.5%) | 7 (6.9%) |
| 40 to 44 Years | 7 (7.7%) | 4 (4.0%) |
| 45 to 49 Years | 3 (3.3%) | 14 (13.9%) |
| 50 to 54 Years | 1 (1.1%) | 2 (2.0%) |
| 55 to 59 Years | 6 (6.6%) | 4 (4.0%) |
| 60 to 64 Years | 3 (3.3%) | 0 (0.0%) |
| 65 to 69 Years | 0 (0.0%) | 2 (2.0%) |
| 70 to 74 Years | 1 (1.1%) | 1 (1.0%) |
| 75 to 79 Years | 2 (2.2%) | 2 (2.0%) |
| 80 to 84 Years | 0 (0.0%) | 7 (6.9%) |
| 85 Years and over | 3 (3.3%) | 2 (2.0%) |
| Total | 91 (100.0%) | 101 (100.0%) |
Families and Households in South Salem
Median Family Size in South Salem
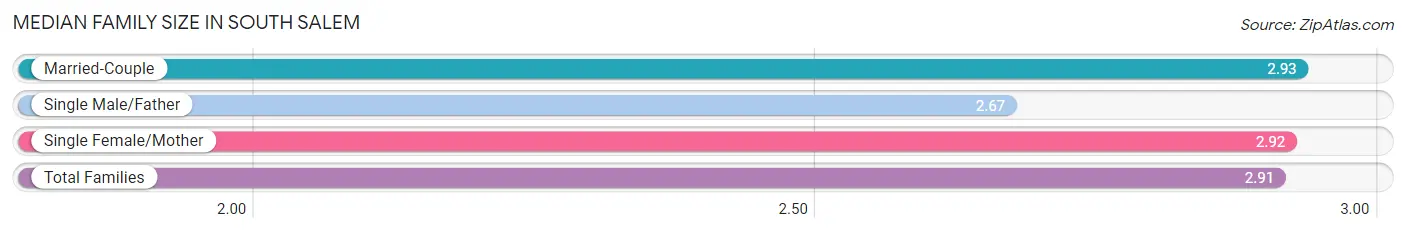
The median family size in South Salem is 2.91 persons per family, with married-couple families (41 | 73.2%) accounting for the largest median family size of 2.93 persons per family. On the other hand, single male/father families (3 | 5.4%) represent the smallest median family size with 2.67 persons per family.
| Family Type | # Families | Family Size |
| Married-Couple | 41 (73.2%) | 2.93 |
| Single Male/Father | 3 (5.4%) | 2.67 |
| Single Female/Mother | 12 (21.4%) | 2.92 |
| Total Families | 56 (100.0%) | 2.91 |
Median Household Size in South Salem
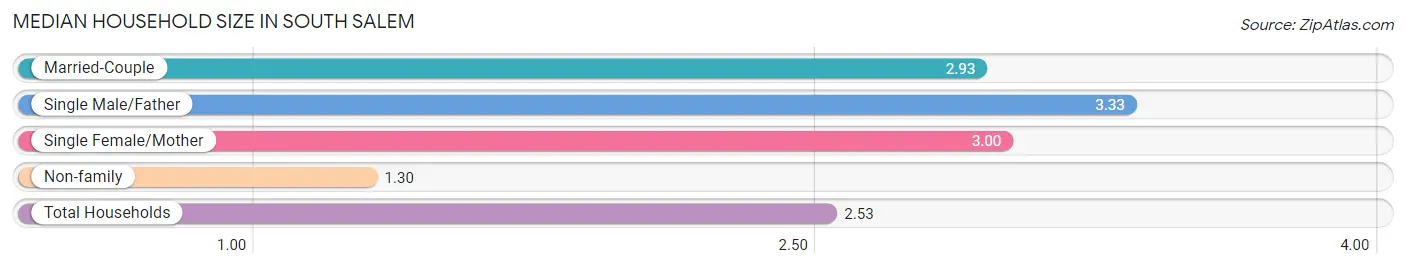
The median household size in South Salem is 2.53 persons per household, with single male/father households (3 | 4.0%) accounting for the largest median household size of 3.33 persons per household. non-family households (20 | 26.3%) represent the smallest median household size with 1.30 persons per household.
| Household Type | # Households | Household Size |
| Married-Couple | 41 (53.9%) | 2.93 |
| Single Male/Father | 3 (4.0%) | 3.33 |
| Single Female/Mother | 12 (15.8%) | 3.00 |
| Non-family | 20 (26.3%) | 1.30 |
| Total Households | 76 (100.0%) | 2.53 |
Household Size by Marriage Status in South Salem
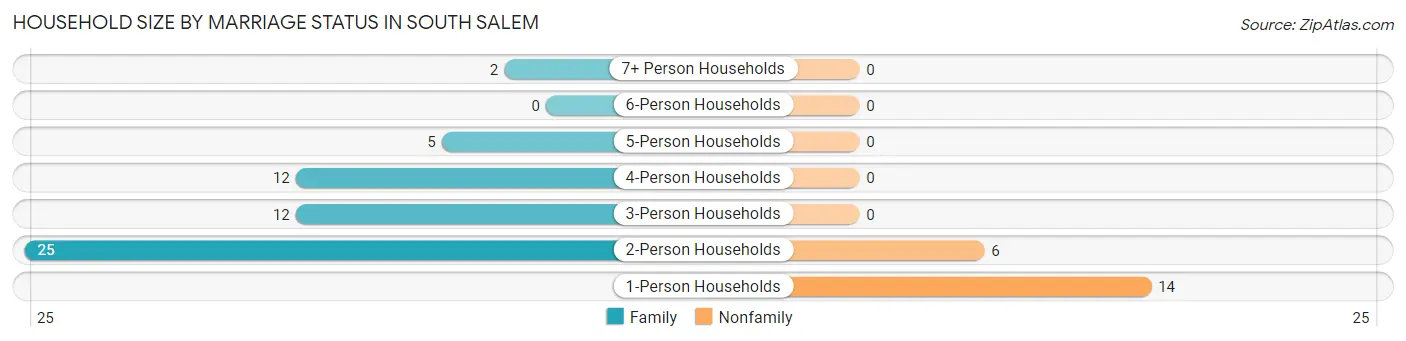
Out of a total of 76 households in South Salem, 56 (73.7%) are family households, while 20 (26.3%) are nonfamily households. The most numerous type of family households are 2-person households, comprising 25, and the most common type of nonfamily households are 1-person households, comprising 14.
| Household Size | Family Households | Nonfamily Households |
| 1-Person Households | - | 14 (18.4%) |
| 2-Person Households | 25 (32.9%) | 6 (7.9%) |
| 3-Person Households | 12 (15.8%) | 0 (0.0%) |
| 4-Person Households | 12 (15.8%) | 0 (0.0%) |
| 5-Person Households | 5 (6.6%) | 0 (0.0%) |
| 6-Person Households | 0 (0.0%) | 0 (0.0%) |
| 7+ Person Households | 2 (2.6%) | 0 (0.0%) |
| Total | 56 (73.7%) | 20 (26.3%) |
Female Fertility in South Salem
Fertility by Age in South Salem
Average fertility rate in South Salem is 38.0 births per 1,000 women. Women in the age bracket of 20 to 34 years have the highest fertility rate with 77.0 births per 1,000 women. Women in the age bracket of 20 to 34 years acount for 100.0% of all women with births.
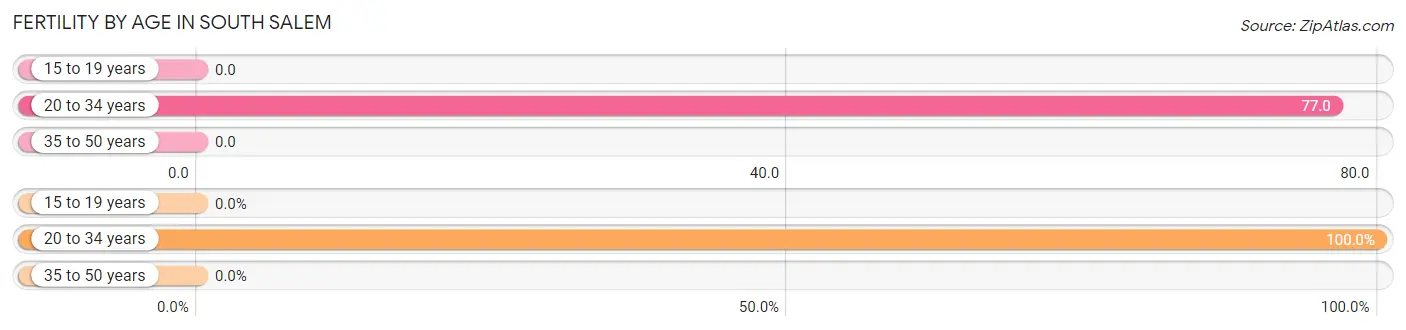
| Age Bracket | Women with Births | Births / 1,000 Women |
| 15 to 19 years | 0 (0.0%) | 0.0 |
| 20 to 34 years | 2 (100.0%) | 77.0 |
| 35 to 50 years | 0 (0.0%) | 0.0 |
| Total | 2 (100.0%) | 38.0 |
Fertility by Age by Marriage Status in South Salem
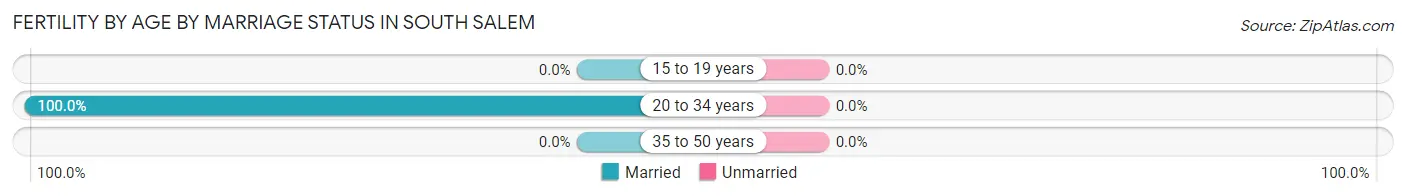
| Age Bracket | Married | Unmarried |
| 15 to 19 years | 0 (0.0%) | 0 (0.0%) |
| 20 to 34 years | 2 (100.0%) | 0 (0.0%) |
| 35 to 50 years | 0 (0.0%) | 0 (0.0%) |
| Total | 2 (100.0%) | 0 (0.0%) |
Fertility by Education in South Salem
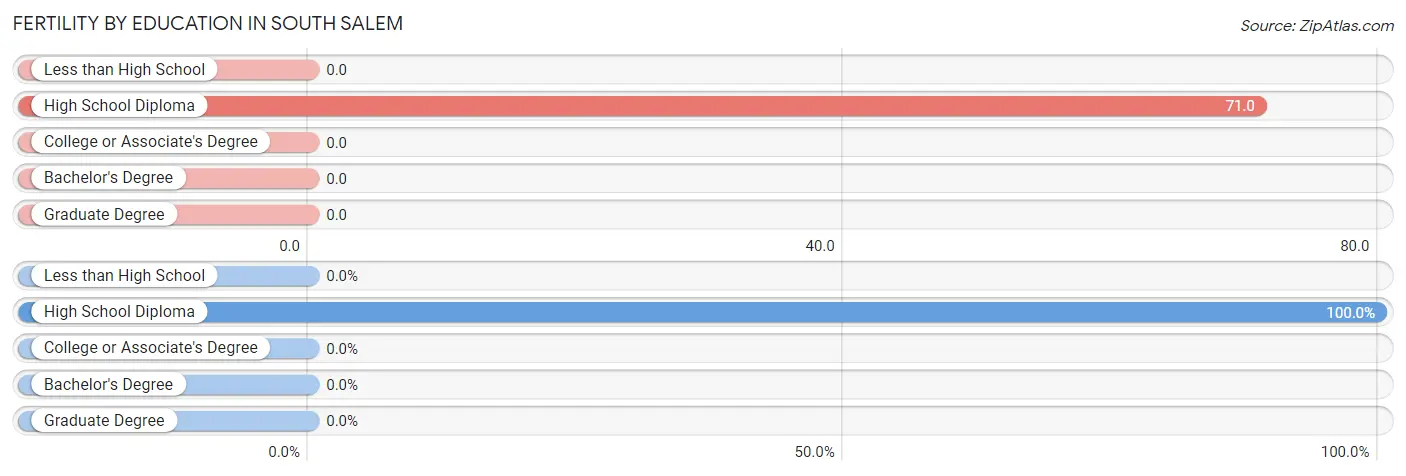
| Educational Attainment | Women with Births | Births / 1,000 Women |
| Less than High School | 0 (0.0%) | 0.0 |
| High School Diploma | 2 (100.0%) | 71.0 |
| College or Associate's Degree | 0 (0.0%) | 0.0 |
| Bachelor's Degree | 0 (0.0%) | 0.0 |
| Graduate Degree | 0 (0.0%) | 0.0 |
| Total | 2 (100.0%) | 38.0 |
Fertility by Education by Marriage Status in South Salem
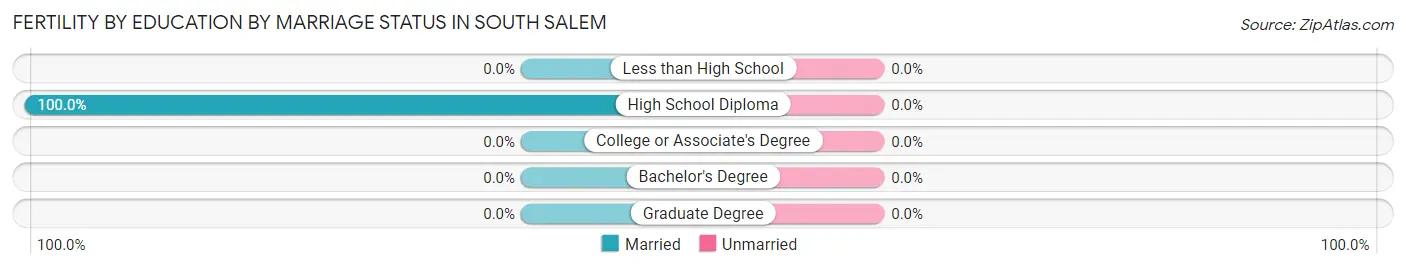
| Educational Attainment | Married | Unmarried |
| Less than High School | 0 (0.0%) | 0 (0.0%) |
| High School Diploma | 2 (100.0%) | 0 (0.0%) |
| College or Associate's Degree | 0 (0.0%) | 0 (0.0%) |
| Bachelor's Degree | 0 (0.0%) | 0 (0.0%) |
| Graduate Degree | 0 (0.0%) | 0 (0.0%) |
| Total | 2 (100.0%) | 0 (0.0%) |
Employment Characteristics in South Salem
Employment by Class of Employer in South Salem
Among the 92 employed individuals in South Salem, private company employees (59 | 64.1%), local government employees (10 | 10.9%), and self-employed (not incorporated) (9 | 9.8%) make up the most common classes of employment.
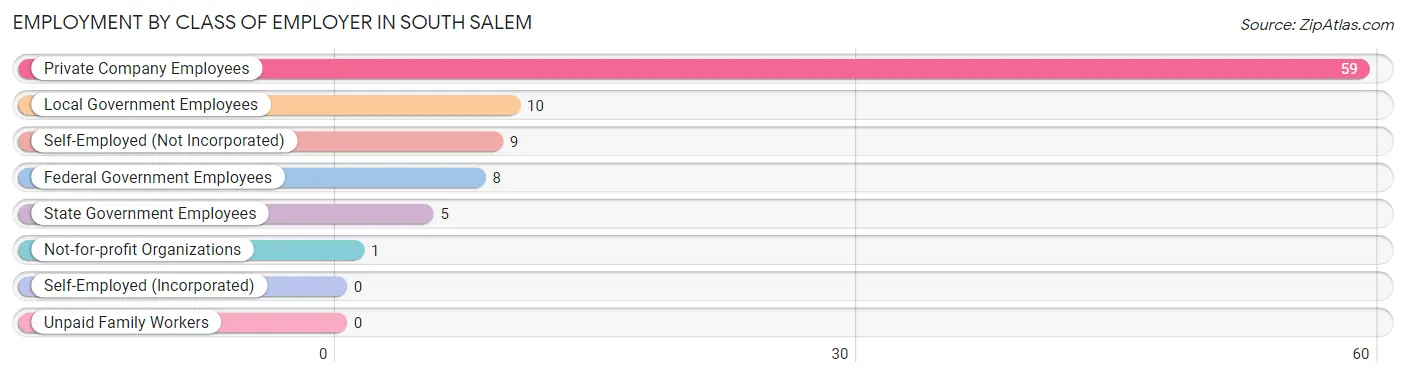
| Employer Class | # Employees | % Employees |
| Private Company Employees | 59 | 64.1% |
| Self-Employed (Incorporated) | 0 | 0.0% |
| Self-Employed (Not Incorporated) | 9 | 9.8% |
| Not-for-profit Organizations | 1 | 1.1% |
| Local Government Employees | 10 | 10.9% |
| State Government Employees | 5 | 5.4% |
| Federal Government Employees | 8 | 8.7% |
| Unpaid Family Workers | 0 | 0.0% |
| Total | 92 | 100.0% |
Employment Status by Age in South Salem
According to the labor force statistics for South Salem, out of the total population over 16 years of age (142), 73.2% or 104 individuals are in the labor force, with 11.5% or 12 of them unemployed. The age group with the highest labor force participation rate is 20 to 24 years, with 100.0% or 4 individuals in the labor force. Within the labor force, the 16 to 19 years age range has the highest percentage of unemployed individuals, with 100.0% or 3 of them being unemployed.
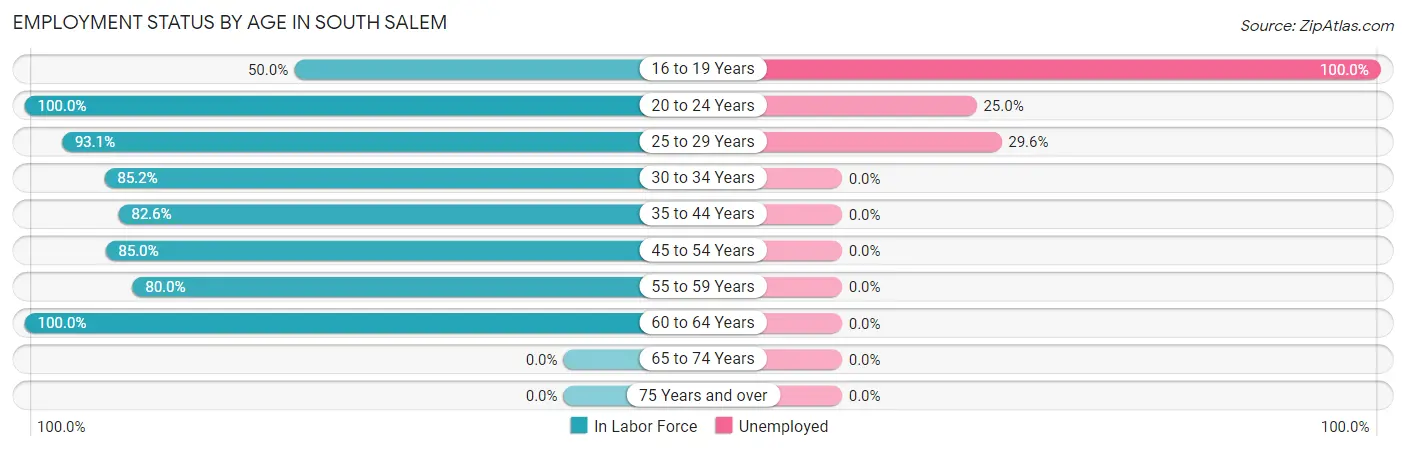
| Age Bracket | In Labor Force | Unemployed |
| 16 to 19 Years | 3 (50.0%) | 3 (100.0%) |
| 20 to 24 Years | 4 (100.0%) | 1 (25.0%) |
| 25 to 29 Years | 27 (93.1%) | 8 (29.6%) |
| 30 to 34 Years | 23 (85.2%) | 0 (0.0%) |
| 35 to 44 Years | 19 (82.6%) | 0 (0.0%) |
| 45 to 54 Years | 17 (85.0%) | 0 (0.0%) |
| 55 to 59 Years | 8 (80.0%) | 0 (0.0%) |
| 60 to 64 Years | 3 (100.0%) | 0 (0.0%) |
| 65 to 74 Years | 0 (0.0%) | 0 (0.0%) |
| 75 Years and over | 0 (0.0%) | 0 (0.0%) |
| Total | 104 (73.2%) | 12 (11.5%) |
Employment Status by Educational Attainment in South Salem
According to labor force statistics for South Salem, 86.6% of individuals (97) out of the total population between 25 and 64 years of age (112) are in the labor force, with 8.2% or 8 of them being unemployed. The group with the highest labor force participation rate are those with the educational attainment of college / associate degree, with 95.8% or 23 individuals in the labor force. Within the labor force, individuals with high school diploma education have the highest percentage of unemployment, with 20.0% or 8 of them being unemployed.
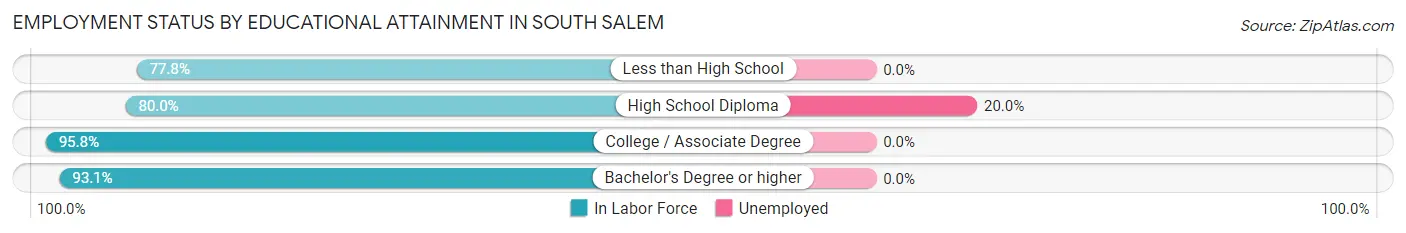
| Educational Attainment | In Labor Force | Unemployed |
| Less than High School | 7 (77.8%) | 0 (0.0%) |
| High School Diploma | 40 (80.0%) | 10 (20.0%) |
| College / Associate Degree | 23 (95.8%) | 0 (0.0%) |
| Bachelor's Degree or higher | 27 (93.1%) | 0 (0.0%) |
| Total | 97 (86.6%) | 9 (8.2%) |
Employment Occupations by Sex in South Salem
Management, Business, Science and Arts Occupations
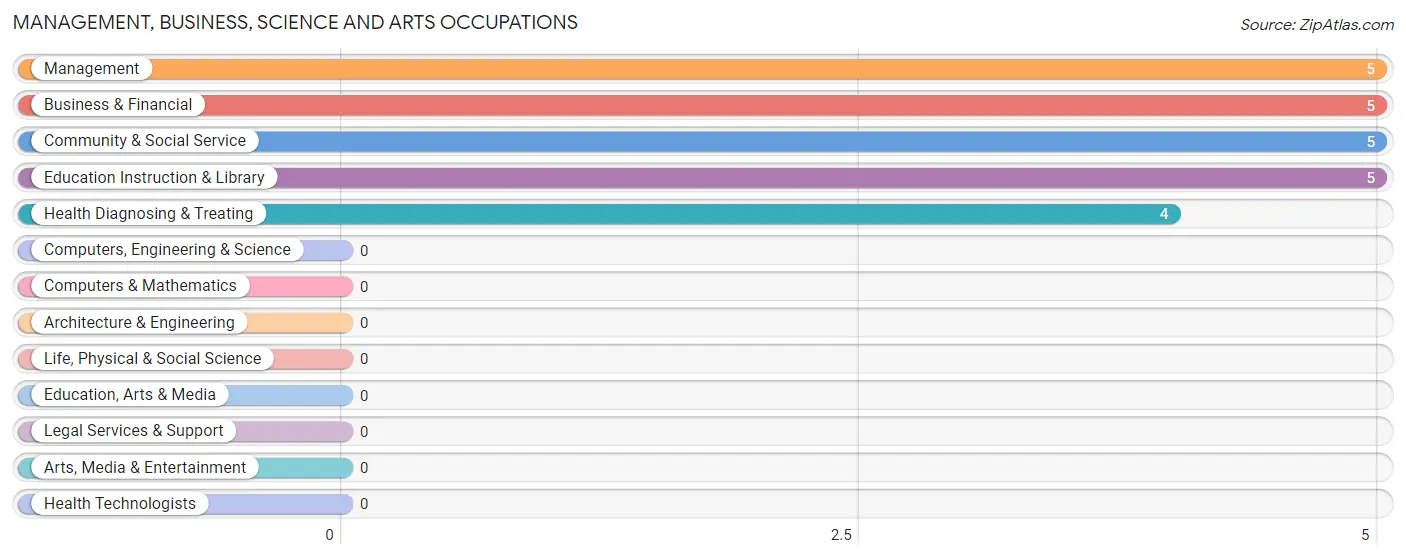
The most common Management, Business, Science and Arts occupations in South Salem are Management (5 | 5.4%), Business & Financial (5 | 5.4%), Community & Social Service (5 | 5.4%), Education Instruction & Library (5 | 5.4%), and Health Diagnosing & Treating (4 | 4.3%).
Management, Business, Science and Arts Occupations by Sex
Within the Management, Business, Science and Arts occupations in South Salem, the most male-oriented occupations are Management (100.0%), Business & Financial (100.0%), and Health Diagnosing & Treating (25.0%), while the most female-oriented occupations are Community & Social Service (100.0%), Education Instruction & Library (100.0%), and Health Diagnosing & Treating (75.0%).
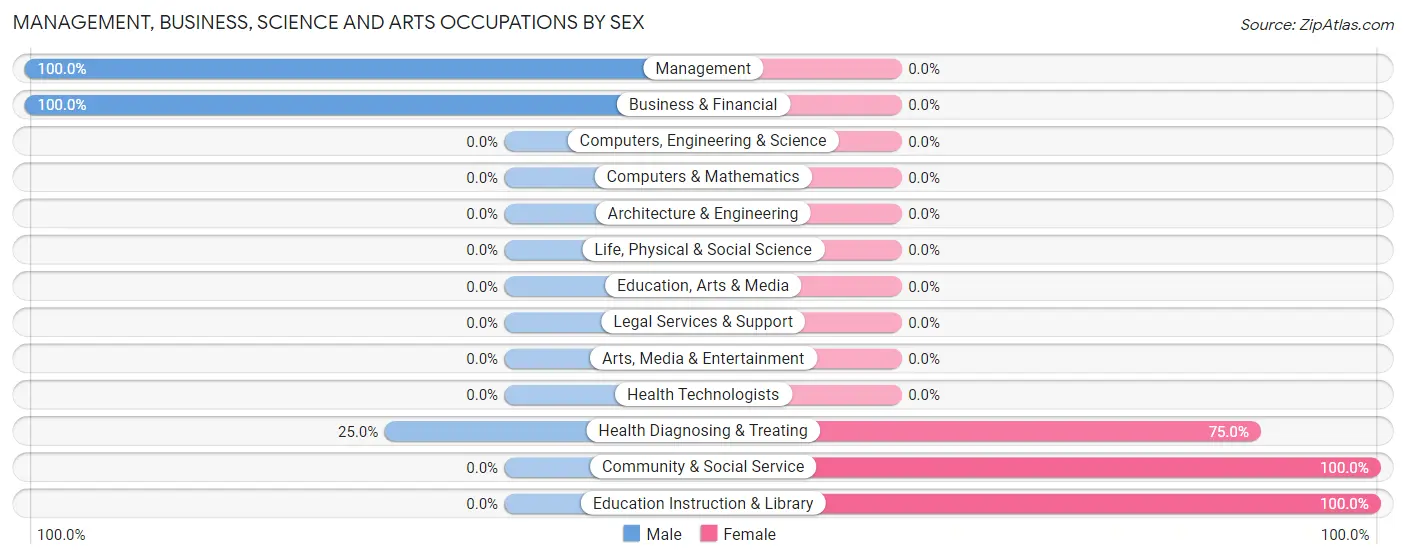
| Occupation | Male | Female |
| Management | 5 (100.0%) | 0 (0.0%) |
| Business & Financial | 5 (100.0%) | 0 (0.0%) |
| Computers, Engineering & Science | 0 (0.0%) | 0 (0.0%) |
| Computers & Mathematics | 0 (0.0%) | 0 (0.0%) |
| Architecture & Engineering | 0 (0.0%) | 0 (0.0%) |
| Life, Physical & Social Science | 0 (0.0%) | 0 (0.0%) |
| Community & Social Service | 0 (0.0%) | 5 (100.0%) |
| Education, Arts & Media | 0 (0.0%) | 0 (0.0%) |
| Legal Services & Support | 0 (0.0%) | 0 (0.0%) |
| Education Instruction & Library | 0 (0.0%) | 5 (100.0%) |
| Arts, Media & Entertainment | 0 (0.0%) | 0 (0.0%) |
| Health Diagnosing & Treating | 1 (25.0%) | 3 (75.0%) |
| Health Technologists | 0 (0.0%) | 0 (0.0%) |
| Total (Category) | 11 (57.9%) | 8 (42.1%) |
| Total (Overall) | 51 (55.4%) | 41 (44.6%) |
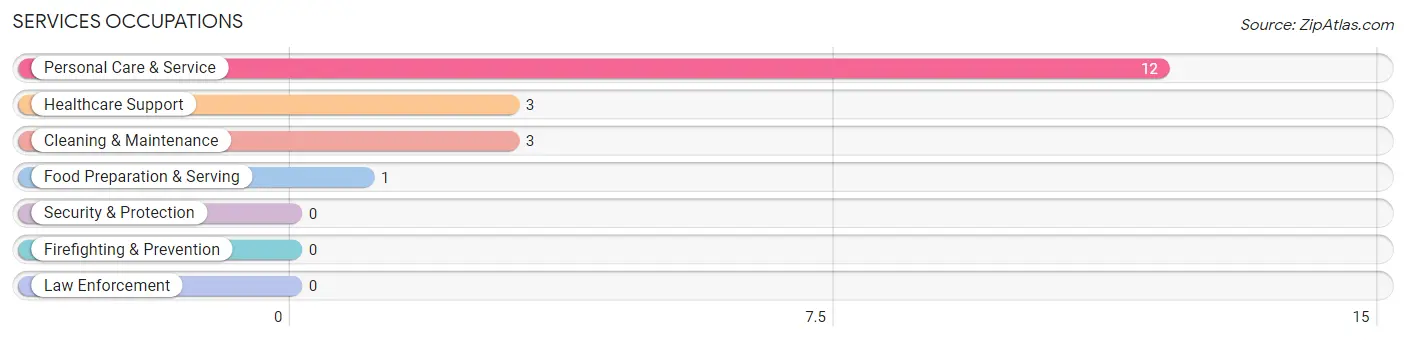
Services Occupations
The most common Services occupations in South Salem are Personal Care & Service (12 | 13.0%), Healthcare Support (3 | 3.3%), Cleaning & Maintenance (3 | 3.3%), and Food Preparation & Serving (1 | 1.1%).
Services Occupations by Sex
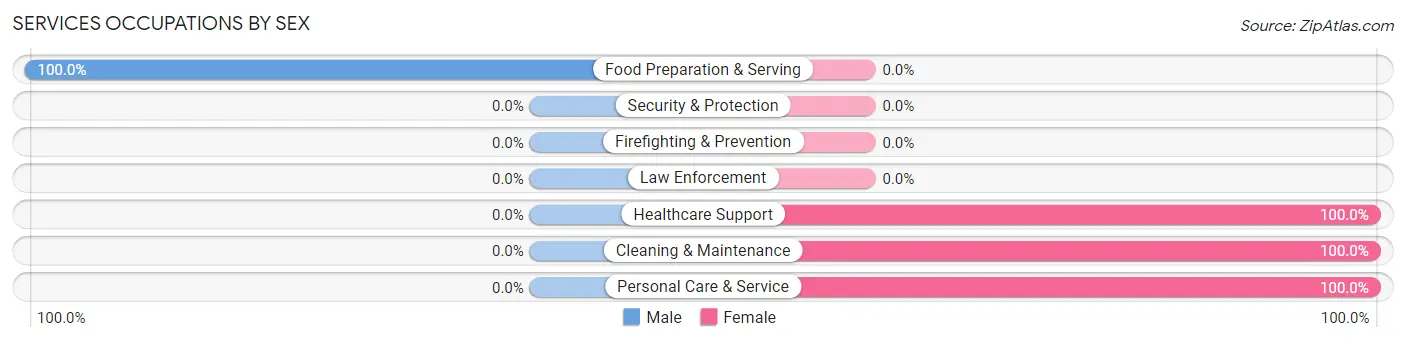
| Occupation | Male | Female |
| Healthcare Support | 0 (0.0%) | 3 (100.0%) |
| Security & Protection | 0 (0.0%) | 0 (0.0%) |
| Firefighting & Prevention | 0 (0.0%) | 0 (0.0%) |
| Law Enforcement | 0 (0.0%) | 0 (0.0%) |
| Food Preparation & Serving | 1 (100.0%) | 0 (0.0%) |
| Cleaning & Maintenance | 0 (0.0%) | 3 (100.0%) |
| Personal Care & Service | 0 (0.0%) | 12 (100.0%) |
| Total (Category) | 1 (5.3%) | 18 (94.7%) |
| Total (Overall) | 51 (55.4%) | 41 (44.6%) |
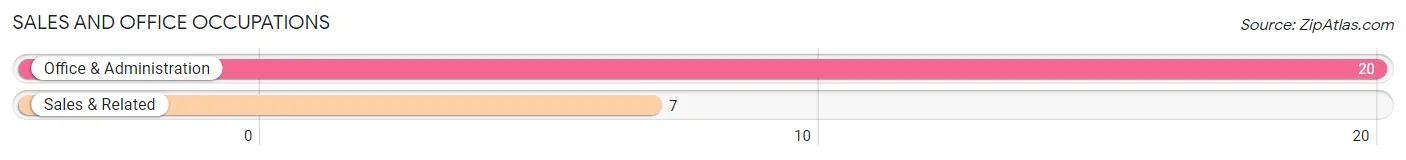
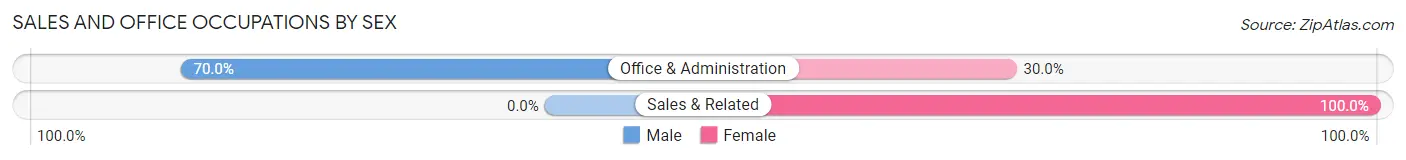
Sales and Office Occupations
The most common Sales and Office occupations in South Salem are Office & Administration (20 | 21.7%), and Sales & Related (7 | 7.6%).
Sales and Office Occupations by Sex
| Occupation | Male | Female |
| Sales & Related | 0 (0.0%) | 7 (100.0%) |
| Office & Administration | 14 (70.0%) | 6 (30.0%) |
| Total (Category) | 14 (51.8%) | 13 (48.1%) |
| Total (Overall) | 51 (55.4%) | 41 (44.6%) |
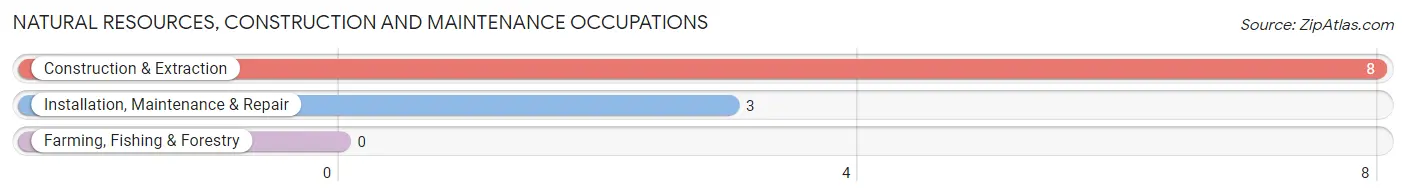
Natural Resources, Construction and Maintenance Occupations
The most common Natural Resources, Construction and Maintenance occupations in South Salem are Construction & Extraction (8 | 8.7%), and Installation, Maintenance & Repair (3 | 3.3%).
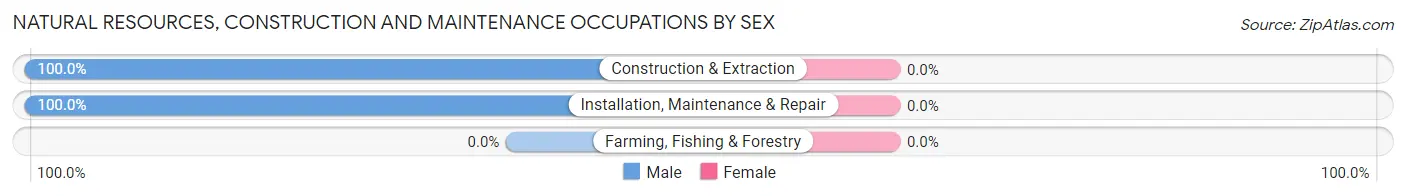
Natural Resources, Construction and Maintenance Occupations by Sex
| Occupation | Male | Female |
| Farming, Fishing & Forestry | 0 (0.0%) | 0 (0.0%) |
| Construction & Extraction | 8 (100.0%) | 0 (0.0%) |
| Installation, Maintenance & Repair | 3 (100.0%) | 0 (0.0%) |
| Total (Category) | 11 (100.0%) | 0 (0.0%) |
| Total (Overall) | 51 (55.4%) | 41 (44.6%) |
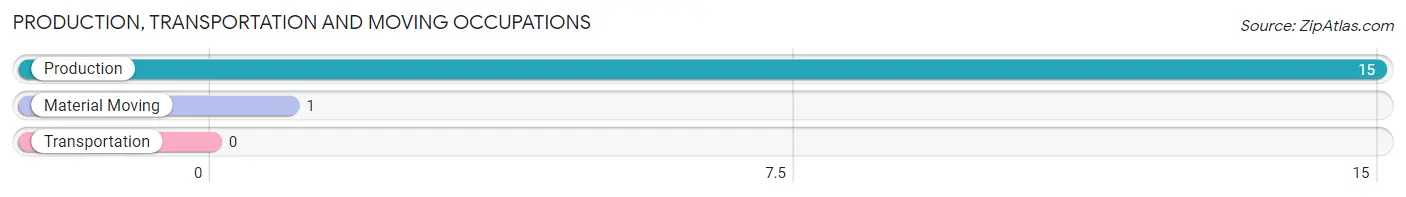
Production, Transportation and Moving Occupations
The most common Production, Transportation and Moving occupations in South Salem are Production (15 | 16.3%), and Material Moving (1 | 1.1%).
Production, Transportation and Moving Occupations by Sex
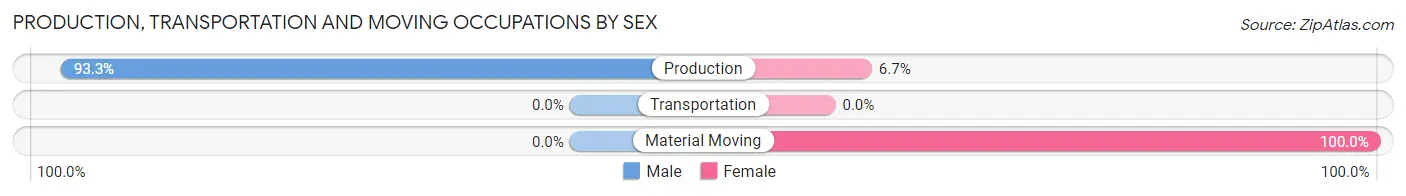
| Occupation | Male | Female |
| Production | 14 (93.3%) | 1 (6.7%) |
| Transportation | 0 (0.0%) | 0 (0.0%) |
| Material Moving | 0 (0.0%) | 1 (100.0%) |
| Total (Category) | 14 (87.5%) | 2 (12.5%) |
| Total (Overall) | 51 (55.4%) | 41 (44.6%) |
Employment Industries by Sex in South Salem
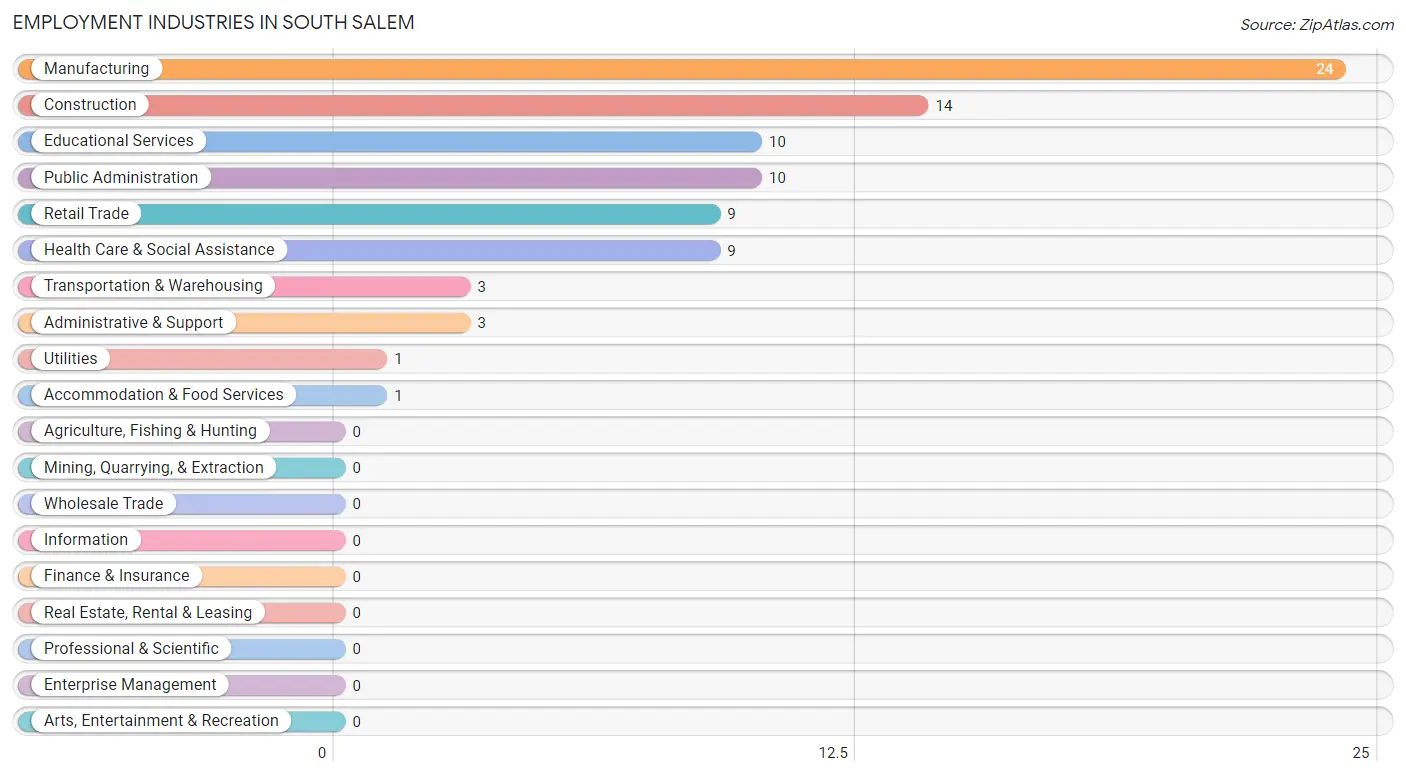
Employment Industries in South Salem
The major employment industries in South Salem include Manufacturing (24 | 26.1%), Construction (14 | 15.2%), Educational Services (10 | 10.9%), Public Administration (10 | 10.9%), and Retail Trade (9 | 9.8%).
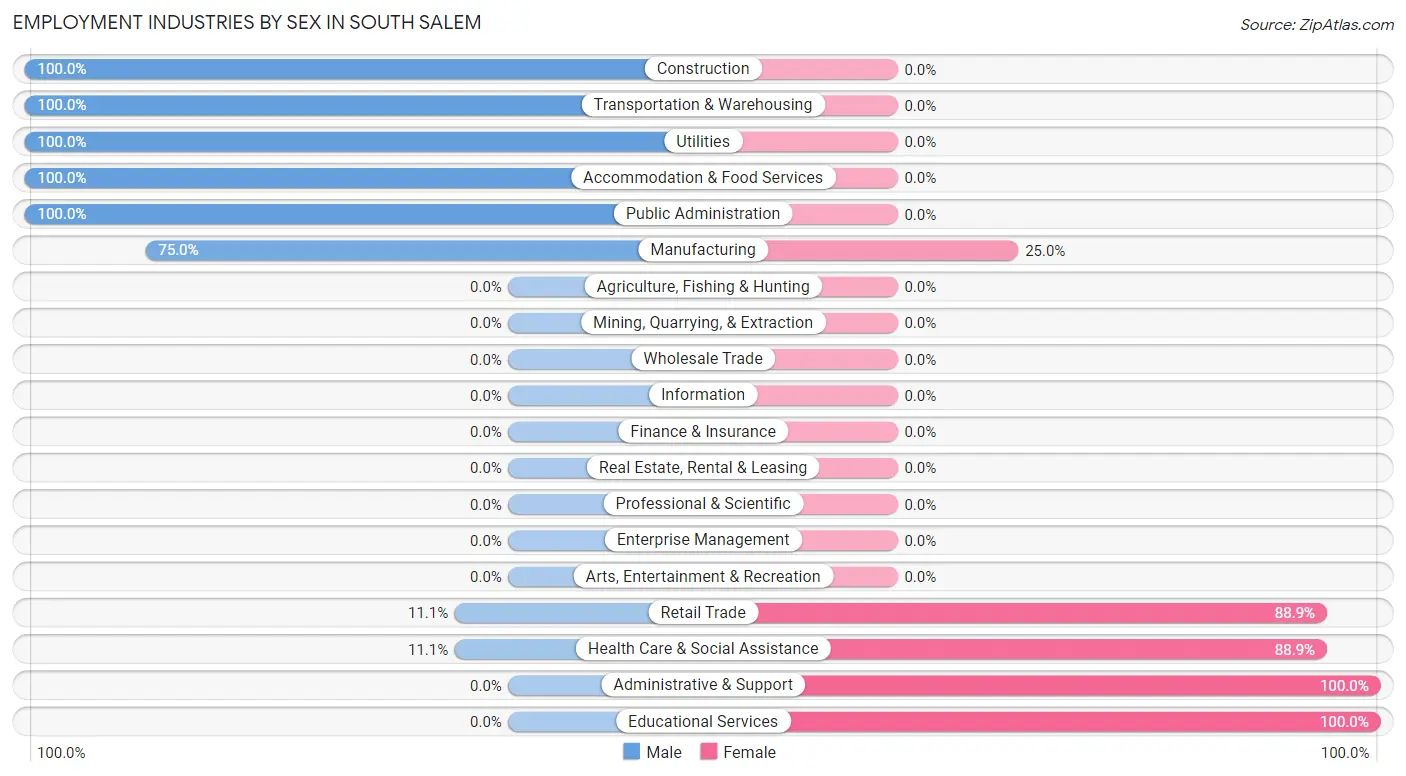
Employment Industries by Sex in South Salem
The South Salem industries that see more men than women are Construction (100.0%), Transportation & Warehousing (100.0%), and Utilities (100.0%), whereas the industries that tend to have a higher number of women are Administrative & Support (100.0%), Educational Services (100.0%), and Retail Trade (88.9%).
| Industry | Male | Female |
| Agriculture, Fishing & Hunting | 0 (0.0%) | 0 (0.0%) |
| Mining, Quarrying, & Extraction | 0 (0.0%) | 0 (0.0%) |
| Construction | 14 (100.0%) | 0 (0.0%) |
| Manufacturing | 18 (75.0%) | 6 (25.0%) |
| Wholesale Trade | 0 (0.0%) | 0 (0.0%) |
| Retail Trade | 1 (11.1%) | 8 (88.9%) |
| Transportation & Warehousing | 3 (100.0%) | 0 (0.0%) |
| Utilities | 1 (100.0%) | 0 (0.0%) |
| Information | 0 (0.0%) | 0 (0.0%) |
| Finance & Insurance | 0 (0.0%) | 0 (0.0%) |
| Real Estate, Rental & Leasing | 0 (0.0%) | 0 (0.0%) |
| Professional & Scientific | 0 (0.0%) | 0 (0.0%) |
| Enterprise Management | 0 (0.0%) | 0 (0.0%) |
| Administrative & Support | 0 (0.0%) | 3 (100.0%) |
| Educational Services | 0 (0.0%) | 10 (100.0%) |
| Health Care & Social Assistance | 1 (11.1%) | 8 (88.9%) |
| Arts, Entertainment & Recreation | 0 (0.0%) | 0 (0.0%) |
| Accommodation & Food Services | 1 (100.0%) | 0 (0.0%) |
| Public Administration | 10 (100.0%) | 0 (0.0%) |
| Total | 51 (55.4%) | 41 (44.6%) |
Education in South Salem
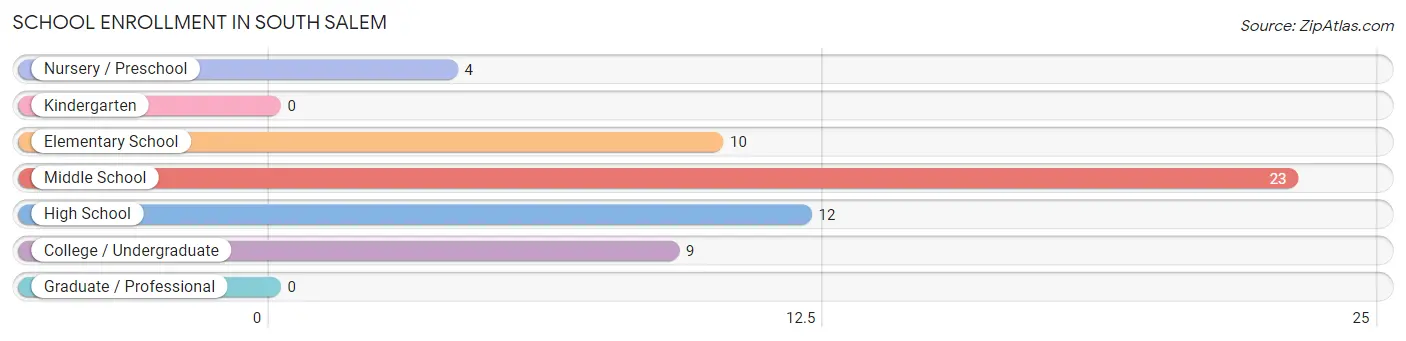
School Enrollment in South Salem
The most common levels of schooling among the 58 students in South Salem are middle school (23 | 39.7%), high school (12 | 20.7%), and elementary school (10 | 17.2%).
| School Level | # Students | % Students |
| Nursery / Preschool | 4 | 6.9% |
| Kindergarten | 0 | 0.0% |
| Elementary School | 10 | 17.2% |
| Middle School | 23 | 39.7% |
| High School | 12 | 20.7% |
| College / Undergraduate | 9 | 15.5% |
| Graduate / Professional | 0 | 0.0% |
| Total | 58 | 100.0% |
School Enrollment by Age by Funding Source in South Salem
Out of a total of 58 students who are enrolled in schools in South Salem, 11 (19.0%) attend a private institution, while the remaining 47 (81.0%) are enrolled in public schools. The age group of 5 to 9 year old has the highest likelihood of being enrolled in private schools, with 5 (45.5% in the age bracket) enrolled. Conversely, the age group of 3 to 4 year olds has the lowest likelihood of being enrolled in a private school, with 3 (100.0% in the age bracket) attending a public institution.
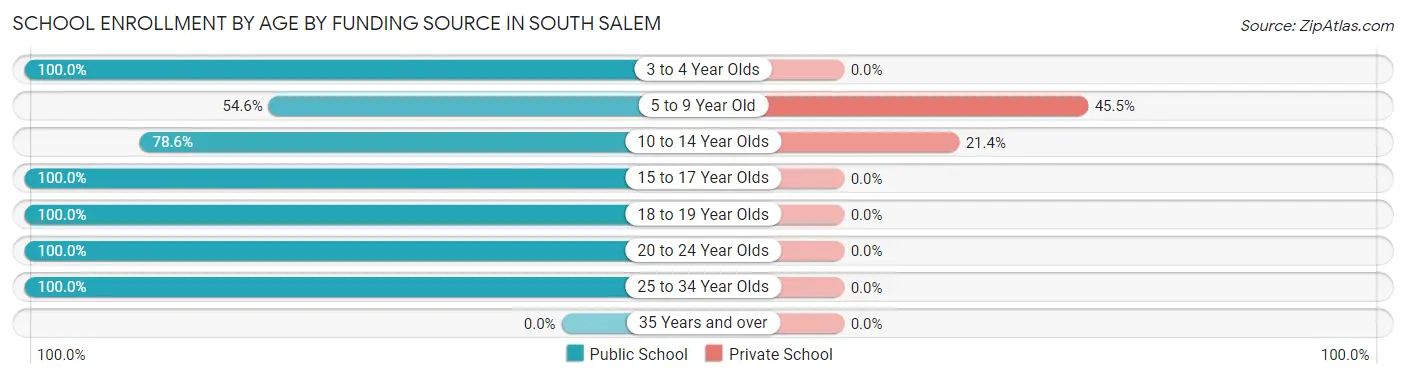
| Age Bracket | Public School | Private School |
| 3 to 4 Year Olds | 3 (100.0%) | 0 (0.0%) |
| 5 to 9 Year Old | 6 (54.5%) | 5 (45.5%) |
| 10 to 14 Year Olds | 22 (78.6%) | 6 (21.4%) |
| 15 to 17 Year Olds | 6 (100.0%) | 0 (0.0%) |
| 18 to 19 Year Olds | 1 (100.0%) | 0 (0.0%) |
| 20 to 24 Year Olds | 1 (100.0%) | 0 (0.0%) |
| 25 to 34 Year Olds | 8 (100.0%) | 0 (0.0%) |
| 35 Years and over | 0 (0.0%) | 0 (0.0%) |
| Total | 47 (81.0%) | 11 (19.0%) |
Educational Attainment by Field of Study in South Salem
Business (14 | 42.4%), arts & humanities (7 | 21.2%), education (6 | 18.2%), visual & performing arts (3 | 9.1%), and liberal arts & history (2 | 6.1%) are the most common fields of study among 33 individuals in South Salem who have obtained a bachelor's degree or higher.
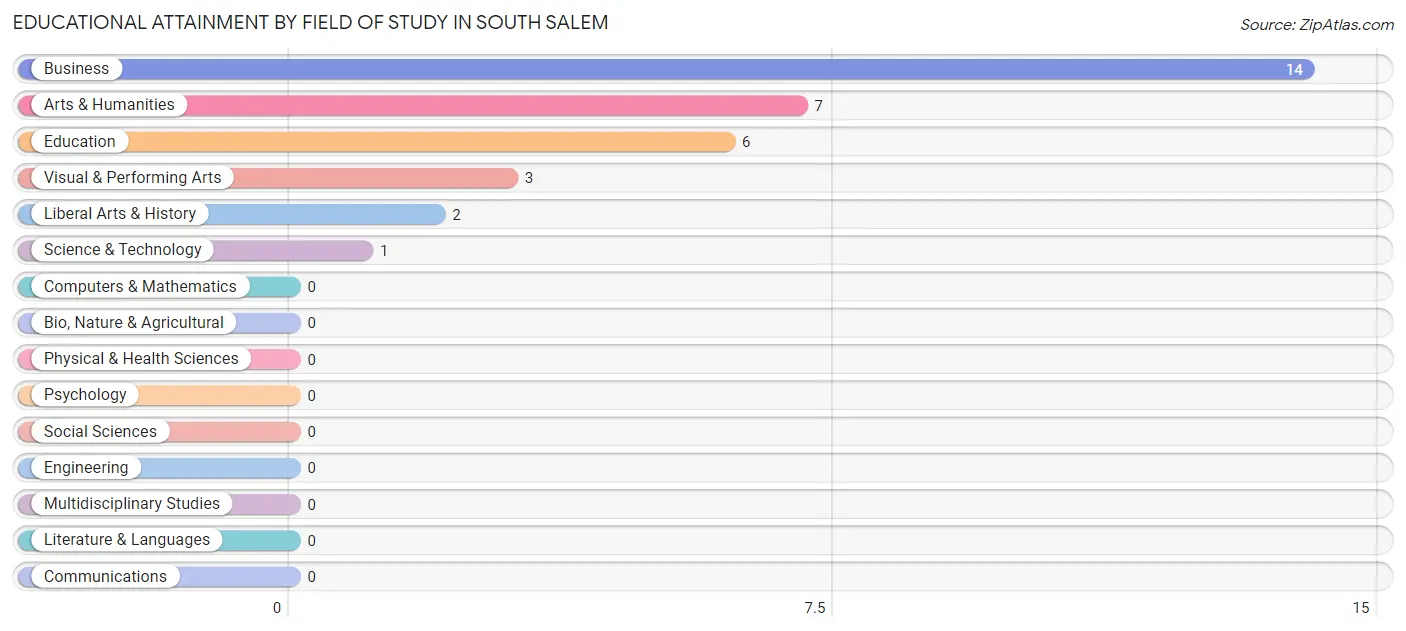
| Field of Study | # Graduates | % Graduates |
| Computers & Mathematics | 0 | 0.0% |
| Bio, Nature & Agricultural | 0 | 0.0% |
| Physical & Health Sciences | 0 | 0.0% |
| Psychology | 0 | 0.0% |
| Social Sciences | 0 | 0.0% |
| Engineering | 0 | 0.0% |
| Multidisciplinary Studies | 0 | 0.0% |
| Science & Technology | 1 | 3.0% |
| Business | 14 | 42.4% |
| Education | 6 | 18.2% |
| Literature & Languages | 0 | 0.0% |
| Liberal Arts & History | 2 | 6.1% |
| Visual & Performing Arts | 3 | 9.1% |
| Communications | 0 | 0.0% |
| Arts & Humanities | 7 | 21.2% |
| Total | 33 | 100.0% |
Transportation & Commute in South Salem
Vehicle Availability by Sex in South Salem
The most prevalent vehicle ownership categories in South Salem are males with 2 vehicles (23, accounting for 45.1%) and females with 2 vehicles (19, making up 56.1%).
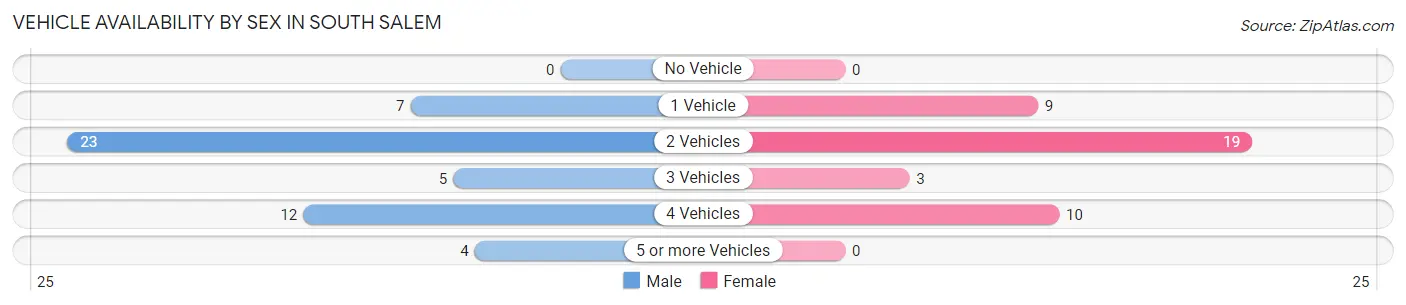
| Vehicles Available | Male | Female |
| No Vehicle | 0 (0.0%) | 0 (0.0%) |
| 1 Vehicle | 7 (13.7%) | 9 (22.0%) |
| 2 Vehicles | 23 (45.1%) | 19 (46.3%) |
| 3 Vehicles | 5 (9.8%) | 3 (7.3%) |
| 4 Vehicles | 12 (23.5%) | 10 (24.4%) |
| 5 or more Vehicles | 4 (7.8%) | 0 (0.0%) |
| Total | 51 (100.0%) | 41 (100.0%) |
Commute Time in South Salem
The most frequently occuring commute durations in South Salem are 30 to 34 minutes (20 commuters, 22.0%), 45 to 59 minutes (16 commuters, 17.6%), and 25 to 29 minutes (14 commuters, 15.4%).
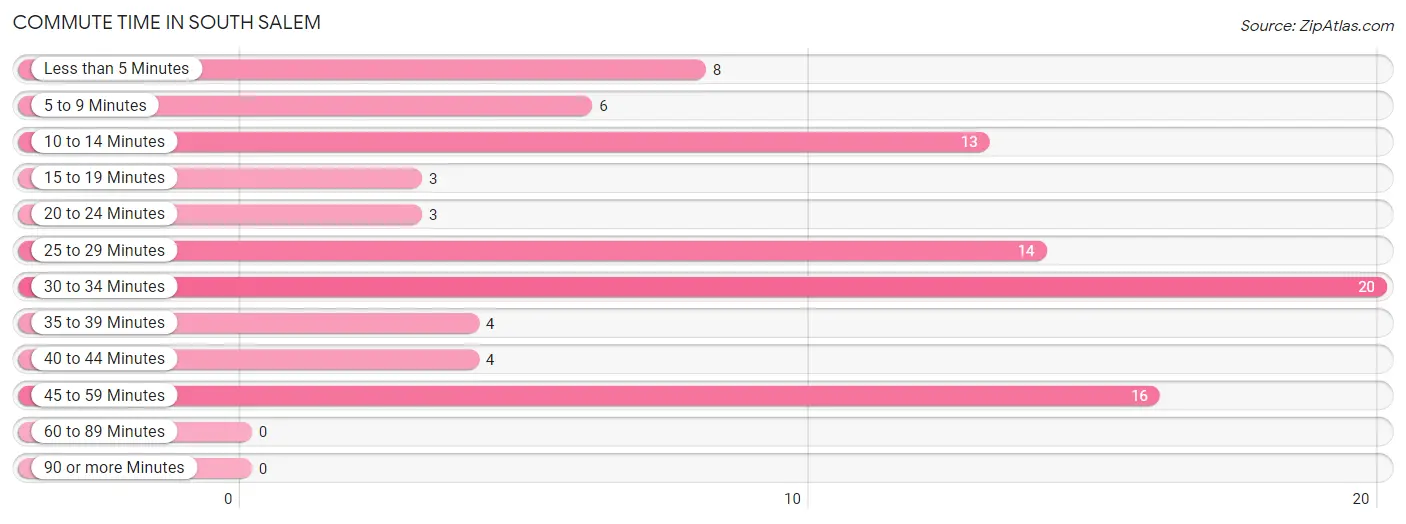
| Commute Time | # Commuters | % Commuters |
| Less than 5 Minutes | 8 | 8.8% |
| 5 to 9 Minutes | 6 | 6.6% |
| 10 to 14 Minutes | 13 | 14.3% |
| 15 to 19 Minutes | 3 | 3.3% |
| 20 to 24 Minutes | 3 | 3.3% |
| 25 to 29 Minutes | 14 | 15.4% |
| 30 to 34 Minutes | 20 | 22.0% |
| 35 to 39 Minutes | 4 | 4.4% |
| 40 to 44 Minutes | 4 | 4.4% |
| 45 to 59 Minutes | 16 | 17.6% |
| 60 to 89 Minutes | 0 | 0.0% |
| 90 or more Minutes | 0 | 0.0% |
Commute Time by Sex in South Salem
The most common commute times in South Salem are 30 to 34 minutes (18 commuters, 35.3%) for males and 25 to 29 minutes (13 commuters, 32.5%) for females.
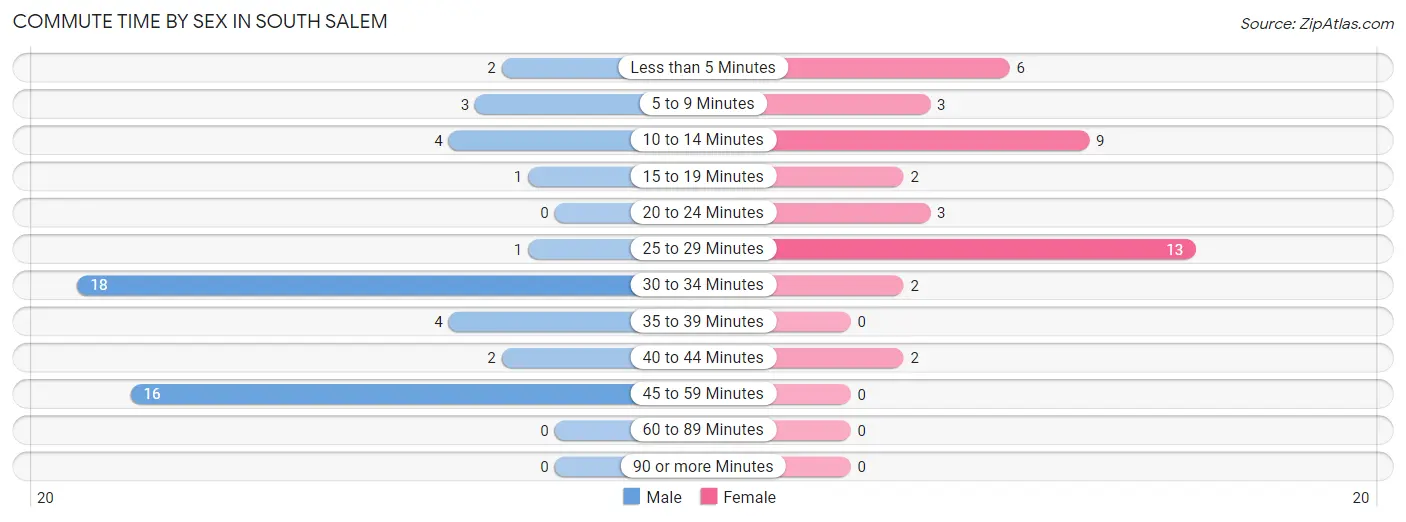
| Commute Time | Male | Female |
| Less than 5 Minutes | 2 (3.9%) | 6 (15.0%) |
| 5 to 9 Minutes | 3 (5.9%) | 3 (7.5%) |
| 10 to 14 Minutes | 4 (7.8%) | 9 (22.5%) |
| 15 to 19 Minutes | 1 (2.0%) | 2 (5.0%) |
| 20 to 24 Minutes | 0 (0.0%) | 3 (7.5%) |
| 25 to 29 Minutes | 1 (2.0%) | 13 (32.5%) |
| 30 to 34 Minutes | 18 (35.3%) | 2 (5.0%) |
| 35 to 39 Minutes | 4 (7.8%) | 0 (0.0%) |
| 40 to 44 Minutes | 2 (3.9%) | 2 (5.0%) |
| 45 to 59 Minutes | 16 (31.4%) | 0 (0.0%) |
| 60 to 89 Minutes | 0 (0.0%) | 0 (0.0%) |
| 90 or more Minutes | 0 (0.0%) | 0 (0.0%) |
Time of Departure to Work by Sex in South Salem
The most frequent times of departure to work in South Salem are 7:00 AM to 7:29 AM (22, 43.1%) for males and 8:00 AM to 8:29 AM (14, 35.0%) for females.
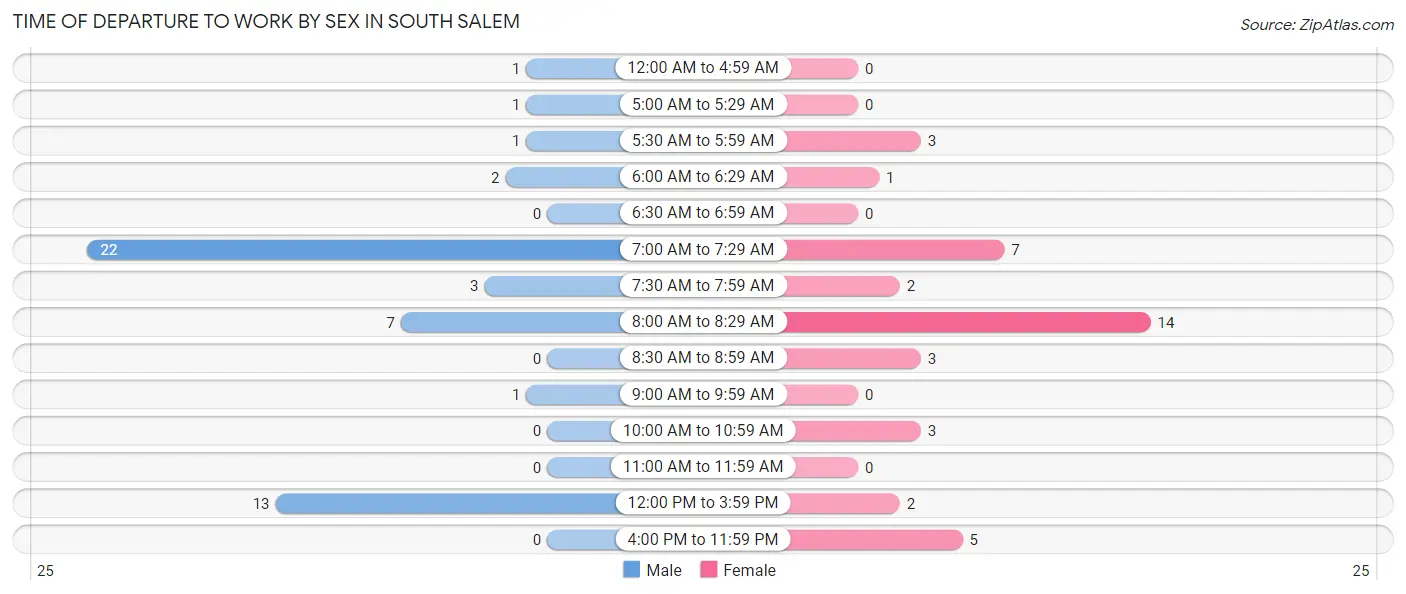
| Time of Departure | Male | Female |
| 12:00 AM to 4:59 AM | 1 (2.0%) | 0 (0.0%) |
| 5:00 AM to 5:29 AM | 1 (2.0%) | 0 (0.0%) |
| 5:30 AM to 5:59 AM | 1 (2.0%) | 3 (7.5%) |
| 6:00 AM to 6:29 AM | 2 (3.9%) | 1 (2.5%) |
| 6:30 AM to 6:59 AM | 0 (0.0%) | 0 (0.0%) |
| 7:00 AM to 7:29 AM | 22 (43.1%) | 7 (17.5%) |
| 7:30 AM to 7:59 AM | 3 (5.9%) | 2 (5.0%) |
| 8:00 AM to 8:29 AM | 7 (13.7%) | 14 (35.0%) |
| 8:30 AM to 8:59 AM | 0 (0.0%) | 3 (7.5%) |
| 9:00 AM to 9:59 AM | 1 (2.0%) | 0 (0.0%) |
| 10:00 AM to 10:59 AM | 0 (0.0%) | 3 (7.5%) |
| 11:00 AM to 11:59 AM | 0 (0.0%) | 0 (0.0%) |
| 12:00 PM to 3:59 PM | 13 (25.5%) | 2 (5.0%) |
| 4:00 PM to 11:59 PM | 0 (0.0%) | 5 (12.5%) |
| Total | 51 (100.0%) | 40 (100.0%) |
Housing Occupancy in South Salem
Occupancy by Ownership in South Salem
Of the total 76 dwellings in South Salem, owner-occupied units account for 52 (68.4%), while renter-occupied units make up 24 (31.6%).

| Occupancy | # Housing Units | % Housing Units |
| Owner Occupied Housing Units | 52 | 68.4% |
| Renter-Occupied Housing Units | 24 | 31.6% |
| Total Occupied Housing Units | 76 | 100.0% |
Occupancy by Household Size in South Salem
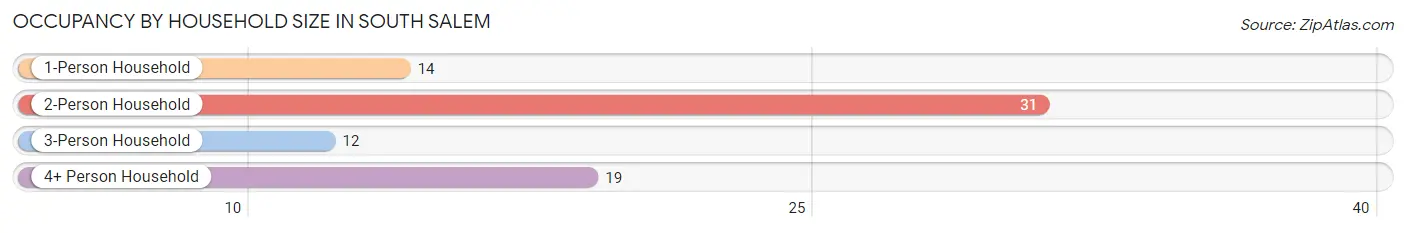
| Household Size | # Housing Units | % Housing Units |
| 1-Person Household | 14 | 18.4% |
| 2-Person Household | 31 | 40.8% |
| 3-Person Household | 12 | 15.8% |
| 4+ Person Household | 19 | 25.0% |
| Total Housing Units | 76 | 100.0% |
Occupancy by Ownership by Household Size in South Salem
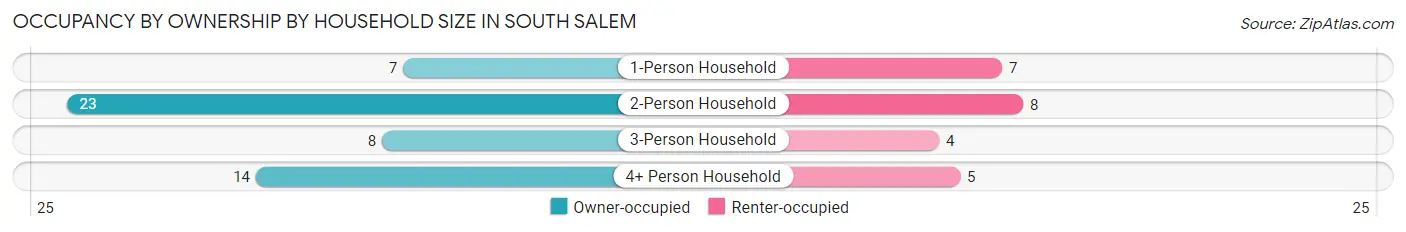
| Household Size | Owner-occupied | Renter-occupied |
| 1-Person Household | 7 (50.0%) | 7 (50.0%) |
| 2-Person Household | 23 (74.2%) | 8 (25.8%) |
| 3-Person Household | 8 (66.7%) | 4 (33.3%) |
| 4+ Person Household | 14 (73.7%) | 5 (26.3%) |
| Total Housing Units | 52 (68.4%) | 24 (31.6%) |
Occupancy by Educational Attainment in South Salem
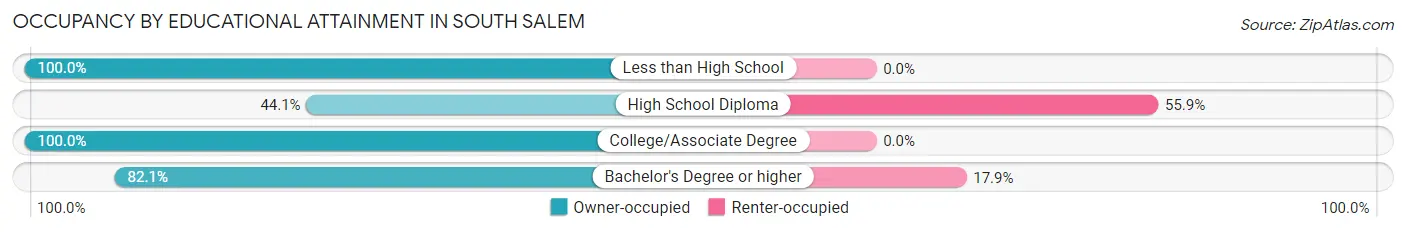
| Household Size | Owner-occupied | Renter-occupied |
| Less than High School | 2 (100.0%) | 0 (0.0%) |
| High School Diploma | 15 (44.1%) | 19 (55.9%) |
| College/Associate Degree | 12 (100.0%) | 0 (0.0%) |
| Bachelor's Degree or higher | 23 (82.1%) | 5 (17.9%) |
Occupancy by Age of Householder in South Salem
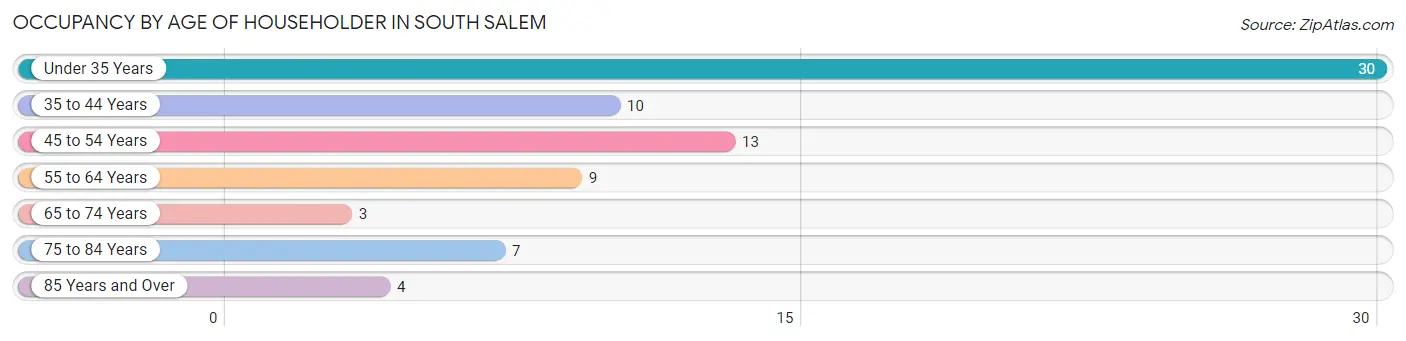
| Age Bracket | # Households | % Households |
| Under 35 Years | 30 | 39.5% |
| 35 to 44 Years | 10 | 13.2% |
| 45 to 54 Years | 13 | 17.1% |
| 55 to 64 Years | 9 | 11.8% |
| 65 to 74 Years | 3 | 4.0% |
| 75 to 84 Years | 7 | 9.2% |
| 85 Years and Over | 4 | 5.3% |
| Total | 76 | 100.0% |
Housing Finances in South Salem
Median Income by Occupancy in South Salem
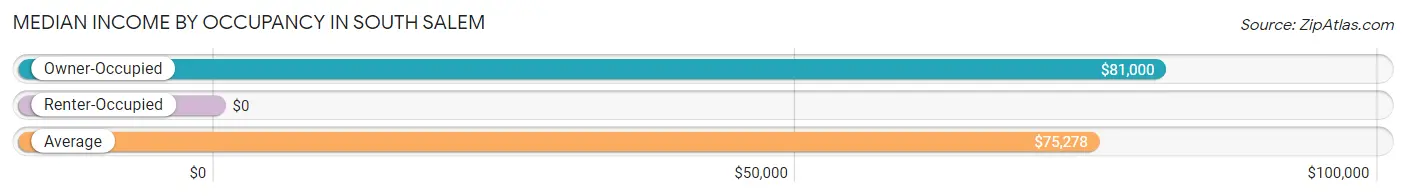
| Occupancy Type | # Households | Median Income |
| Owner-Occupied | 52 (68.4%) | $81,000 |
| Renter-Occupied | 24 (31.6%) | $0 |
| Average | 76 (100.0%) | $75,278 |
Occupancy by Householder Income Bracket in South Salem
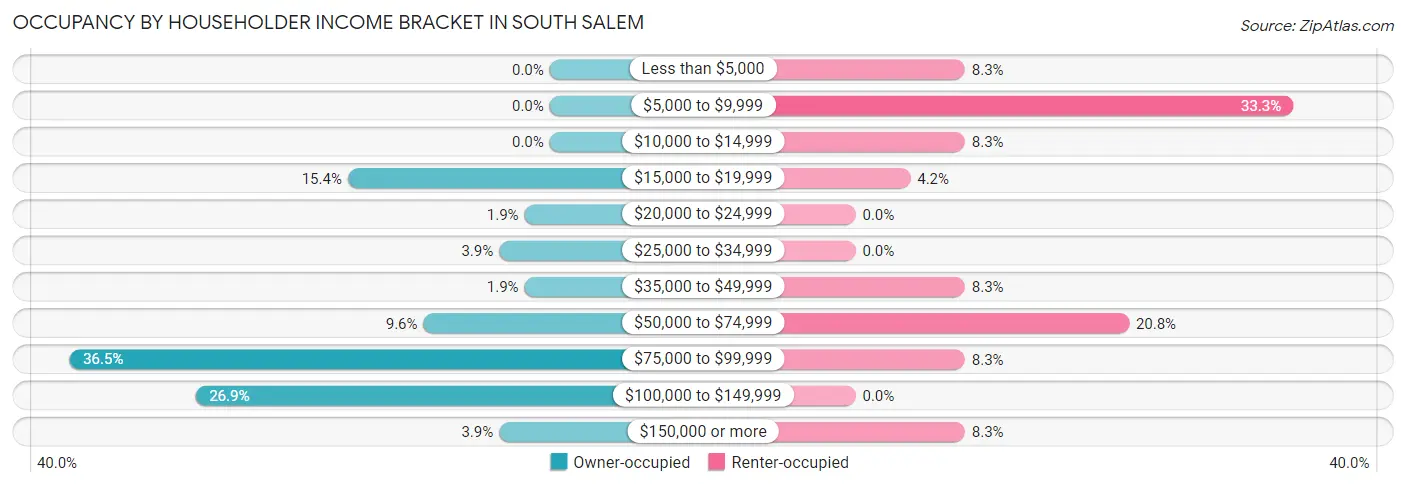
| Income Bracket | Owner-occupied | Renter-occupied |
| Less than $5,000 | 0 (0.0%) | 2 (8.3%) |
| $5,000 to $9,999 | 0 (0.0%) | 8 (33.3%) |
| $10,000 to $14,999 | 0 (0.0%) | 2 (8.3%) |
| $15,000 to $19,999 | 8 (15.4%) | 1 (4.2%) |
| $20,000 to $24,999 | 1 (1.9%) | 0 (0.0%) |
| $25,000 to $34,999 | 2 (3.8%) | 0 (0.0%) |
| $35,000 to $49,999 | 1 (1.9%) | 2 (8.3%) |
| $50,000 to $74,999 | 5 (9.6%) | 5 (20.8%) |
| $75,000 to $99,999 | 19 (36.5%) | 2 (8.3%) |
| $100,000 to $149,999 | 14 (26.9%) | 0 (0.0%) |
| $150,000 or more | 2 (3.8%) | 2 (8.3%) |
| Total | 52 (100.0%) | 24 (100.0%) |
Monthly Housing Cost Tiers in South Salem
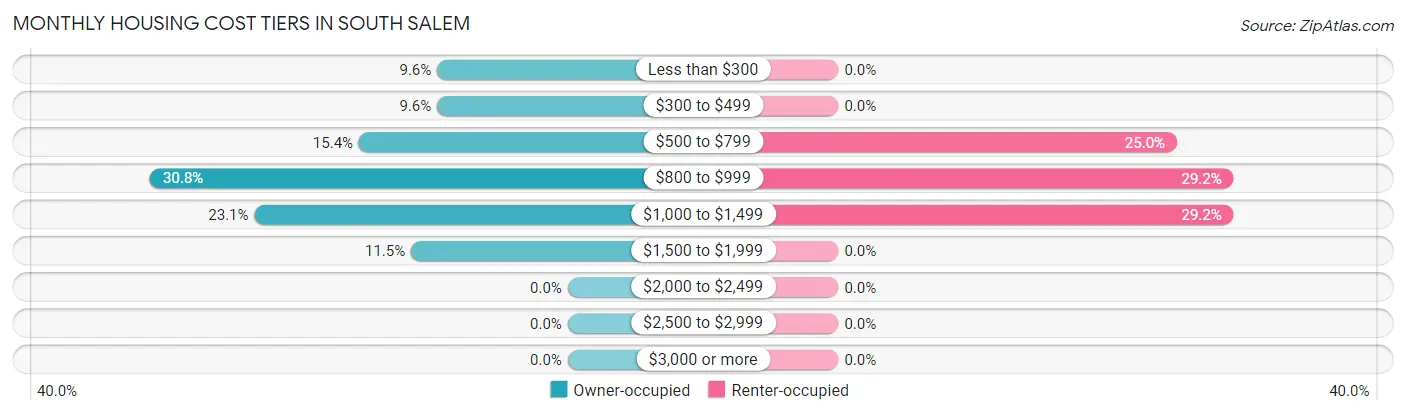
| Monthly Cost | Owner-occupied | Renter-occupied |
| Less than $300 | 5 (9.6%) | 0 (0.0%) |
| $300 to $499 | 5 (9.6%) | 0 (0.0%) |
| $500 to $799 | 8 (15.4%) | 6 (25.0%) |
| $800 to $999 | 16 (30.8%) | 7 (29.2%) |
| $1,000 to $1,499 | 12 (23.1%) | 7 (29.2%) |
| $1,500 to $1,999 | 6 (11.5%) | 0 (0.0%) |
| $2,000 to $2,499 | 0 (0.0%) | 0 (0.0%) |
| $2,500 to $2,999 | 0 (0.0%) | 0 (0.0%) |
| $3,000 or more | 0 (0.0%) | 0 (0.0%) |
| Total | 52 (100.0%) | 24 (100.0%) |
Physical Housing Characteristics in South Salem
Housing Structures in South Salem
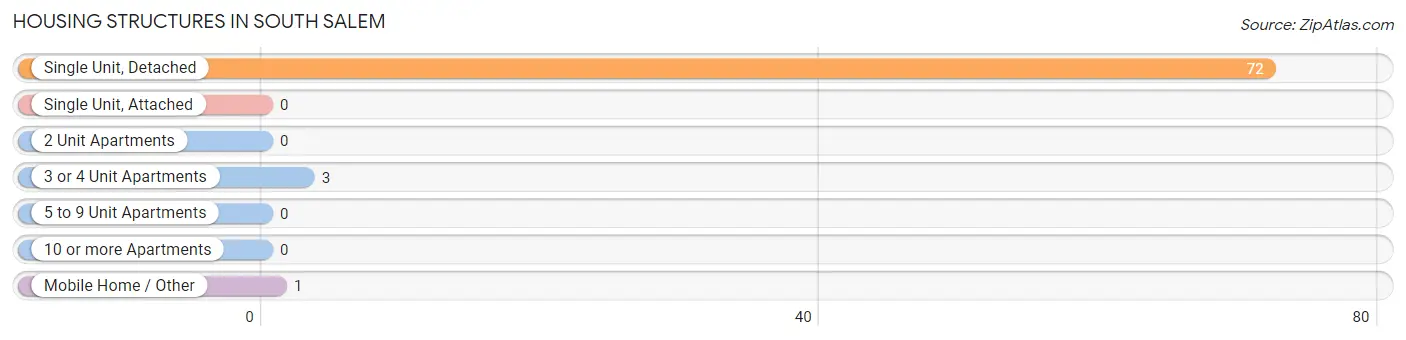
| Structure Type | # Housing Units | % Housing Units |
| Single Unit, Detached | 72 | 94.7% |
| Single Unit, Attached | 0 | 0.0% |
| 2 Unit Apartments | 0 | 0.0% |
| 3 or 4 Unit Apartments | 3 | 4.0% |
| 5 to 9 Unit Apartments | 0 | 0.0% |
| 10 or more Apartments | 0 | 0.0% |
| Mobile Home / Other | 1 | 1.3% |
| Total | 76 | 100.0% |
Housing Structures by Occupancy in South Salem
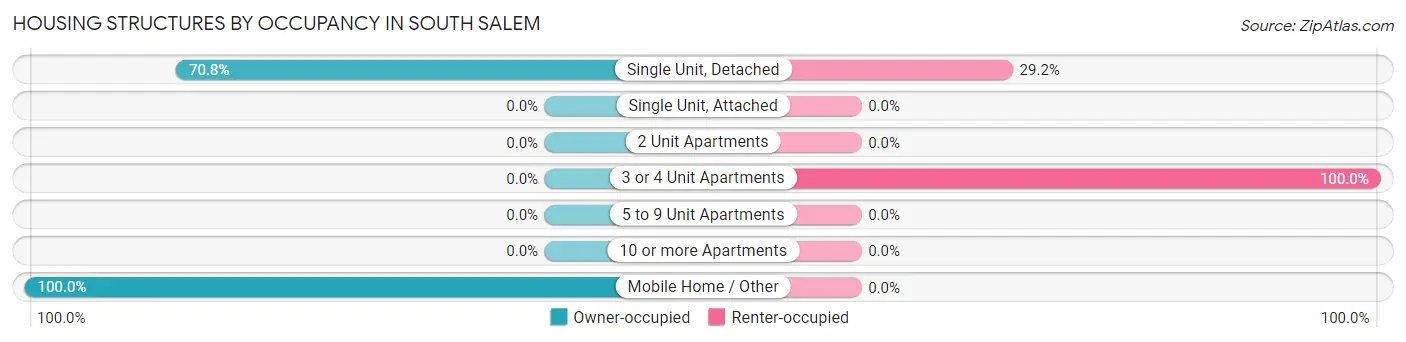
| Structure Type | Owner-occupied | Renter-occupied |
| Single Unit, Detached | 51 (70.8%) | 21 (29.2%) |
| Single Unit, Attached | 0 (0.0%) | 0 (0.0%) |
| 2 Unit Apartments | 0 (0.0%) | 0 (0.0%) |
| 3 or 4 Unit Apartments | 0 (0.0%) | 3 (100.0%) |
| 5 to 9 Unit Apartments | 0 (0.0%) | 0 (0.0%) |
| 10 or more Apartments | 0 (0.0%) | 0 (0.0%) |
| Mobile Home / Other | 1 (100.0%) | 0 (0.0%) |
| Total | 52 (68.4%) | 24 (31.6%) |
Housing Structures by Number of Rooms in South Salem
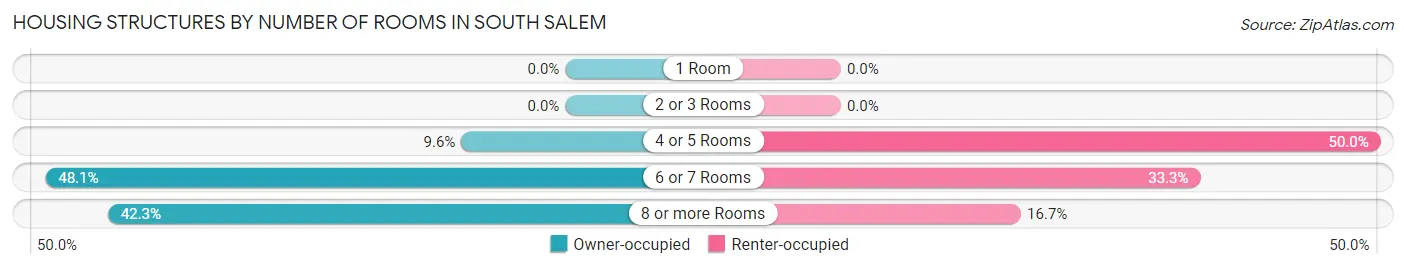
| Number of Rooms | Owner-occupied | Renter-occupied |
| 1 Room | 0 (0.0%) | 0 (0.0%) |
| 2 or 3 Rooms | 0 (0.0%) | 0 (0.0%) |
| 4 or 5 Rooms | 5 (9.6%) | 12 (50.0%) |
| 6 or 7 Rooms | 25 (48.1%) | 8 (33.3%) |
| 8 or more Rooms | 22 (42.3%) | 4 (16.7%) |
| Total | 52 (100.0%) | 24 (100.0%) |
Housing Structure by Heating Type in South Salem
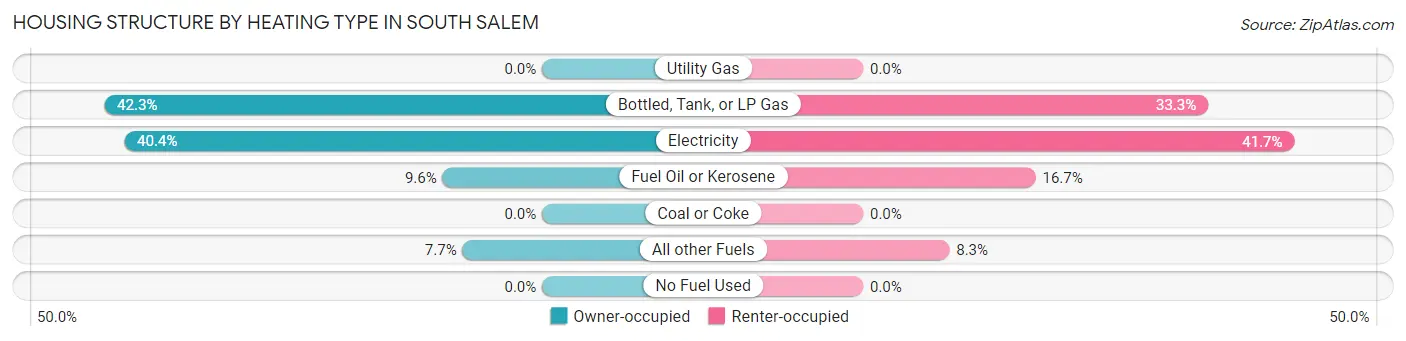
| Heating Type | Owner-occupied | Renter-occupied |
| Utility Gas | 0 (0.0%) | 0 (0.0%) |
| Bottled, Tank, or LP Gas | 22 (42.3%) | 8 (33.3%) |
| Electricity | 21 (40.4%) | 10 (41.7%) |
| Fuel Oil or Kerosene | 5 (9.6%) | 4 (16.7%) |
| Coal or Coke | 0 (0.0%) | 0 (0.0%) |
| All other Fuels | 4 (7.7%) | 2 (8.3%) |
| No Fuel Used | 0 (0.0%) | 0 (0.0%) |
| Total | 52 (100.0%) | 24 (100.0%) |
Household Vehicle Usage in South Salem
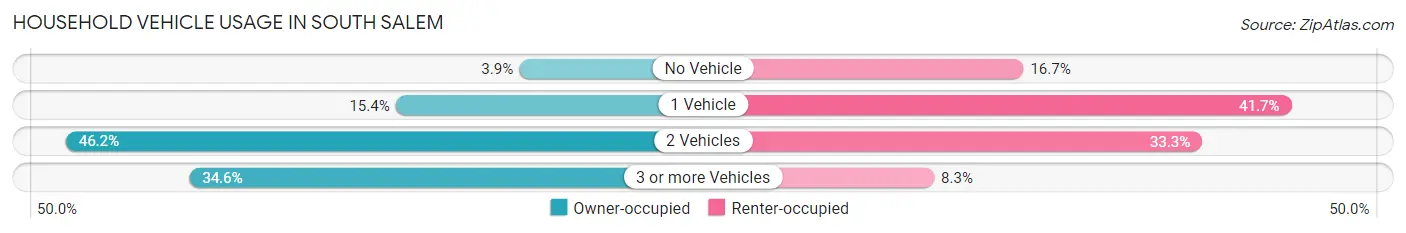
| Vehicles per Household | Owner-occupied | Renter-occupied |
| No Vehicle | 2 (3.8%) | 4 (16.7%) |
| 1 Vehicle | 8 (15.4%) | 10 (41.7%) |
| 2 Vehicles | 24 (46.2%) | 8 (33.3%) |
| 3 or more Vehicles | 18 (34.6%) | 2 (8.3%) |
| Total | 52 (100.0%) | 24 (100.0%) |
Real Estate & Mortgages in South Salem
Real Estate and Mortgage Overview in South Salem
| Characteristic | Without Mortgage | With Mortgage |
| Housing Units | 27 | 25 |
| Median Property Value | $115,600 | $117,200 |
| Median Household Income | $75,179 | $2 |
| Monthly Housing Costs | $736 | $0 |
| Real Estate Taxes | $2,000 | $5 |
Property Value by Mortgage Status in South Salem
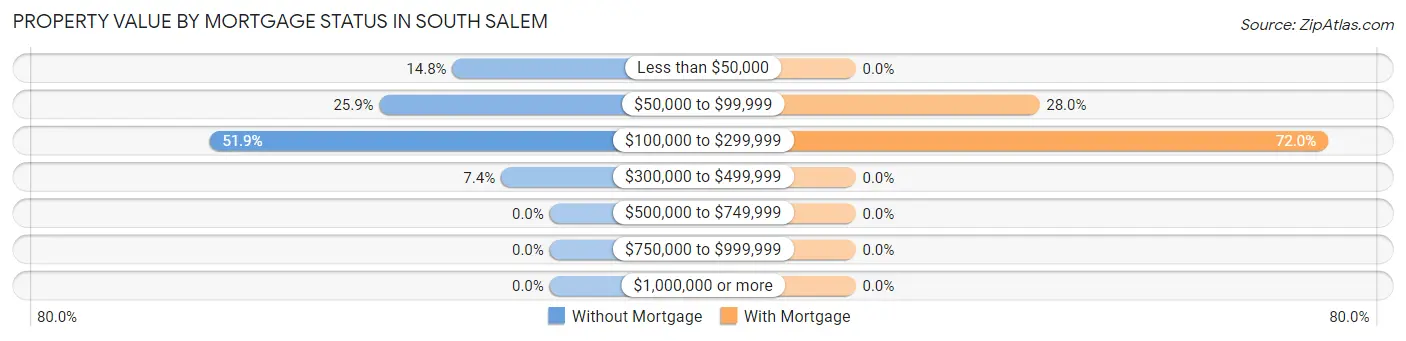
| Property Value | Without Mortgage | With Mortgage |
| Less than $50,000 | 4 (14.8%) | 0 (0.0%) |
| $50,000 to $99,999 | 7 (25.9%) | 7 (28.0%) |
| $100,000 to $299,999 | 14 (51.8%) | 18 (72.0%) |
| $300,000 to $499,999 | 2 (7.4%) | 0 (0.0%) |
| $500,000 to $749,999 | 0 (0.0%) | 0 (0.0%) |
| $750,000 to $999,999 | 0 (0.0%) | 0 (0.0%) |
| $1,000,000 or more | 0 (0.0%) | 0 (0.0%) |
| Total | 27 (100.0%) | 25 (100.0%) |
Household Income by Mortgage Status in South Salem
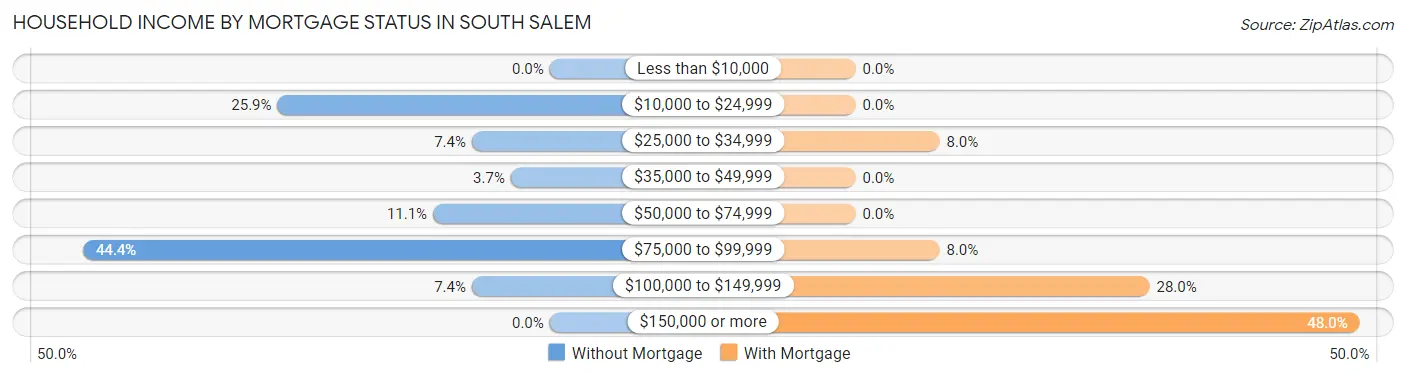
| Household Income | Without Mortgage | With Mortgage |
| Less than $10,000 | 0 (0.0%) | 0 (0.0%) |
| $10,000 to $24,999 | 7 (25.9%) | 0 (0.0%) |
| $25,000 to $34,999 | 2 (7.4%) | 2 (8.0%) |
| $35,000 to $49,999 | 1 (3.7%) | 0 (0.0%) |
| $50,000 to $74,999 | 3 (11.1%) | 0 (0.0%) |
| $75,000 to $99,999 | 12 (44.4%) | 2 (8.0%) |
| $100,000 to $149,999 | 2 (7.4%) | 7 (28.0%) |
| $150,000 or more | 0 (0.0%) | 12 (48.0%) |
| Total | 27 (100.0%) | 25 (100.0%) |
Property Value to Household Income Ratio in South Salem
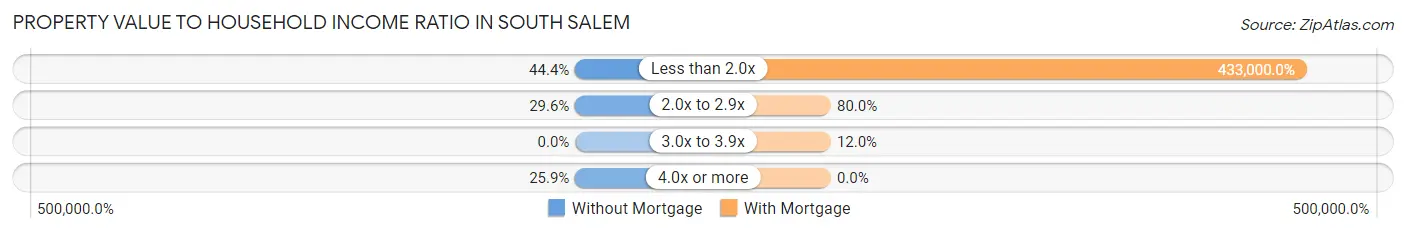
| Value-to-Income Ratio | Without Mortgage | With Mortgage |
| Less than 2.0x | 12 (44.4%) | 108,250 (433,000.0%) |
| 2.0x to 2.9x | 8 (29.6%) | 20 (80.0%) |
| 3.0x to 3.9x | 0 (0.0%) | 3 (12.0%) |
| 4.0x or more | 7 (25.9%) | 0 (0.0%) |
| Total | 27 (100.0%) | 25 (100.0%) |
Real Estate Taxes by Mortgage Status in South Salem
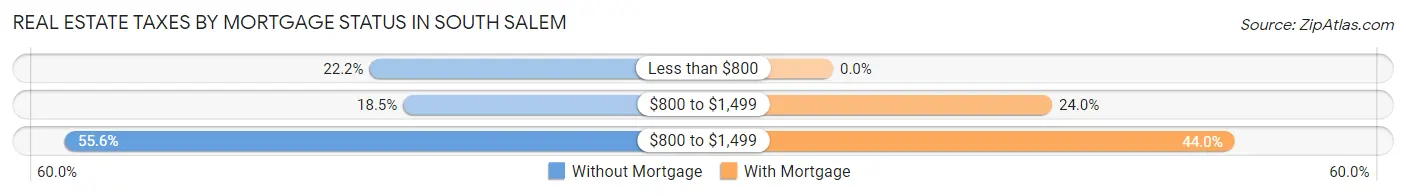
| Property Taxes | Without Mortgage | With Mortgage |
| Less than $800 | 6 (22.2%) | 0 (0.0%) |
| $800 to $1,499 | 5 (18.5%) | 6 (24.0%) |
| $800 to $1,499 | 15 (55.6%) | 11 (44.0%) |
| Total | 27 (100.0%) | 25 (100.0%) |
Health & Disability in South Salem
Health Insurance Coverage by Age in South Salem
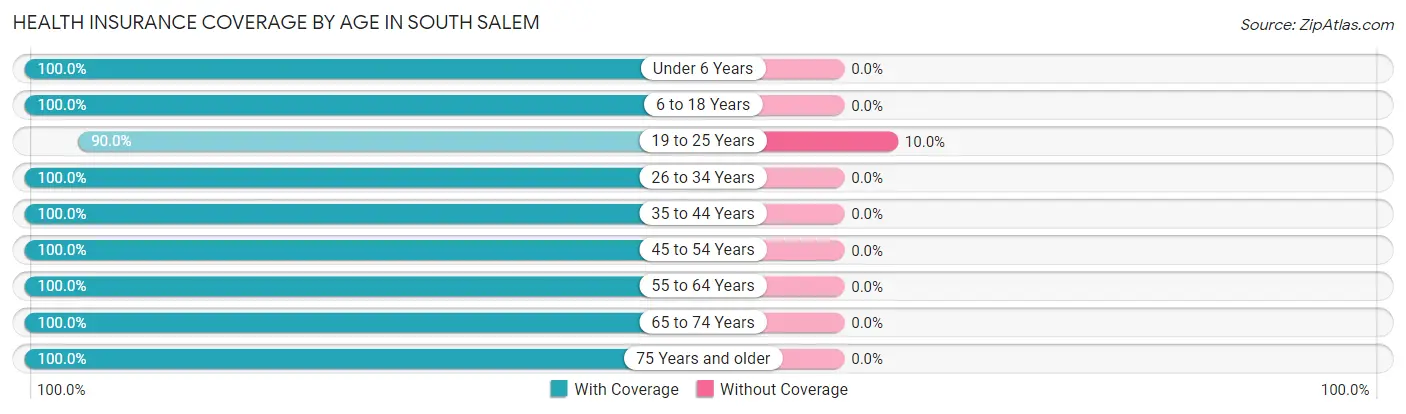
| Age Bracket | With Coverage | Without Coverage |
| Under 6 Years | 11 (100.0%) | 0 (0.0%) |
| 6 to 18 Years | 45 (100.0%) | 0 (0.0%) |
| 19 to 25 Years | 9 (90.0%) | 1 (10.0%) |
| 26 to 34 Years | 50 (100.0%) | 0 (0.0%) |
| 35 to 44 Years | 23 (100.0%) | 0 (0.0%) |
| 45 to 54 Years | 20 (100.0%) | 0 (0.0%) |
| 55 to 64 Years | 13 (100.0%) | 0 (0.0%) |
| 65 to 74 Years | 4 (100.0%) | 0 (0.0%) |
| 75 Years and older | 16 (100.0%) | 0 (0.0%) |
| Total | 191 (99.5%) | 1 (0.5%) |
Health Insurance Coverage by Citizenship Status in South Salem
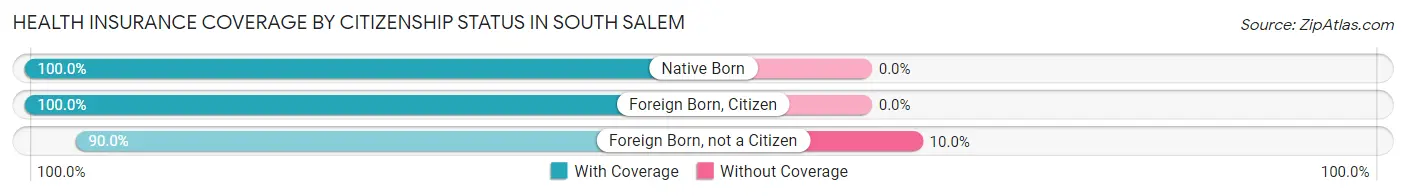
| Citizenship Status | With Coverage | Without Coverage |
| Native Born | 11 (100.0%) | 0 (0.0%) |
| Foreign Born, Citizen | 45 (100.0%) | 0 (0.0%) |
| Foreign Born, not a Citizen | 9 (90.0%) | 1 (10.0%) |
Health Insurance Coverage by Household Income in South Salem
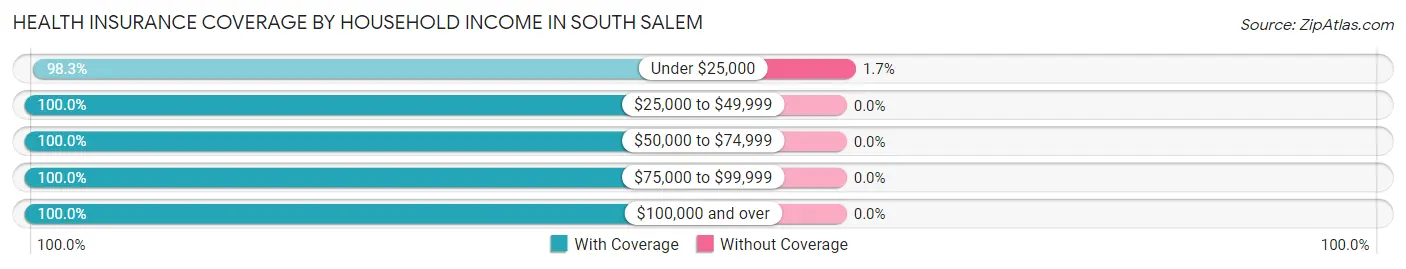
| Household Income | With Coverage | Without Coverage |
| Under $25,000 | 57 (98.3%) | 1 (1.7%) |
| $25,000 to $49,999 | 9 (100.0%) | 0 (0.0%) |
| $50,000 to $74,999 | 13 (100.0%) | 0 (0.0%) |
| $75,000 to $99,999 | 46 (100.0%) | 0 (0.0%) |
| $100,000 and over | 66 (100.0%) | 0 (0.0%) |
Public vs Private Health Insurance Coverage by Age in South Salem
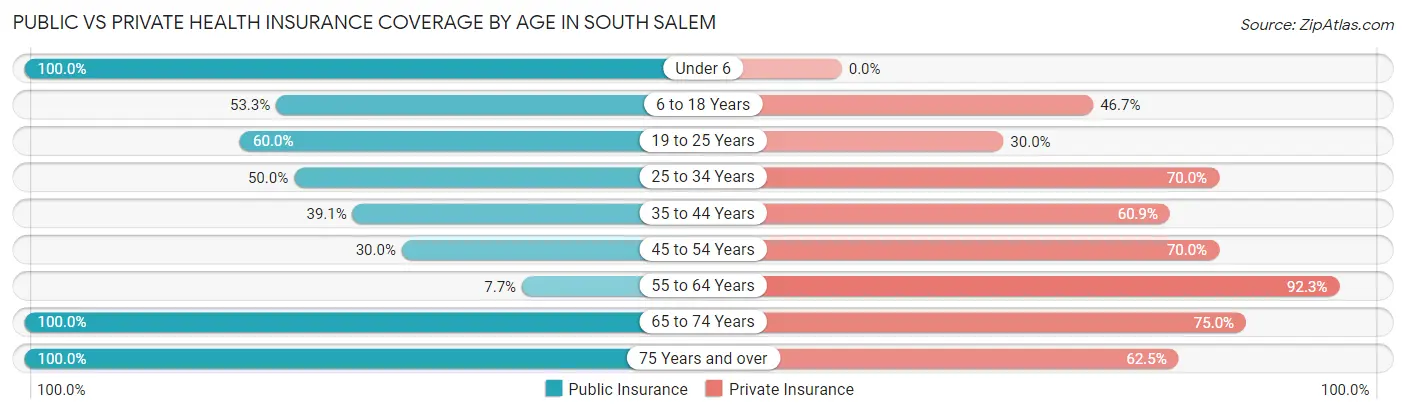
| Age Bracket | Public Insurance | Private Insurance |
| Under 6 | 11 (100.0%) | 0 (0.0%) |
| 6 to 18 Years | 24 (53.3%) | 21 (46.7%) |
| 19 to 25 Years | 6 (60.0%) | 3 (30.0%) |
| 25 to 34 Years | 25 (50.0%) | 35 (70.0%) |
| 35 to 44 Years | 9 (39.1%) | 14 (60.9%) |
| 45 to 54 Years | 6 (30.0%) | 14 (70.0%) |
| 55 to 64 Years | 1 (7.7%) | 12 (92.3%) |
| 65 to 74 Years | 4 (100.0%) | 3 (75.0%) |
| 75 Years and over | 16 (100.0%) | 10 (62.5%) |
| Total | 102 (53.1%) | 112 (58.3%) |
Disability Status by Sex by Age in South Salem
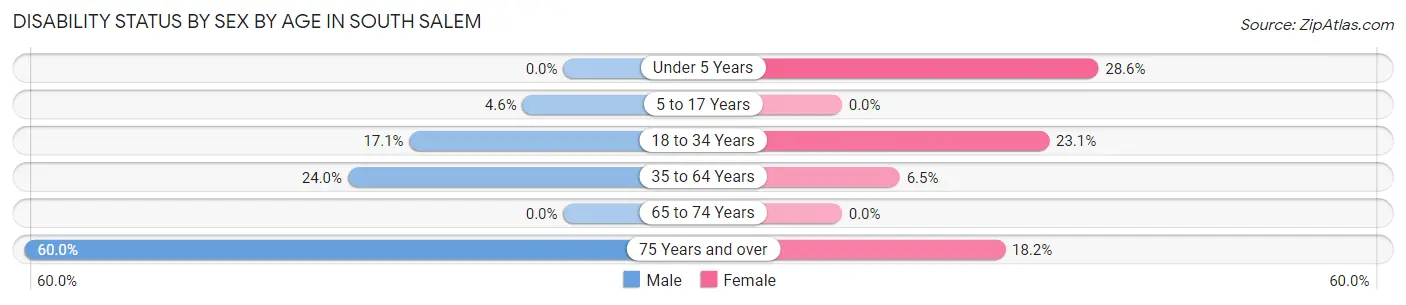
| Age Bracket | Male | Female |
| Under 5 Years | 0 (0.0%) | 2 (28.6%) |
| 5 to 17 Years | 1 (4.5%) | 0 (0.0%) |
| 18 to 34 Years | 6 (17.1%) | 6 (23.1%) |
| 35 to 64 Years | 6 (24.0%) | 2 (6.5%) |
| 65 to 74 Years | 0 (0.0%) | 0 (0.0%) |
| 75 Years and over | 3 (60.0%) | 2 (18.2%) |
Disability Class by Sex by Age in South Salem
Disability Class: Hearing Difficulty
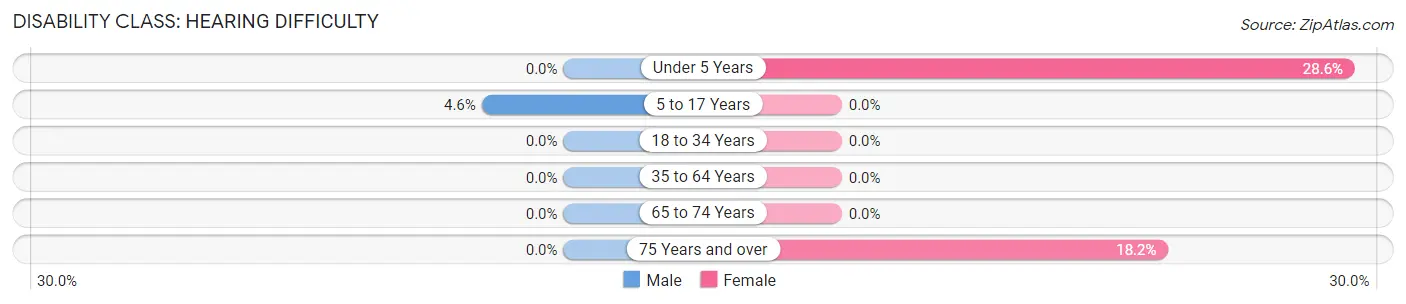
| Age Bracket | Male | Female |
| Under 5 Years | 0 (0.0%) | 2 (28.6%) |
| 5 to 17 Years | 1 (4.5%) | 0 (0.0%) |
| 18 to 34 Years | 0 (0.0%) | 0 (0.0%) |
| 35 to 64 Years | 0 (0.0%) | 0 (0.0%) |
| 65 to 74 Years | 0 (0.0%) | 0 (0.0%) |
| 75 Years and over | 0 (0.0%) | 2 (18.2%) |
Disability Class: Vision Difficulty
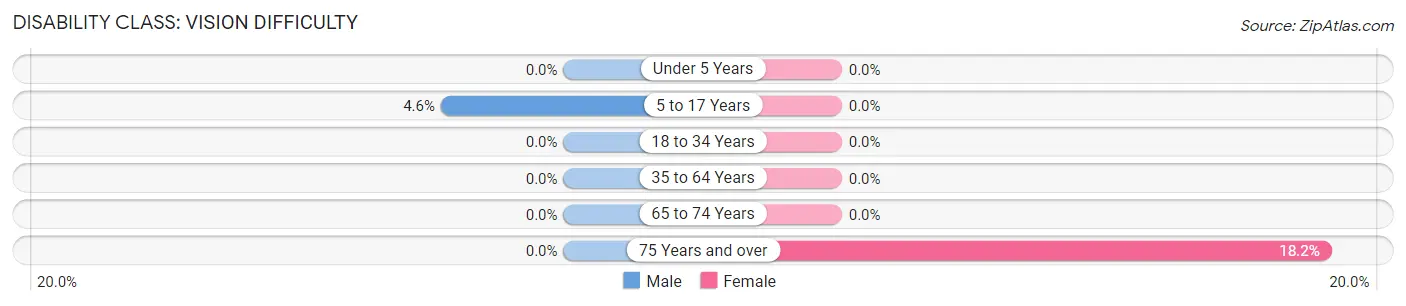
| Age Bracket | Male | Female |
| Under 5 Years | 0 (0.0%) | 0 (0.0%) |
| 5 to 17 Years | 1 (4.5%) | 0 (0.0%) |
| 18 to 34 Years | 0 (0.0%) | 0 (0.0%) |
| 35 to 64 Years | 0 (0.0%) | 0 (0.0%) |
| 65 to 74 Years | 0 (0.0%) | 0 (0.0%) |
| 75 Years and over | 0 (0.0%) | 2 (18.2%) |
Disability Class: Cognitive Difficulty
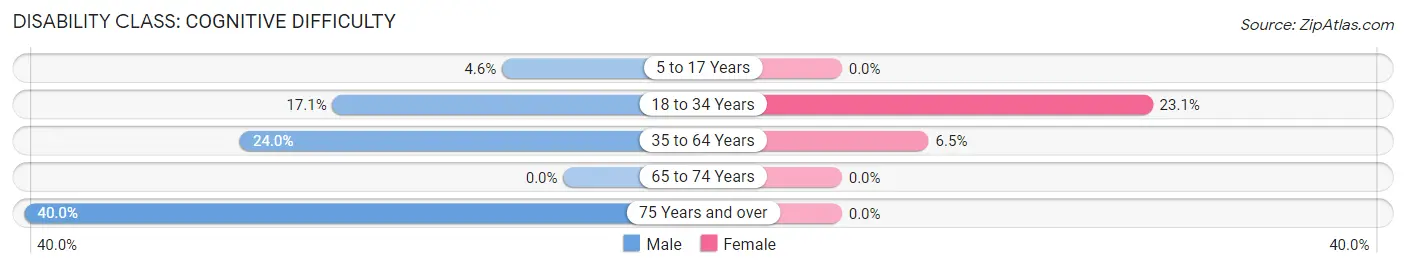
| Age Bracket | Male | Female |
| 5 to 17 Years | 1 (4.5%) | 0 (0.0%) |
| 18 to 34 Years | 6 (17.1%) | 6 (23.1%) |
| 35 to 64 Years | 6 (24.0%) | 2 (6.5%) |
| 65 to 74 Years | 0 (0.0%) | 0 (0.0%) |
| 75 Years and over | 2 (40.0%) | 0 (0.0%) |
Disability Class: Ambulatory Difficulty
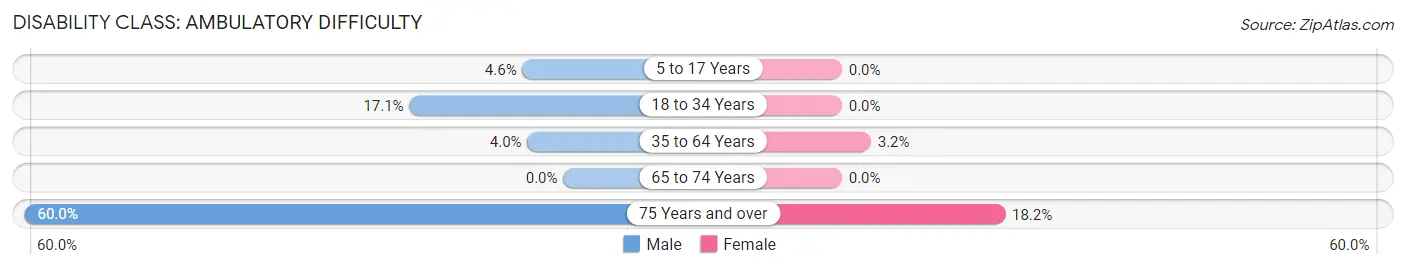
| Age Bracket | Male | Female |
| 5 to 17 Years | 1 (4.5%) | 0 (0.0%) |
| 18 to 34 Years | 6 (17.1%) | 0 (0.0%) |
| 35 to 64 Years | 1 (4.0%) | 1 (3.2%) |
| 65 to 74 Years | 0 (0.0%) | 0 (0.0%) |
| 75 Years and over | 3 (60.0%) | 2 (18.2%) |
Disability Class: Self-Care Difficulty
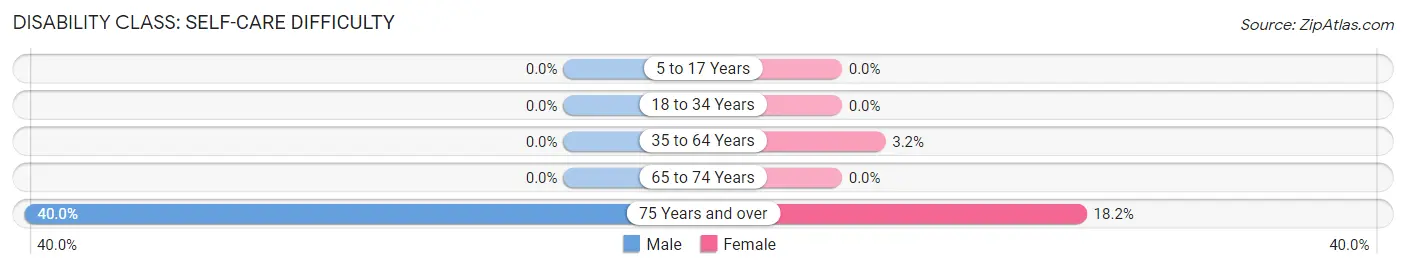
| Age Bracket | Male | Female |
| 5 to 17 Years | 0 (0.0%) | 0 (0.0%) |
| 18 to 34 Years | 0 (0.0%) | 0 (0.0%) |
| 35 to 64 Years | 0 (0.0%) | 1 (3.2%) |
| 65 to 74 Years | 0 (0.0%) | 0 (0.0%) |
| 75 Years and over | 2 (40.0%) | 2 (18.2%) |
Technology Access in South Salem
Computing Device Access in South Salem
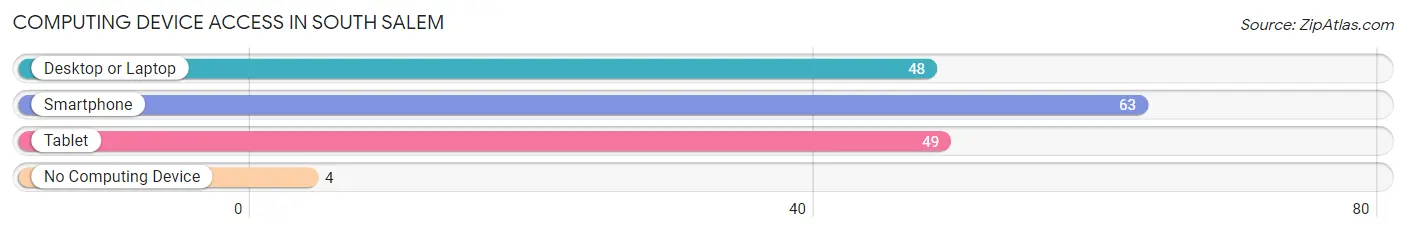
| Device Type | # Households | % Households |
| Desktop or Laptop | 48 | 63.2% |
| Smartphone | 63 | 82.9% |
| Tablet | 49 | 64.5% |
| No Computing Device | 4 | 5.3% |
| Total | 76 | 100.0% |
Internet Access in South Salem
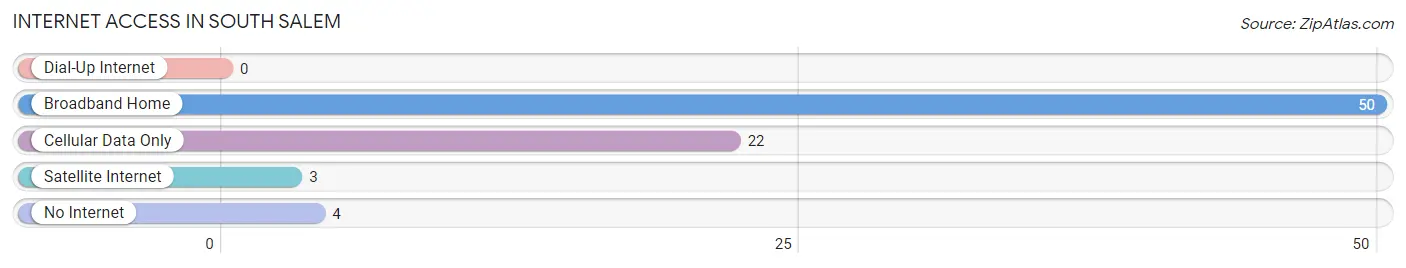
| Internet Type | # Households | % Households |
| Dial-Up Internet | 0 | 0.0% |
| Broadband Home | 50 | 65.8% |
| Cellular Data Only | 22 | 28.9% |
| Satellite Internet | 3 | 4.0% |
| No Internet | 4 | 5.3% |
| Total | 76 | 100.0% |
South Salem Summary
Salem, Ohio is a small village located in the southeastern corner of Noble County, Ohio. It is situated on the banks of the Muskingum River, approximately 25 miles east of Zanesville. The village was founded in 1817 by a group of settlers from Salem, Massachusetts, and was originally known as Salem Crossroads. The village was later renamed South Salem in 1837 to distinguish it from the nearby town of Salem.
History
The first settlers of South Salem arrived in 1817, led by a man named John B. Smith. Smith and his family had previously lived in Salem, Massachusetts, and were looking for a new home in the Ohio wilderness. They chose the area around the Muskingum River, which was known for its fertile soil and abundant wildlife. The settlers quickly established a small village, which they named Salem Crossroads.
The village grew slowly over the next few decades, and by 1837 it had become a thriving community. At this time, the village was renamed South Salem to distinguish it from the nearby town of Salem. The village was incorporated in 1845, and the first mayor was elected in 1846.
In the late 19th century, South Salem experienced a period of rapid growth. The village was connected to the outside world by the Ohio and Erie Canal, which opened in 1845. This allowed for the transportation of goods and people to and from the village. The village also became a popular stop on the Underground Railroad, as many escaped slaves used the canal to travel to freedom.
The village continued to grow throughout the 20th century, and by the year 2000, the population had reached 1,092.
Geography
South Salem is located in the southeastern corner of Noble County, Ohio. It is situated on the banks of the Muskingum River, approximately 25 miles east of Zanesville. The village is surrounded by rolling hills and farmland, and is home to several small lakes and ponds.
The village is located in the Appalachian Plateau region of Ohio, and is part of the Appalachian Mountains. The climate in South Salem is humid continental, with hot summers and cold winters. The average annual temperature is around 50 degrees Fahrenheit, and the average annual precipitation is around 40 inches.
Economy
The economy of South Salem is largely based on agriculture and tourism. The village is home to several small farms, which produce a variety of crops, including corn, soybeans, and hay. The village also has several small businesses, including a grocery store, a hardware store, and a restaurant.
Tourism is an important part of the local economy, as the village is a popular destination for outdoor recreation. The village is home to several parks and trails, which offer activities such as fishing, hiking, and camping. The village also hosts several annual festivals and events, including the South Salem Summer Festival and the South Salem Fall Festival.
Demographics
As of the 2010 census, the population of South Salem was 1,092. The racial makeup of the village was 97.3% White, 0.7% African American, 0.2% Native American, 0.2% Asian, and 1.6% from other races. The median household income was $41,250, and the median family income was $50,000. The per capita income was $20,845.
Conclusion
South Salem is a small village located in the southeastern corner of Noble County, Ohio. It was founded in 1817 by a group of settlers from Salem, Massachusetts, and was originally known as Salem Crossroads. The village was later renamed South Salem in 1837 to distinguish it from the nearby town of Salem. The village has a long history of agriculture and tourism, and is home to several small businesses and farms. The population of South Salem was 1,092 as of the 2010 census, and the median household income was $41,250.
Common Questions
What is Per Capita Income in South Salem?
Per Capita income in South Salem is $24,961.
What is the Median Family Income in South Salem?
Median Family Income in South Salem is $81,000.
What is the Median Household income in South Salem?
Median Household Income in South Salem is $75,278.
What is Income or Wage Gap in South Salem?
Income or Wage Gap in South Salem is 57.6%.
Women in South Salem earn 42.4 cents for every dollar earned by a man.
What is Inequality or Gini Index in South Salem?
Inequality or Gini Index in South Salem is 0.40.
What is the Total Population of South Salem?
Total Population of South Salem is 192.
What is the Total Male Population of South Salem?
Total Male Population of South Salem is 91.
What is the Total Female Population of South Salem?
Total Female Population of South Salem is 101.
What is the Ratio of Males per 100 Females in South Salem?
There are 90.10 Males per 100 Females in South Salem.
What is the Ratio of Females per 100 Males in South Salem?
There are 110.99 Females per 100 Males in South Salem.
What is the Median Population Age in South Salem?
Median Population Age in South Salem is 30.9 Years.
What is the Average Family Size in South Salem
Average Family Size in South Salem is 2.9 People.
What is the Average Household Size in South Salem
Average Household Size in South Salem is 2.5 People.
How Large is the Labor Force in South Salem?
There are 104 People in the Labor Forcein in South Salem.
What is the Percentage of People in the Labor Force in South Salem?
73.2% of People are in the Labor Force in South Salem.
What is the Unemployment Rate in South Salem?
Unemployment Rate in South Salem is 11.5%.