Shelby, OH Map & Demographics
Shelby Map
Shelby Overview
$26,447
PER CAPITA INCOME
$75,425
AVG FAMILY INCOME
$55,355
AVG HOUSEHOLD INCOME
51.1%
WAGE / INCOME GAP [ % ]
48.9¢/ $1
WAGE / INCOME GAP [ $ ]
$9,358
FAMILY INCOME DEFICIT
0.40
INEQUALITY / GINI INDEX
8,360
TOTAL POPULATION
3,713
MALE POPULATION
4,647
FEMALE POPULATION
79.90
MALES / 100 FEMALES
125.15
FEMALES / 100 MALES
40.8
MEDIAN AGE
3.0
AVG FAMILY SIZE
2.4
AVG HOUSEHOLD SIZE
3,825
LABOR FORCE [ PEOPLE ]
59.4%
PERCENT IN LABOR FORCE
3.2%
UNEMPLOYMENT RATE
Shelby Zip Codes
Income in Shelby
Income Overview in Shelby
Per Capita Income in Shelby is $26,447, while median incomes of families and households are $75,425 and $55,355 respectively.
| Characteristic | Number | Measure |
| Per Capita Income | 8,360 | $26,447 |
| Median Family Income | 2,098 | $75,425 |
| Mean Family Income | 2,098 | $75,154 |
| Median Household Income | 3,483 | $55,355 |
| Mean Household Income | 3,483 | $61,524 |
| Income Deficit | 2,098 | $9,358 |
| Wage / Income Gap (%) | 8,360 | 51.10% |
| Wage / Income Gap ($) | 8,360 | 48.90¢ per $1 |
| Gini / Inequality Index | 8,360 | 0.40 |
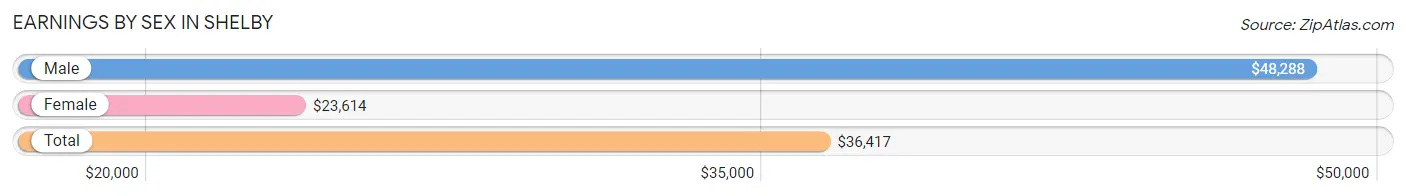
Earnings by Sex in Shelby
Average Earnings in Shelby are $36,417, $48,288 for men and $23,614 for women, a difference of 51.1%.
| Sex | Number | Average Earnings |
| Male | 1,978 (49.4%) | $48,288 |
| Female | 2,023 (50.6%) | $23,614 |
| Total | 4,001 (100.0%) | $36,417 |
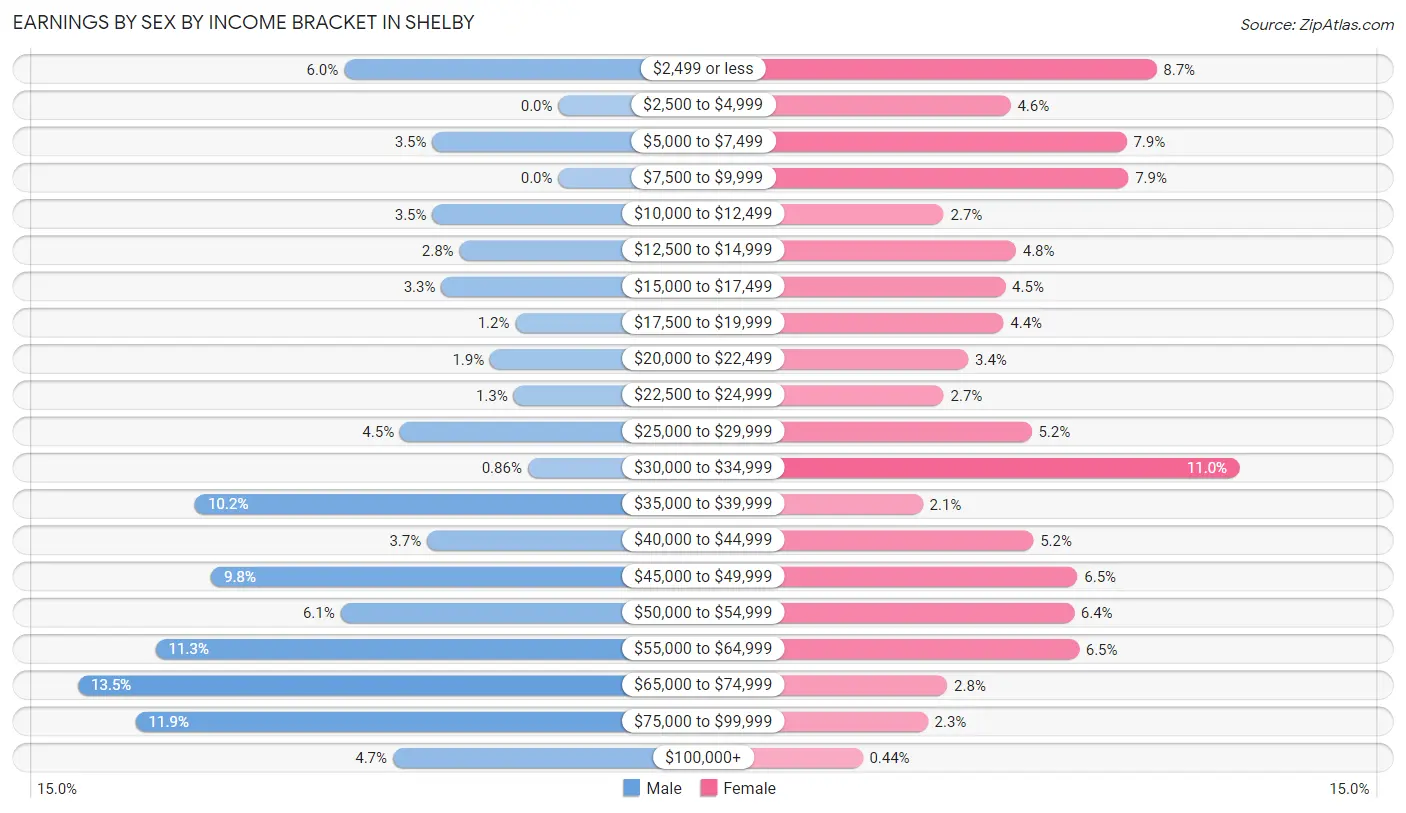
Earnings by Sex by Income Bracket in Shelby
The most common earnings brackets in Shelby are $65,000 to $74,999 for men (267 | 13.5%) and $30,000 to $34,999 for women (223 | 11.0%).
| Income | Male | Female |
| $2,499 or less | 119 (6.0%) | 176 (8.7%) |
| $2,500 to $4,999 | 0 (0.0%) | 93 (4.6%) |
| $5,000 to $7,499 | 70 (3.5%) | 159 (7.9%) |
| $7,500 to $9,999 | 0 (0.0%) | 160 (7.9%) |
| $10,000 to $12,499 | 70 (3.5%) | 55 (2.7%) |
| $12,500 to $14,999 | 55 (2.8%) | 96 (4.8%) |
| $15,000 to $17,499 | 65 (3.3%) | 90 (4.4%) |
| $17,500 to $19,999 | 24 (1.2%) | 89 (4.4%) |
| $20,000 to $22,499 | 38 (1.9%) | 69 (3.4%) |
| $22,500 to $24,999 | 25 (1.3%) | 55 (2.7%) |
| $25,000 to $29,999 | 88 (4.4%) | 105 (5.2%) |
| $30,000 to $34,999 | 17 (0.9%) | 223 (11.0%) |
| $35,000 to $39,999 | 202 (10.2%) | 43 (2.1%) |
| $40,000 to $44,999 | 73 (3.7%) | 106 (5.2%) |
| $45,000 to $49,999 | 193 (9.8%) | 131 (6.5%) |
| $50,000 to $54,999 | 121 (6.1%) | 129 (6.4%) |
| $55,000 to $64,999 | 224 (11.3%) | 132 (6.5%) |
| $65,000 to $74,999 | 267 (13.5%) | 57 (2.8%) |
| $75,000 to $99,999 | 235 (11.9%) | 46 (2.3%) |
| $100,000+ | 92 (4.6%) | 9 (0.4%) |
| Total | 1,978 (100.0%) | 2,023 (100.0%) |
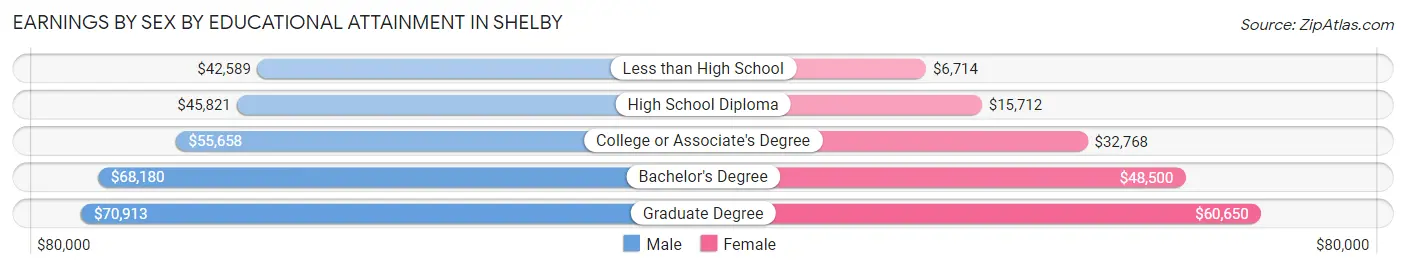
Earnings by Sex by Educational Attainment in Shelby
Average earnings in Shelby are $53,371 for men and $25,901 for women, a difference of 51.5%. Men with an educational attainment of graduate degree enjoy the highest average annual earnings of $70,913, while those with less than high school education earn the least with $42,589. Women with an educational attainment of graduate degree earn the most with the average annual earnings of $60,650, while those with less than high school education have the smallest earnings of $6,714.
| Educational Attainment | Male Income | Female Income |
| Less than High School | $42,589 | $6,714 |
| High School Diploma | $45,821 | $15,712 |
| College or Associate's Degree | $55,658 | $32,768 |
| Bachelor's Degree | $68,180 | $48,500 |
| Graduate Degree | $70,913 | $60,650 |
| Total | $53,371 | $25,901 |
Family Income in Shelby
Family Income Brackets in Shelby
According to the Shelby family income data, there are 556 families falling into the $100,000 to $149,999 income range, which is the most common income bracket and makes up 26.5% of all families.
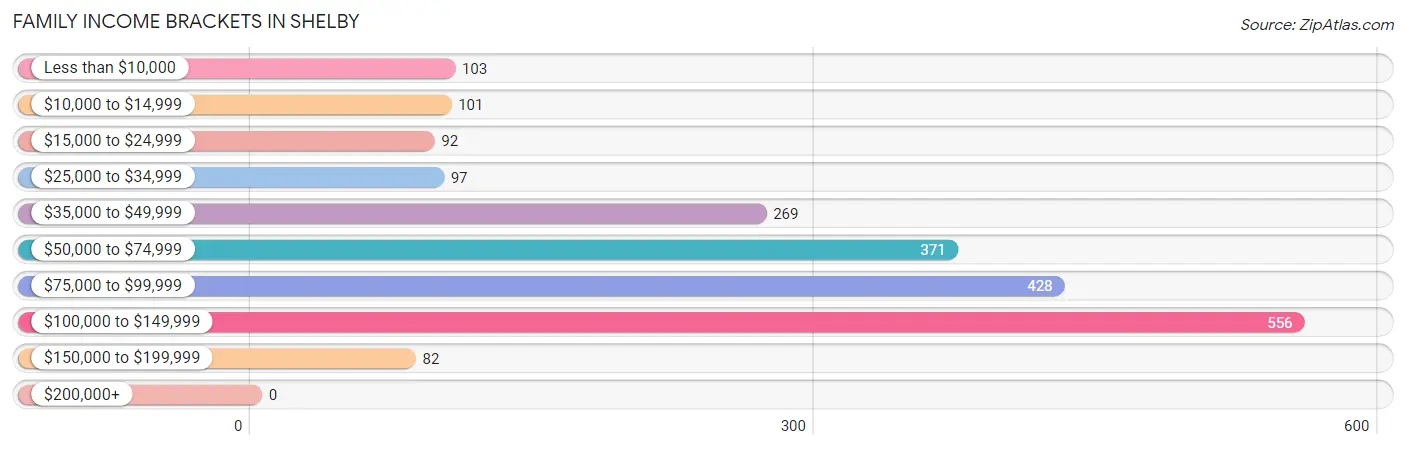
| Income Bracket | # Families | % Families |
| Less than $10,000 | 103 | 4.9% |
| $10,000 to $14,999 | 101 | 4.8% |
| $15,000 to $24,999 | 92 | 4.4% |
| $25,000 to $34,999 | 97 | 4.6% |
| $35,000 to $49,999 | 269 | 12.8% |
| $50,000 to $74,999 | 371 | 17.7% |
| $75,000 to $99,999 | 428 | 20.4% |
| $100,000 to $149,999 | 556 | 26.5% |
| $150,000 to $199,999 | 82 | 3.9% |
| $200,000+ | 0 | 0.0% |
Family Income by Famaliy Size in Shelby
4-person families (233 | 11.1%) account for the highest median family income in Shelby with $102,361 per family, while 2-person families (1,159 | 55.2%) have the highest median income of $35,994 per family member.
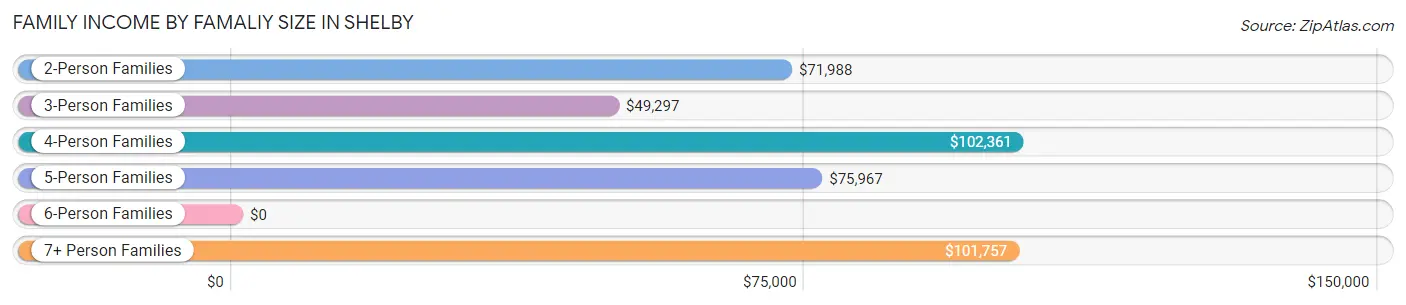
| Income Bracket | # Families | Median Income |
| 2-Person Families | 1,159 (55.2%) | $71,988 |
| 3-Person Families | 473 (22.6%) | $49,297 |
| 4-Person Families | 233 (11.1%) | $102,361 |
| 5-Person Families | 143 (6.8%) | $75,967 |
| 6-Person Families | 38 (1.8%) | $0 |
| 7+ Person Families | 52 (2.5%) | $101,757 |
| Total | 2,098 (100.0%) | $75,425 |
Family Income by Number of Earners in Shelby
The median family income in Shelby is $75,425, with families comprising 3+ earners (145) having the highest median family income of $100,433, while families with no earners (445) have the lowest median family income of $38,149, accounting for 6.9% and 21.2% of families, respectively.
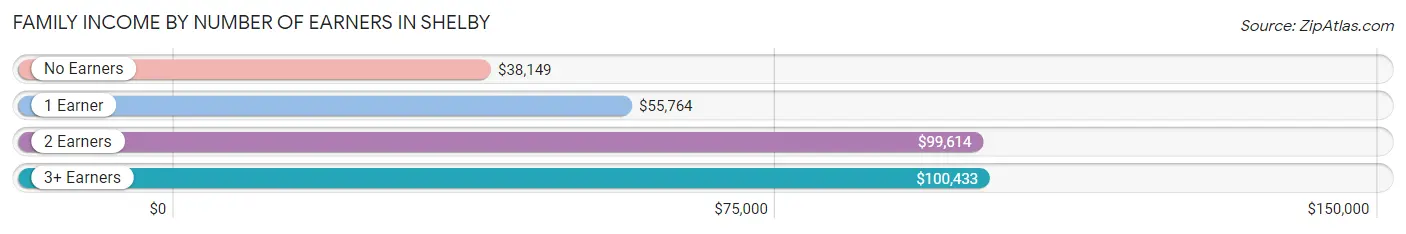
| Number of Earners | # Families | Median Income |
| No Earners | 445 (21.2%) | $38,149 |
| 1 Earner | 541 (25.8%) | $55,764 |
| 2 Earners | 967 (46.1%) | $99,614 |
| 3+ Earners | 145 (6.9%) | $100,433 |
| Total | 2,098 (100.0%) | $75,425 |
Household Income in Shelby
Household Income Brackets in Shelby
With 623 households falling in the category, the $100,000 to $149,999 income range is the most frequent in Shelby, accounting for 17.9% of all households. In contrast, only 17 households (0.5%) fall into the $200,000+ income bracket, making it the least populous group.
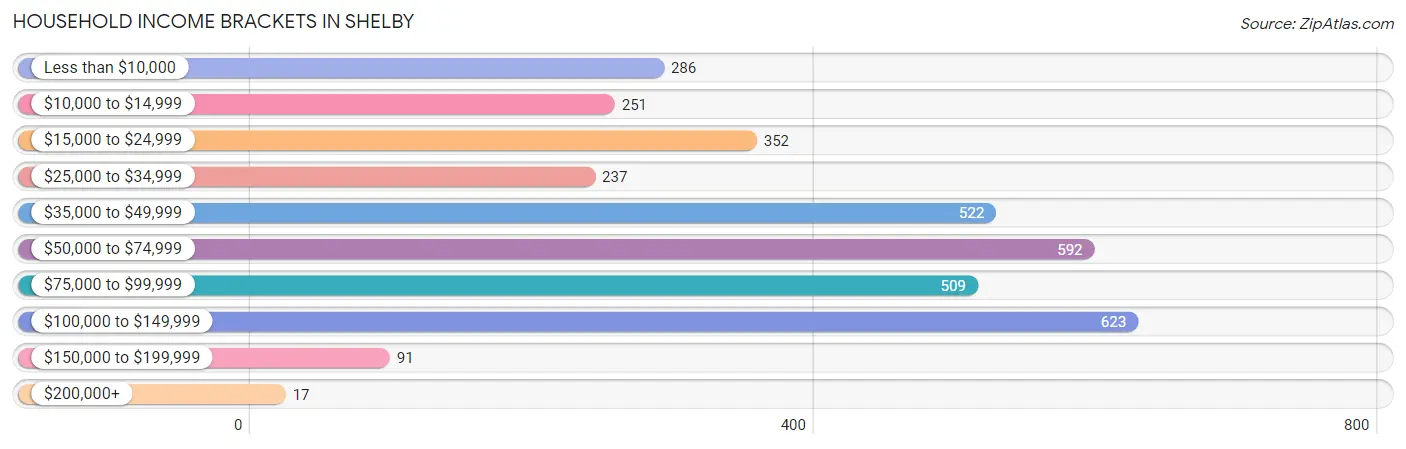
| Income Bracket | # Households | % Households |
| Less than $10,000 | 286 | 8.2% |
| $10,000 to $14,999 | 251 | 7.2% |
| $15,000 to $24,999 | 352 | 10.1% |
| $25,000 to $34,999 | 237 | 6.8% |
| $35,000 to $49,999 | 522 | 15.0% |
| $50,000 to $74,999 | 592 | 17.0% |
| $75,000 to $99,999 | 509 | 14.6% |
| $100,000 to $149,999 | 623 | 17.9% |
| $150,000 to $199,999 | 91 | 2.6% |
| $200,000+ | 17 | 0.5% |
Household Income by Householder Age in Shelby
The median household income in Shelby is $55,355, with the highest median household income of $83,211 found in the 25 to 44 years age bracket for the primary householder. A total of 975 households (28.0%) fall into this category. Meanwhile, the 15 to 24 years age bracket for the primary householder has the lowest median household income of $33,854, with 143 households (4.1%) in this group.
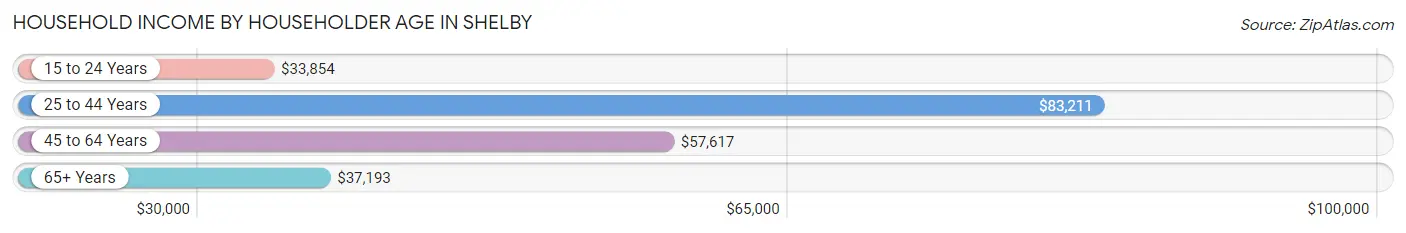
| Income Bracket | # Households | Median Income |
| 15 to 24 Years | 143 (4.1%) | $33,854 |
| 25 to 44 Years | 975 (28.0%) | $83,211 |
| 45 to 64 Years | 1,385 (39.8%) | $57,617 |
| 65+ Years | 980 (28.1%) | $37,193 |
| Total | 3,483 (100.0%) | $55,355 |
Poverty in Shelby
Income Below Poverty by Sex and Age in Shelby
With 13.8% poverty level for males and 16.5% for females among the residents of Shelby, 6 to 11 year old males and 15 year old females are the most vulnerable to poverty, with 107 males (40.7%) and 28 females (65.1%) in their respective age groups living below the poverty level.
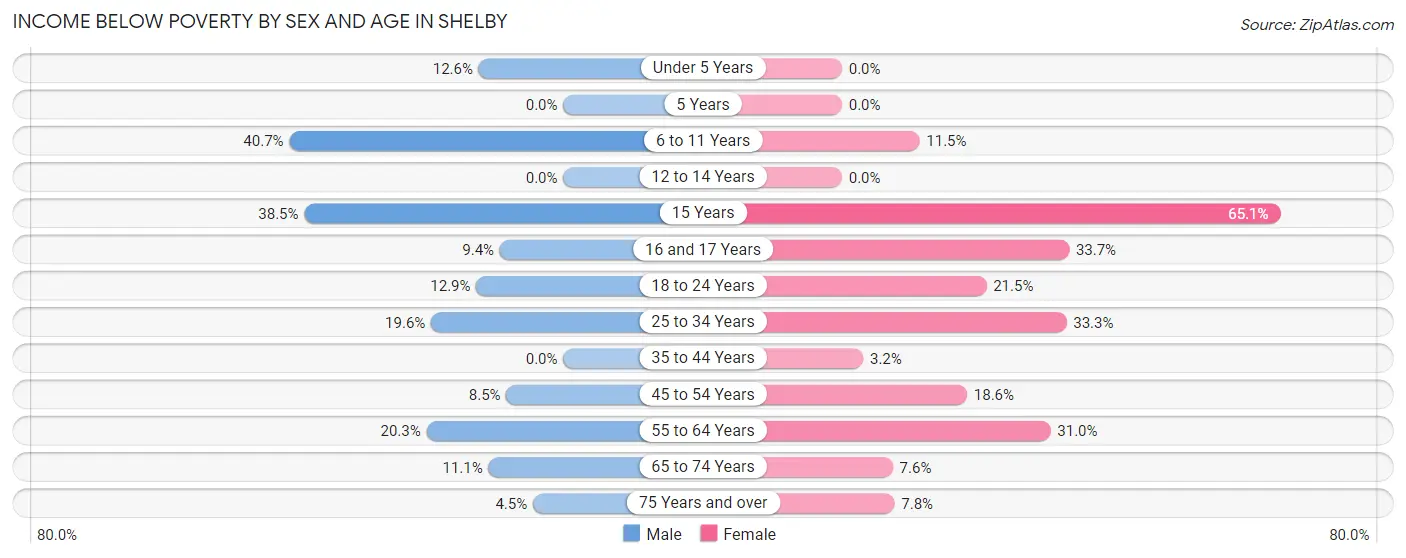
| Age Bracket | Male | Female |
| Under 5 Years | 28 (12.6%) | 0 (0.0%) |
| 5 Years | 0 (0.0%) | 0 (0.0%) |
| 6 to 11 Years | 107 (40.7%) | 66 (11.5%) |
| 12 to 14 Years | 0 (0.0%) | 0 (0.0%) |
| 15 Years | 10 (38.5%) | 28 (65.1%) |
| 16 and 17 Years | 18 (9.4%) | 28 (33.7%) |
| 18 to 24 Years | 23 (12.9%) | 62 (21.4%) |
| 25 to 34 Years | 105 (19.6%) | 150 (33.3%) |
| 35 to 44 Years | 0 (0.0%) | 15 (3.2%) |
| 45 to 54 Years | 36 (8.5%) | 65 (18.6%) |
| 55 to 64 Years | 130 (20.3%) | 231 (31.0%) |
| 65 to 74 Years | 35 (11.1%) | 32 (7.5%) |
| 75 Years and over | 9 (4.5%) | 37 (7.8%) |
| Total | 501 (13.8%) | 714 (16.5%) |
Income Above Poverty by Sex and Age in Shelby
According to the poverty statistics in Shelby, males aged 5 years and females aged under 5 years are the age groups that are most secure financially, with 100.0% of males and 100.0% of females in these age groups living above the poverty line.
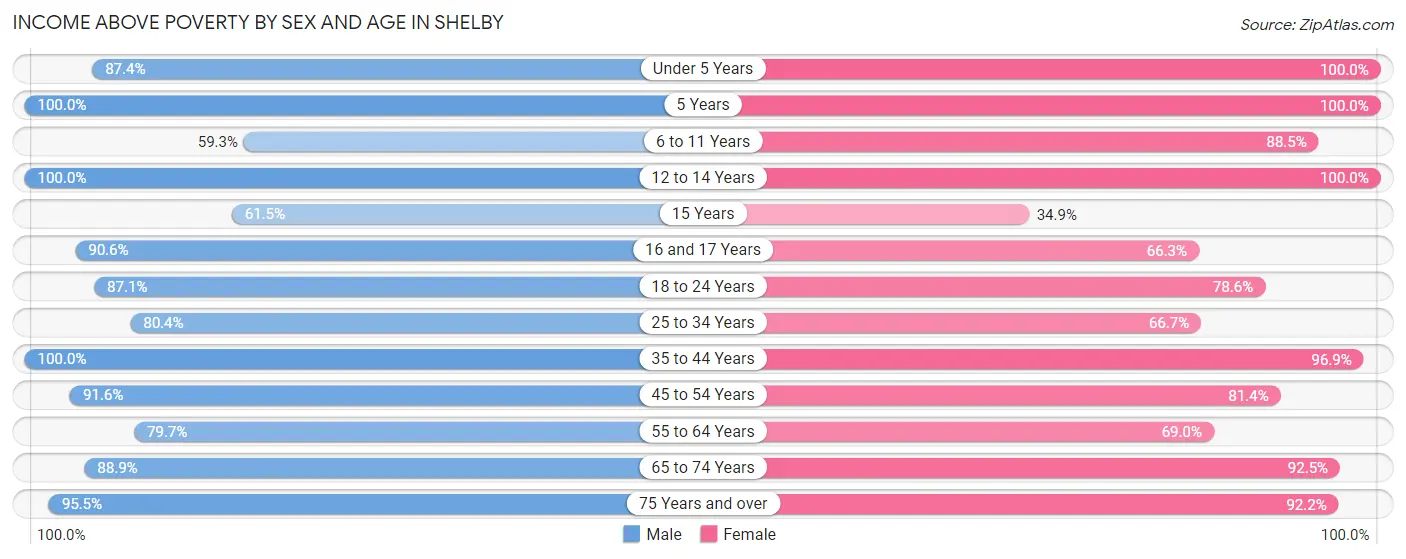
| Age Bracket | Male | Female |
| Under 5 Years | 195 (87.4%) | 121 (100.0%) |
| 5 Years | 48 (100.0%) | 65 (100.0%) |
| 6 to 11 Years | 156 (59.3%) | 507 (88.5%) |
| 12 to 14 Years | 114 (100.0%) | 223 (100.0%) |
| 15 Years | 16 (61.5%) | 15 (34.9%) |
| 16 and 17 Years | 173 (90.6%) | 55 (66.3%) |
| 18 to 24 Years | 155 (87.1%) | 227 (78.5%) |
| 25 to 34 Years | 430 (80.4%) | 300 (66.7%) |
| 35 to 44 Years | 484 (100.0%) | 461 (96.9%) |
| 45 to 54 Years | 390 (91.5%) | 285 (81.4%) |
| 55 to 64 Years | 510 (79.7%) | 515 (69.0%) |
| 65 to 74 Years | 280 (88.9%) | 392 (92.4%) |
| 75 Years and over | 191 (95.5%) | 437 (92.2%) |
| Total | 3,142 (86.3%) | 3,603 (83.5%) |
Income Below Poverty Among Married-Couple Families in Shelby
The poverty statistics for married-couple families in Shelby show that 7.7% or 128 of the total 1,667 families live below the poverty line. Families with no children have the highest poverty rate of 11.8%, comprising of 128 families. On the other hand, families with 1 or 2 children have the lowest poverty rate of 0.0%, which includes 0 families.
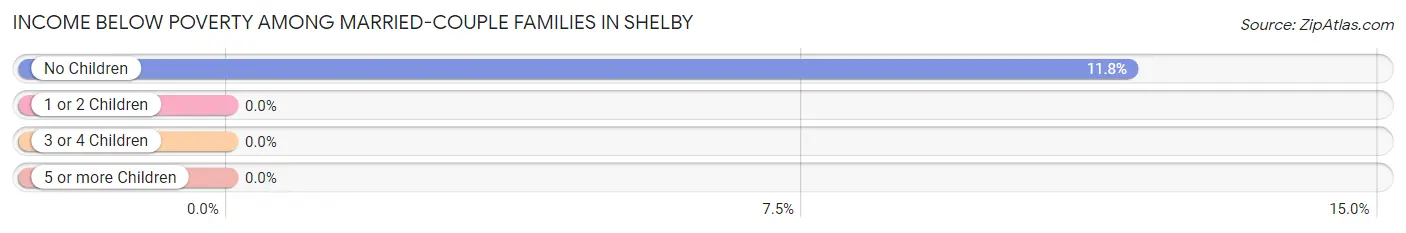
| Children | Above Poverty | Below Poverty |
| No Children | 960 (88.2%) | 128 (11.8%) |
| 1 or 2 Children | 383 (100.0%) | 0 (0.0%) |
| 3 or 4 Children | 185 (100.0%) | 0 (0.0%) |
| 5 or more Children | 11 (100.0%) | 0 (0.0%) |
| Total | 1,539 (92.3%) | 128 (7.7%) |
Income Below Poverty Among Single-Parent Households in Shelby
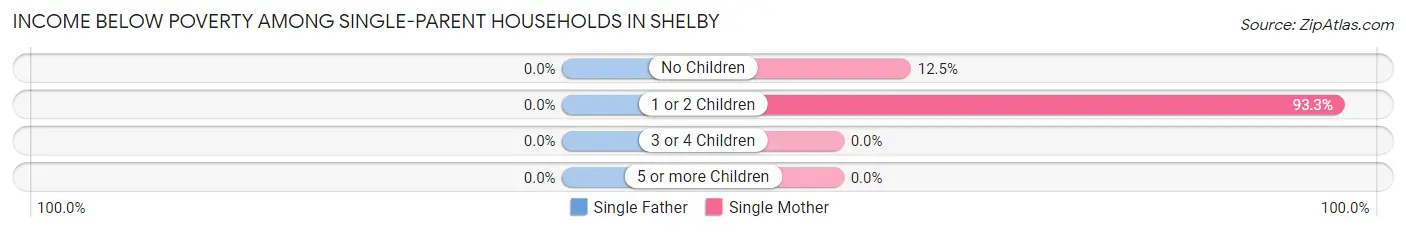
| Children | Single Father | Single Mother |
| No Children | 0 (0.0%) | 9 (12.5%) |
| 1 or 2 Children | 0 (0.0%) | 126 (93.3%) |
| 3 or 4 Children | 0 (0.0%) | 0 (0.0%) |
| 5 or more Children | 0 (0.0%) | 0 (0.0%) |
| Total | 0 (0.0%) | 135 (65.2%) |
Income Below Poverty Among Married-Couple vs Single-Parent Households in Shelby
The poverty data for Shelby shows that 128 of the married-couple family households (7.7%) and 135 of the single-parent households (31.3%) are living below the poverty level. Within the married-couple family households, those with no children have the highest poverty rate, with 128 households (11.8%) falling below the poverty line. Among the single-parent households, those with 1 or 2 children have the highest poverty rate, with 126 household (60.9%) living below poverty.
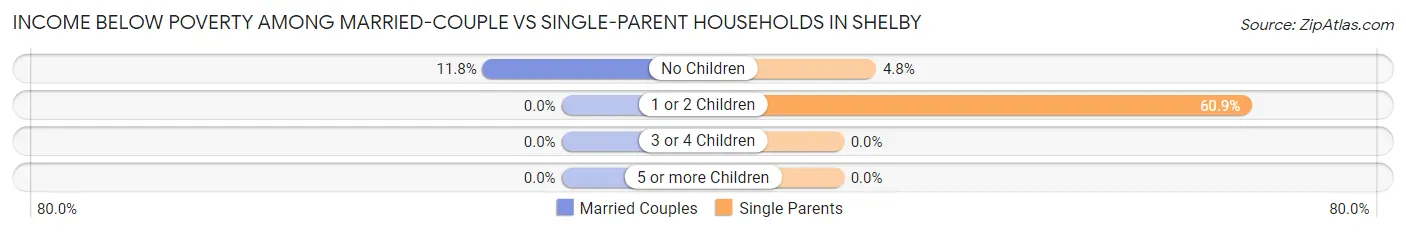
| Children | Married-Couple Families | Single-Parent Households |
| No Children | 128 (11.8%) | 9 (4.8%) |
| 1 or 2 Children | 0 (0.0%) | 126 (60.9%) |
| 3 or 4 Children | 0 (0.0%) | 0 (0.0%) |
| 5 or more Children | 0 (0.0%) | 0 (0.0%) |
| Total | 128 (7.7%) | 135 (31.3%) |
Race in Shelby
The most populous races in Shelby are White / Caucasian (7,972 | 95.4%), Two or more Races (178 | 2.1%), and Asian (173 | 2.1%).
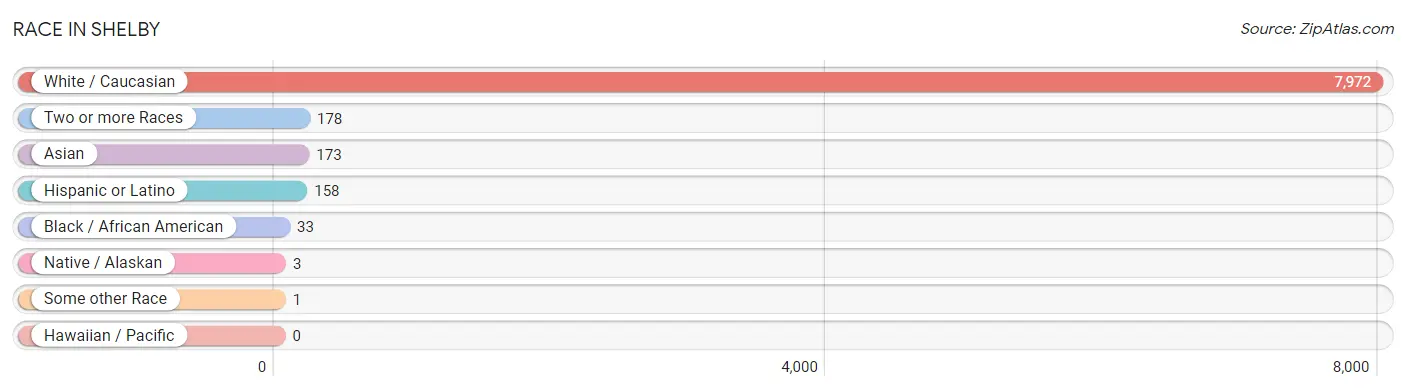
| Race | # Population | % Population |
| Asian | 173 | 2.1% |
| Black / African American | 33 | 0.4% |
| Hawaiian / Pacific | 0 | 0.0% |
| Hispanic or Latino | 158 | 1.9% |
| Native / Alaskan | 3 | 0.0% |
| White / Caucasian | 7,972 | 95.4% |
| Two or more Races | 178 | 2.1% |
| Some other Race | 1 | 0.0% |
| Total | 8,360 | 100.0% |
Ancestry in Shelby
The most populous ancestries reported in Shelby are German (2,570 | 30.7%), Irish (1,054 | 12.6%), American (950 | 11.4%), English (826 | 9.9%), and Polish (253 | 3.0%), together accounting for 67.6% of all Shelby residents.
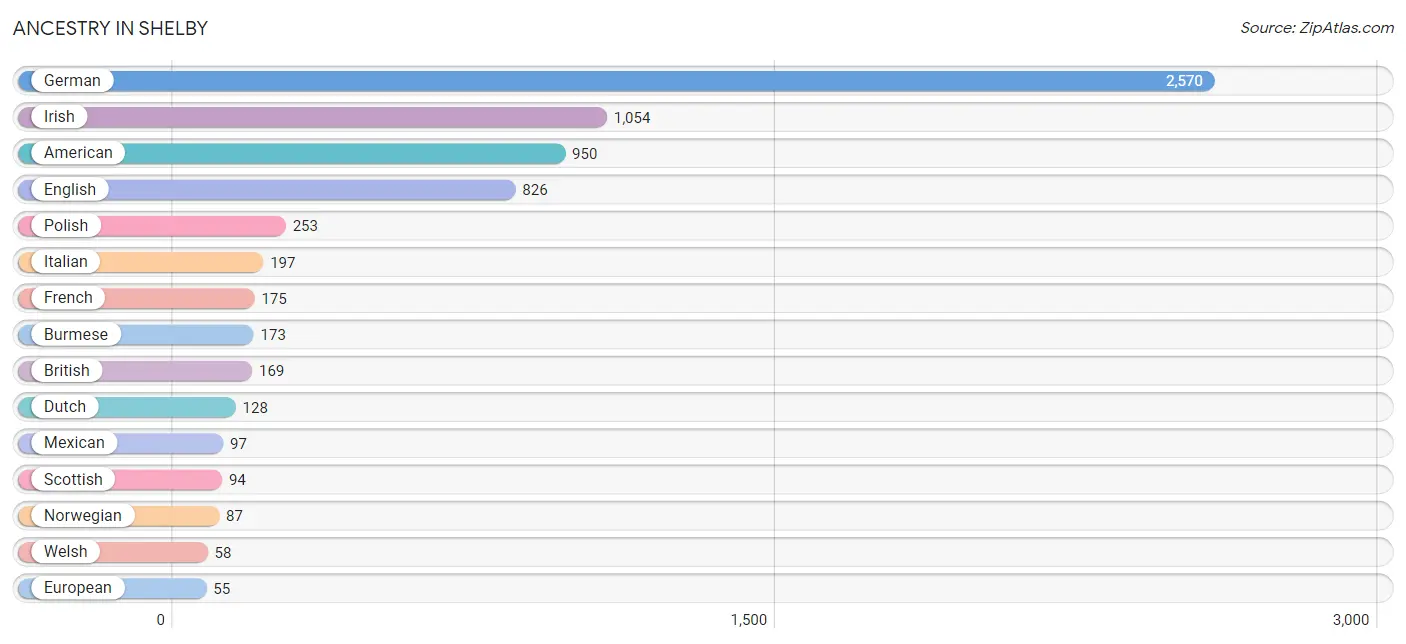
| Ancestry | # Population | % Population |
| African | 15 | 0.2% |
| American | 950 | 11.4% |
| Arab | 10 | 0.1% |
| British | 169 | 2.0% |
| Burmese | 173 | 2.1% |
| Central American | 34 | 0.4% |
| Cherokee | 24 | 0.3% |
| Costa Rican | 34 | 0.4% |
| Czech | 7 | 0.1% |
| Dutch | 128 | 1.5% |
| Ecuadorian | 27 | 0.3% |
| English | 826 | 9.9% |
| European | 55 | 0.7% |
| French | 175 | 2.1% |
| French Canadian | 15 | 0.2% |
| German | 2,570 | 30.7% |
| Hungarian | 9 | 0.1% |
| Irish | 1,054 | 12.6% |
| Italian | 197 | 2.4% |
| Mexican | 97 | 1.2% |
| Norwegian | 87 | 1.0% |
| Pennsylvania German | 10 | 0.1% |
| Polish | 253 | 3.0% |
| Scandinavian | 15 | 0.2% |
| Scotch-Irish | 51 | 0.6% |
| Scottish | 94 | 1.1% |
| Slovak | 22 | 0.3% |
| South American | 27 | 0.3% |
| Subsaharan African | 15 | 0.2% |
| Swedish | 6 | 0.1% |
| Welsh | 58 | 0.7% | View All 31 Rows |
Immigrants in Shelby
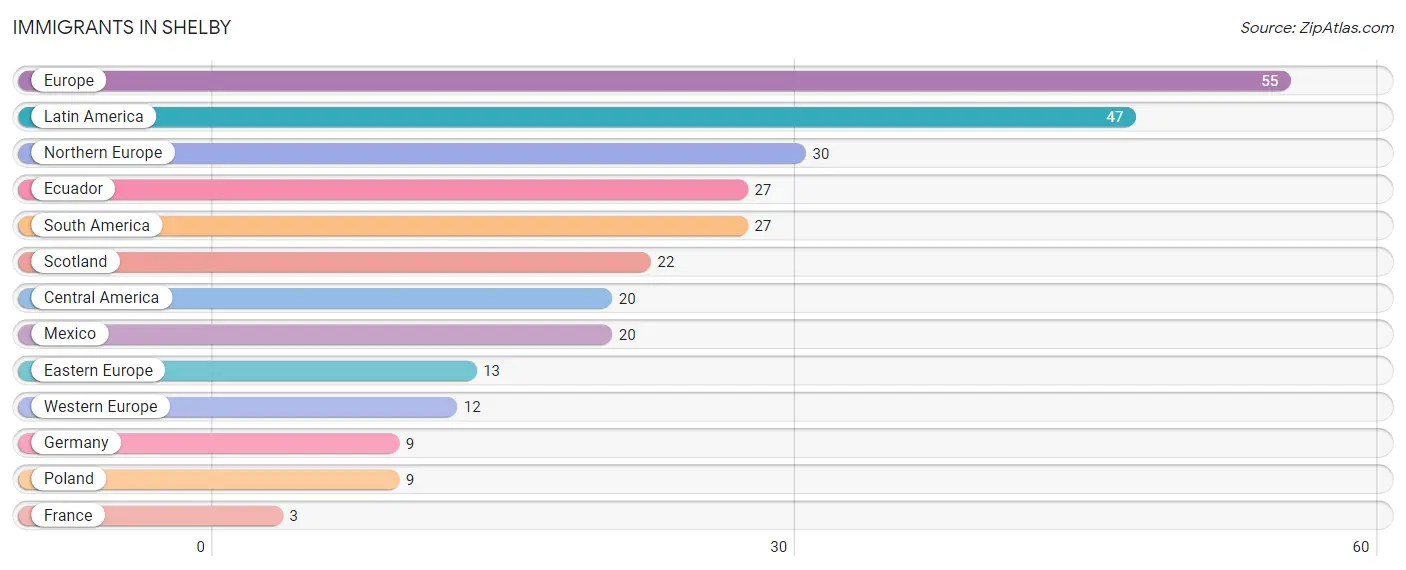
The most numerous immigrant groups reported in Shelby came from Europe (55 | 0.7%), Latin America (47 | 0.6%), Northern Europe (30 | 0.4%), Ecuador (27 | 0.3%), and South America (27 | 0.3%), together accounting for 2.2% of all Shelby residents.
| Immigration Origin | # Population | % Population |
| Central America | 20 | 0.2% |
| Eastern Europe | 13 | 0.2% |
| Ecuador | 27 | 0.3% |
| Europe | 55 | 0.7% |
| France | 3 | 0.0% |
| Germany | 9 | 0.1% |
| Latin America | 47 | 0.6% |
| Mexico | 20 | 0.2% |
| Northern Europe | 30 | 0.4% |
| Poland | 9 | 0.1% |
| Scotland | 22 | 0.3% |
| South America | 27 | 0.3% |
| Western Europe | 12 | 0.1% | View All 13 Rows |
Sex and Age in Shelby
Sex and Age in Shelby
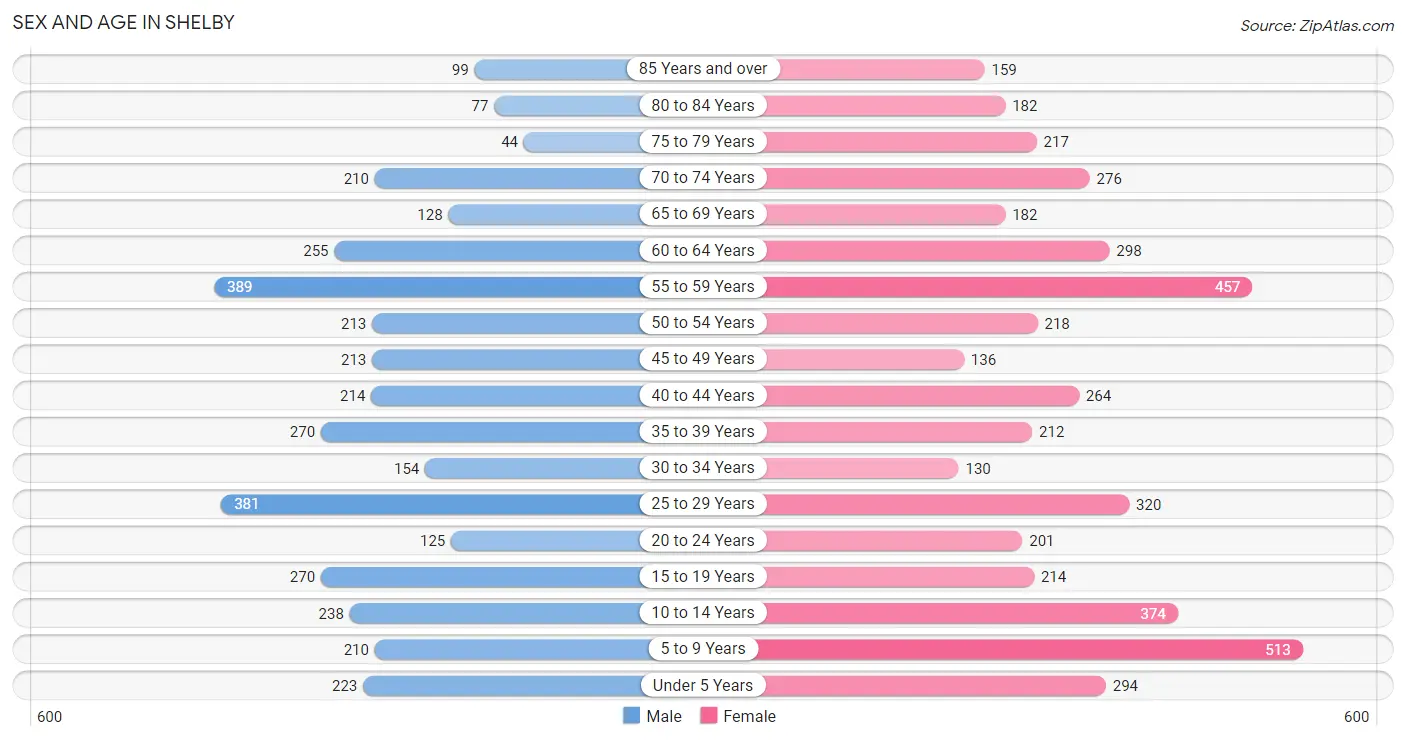
The most populous age groups in Shelby are 55 to 59 Years (389 | 10.5%) for men and 5 to 9 Years (513 | 11.0%) for women.
| Age Bracket | Male | Female |
| Under 5 Years | 223 (6.0%) | 294 (6.3%) |
| 5 to 9 Years | 210 (5.7%) | 513 (11.0%) |
| 10 to 14 Years | 238 (6.4%) | 374 (8.1%) |
| 15 to 19 Years | 270 (7.3%) | 214 (4.6%) |
| 20 to 24 Years | 125 (3.4%) | 201 (4.3%) |
| 25 to 29 Years | 381 (10.3%) | 320 (6.9%) |
| 30 to 34 Years | 154 (4.2%) | 130 (2.8%) |
| 35 to 39 Years | 270 (7.3%) | 212 (4.6%) |
| 40 to 44 Years | 214 (5.8%) | 264 (5.7%) |
| 45 to 49 Years | 213 (5.7%) | 136 (2.9%) |
| 50 to 54 Years | 213 (5.7%) | 218 (4.7%) |
| 55 to 59 Years | 389 (10.5%) | 457 (9.8%) |
| 60 to 64 Years | 255 (6.9%) | 298 (6.4%) |
| 65 to 69 Years | 128 (3.5%) | 182 (3.9%) |
| 70 to 74 Years | 210 (5.7%) | 276 (5.9%) |
| 75 to 79 Years | 44 (1.2%) | 217 (4.7%) |
| 80 to 84 Years | 77 (2.1%) | 182 (3.9%) |
| 85 Years and over | 99 (2.7%) | 159 (3.4%) |
| Total | 3,713 (100.0%) | 4,647 (100.0%) |
Families and Households in Shelby
Median Family Size in Shelby
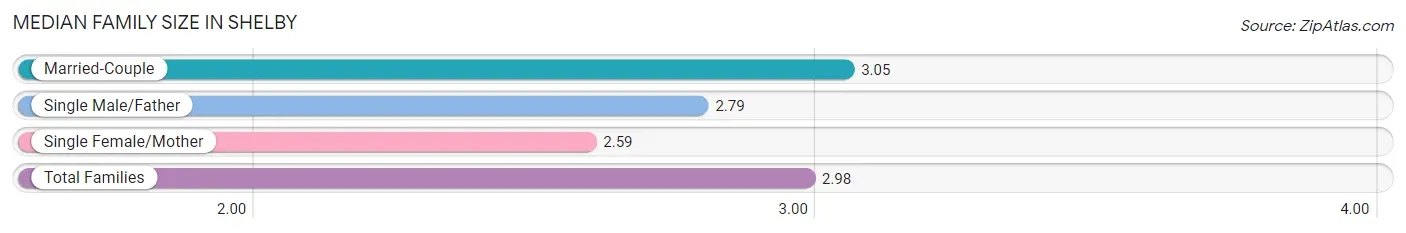
The median family size in Shelby is 2.98 persons per family, with married-couple families (1,667 | 79.5%) accounting for the largest median family size of 3.05 persons per family. On the other hand, single female/mother families (207 | 9.9%) represent the smallest median family size with 2.59 persons per family.
| Family Type | # Families | Family Size |
| Married-Couple | 1,667 (79.5%) | 3.05 |
| Single Male/Father | 224 (10.7%) | 2.79 |
| Single Female/Mother | 207 (9.9%) | 2.59 |
| Total Families | 2,098 (100.0%) | 2.98 |
Median Household Size in Shelby
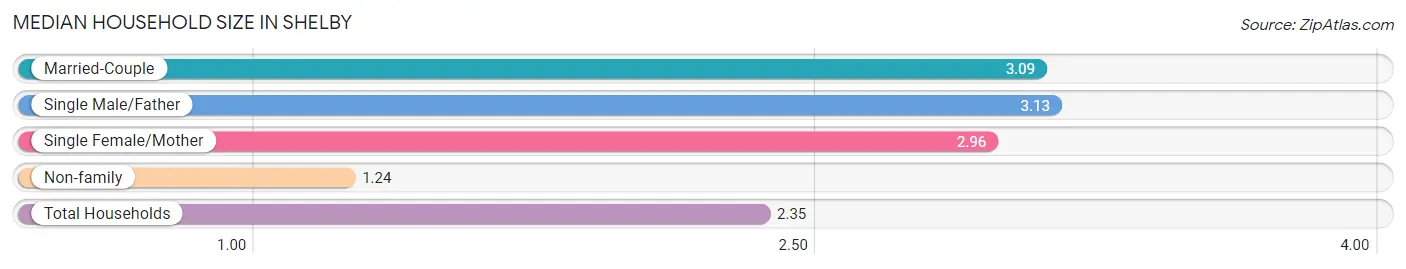
The median household size in Shelby is 2.35 persons per household, with single male/father households (224 | 6.4%) accounting for the largest median household size of 3.13 persons per household. non-family households (1,385 | 39.8%) represent the smallest median household size with 1.24 persons per household.
| Household Type | # Households | Household Size |
| Married-Couple | 1,667 (47.9%) | 3.09 |
| Single Male/Father | 224 (6.4%) | 3.13 |
| Single Female/Mother | 207 (5.9%) | 2.96 |
| Non-family | 1,385 (39.8%) | 1.24 |
| Total Households | 3,483 (100.0%) | 2.35 |
Household Size by Marriage Status in Shelby
Out of a total of 3,483 households in Shelby, 2,098 (60.2%) are family households, while 1,385 (39.8%) are nonfamily households. The most numerous type of family households are 2-person households, comprising 1,115, and the most common type of nonfamily households are 1-person households, comprising 1,241.
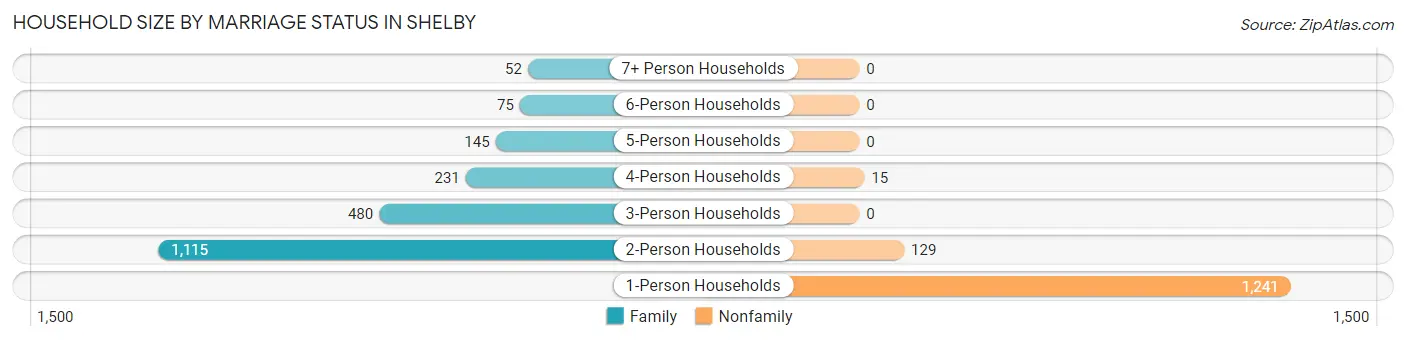
| Household Size | Family Households | Nonfamily Households |
| 1-Person Households | - | 1,241 (35.6%) |
| 2-Person Households | 1,115 (32.0%) | 129 (3.7%) |
| 3-Person Households | 480 (13.8%) | 0 (0.0%) |
| 4-Person Households | 231 (6.6%) | 15 (0.4%) |
| 5-Person Households | 145 (4.2%) | 0 (0.0%) |
| 6-Person Households | 75 (2.1%) | 0 (0.0%) |
| 7+ Person Households | 52 (1.5%) | 0 (0.0%) |
| Total | 2,098 (60.2%) | 1,385 (39.8%) |
Female Fertility in Shelby
Fertility by Age in Shelby
Average fertility rate in Shelby is 47.0 births per 1,000 women. Women in the age bracket of 20 to 34 years have the highest fertility rate with 106.0 births per 1,000 women. Women in the age bracket of 20 to 34 years acount for 100.0% of all women with births.
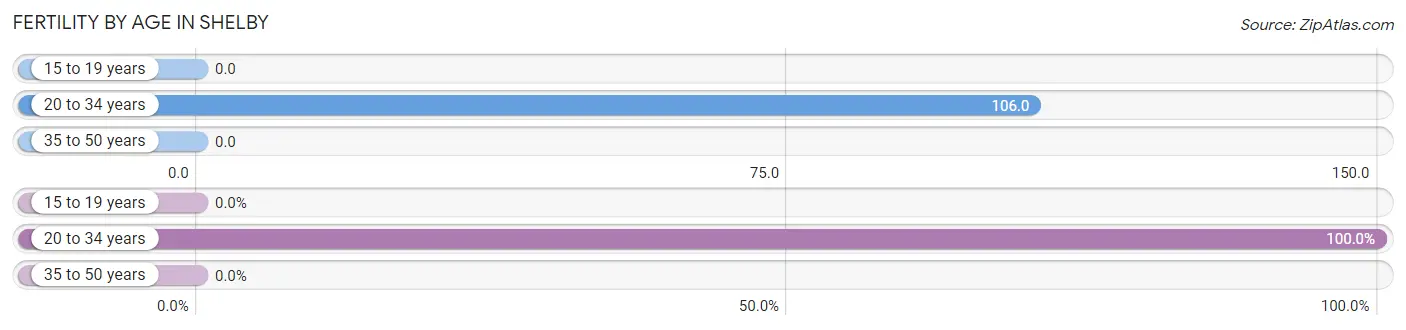
| Age Bracket | Women with Births | Births / 1,000 Women |
| 15 to 19 years | 0 (0.0%) | 0.0 |
| 20 to 34 years | 69 (100.0%) | 106.0 |
| 35 to 50 years | 0 (0.0%) | 0.0 |
| Total | 69 (100.0%) | 47.0 |
Fertility by Age by Marriage Status in Shelby
56.5% of women with births (69) in Shelby are married. The highest percentage of unmarried women with births falls into 20 to 34 years age bracket with 43.5% of them unmarried at the time of birth, while the lowest percentage of unmarried women with births belong to 20 to 34 years age bracket with 43.5% of them unmarried.
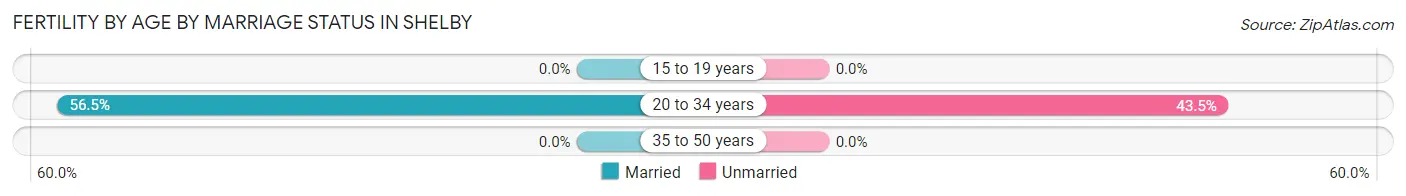
| Age Bracket | Married | Unmarried |
| 15 to 19 years | 0 (0.0%) | 0 (0.0%) |
| 20 to 34 years | 39 (56.5%) | 30 (43.5%) |
| 35 to 50 years | 0 (0.0%) | 0 (0.0%) |
| Total | 39 (56.5%) | 30 (43.5%) |
Fertility by Education in Shelby
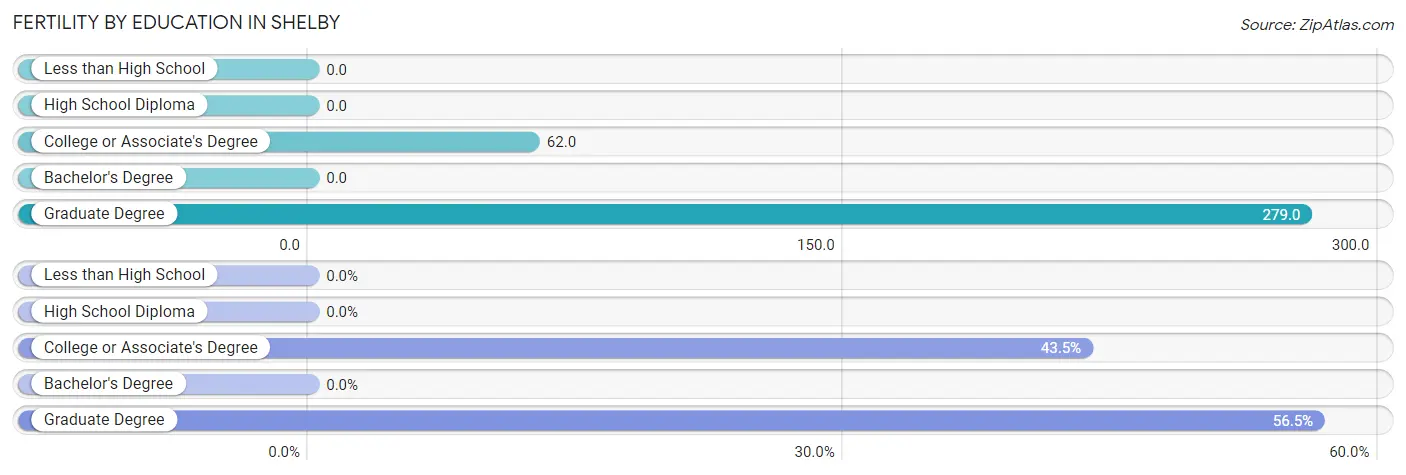
| Educational Attainment | Women with Births | Births / 1,000 Women |
| Less than High School | 0 (0.0%) | 0.0 |
| High School Diploma | 0 (0.0%) | 0.0 |
| College or Associate's Degree | 30 (43.5%) | 62.0 |
| Bachelor's Degree | 0 (0.0%) | 0.0 |
| Graduate Degree | 39 (56.5%) | 279.0 |
| Total | 69 (100.0%) | 47.0 |
Fertility by Education by Marriage Status in Shelby
43.5% of women with births in Shelby are unmarried. Women with the educational attainment of graduate degree are most likely to be married with 100.0% of them married at childbirth, while women with the educational attainment of college or associate's degree are least likely to be married with 100.0% of them unmarried at childbirth.
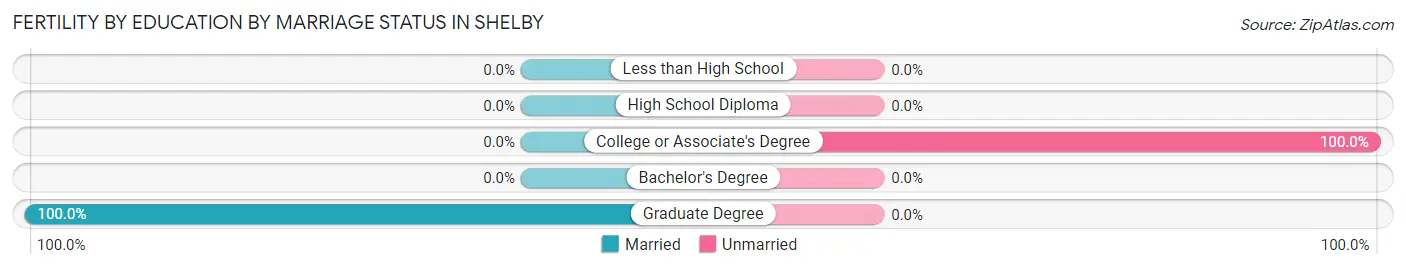
| Educational Attainment | Married | Unmarried |
| Less than High School | 0 (0.0%) | 0 (0.0%) |
| High School Diploma | 0 (0.0%) | 0 (0.0%) |
| College or Associate's Degree | 0 (0.0%) | 30 (100.0%) |
| Bachelor's Degree | 0 (0.0%) | 0 (0.0%) |
| Graduate Degree | 39 (100.0%) | 0 (0.0%) |
| Total | 39 (56.5%) | 30 (43.5%) |
Employment Characteristics in Shelby
Employment by Class of Employer in Shelby
Among the 3,577 employed individuals in Shelby, private company employees (2,594 | 72.5%), not-for-profit organizations (414 | 11.6%), and local government employees (292 | 8.2%) make up the most common classes of employment.
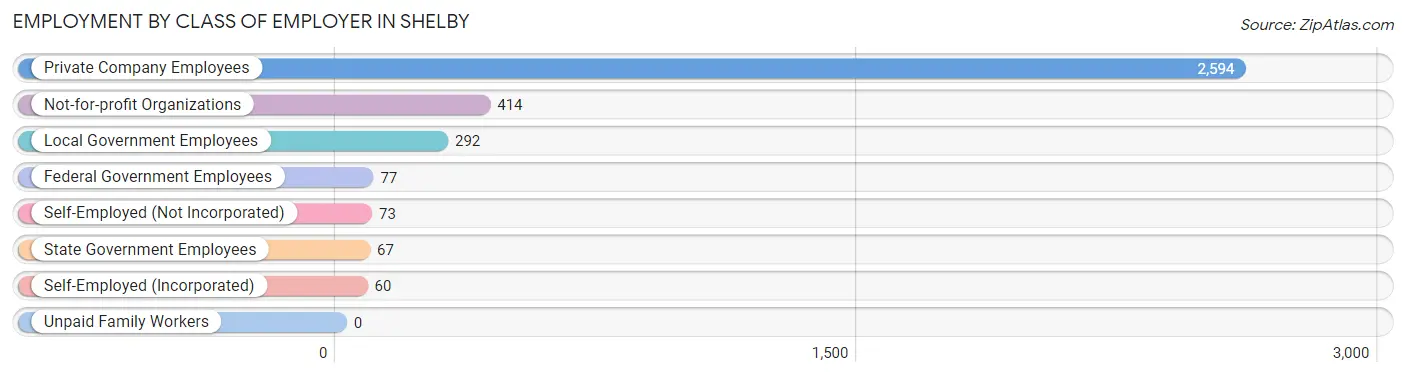
| Employer Class | # Employees | % Employees |
| Private Company Employees | 2,594 | 72.5% |
| Self-Employed (Incorporated) | 60 | 1.7% |
| Self-Employed (Not Incorporated) | 73 | 2.0% |
| Not-for-profit Organizations | 414 | 11.6% |
| Local Government Employees | 292 | 8.2% |
| State Government Employees | 67 | 1.9% |
| Federal Government Employees | 77 | 2.1% |
| Unpaid Family Workers | 0 | 0.0% |
| Total | 3,577 | 100.0% |
Employment Status by Age in Shelby
According to the labor force statistics for Shelby, out of the total population over 16 years of age (6,439), 59.4% or 3,825 individuals are in the labor force, with 3.2% or 122 of them unemployed. The age group with the highest labor force participation rate is 45 to 54 years, with 94.0% or 733 individuals in the labor force. Within the labor force, the 75 years and over age range has the highest percentage of unemployed individuals, with 30.0% or 9 of them being unemployed.
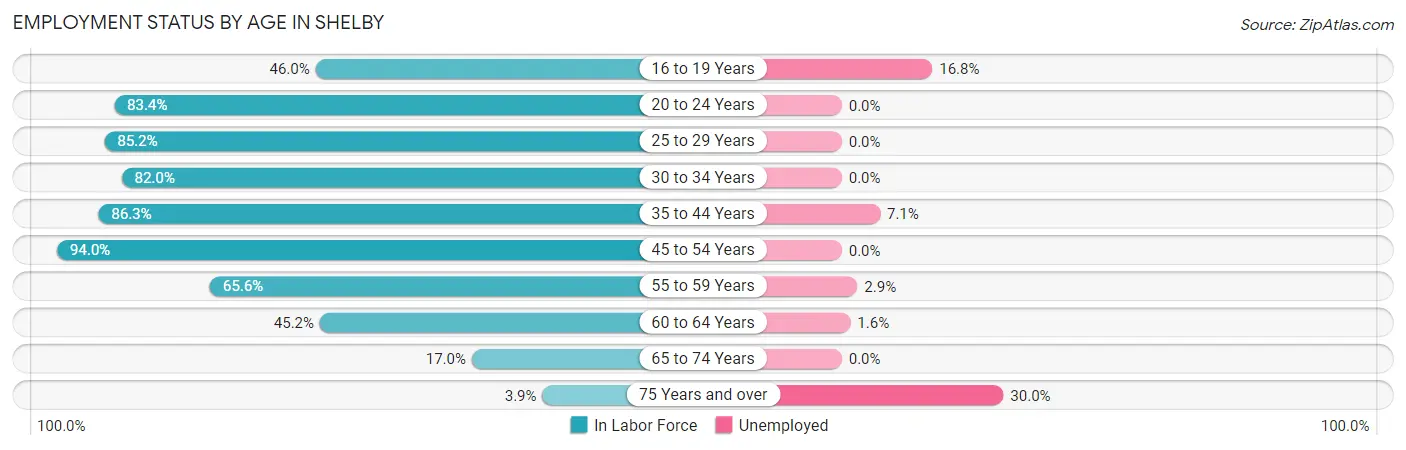
| Age Bracket | In Labor Force | Unemployed |
| 16 to 19 Years | 191 (46.0%) | 32 (16.8%) |
| 20 to 24 Years | 272 (83.4%) | 0 (0.0%) |
| 25 to 29 Years | 597 (85.2%) | 0 (0.0%) |
| 30 to 34 Years | 233 (82.0%) | 0 (0.0%) |
| 35 to 44 Years | 828 (86.3%) | 59 (7.1%) |
| 45 to 54 Years | 733 (94.0%) | 0 (0.0%) |
| 55 to 59 Years | 555 (65.6%) | 16 (2.9%) |
| 60 to 64 Years | 250 (45.2%) | 4 (1.6%) |
| 65 to 74 Years | 135 (17.0%) | 0 (0.0%) |
| 75 Years and over | 30 (3.9%) | 9 (30.0%) |
| Total | 3,825 (59.4%) | 122 (3.2%) |
Employment Status by Educational Attainment in Shelby
According to labor force statistics for Shelby, 77.5% of individuals (3,196) out of the total population between 25 and 64 years of age (4,124) are in the labor force, with 2.5% or 80 of them being unemployed. The group with the highest labor force participation rate are those with the educational attainment of bachelor's degree or higher, with 88.6% or 648 individuals in the labor force. Within the labor force, individuals with high school diploma education have the highest percentage of unemployment, with 4.7% or 60 of them being unemployed.
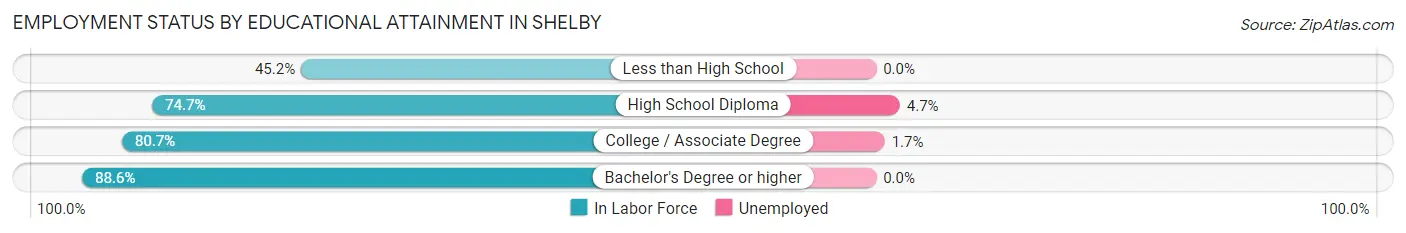
| Educational Attainment | In Labor Force | Unemployed |
| Less than High School | 112 (45.2%) | 0 (0.0%) |
| High School Diploma | 1,277 (74.7%) | 80 (4.7%) |
| College / Associate Degree | 1,159 (80.7%) | 24 (1.7%) |
| Bachelor's Degree or higher | 648 (88.6%) | 0 (0.0%) |
| Total | 3,196 (77.5%) | 103 (2.5%) |
Employment Occupations by Sex in Shelby
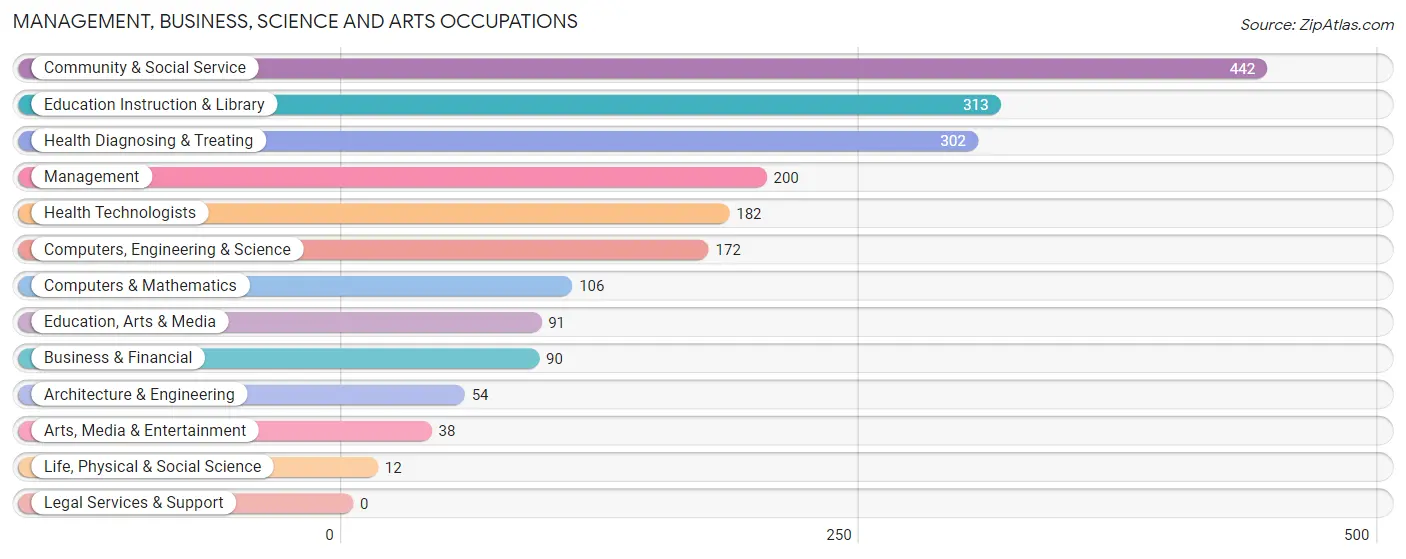
Management, Business, Science and Arts Occupations
The most common Management, Business, Science and Arts occupations in Shelby are Community & Social Service (442 | 12.0%), Education Instruction & Library (313 | 8.5%), Health Diagnosing & Treating (302 | 8.2%), Management (200 | 5.4%), and Health Technologists (182 | 5.0%).
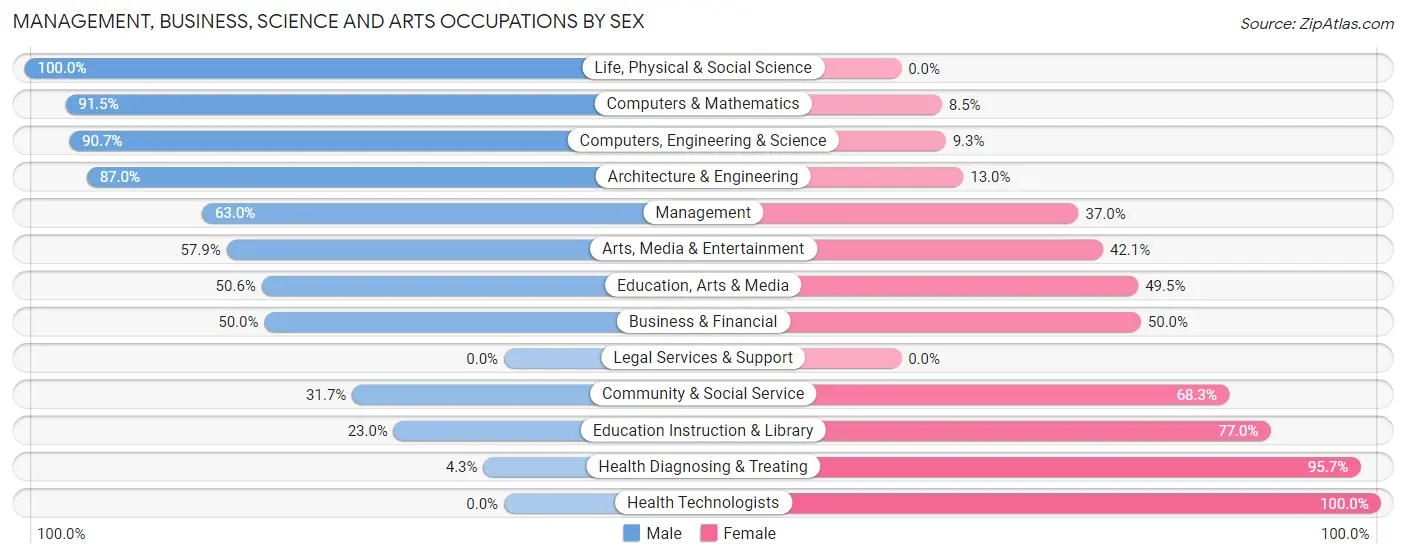
Management, Business, Science and Arts Occupations by Sex
Within the Management, Business, Science and Arts occupations in Shelby, the most male-oriented occupations are Life, Physical & Social Science (100.0%), Computers & Mathematics (91.5%), and Computers, Engineering & Science (90.7%), while the most female-oriented occupations are Health Technologists (100.0%), Health Diagnosing & Treating (95.7%), and Education Instruction & Library (77.0%).
| Occupation | Male | Female |
| Management | 126 (63.0%) | 74 (37.0%) |
| Business & Financial | 45 (50.0%) | 45 (50.0%) |
| Computers, Engineering & Science | 156 (90.7%) | 16 (9.3%) |
| Computers & Mathematics | 97 (91.5%) | 9 (8.5%) |
| Architecture & Engineering | 47 (87.0%) | 7 (13.0%) |
| Life, Physical & Social Science | 12 (100.0%) | 0 (0.0%) |
| Community & Social Service | 140 (31.7%) | 302 (68.3%) |
| Education, Arts & Media | 46 (50.5%) | 45 (49.4%) |
| Legal Services & Support | 0 (0.0%) | 0 (0.0%) |
| Education Instruction & Library | 72 (23.0%) | 241 (77.0%) |
| Arts, Media & Entertainment | 22 (57.9%) | 16 (42.1%) |
| Health Diagnosing & Treating | 13 (4.3%) | 289 (95.7%) |
| Health Technologists | 0 (0.0%) | 182 (100.0%) |
| Total (Category) | 480 (39.8%) | 726 (60.2%) |
| Total (Overall) | 1,802 (49.0%) | 1,874 (51.0%) |
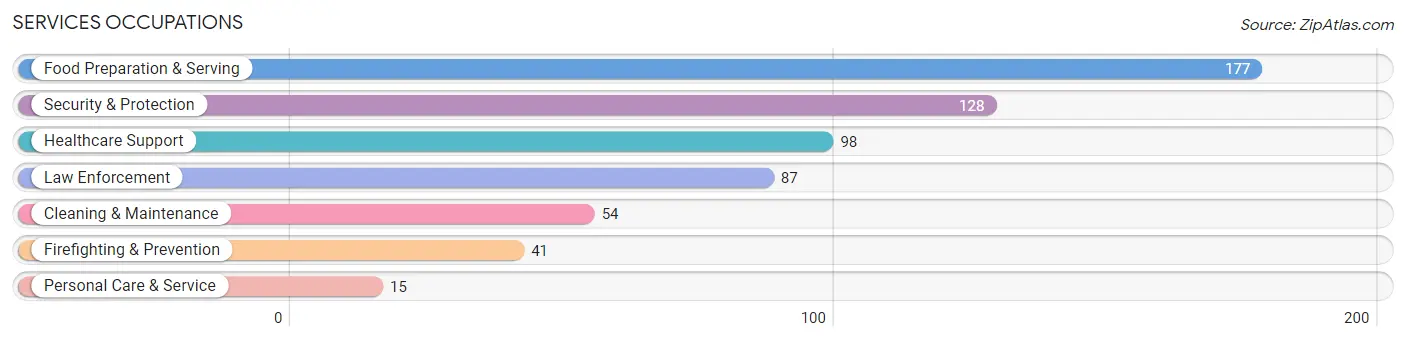
Services Occupations
The most common Services occupations in Shelby are Food Preparation & Serving (177 | 4.8%), Security & Protection (128 | 3.5%), Healthcare Support (98 | 2.7%), Law Enforcement (87 | 2.4%), and Cleaning & Maintenance (54 | 1.5%).
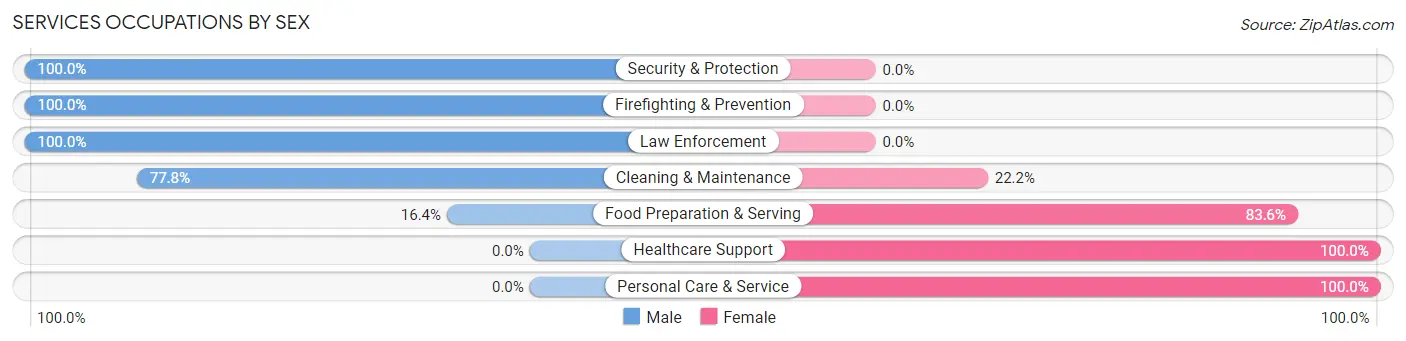
Services Occupations by Sex
Within the Services occupations in Shelby, the most male-oriented occupations are Security & Protection (100.0%), Firefighting & Prevention (100.0%), and Law Enforcement (100.0%), while the most female-oriented occupations are Healthcare Support (100.0%), Personal Care & Service (100.0%), and Food Preparation & Serving (83.6%).
| Occupation | Male | Female |
| Healthcare Support | 0 (0.0%) | 98 (100.0%) |
| Security & Protection | 128 (100.0%) | 0 (0.0%) |
| Firefighting & Prevention | 41 (100.0%) | 0 (0.0%) |
| Law Enforcement | 87 (100.0%) | 0 (0.0%) |
| Food Preparation & Serving | 29 (16.4%) | 148 (83.6%) |
| Cleaning & Maintenance | 42 (77.8%) | 12 (22.2%) |
| Personal Care & Service | 0 (0.0%) | 15 (100.0%) |
| Total (Category) | 199 (42.2%) | 273 (57.8%) |
| Total (Overall) | 1,802 (49.0%) | 1,874 (51.0%) |
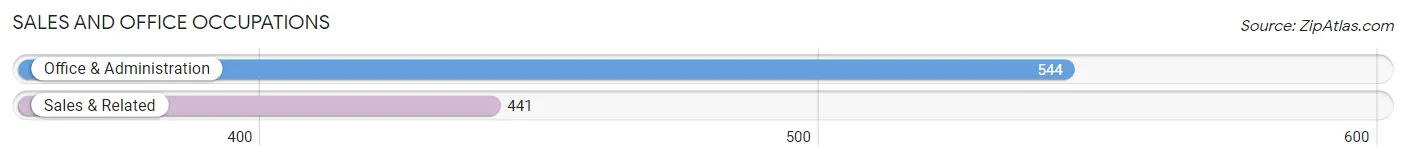
Sales and Office Occupations
The most common Sales and Office occupations in Shelby are Office & Administration (544 | 14.8%), and Sales & Related (441 | 12.0%).
Sales and Office Occupations by Sex
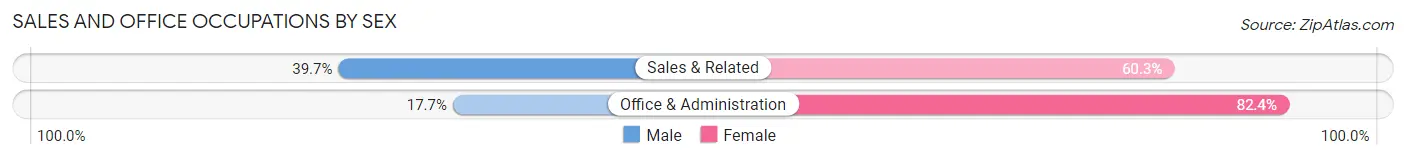
| Occupation | Male | Female |
| Sales & Related | 175 (39.7%) | 266 (60.3%) |
| Office & Administration | 96 (17.6%) | 448 (82.4%) |
| Total (Category) | 271 (27.5%) | 714 (72.5%) |
| Total (Overall) | 1,802 (49.0%) | 1,874 (51.0%) |
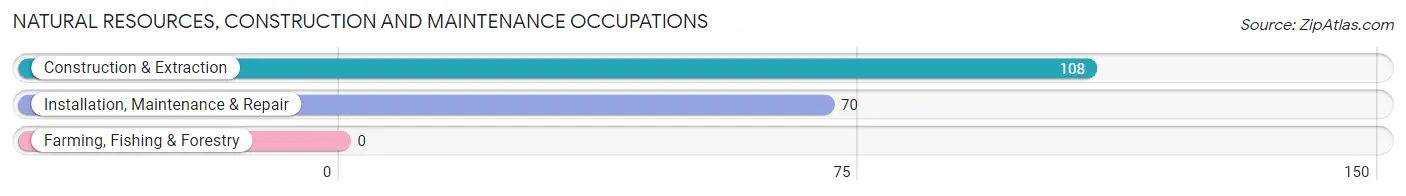
Natural Resources, Construction and Maintenance Occupations
The most common Natural Resources, Construction and Maintenance occupations in Shelby are Construction & Extraction (108 | 2.9%), and Installation, Maintenance & Repair (70 | 1.9%).
Natural Resources, Construction and Maintenance Occupations by Sex
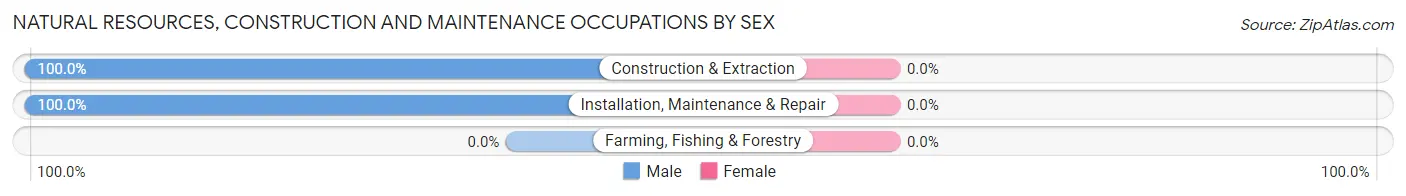
| Occupation | Male | Female |
| Farming, Fishing & Forestry | 0 (0.0%) | 0 (0.0%) |
| Construction & Extraction | 108 (100.0%) | 0 (0.0%) |
| Installation, Maintenance & Repair | 70 (100.0%) | 0 (0.0%) |
| Total (Category) | 178 (100.0%) | 0 (0.0%) |
| Total (Overall) | 1,802 (49.0%) | 1,874 (51.0%) |
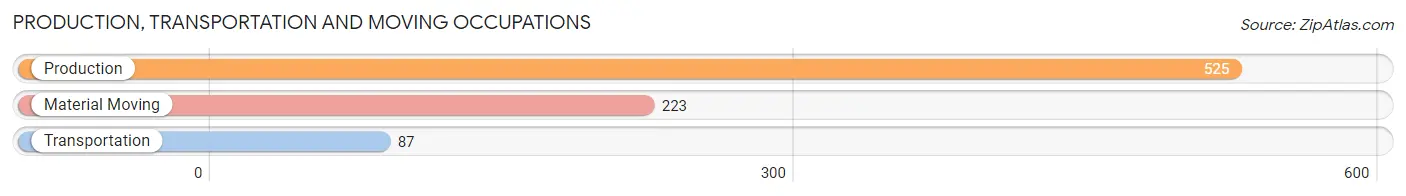
Production, Transportation and Moving Occupations
The most common Production, Transportation and Moving occupations in Shelby are Production (525 | 14.3%), Material Moving (223 | 6.1%), and Transportation (87 | 2.4%).
Production, Transportation and Moving Occupations by Sex
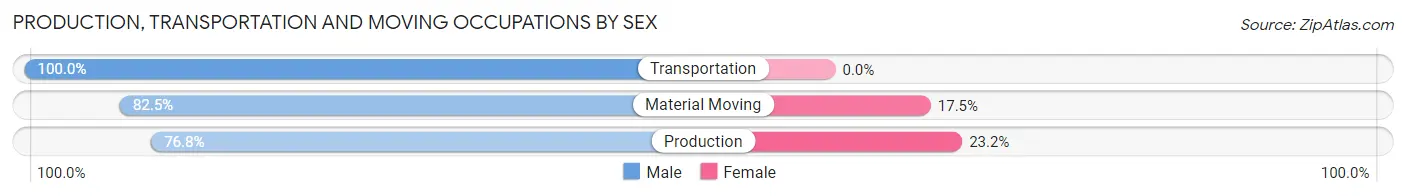
| Occupation | Male | Female |
| Production | 403 (76.8%) | 122 (23.2%) |
| Transportation | 87 (100.0%) | 0 (0.0%) |
| Material Moving | 184 (82.5%) | 39 (17.5%) |
| Total (Category) | 674 (80.7%) | 161 (19.3%) |
| Total (Overall) | 1,802 (49.0%) | 1,874 (51.0%) |
Employment Industries by Sex in Shelby
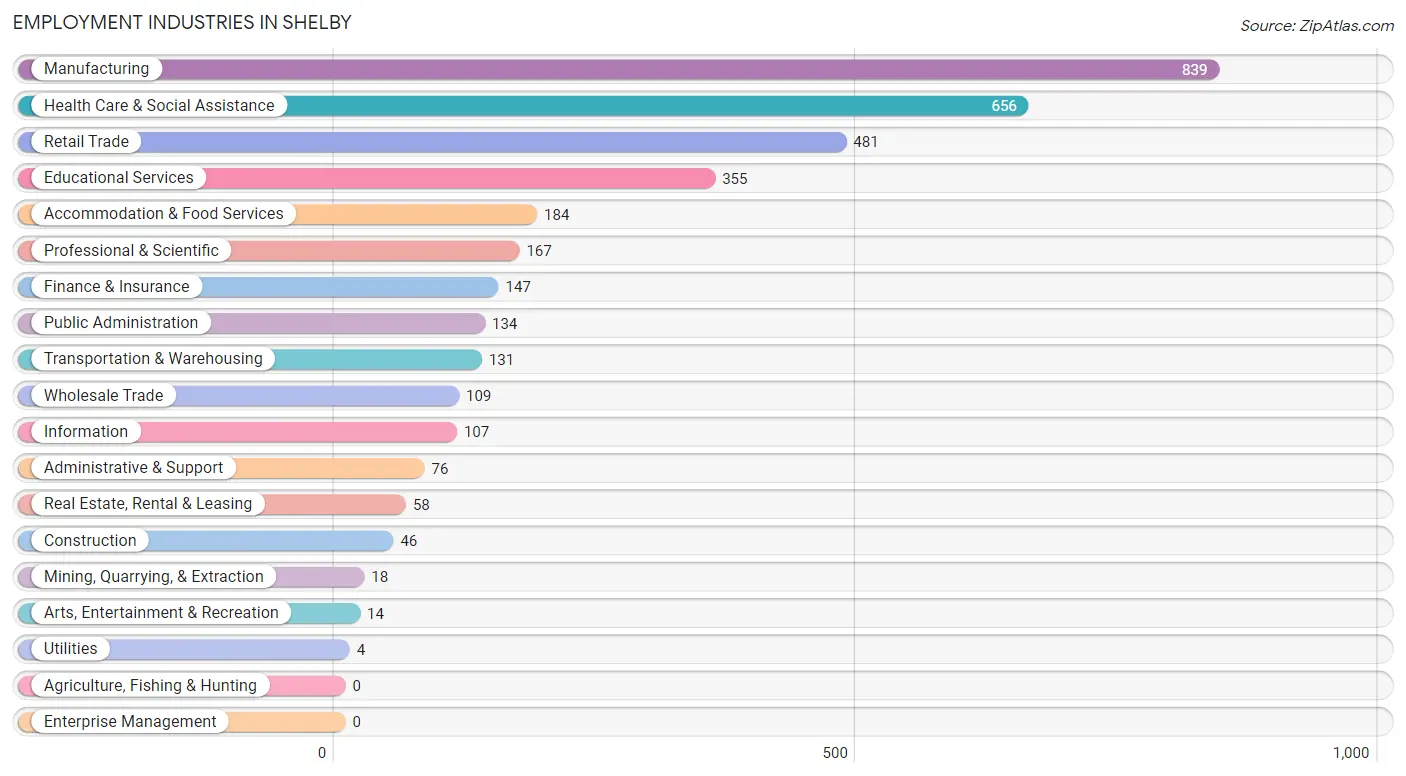
Employment Industries in Shelby
The major employment industries in Shelby include Manufacturing (839 | 22.8%), Health Care & Social Assistance (656 | 17.8%), Retail Trade (481 | 13.1%), Educational Services (355 | 9.7%), and Accommodation & Food Services (184 | 5.0%).
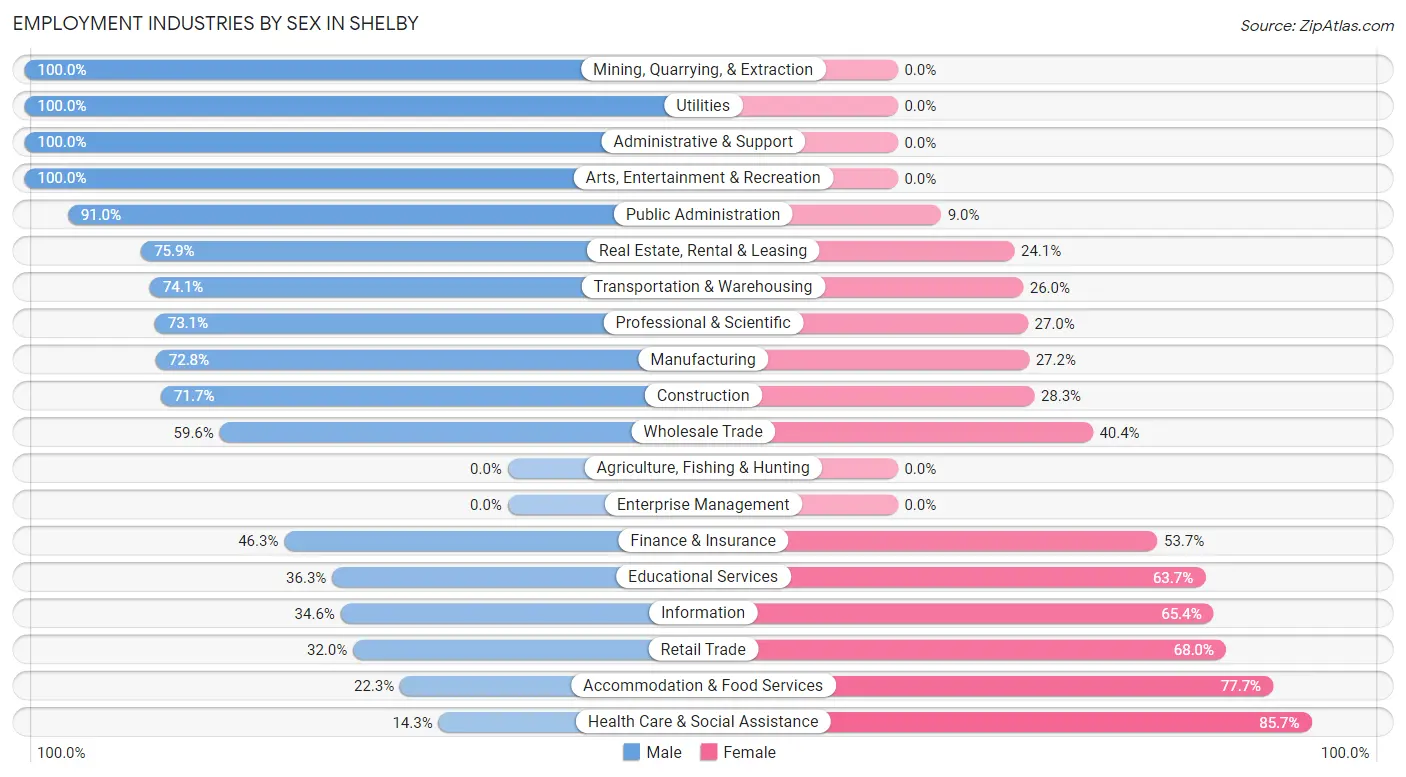
Employment Industries by Sex in Shelby
The Shelby industries that see more men than women are Mining, Quarrying, & Extraction (100.0%), Utilities (100.0%), and Administrative & Support (100.0%), whereas the industries that tend to have a higher number of women are Health Care & Social Assistance (85.7%), Accommodation & Food Services (77.7%), and Retail Trade (68.0%).
| Industry | Male | Female |
| Agriculture, Fishing & Hunting | 0 (0.0%) | 0 (0.0%) |
| Mining, Quarrying, & Extraction | 18 (100.0%) | 0 (0.0%) |
| Construction | 33 (71.7%) | 13 (28.3%) |
| Manufacturing | 611 (72.8%) | 228 (27.2%) |
| Wholesale Trade | 65 (59.6%) | 44 (40.4%) |
| Retail Trade | 154 (32.0%) | 327 (68.0%) |
| Transportation & Warehousing | 97 (74.1%) | 34 (26.0%) |
| Utilities | 4 (100.0%) | 0 (0.0%) |
| Information | 37 (34.6%) | 70 (65.4%) |
| Finance & Insurance | 68 (46.3%) | 79 (53.7%) |
| Real Estate, Rental & Leasing | 44 (75.9%) | 14 (24.1%) |
| Professional & Scientific | 122 (73.1%) | 45 (27.0%) |
| Enterprise Management | 0 (0.0%) | 0 (0.0%) |
| Administrative & Support | 76 (100.0%) | 0 (0.0%) |
| Educational Services | 129 (36.3%) | 226 (63.7%) |
| Health Care & Social Assistance | 94 (14.3%) | 562 (85.7%) |
| Arts, Entertainment & Recreation | 14 (100.0%) | 0 (0.0%) |
| Accommodation & Food Services | 41 (22.3%) | 143 (77.7%) |
| Public Administration | 122 (91.0%) | 12 (9.0%) |
| Total | 1,802 (49.0%) | 1,874 (51.0%) |
Education in Shelby
School Enrollment in Shelby
The most common levels of schooling among the 1,831 students in Shelby are elementary school (629 | 34.4%), high school (415 | 22.7%), and middle school (373 | 20.4%).
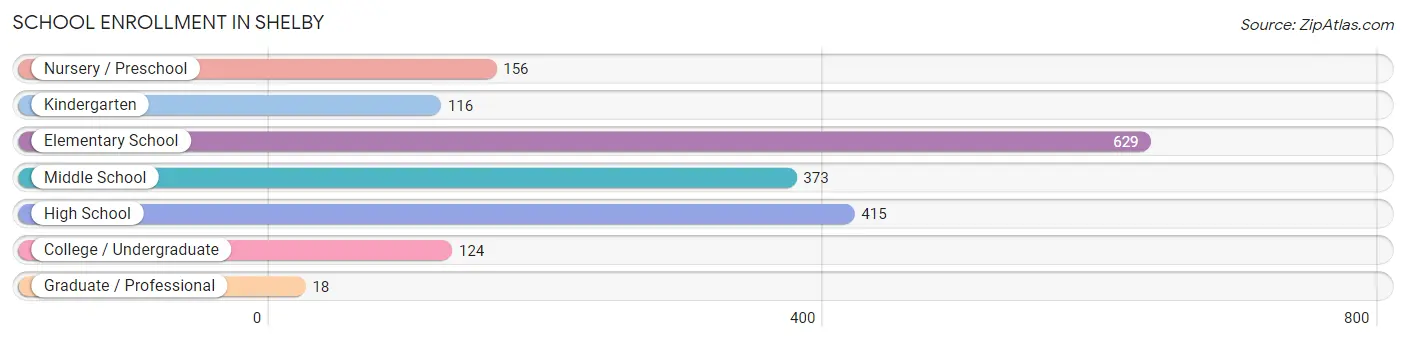
| School Level | # Students | % Students |
| Nursery / Preschool | 156 | 8.5% |
| Kindergarten | 116 | 6.3% |
| Elementary School | 629 | 34.4% |
| Middle School | 373 | 20.4% |
| High School | 415 | 22.7% |
| College / Undergraduate | 124 | 6.8% |
| Graduate / Professional | 18 | 1.0% |
| Total | 1,831 | 100.0% |
School Enrollment by Age by Funding Source in Shelby
Out of a total of 1,831 students who are enrolled in schools in Shelby, 238 (13.0%) attend a private institution, while the remaining 1,593 (87.0%) are enrolled in public schools. The age group of 20 to 24 year olds has the highest likelihood of being enrolled in private schools, with 12 (100.0% in the age bracket) enrolled. Conversely, the age group of 18 to 19 year olds has the lowest likelihood of being enrolled in a private school, with 71 (100.0% in the age bracket) attending a public institution.
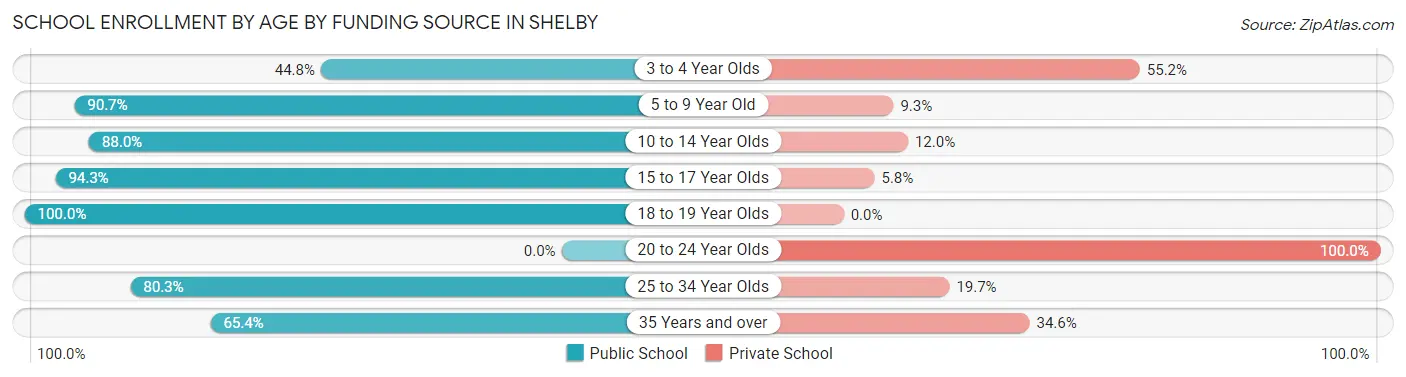
| Age Bracket | Public School | Private School |
| 3 to 4 Year Olds | 39 (44.8%) | 48 (55.2%) |
| 5 to 9 Year Old | 616 (90.7%) | 63 (9.3%) |
| 10 to 14 Year Olds | 485 (88.0%) | 66 (12.0%) |
| 15 to 17 Year Olds | 295 (94.3%) | 18 (5.8%) |
| 18 to 19 Year Olds | 71 (100.0%) | 0 (0.0%) |
| 20 to 24 Year Olds | 0 (0.0%) | 12 (100.0%) |
| 25 to 34 Year Olds | 53 (80.3%) | 13 (19.7%) |
| 35 Years and over | 34 (65.4%) | 18 (34.6%) |
| Total | 1,593 (87.0%) | 238 (13.0%) |
Educational Attainment by Field of Study in Shelby
Education (354 | 34.4%), business (158 | 15.3%), science & technology (155 | 15.0%), liberal arts & history (74 | 7.2%), and social sciences (53 | 5.1%) are the most common fields of study among 1,030 individuals in Shelby who have obtained a bachelor's degree or higher.
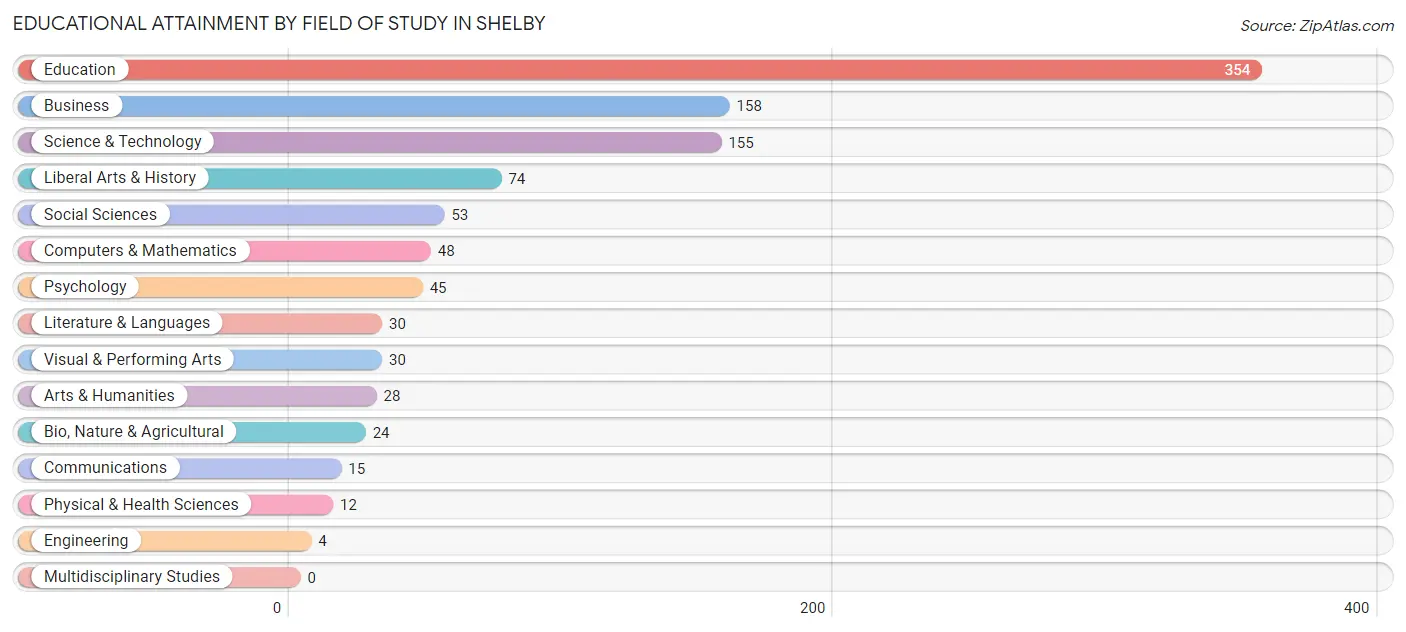
| Field of Study | # Graduates | % Graduates |
| Computers & Mathematics | 48 | 4.7% |
| Bio, Nature & Agricultural | 24 | 2.3% |
| Physical & Health Sciences | 12 | 1.2% |
| Psychology | 45 | 4.4% |
| Social Sciences | 53 | 5.1% |
| Engineering | 4 | 0.4% |
| Multidisciplinary Studies | 0 | 0.0% |
| Science & Technology | 155 | 15.0% |
| Business | 158 | 15.3% |
| Education | 354 | 34.4% |
| Literature & Languages | 30 | 2.9% |
| Liberal Arts & History | 74 | 7.2% |
| Visual & Performing Arts | 30 | 2.9% |
| Communications | 15 | 1.5% |
| Arts & Humanities | 28 | 2.7% |
| Total | 1,030 | 100.0% |
Transportation & Commute in Shelby
Vehicle Availability by Sex in Shelby
The most prevalent vehicle ownership categories in Shelby are males with 2 vehicles (858, accounting for 48.3%) and females with 2 vehicles (841, making up 47.6%).
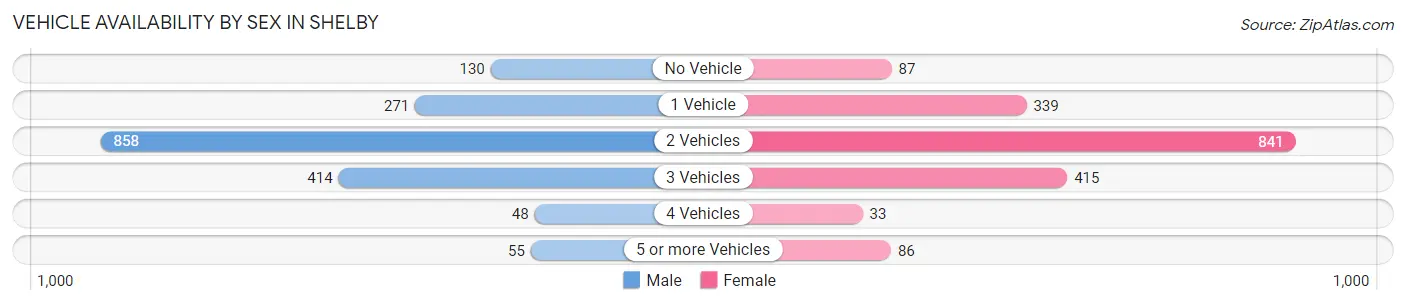
| Vehicles Available | Male | Female |
| No Vehicle | 130 (7.3%) | 87 (4.8%) |
| 1 Vehicle | 271 (15.3%) | 339 (18.8%) |
| 2 Vehicles | 858 (48.3%) | 841 (46.7%) |
| 3 Vehicles | 414 (23.3%) | 415 (23.0%) |
| 4 Vehicles | 48 (2.7%) | 33 (1.8%) |
| 5 or more Vehicles | 55 (3.1%) | 86 (4.8%) |
| Total | 1,776 (100.0%) | 1,801 (100.0%) |
Commute Time in Shelby
The most frequently occuring commute durations in Shelby are 20 to 24 minutes (629 commuters, 18.7%), 30 to 34 minutes (482 commuters, 14.3%), and 25 to 29 minutes (475 commuters, 14.1%).
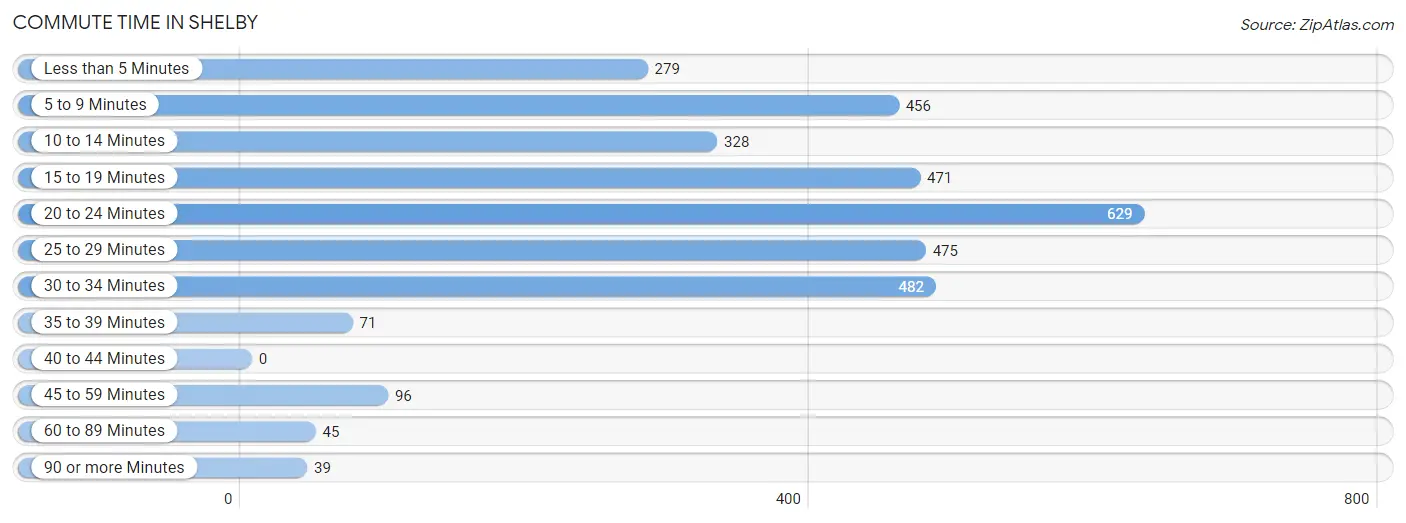
| Commute Time | # Commuters | % Commuters |
| Less than 5 Minutes | 279 | 8.3% |
| 5 to 9 Minutes | 456 | 13.5% |
| 10 to 14 Minutes | 328 | 9.7% |
| 15 to 19 Minutes | 471 | 14.0% |
| 20 to 24 Minutes | 629 | 18.7% |
| 25 to 29 Minutes | 475 | 14.1% |
| 30 to 34 Minutes | 482 | 14.3% |
| 35 to 39 Minutes | 71 | 2.1% |
| 40 to 44 Minutes | 0 | 0.0% |
| 45 to 59 Minutes | 96 | 2.9% |
| 60 to 89 Minutes | 45 | 1.3% |
| 90 or more Minutes | 39 | 1.2% |
Commute Time by Sex in Shelby
The most common commute times in Shelby are 20 to 24 minutes (336 commuters, 20.0%) for males and 20 to 24 minutes (293 commuters, 17.3%) for females.
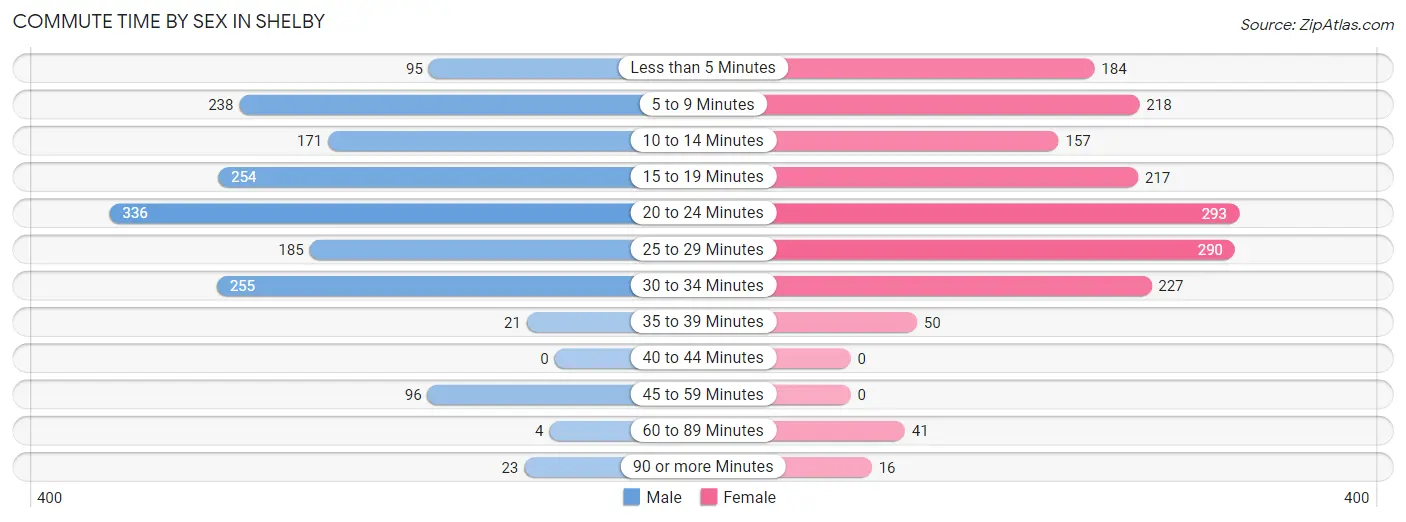
| Commute Time | Male | Female |
| Less than 5 Minutes | 95 (5.7%) | 184 (10.9%) |
| 5 to 9 Minutes | 238 (14.2%) | 218 (12.9%) |
| 10 to 14 Minutes | 171 (10.2%) | 157 (9.3%) |
| 15 to 19 Minutes | 254 (15.1%) | 217 (12.8%) |
| 20 to 24 Minutes | 336 (20.0%) | 293 (17.3%) |
| 25 to 29 Minutes | 185 (11.0%) | 290 (17.1%) |
| 30 to 34 Minutes | 255 (15.2%) | 227 (13.4%) |
| 35 to 39 Minutes | 21 (1.3%) | 50 (2.9%) |
| 40 to 44 Minutes | 0 (0.0%) | 0 (0.0%) |
| 45 to 59 Minutes | 96 (5.7%) | 0 (0.0%) |
| 60 to 89 Minutes | 4 (0.2%) | 41 (2.4%) |
| 90 or more Minutes | 23 (1.4%) | 16 (0.9%) |
Time of Departure to Work by Sex in Shelby
The most frequent times of departure to work in Shelby are 4:00 PM to 11:59 PM (220, 13.1%) for males and 7:00 AM to 7:29 AM (314, 18.5%) for females.
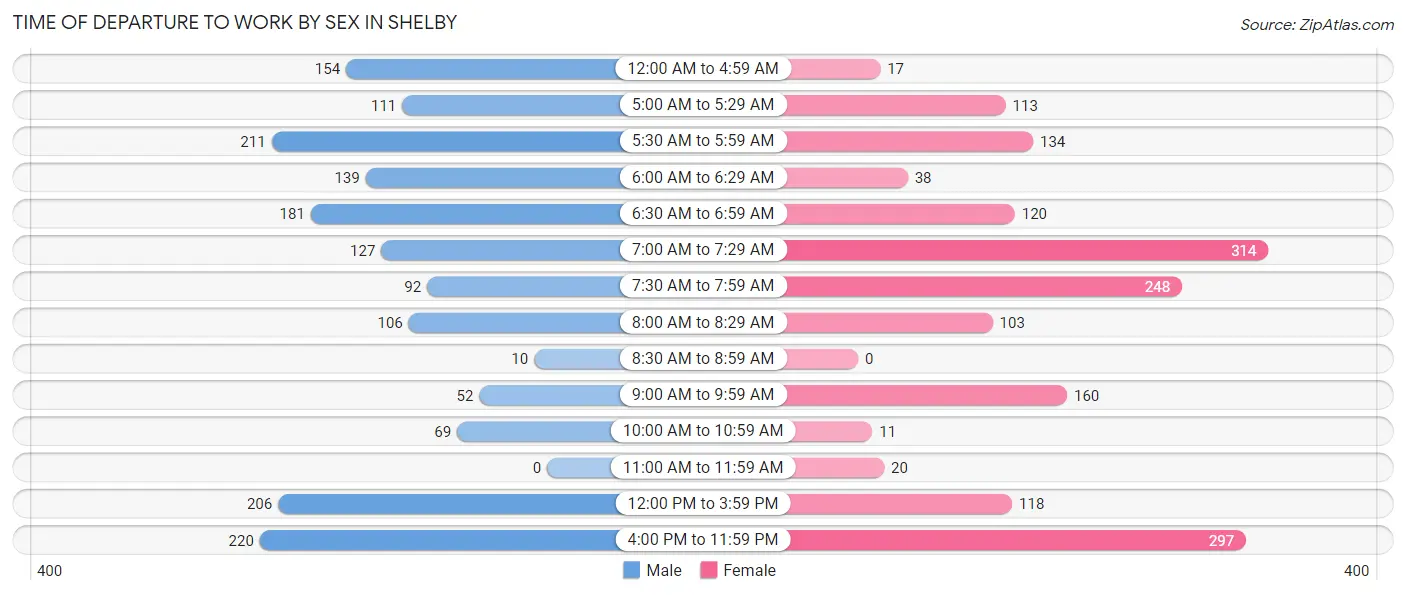
| Time of Departure | Male | Female |
| 12:00 AM to 4:59 AM | 154 (9.2%) | 17 (1.0%) |
| 5:00 AM to 5:29 AM | 111 (6.6%) | 113 (6.7%) |
| 5:30 AM to 5:59 AM | 211 (12.6%) | 134 (7.9%) |
| 6:00 AM to 6:29 AM | 139 (8.3%) | 38 (2.2%) |
| 6:30 AM to 6:59 AM | 181 (10.8%) | 120 (7.1%) |
| 7:00 AM to 7:29 AM | 127 (7.6%) | 314 (18.5%) |
| 7:30 AM to 7:59 AM | 92 (5.5%) | 248 (14.6%) |
| 8:00 AM to 8:29 AM | 106 (6.3%) | 103 (6.1%) |
| 8:30 AM to 8:59 AM | 10 (0.6%) | 0 (0.0%) |
| 9:00 AM to 9:59 AM | 52 (3.1%) | 160 (9.5%) |
| 10:00 AM to 10:59 AM | 69 (4.1%) | 11 (0.6%) |
| 11:00 AM to 11:59 AM | 0 (0.0%) | 20 (1.2%) |
| 12:00 PM to 3:59 PM | 206 (12.3%) | 118 (7.0%) |
| 4:00 PM to 11:59 PM | 220 (13.1%) | 297 (17.5%) |
| Total | 1,678 (100.0%) | 1,693 (100.0%) |
Housing Occupancy in Shelby
Occupancy by Ownership in Shelby
Of the total 3,483 dwellings in Shelby, owner-occupied units account for 2,151 (61.8%), while renter-occupied units make up 1,332 (38.2%).
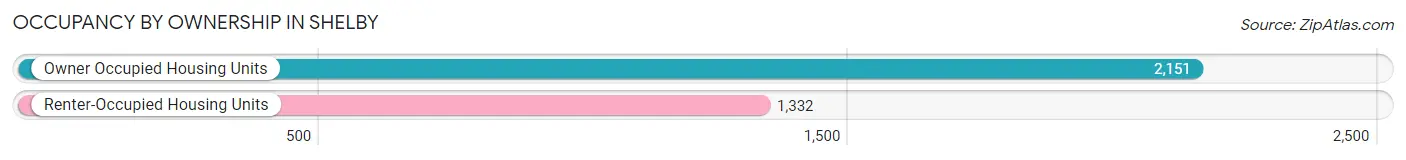
| Occupancy | # Housing Units | % Housing Units |
| Owner Occupied Housing Units | 2,151 | 61.8% |
| Renter-Occupied Housing Units | 1,332 | 38.2% |
| Total Occupied Housing Units | 3,483 | 100.0% |
Occupancy by Household Size in Shelby
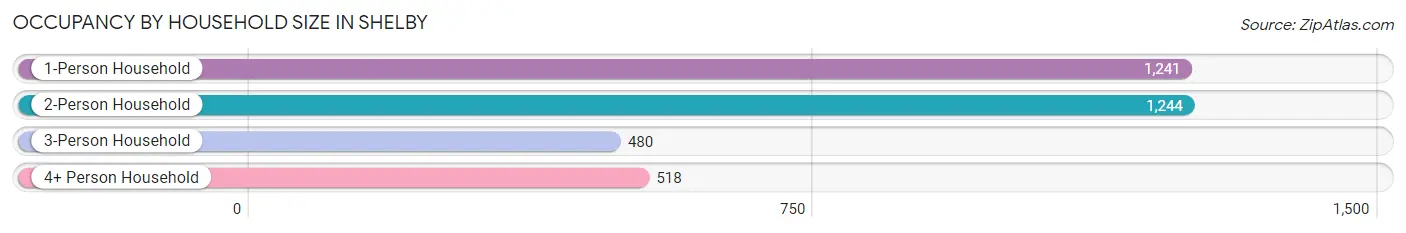
| Household Size | # Housing Units | % Housing Units |
| 1-Person Household | 1,241 | 35.6% |
| 2-Person Household | 1,244 | 35.7% |
| 3-Person Household | 480 | 13.8% |
| 4+ Person Household | 518 | 14.9% |
| Total Housing Units | 3,483 | 100.0% |
Occupancy by Ownership by Household Size in Shelby
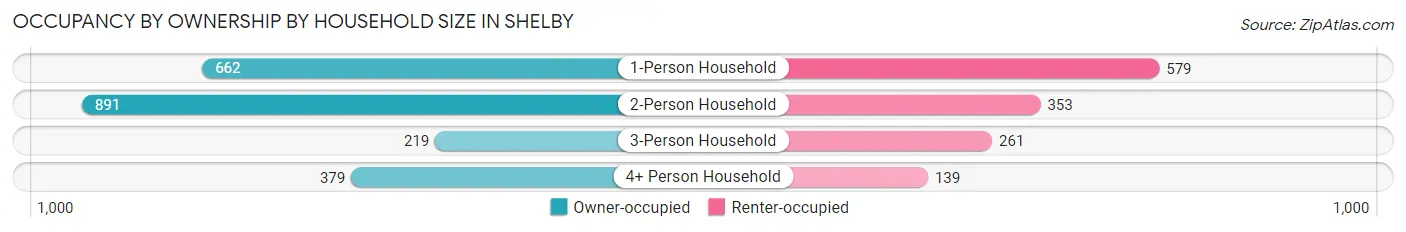
| Household Size | Owner-occupied | Renter-occupied |
| 1-Person Household | 662 (53.3%) | 579 (46.7%) |
| 2-Person Household | 891 (71.6%) | 353 (28.4%) |
| 3-Person Household | 219 (45.6%) | 261 (54.4%) |
| 4+ Person Household | 379 (73.2%) | 139 (26.8%) |
| Total Housing Units | 2,151 (61.8%) | 1,332 (38.2%) |
Occupancy by Educational Attainment in Shelby
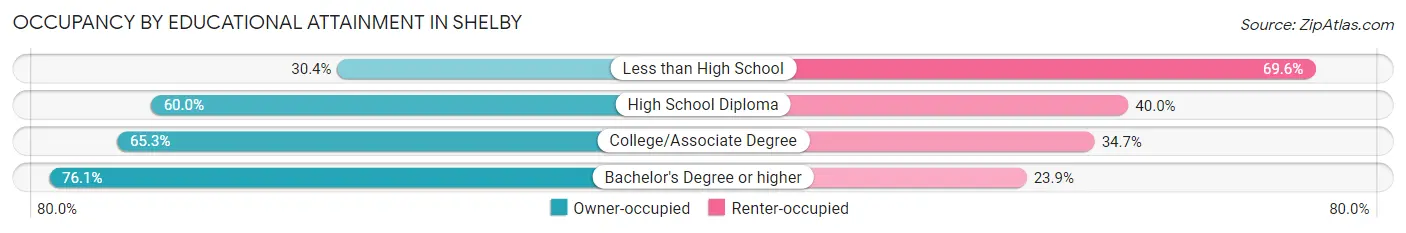
| Household Size | Owner-occupied | Renter-occupied |
| Less than High School | 93 (30.4%) | 213 (69.6%) |
| High School Diploma | 928 (60.0%) | 619 (40.0%) |
| College/Associate Degree | 671 (65.3%) | 356 (34.7%) |
| Bachelor's Degree or higher | 459 (76.1%) | 144 (23.9%) |
Occupancy by Age of Householder in Shelby
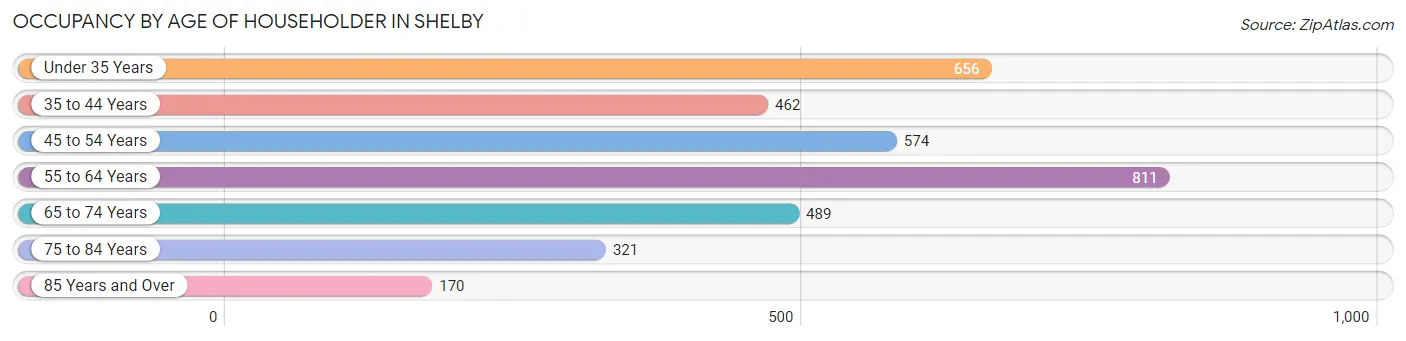
| Age Bracket | # Households | % Households |
| Under 35 Years | 656 | 18.8% |
| 35 to 44 Years | 462 | 13.3% |
| 45 to 54 Years | 574 | 16.5% |
| 55 to 64 Years | 811 | 23.3% |
| 65 to 74 Years | 489 | 14.0% |
| 75 to 84 Years | 321 | 9.2% |
| 85 Years and Over | 170 | 4.9% |
| Total | 3,483 | 100.0% |
Housing Finances in Shelby
Median Income by Occupancy in Shelby
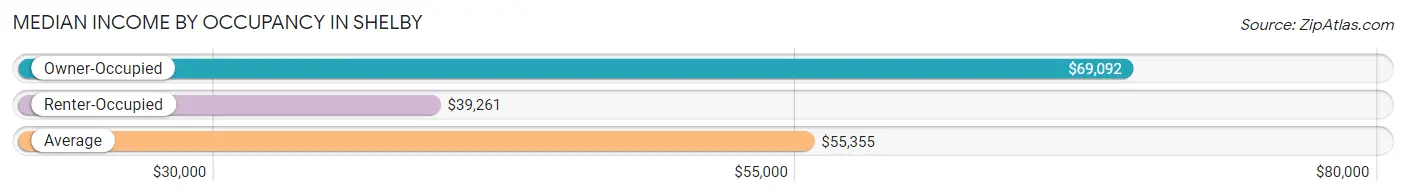
| Occupancy Type | # Households | Median Income |
| Owner-Occupied | 2,151 (61.8%) | $69,092 |
| Renter-Occupied | 1,332 (38.2%) | $39,261 |
| Average | 3,483 (100.0%) | $55,355 |
Occupancy by Householder Income Bracket in Shelby
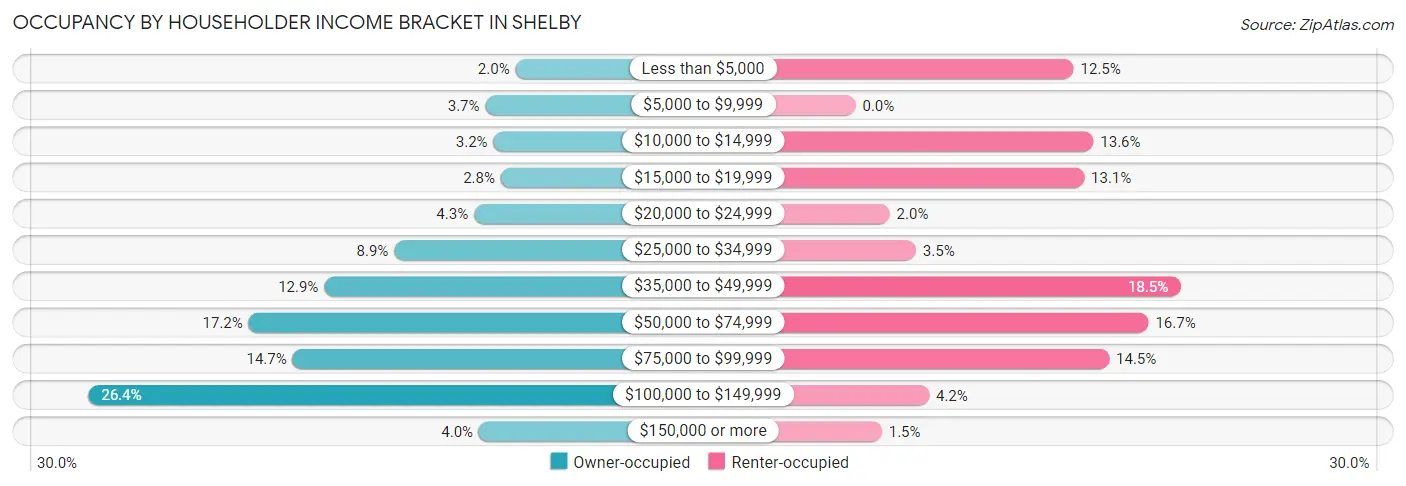
| Income Bracket | Owner-occupied | Renter-occupied |
| Less than $5,000 | 42 (1.9%) | 166 (12.5%) |
| $5,000 to $9,999 | 79 (3.7%) | 0 (0.0%) |
| $10,000 to $14,999 | 69 (3.2%) | 181 (13.6%) |
| $15,000 to $19,999 | 60 (2.8%) | 174 (13.1%) |
| $20,000 to $24,999 | 93 (4.3%) | 26 (1.9%) |
| $25,000 to $34,999 | 191 (8.9%) | 46 (3.5%) |
| $35,000 to $49,999 | 277 (12.9%) | 247 (18.5%) |
| $50,000 to $74,999 | 370 (17.2%) | 223 (16.7%) |
| $75,000 to $99,999 | 316 (14.7%) | 193 (14.5%) |
| $100,000 to $149,999 | 567 (26.4%) | 56 (4.2%) |
| $150,000 or more | 87 (4.0%) | 20 (1.5%) |
| Total | 2,151 (100.0%) | 1,332 (100.0%) |
Monthly Housing Cost Tiers in Shelby
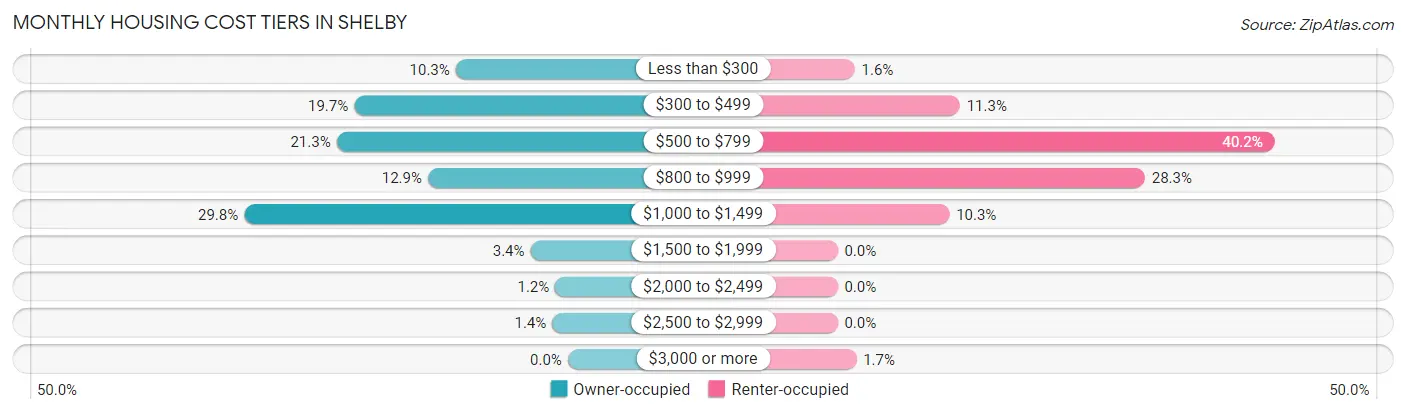
| Monthly Cost | Owner-occupied | Renter-occupied |
| Less than $300 | 222 (10.3%) | 21 (1.6%) |
| $300 to $499 | 423 (19.7%) | 150 (11.3%) |
| $500 to $799 | 458 (21.3%) | 536 (40.2%) |
| $800 to $999 | 277 (12.9%) | 377 (28.3%) |
| $1,000 to $1,499 | 641 (29.8%) | 137 (10.3%) |
| $1,500 to $1,999 | 74 (3.4%) | 0 (0.0%) |
| $2,000 to $2,499 | 25 (1.2%) | 0 (0.0%) |
| $2,500 to $2,999 | 31 (1.4%) | 0 (0.0%) |
| $3,000 or more | 0 (0.0%) | 23 (1.7%) |
| Total | 2,151 (100.0%) | 1,332 (100.0%) |
Physical Housing Characteristics in Shelby
Housing Structures in Shelby
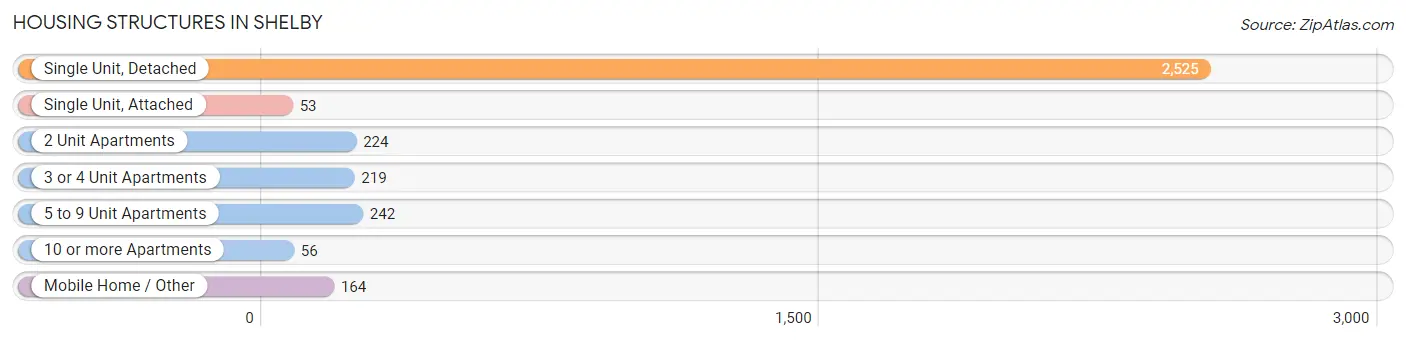
| Structure Type | # Housing Units | % Housing Units |
| Single Unit, Detached | 2,525 | 72.5% |
| Single Unit, Attached | 53 | 1.5% |
| 2 Unit Apartments | 224 | 6.4% |
| 3 or 4 Unit Apartments | 219 | 6.3% |
| 5 to 9 Unit Apartments | 242 | 7.0% |
| 10 or more Apartments | 56 | 1.6% |
| Mobile Home / Other | 164 | 4.7% |
| Total | 3,483 | 100.0% |
Housing Structures by Occupancy in Shelby
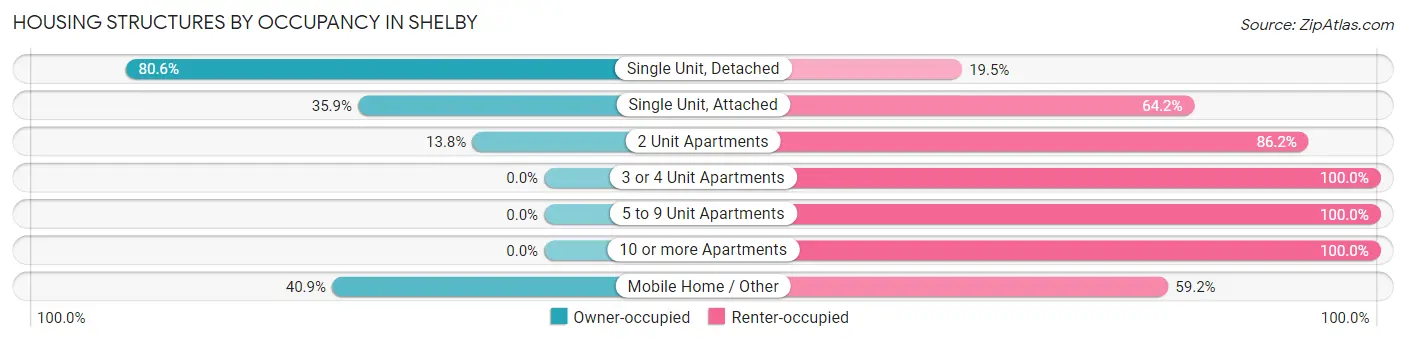
| Structure Type | Owner-occupied | Renter-occupied |
| Single Unit, Detached | 2,034 (80.5%) | 491 (19.5%) |
| Single Unit, Attached | 19 (35.8%) | 34 (64.1%) |
| 2 Unit Apartments | 31 (13.8%) | 193 (86.2%) |
| 3 or 4 Unit Apartments | 0 (0.0%) | 219 (100.0%) |
| 5 to 9 Unit Apartments | 0 (0.0%) | 242 (100.0%) |
| 10 or more Apartments | 0 (0.0%) | 56 (100.0%) |
| Mobile Home / Other | 67 (40.8%) | 97 (59.2%) |
| Total | 2,151 (61.8%) | 1,332 (38.2%) |
Housing Structures by Number of Rooms in Shelby
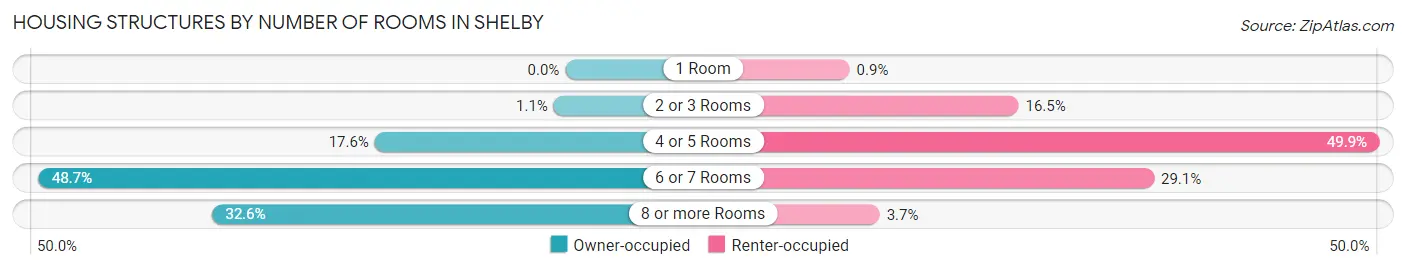
| Number of Rooms | Owner-occupied | Renter-occupied |
| 1 Room | 0 (0.0%) | 12 (0.9%) |
| 2 or 3 Rooms | 23 (1.1%) | 220 (16.5%) |
| 4 or 5 Rooms | 379 (17.6%) | 664 (49.8%) |
| 6 or 7 Rooms | 1,047 (48.7%) | 387 (29.0%) |
| 8 or more Rooms | 702 (32.6%) | 49 (3.7%) |
| Total | 2,151 (100.0%) | 1,332 (100.0%) |
Housing Structure by Heating Type in Shelby
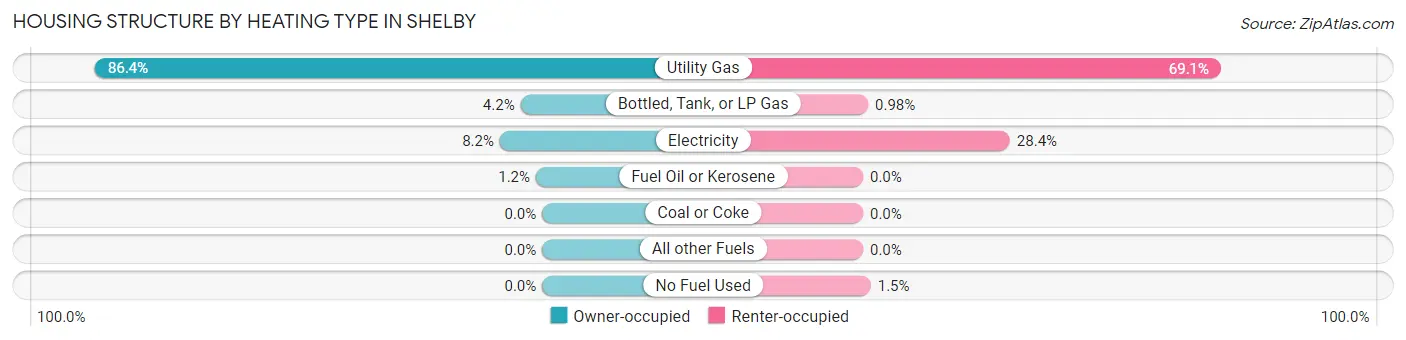
| Heating Type | Owner-occupied | Renter-occupied |
| Utility Gas | 1,859 (86.4%) | 921 (69.1%) |
| Bottled, Tank, or LP Gas | 90 (4.2%) | 13 (1.0%) |
| Electricity | 176 (8.2%) | 378 (28.4%) |
| Fuel Oil or Kerosene | 26 (1.2%) | 0 (0.0%) |
| Coal or Coke | 0 (0.0%) | 0 (0.0%) |
| All other Fuels | 0 (0.0%) | 0 (0.0%) |
| No Fuel Used | 0 (0.0%) | 20 (1.5%) |
| Total | 2,151 (100.0%) | 1,332 (100.0%) |
Household Vehicle Usage in Shelby
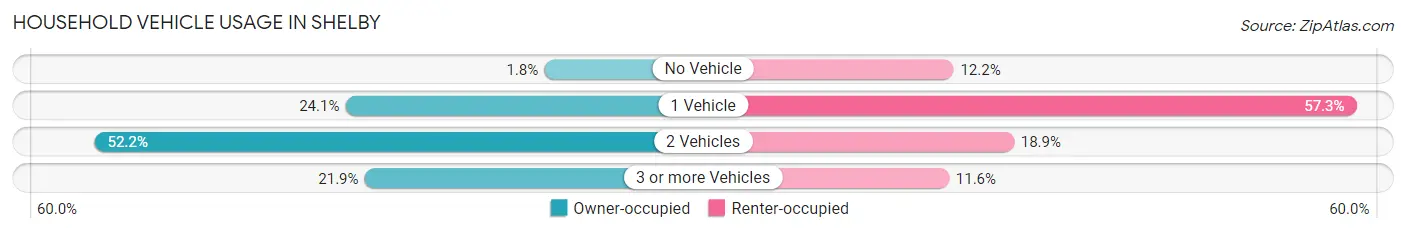
| Vehicles per Household | Owner-occupied | Renter-occupied |
| No Vehicle | 39 (1.8%) | 162 (12.2%) |
| 1 Vehicle | 518 (24.1%) | 763 (57.3%) |
| 2 Vehicles | 1,122 (52.2%) | 252 (18.9%) |
| 3 or more Vehicles | 472 (21.9%) | 155 (11.6%) |
| Total | 2,151 (100.0%) | 1,332 (100.0%) |
Real Estate & Mortgages in Shelby
Real Estate and Mortgage Overview in Shelby
| Characteristic | Without Mortgage | With Mortgage |
| Housing Units | 887 | 1,264 |
| Median Property Value | $106,000 | $116,000 |
| Median Household Income | $43,036 | $62 |
| Monthly Housing Costs | $396 | $0 |
| Real Estate Taxes | $1,178 | $0 |
Property Value by Mortgage Status in Shelby
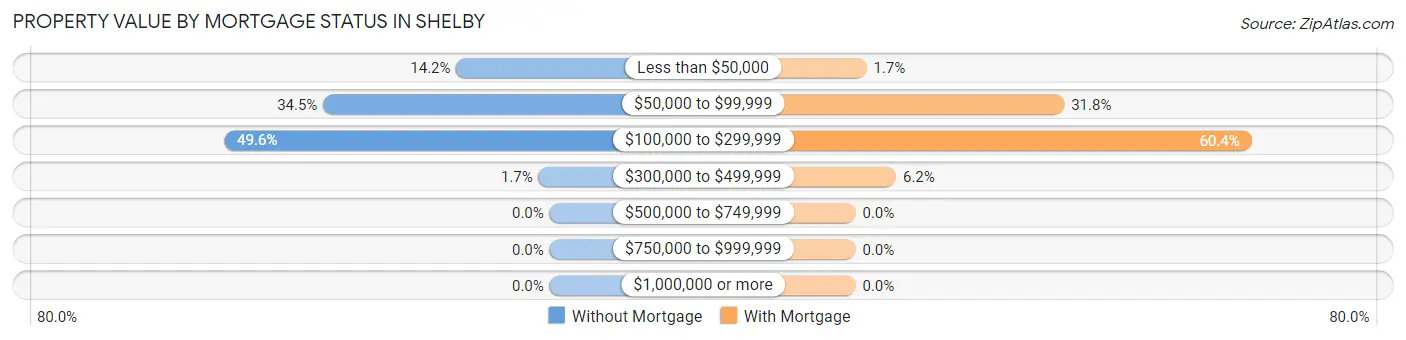
| Property Value | Without Mortgage | With Mortgage |
| Less than $50,000 | 126 (14.2%) | 21 (1.7%) |
| $50,000 to $99,999 | 306 (34.5%) | 402 (31.8%) |
| $100,000 to $299,999 | 440 (49.6%) | 763 (60.4%) |
| $300,000 to $499,999 | 15 (1.7%) | 78 (6.2%) |
| $500,000 to $749,999 | 0 (0.0%) | 0 (0.0%) |
| $750,000 to $999,999 | 0 (0.0%) | 0 (0.0%) |
| $1,000,000 or more | 0 (0.0%) | 0 (0.0%) |
| Total | 887 (100.0%) | 1,264 (100.0%) |
Household Income by Mortgage Status in Shelby
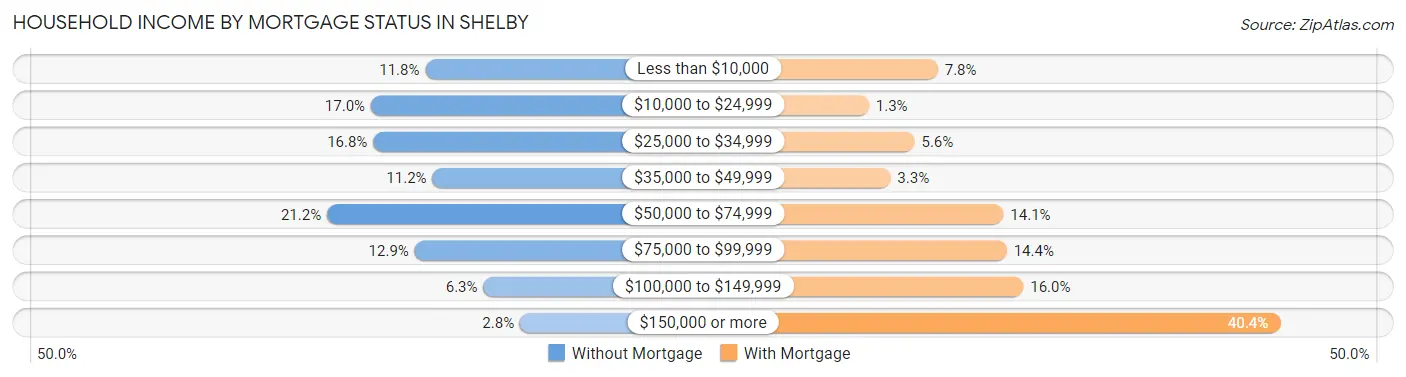
| Household Income | Without Mortgage | With Mortgage |
| Less than $10,000 | 105 (11.8%) | 99 (7.8%) |
| $10,000 to $24,999 | 151 (17.0%) | 16 (1.3%) |
| $25,000 to $34,999 | 149 (16.8%) | 71 (5.6%) |
| $35,000 to $49,999 | 99 (11.2%) | 42 (3.3%) |
| $50,000 to $74,999 | 188 (21.2%) | 178 (14.1%) |
| $75,000 to $99,999 | 114 (12.9%) | 182 (14.4%) |
| $100,000 to $149,999 | 56 (6.3%) | 202 (16.0%) |
| $150,000 or more | 25 (2.8%) | 511 (40.4%) |
| Total | 887 (100.0%) | 1,264 (100.0%) |
Property Value to Household Income Ratio in Shelby
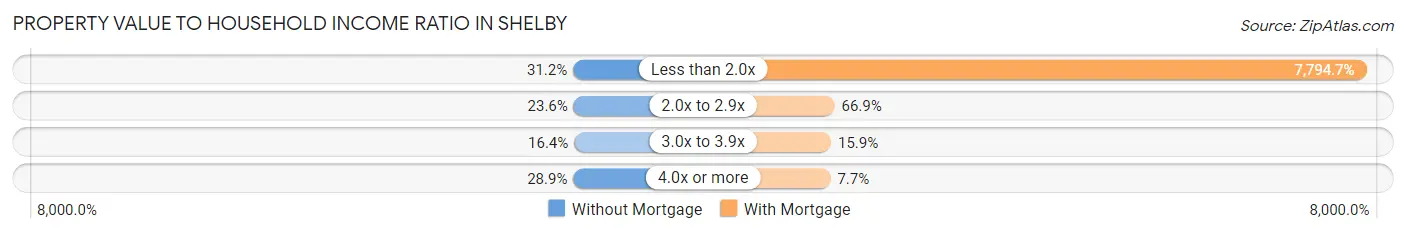
| Value-to-Income Ratio | Without Mortgage | With Mortgage |
| Less than 2.0x | 277 (31.2%) | 98,525 (7,794.7%) |
| 2.0x to 2.9x | 209 (23.6%) | 846 (66.9%) |
| 3.0x to 3.9x | 145 (16.4%) | 201 (15.9%) |
| 4.0x or more | 256 (28.9%) | 97 (7.7%) |
| Total | 887 (100.0%) | 1,264 (100.0%) |
Real Estate Taxes by Mortgage Status in Shelby
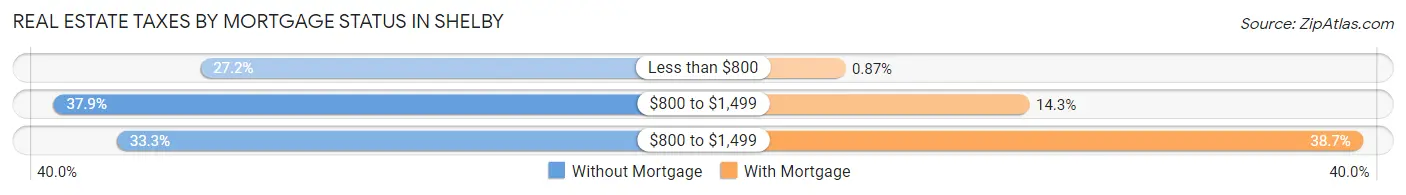
| Property Taxes | Without Mortgage | With Mortgage |
| Less than $800 | 241 (27.2%) | 11 (0.9%) |
| $800 to $1,499 | 336 (37.9%) | 181 (14.3%) |
| $800 to $1,499 | 295 (33.3%) | 489 (38.7%) |
| Total | 887 (100.0%) | 1,264 (100.0%) |
Health & Disability in Shelby
Health Insurance Coverage by Age in Shelby
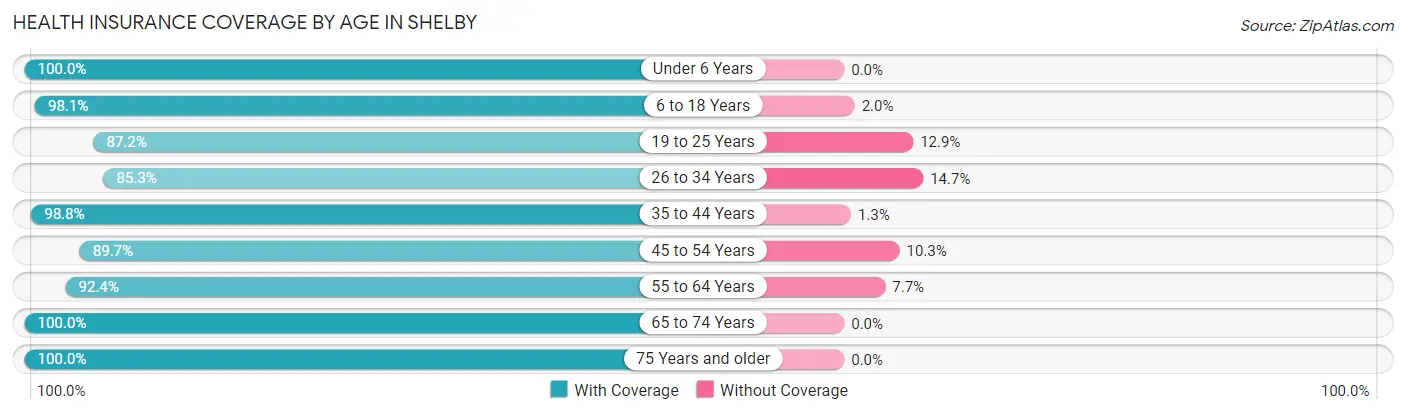
| Age Bracket | With Coverage | Without Coverage |
| Under 6 Years | 630 (100.0%) | 0 (0.0%) |
| 6 to 18 Years | 1,605 (98.1%) | 32 (1.9%) |
| 19 to 25 Years | 373 (87.2%) | 55 (12.9%) |
| 26 to 34 Years | 788 (85.3%) | 136 (14.7%) |
| 35 to 44 Years | 948 (98.8%) | 12 (1.3%) |
| 45 to 54 Years | 696 (89.7%) | 80 (10.3%) |
| 55 to 64 Years | 1,280 (92.3%) | 106 (7.6%) |
| 65 to 74 Years | 739 (100.0%) | 0 (0.0%) |
| 75 Years and older | 674 (100.0%) | 0 (0.0%) |
| Total | 7,733 (94.8%) | 421 (5.2%) |
Health Insurance Coverage by Citizenship Status in Shelby
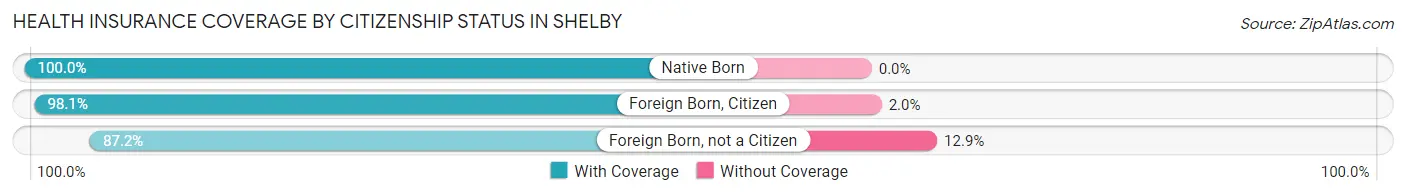
| Citizenship Status | With Coverage | Without Coverage |
| Native Born | 630 (100.0%) | 0 (0.0%) |
| Foreign Born, Citizen | 1,605 (98.1%) | 32 (1.9%) |
| Foreign Born, not a Citizen | 373 (87.2%) | 55 (12.9%) |
Health Insurance Coverage by Household Income in Shelby
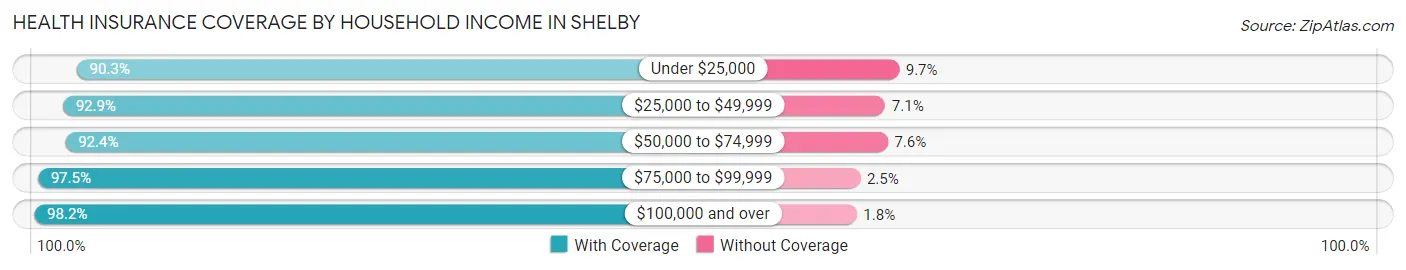
| Household Income | With Coverage | Without Coverage |
| Under $25,000 | 1,269 (90.3%) | 137 (9.7%) |
| $25,000 to $49,999 | 1,314 (92.9%) | 101 (7.1%) |
| $50,000 to $74,999 | 1,213 (92.4%) | 100 (7.6%) |
| $75,000 to $99,999 | 1,539 (97.5%) | 39 (2.5%) |
| $100,000 and over | 2,397 (98.2%) | 44 (1.8%) |
Public vs Private Health Insurance Coverage by Age in Shelby
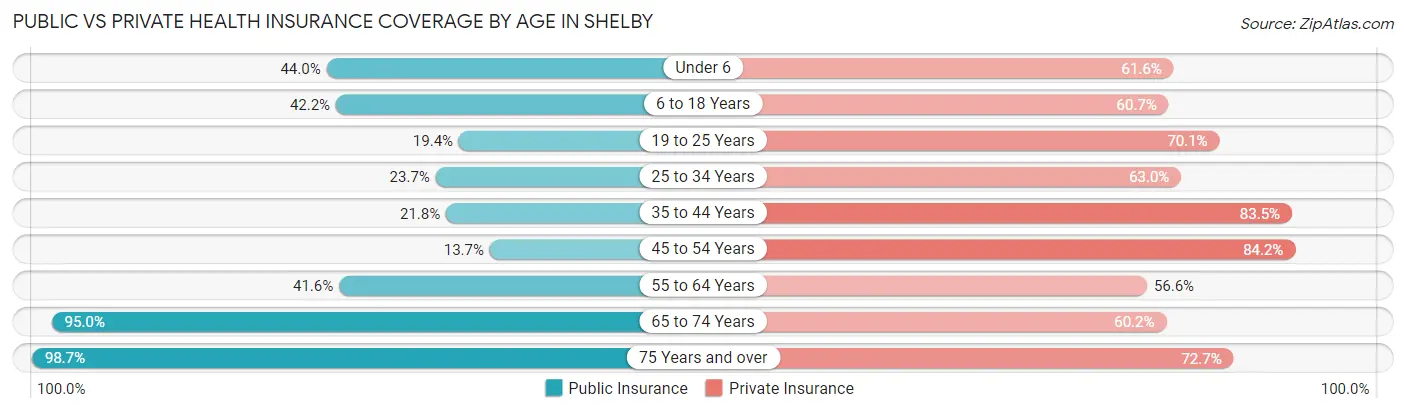
| Age Bracket | Public Insurance | Private Insurance |
| Under 6 | 277 (44.0%) | 388 (61.6%) |
| 6 to 18 Years | 691 (42.2%) | 993 (60.7%) |
| 19 to 25 Years | 83 (19.4%) | 300 (70.1%) |
| 25 to 34 Years | 219 (23.7%) | 582 (63.0%) |
| 35 to 44 Years | 209 (21.8%) | 802 (83.5%) |
| 45 to 54 Years | 106 (13.7%) | 653 (84.2%) |
| 55 to 64 Years | 577 (41.6%) | 785 (56.6%) |
| 65 to 74 Years | 702 (95.0%) | 445 (60.2%) |
| 75 Years and over | 665 (98.7%) | 490 (72.7%) |
| Total | 3,529 (43.3%) | 5,438 (66.7%) |
Disability Status by Sex by Age in Shelby
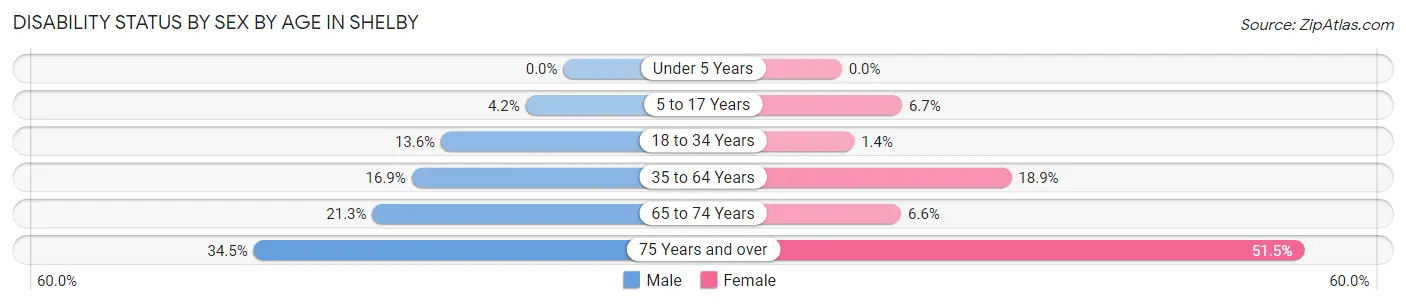
| Age Bracket | Male | Female |
| Under 5 Years | 0 (0.0%) | 0 (0.0%) |
| 5 to 17 Years | 28 (4.2%) | 68 (6.7%) |
| 18 to 34 Years | 95 (13.6%) | 10 (1.4%) |
| 35 to 64 Years | 262 (16.9%) | 297 (18.9%) |
| 65 to 74 Years | 67 (21.3%) | 28 (6.6%) |
| 75 Years and over | 69 (34.5%) | 244 (51.5%) |
Disability Class by Sex by Age in Shelby
Disability Class: Hearing Difficulty
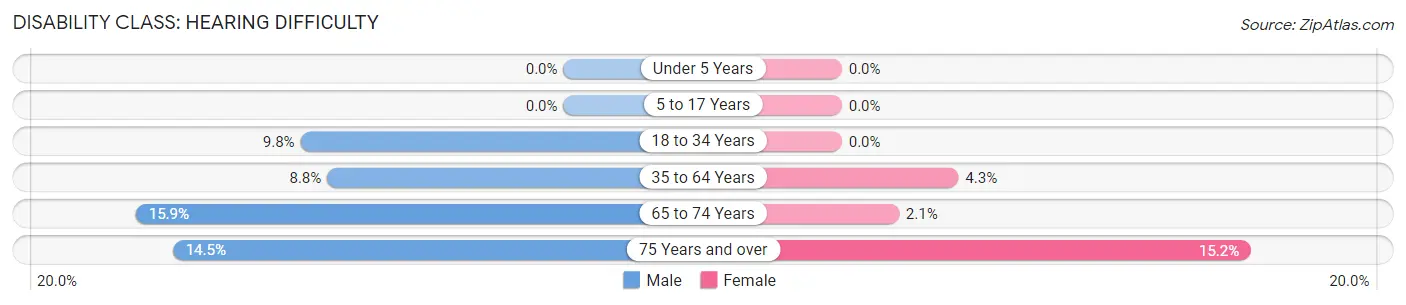
| Age Bracket | Male | Female |
| Under 5 Years | 0 (0.0%) | 0 (0.0%) |
| 5 to 17 Years | 0 (0.0%) | 0 (0.0%) |
| 18 to 34 Years | 68 (9.8%) | 0 (0.0%) |
| 35 to 64 Years | 136 (8.8%) | 68 (4.3%) |
| 65 to 74 Years | 50 (15.9%) | 9 (2.1%) |
| 75 Years and over | 29 (14.5%) | 72 (15.2%) |
Disability Class: Vision Difficulty
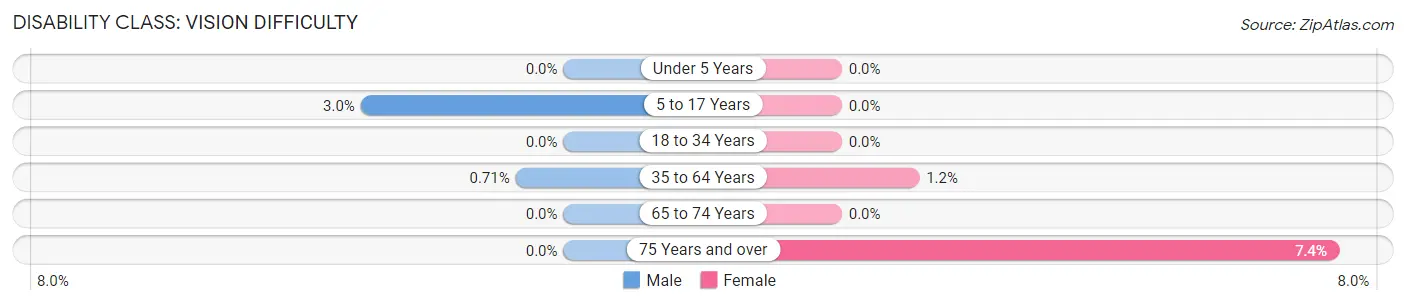
| Age Bracket | Male | Female |
| Under 5 Years | 0 (0.0%) | 0 (0.0%) |
| 5 to 17 Years | 20 (3.0%) | 0 (0.0%) |
| 18 to 34 Years | 0 (0.0%) | 0 (0.0%) |
| 35 to 64 Years | 11 (0.7%) | 18 (1.1%) |
| 65 to 74 Years | 0 (0.0%) | 0 (0.0%) |
| 75 Years and over | 0 (0.0%) | 35 (7.4%) |
Disability Class: Cognitive Difficulty
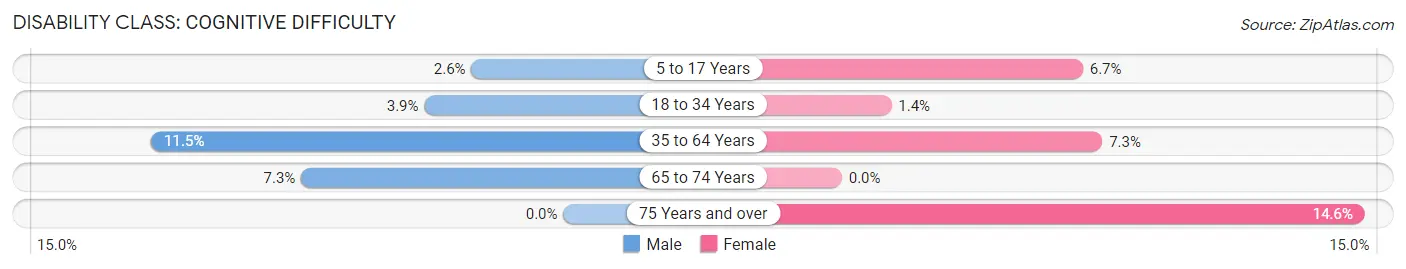
| Age Bracket | Male | Female |
| 5 to 17 Years | 17 (2.6%) | 68 (6.7%) |
| 18 to 34 Years | 27 (3.9%) | 10 (1.4%) |
| 35 to 64 Years | 178 (11.5%) | 114 (7.2%) |
| 65 to 74 Years | 23 (7.3%) | 0 (0.0%) |
| 75 Years and over | 0 (0.0%) | 69 (14.6%) |
Disability Class: Ambulatory Difficulty
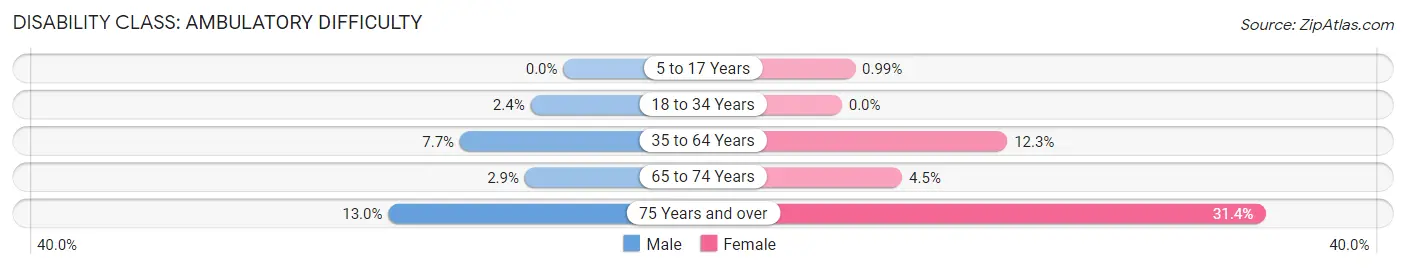
| Age Bracket | Male | Female |
| 5 to 17 Years | 0 (0.0%) | 10 (1.0%) |
| 18 to 34 Years | 17 (2.4%) | 0 (0.0%) |
| 35 to 64 Years | 119 (7.7%) | 193 (12.3%) |
| 65 to 74 Years | 9 (2.9%) | 19 (4.5%) |
| 75 Years and over | 26 (13.0%) | 149 (31.4%) |
Disability Class: Self-Care Difficulty
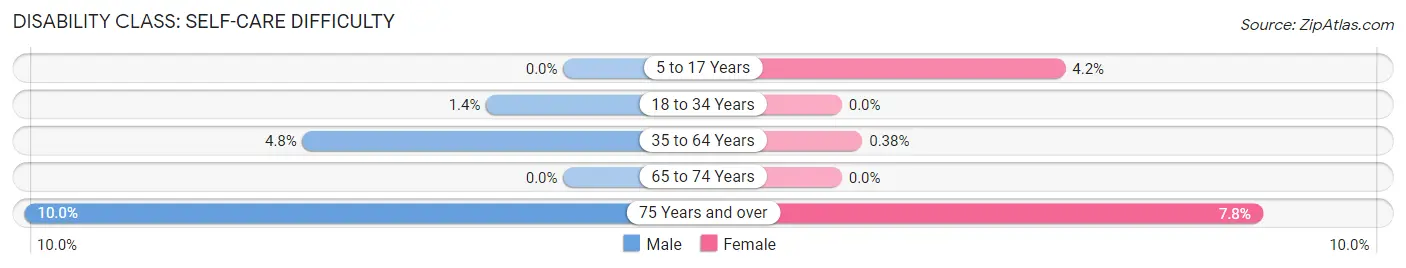
| Age Bracket | Male | Female |
| 5 to 17 Years | 0 (0.0%) | 42 (4.2%) |
| 18 to 34 Years | 10 (1.4%) | 0 (0.0%) |
| 35 to 64 Years | 75 (4.8%) | 6 (0.4%) |
| 65 to 74 Years | 0 (0.0%) | 0 (0.0%) |
| 75 Years and over | 20 (10.0%) | 37 (7.8%) |
Technology Access in Shelby
Computing Device Access in Shelby
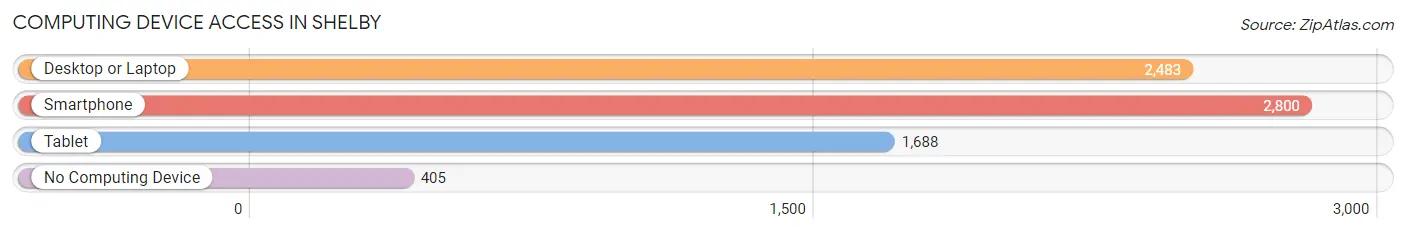
| Device Type | # Households | % Households |
| Desktop or Laptop | 2,483 | 71.3% |
| Smartphone | 2,800 | 80.4% |
| Tablet | 1,688 | 48.5% |
| No Computing Device | 405 | 11.6% |
| Total | 3,483 | 100.0% |
Internet Access in Shelby
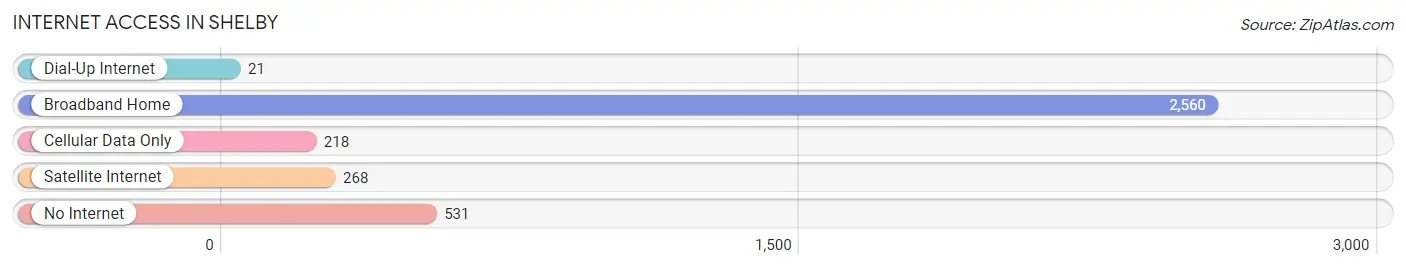
| Internet Type | # Households | % Households |
| Dial-Up Internet | 21 | 0.6% |
| Broadband Home | 2,560 | 73.5% |
| Cellular Data Only | 218 | 6.3% |
| Satellite Internet | 268 | 7.7% |
| No Internet | 531 | 15.2% |
| Total | 3,483 | 100.0% |
Shelby Summary
Shelby, Ohio is a small city located in Richland County, Ohio. It is situated in the north-central part of the state, approximately 60 miles north of Columbus. The city has a population of 8,717 people, according to the 2010 census.
History
Shelby was founded in 1817 by a group of settlers from Pennsylvania. The city was named after the nearby Shelby Creek, which was named after Isaac Shelby, the first governor of Kentucky. The city was incorporated in 1837 and was the county seat of Richland County until 1846.
In the late 19th century, Shelby was a major center for the production of agricultural products, such as wheat, corn, and oats. The city was also home to several manufacturing companies, including the Shelby Iron Works, which produced iron products for the railroad industry.
Geography
Shelby is located in north-central Ohio, approximately 60 miles north of Columbus. The city is situated in the western part of Richland County, near the border with Morrow County. The city is located on the banks of the Black Fork Mohican River, which flows through the city.
The city has a total area of 4.2 square miles, of which 4.1 square miles is land and 0.1 square miles is water. The city is located in the humid continental climate zone, with hot summers and cold winters.
Economy
Shelby’s economy is largely based on manufacturing and agriculture. The city is home to several manufacturing companies, including the Shelby Iron Works, which produces iron products for the railroad industry. The city is also home to several agricultural businesses, including a large dairy farm and several grain elevators.
The city is also home to several retail businesses, including several restaurants, grocery stores, and clothing stores. The city is also home to several medical facilities, including a hospital and several clinics.
Demographics
According to the 2010 census, Shelby has a population of 8,717 people. The city has a median household income of $37,945 and a median family income of $45,945. The city has a poverty rate of 17.3%, which is higher than the national average.
The city is predominantly white, with a population that is 94.3% white, 2.2% African American, 0.7% Asian, and 0.6% Hispanic or Latino. The city is also home to a small Native American population, with 0.2% of the population identifying as Native American.
Conclusion
Shelby, Ohio is a small city located in Richland County, Ohio. It is situated in the north-central part of the state, approximately 60 miles north of Columbus. The city has a population of 8,717 people, according to the 2010 census. The city’s economy is largely based on manufacturing and agriculture, and the city is home to several retail businesses, medical facilities, and agricultural businesses. The city is predominantly white, with a population that is 94.3% white, 2.2% African American, 0.7% Asian, and 0.6% Hispanic or Latino.
Common Questions
What is Per Capita Income in Shelby?
Per Capita income in Shelby is $26,447.
What is the Median Family Income in Shelby?
Median Family Income in Shelby is $75,425.
What is the Median Household income in Shelby?
Median Household Income in Shelby is $55,355.
What is Income or Wage Gap in Shelby?
Income or Wage Gap in Shelby is 51.1%.
Women in Shelby earn 48.9 cents for every dollar earned by a man.
What is Family Income Deficit in Shelby?
Family Income Deficit in Shelby is $9,358.
Families that are below poverty line in Shelby earn $9,358 less on average than the poverty threshold level.
What is Inequality or Gini Index in Shelby?
Inequality or Gini Index in Shelby is 0.40.
What is the Total Population of Shelby?
Total Population of Shelby is 8,360.
What is the Total Male Population of Shelby?
Total Male Population of Shelby is 3,713.
What is the Total Female Population of Shelby?
Total Female Population of Shelby is 4,647.
What is the Ratio of Males per 100 Females in Shelby?
There are 79.90 Males per 100 Females in Shelby.
What is the Ratio of Females per 100 Males in Shelby?
There are 125.15 Females per 100 Males in Shelby.
What is the Median Population Age in Shelby?
Median Population Age in Shelby is 40.8 Years.
What is the Average Family Size in Shelby
Average Family Size in Shelby is 3.0 People.
What is the Average Household Size in Shelby
Average Household Size in Shelby is 2.4 People.
How Large is the Labor Force in Shelby?
There are 3,825 People in the Labor Forcein in Shelby.
What is the Percentage of People in the Labor Force in Shelby?
59.4% of People are in the Labor Force in Shelby.
What is the Unemployment Rate in Shelby?
Unemployment Rate in Shelby is 3.2%.