Sheffield Lake, OH Map & Demographics
Sheffield Lake Map
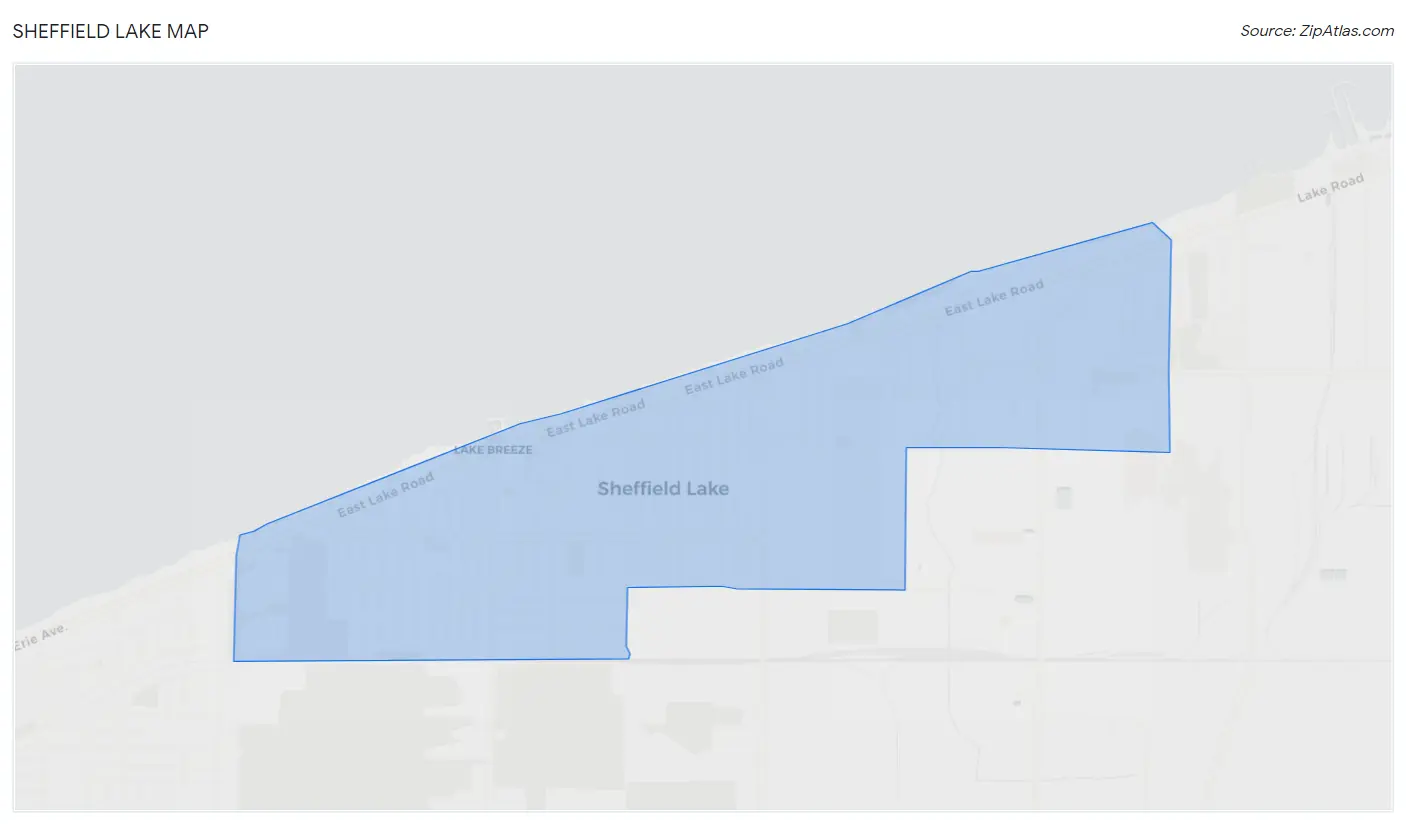
Sheffield Lake Overview
$37,181
PER CAPITA INCOME
$78,520
AVG FAMILY INCOME
$61,699
AVG HOUSEHOLD INCOME
24.4%
WAGE / INCOME GAP [ % ]
75.6¢/ $1
WAGE / INCOME GAP [ $ ]
$13,445
FAMILY INCOME DEFICIT
0.40
INEQUALITY / GINI INDEX
8,958
TOTAL POPULATION
4,257
MALE POPULATION
4,701
FEMALE POPULATION
90.56
MALES / 100 FEMALES
110.43
FEMALES / 100 MALES
44.8
MEDIAN AGE
2.8
AVG FAMILY SIZE
2.2
AVG HOUSEHOLD SIZE
5,035
LABOR FORCE [ PEOPLE ]
66.1%
PERCENT IN LABOR FORCE
3.2%
UNEMPLOYMENT RATE
Sheffield Lake Zip Codes
Sheffield Lake Area Codes
Income in Sheffield Lake
Income Overview in Sheffield Lake
Per Capita Income in Sheffield Lake is $37,181, while median incomes of families and households are $78,520 and $61,699 respectively.
| Characteristic | Number | Measure |
| Per Capita Income | 8,958 | $37,181 |
| Median Family Income | 2,295 | $78,520 |
| Mean Family Income | 2,295 | $87,085 |
| Median Household Income | 4,147 | $61,699 |
| Mean Household Income | 4,147 | $79,819 |
| Income Deficit | 2,295 | $13,445 |
| Wage / Income Gap (%) | 8,958 | 24.45% |
| Wage / Income Gap ($) | 8,958 | 75.55¢ per $1 |
| Gini / Inequality Index | 8,958 | 0.40 |
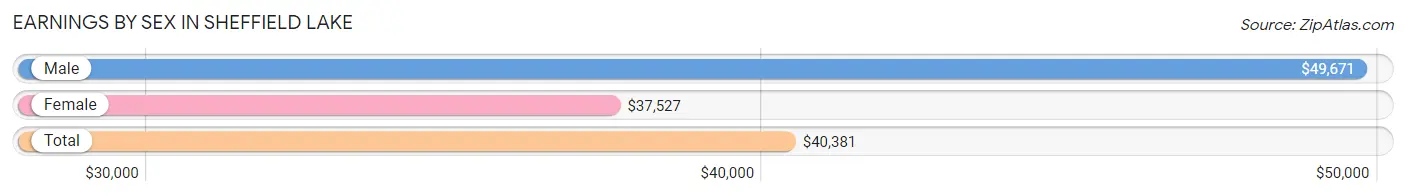
Earnings by Sex in Sheffield Lake
Average Earnings in Sheffield Lake are $40,381, $49,671 for men and $37,527 for women, a difference of 24.4%.
| Sex | Number | Average Earnings |
| Male | 2,435 (47.2%) | $49,671 |
| Female | 2,726 (52.8%) | $37,527 |
| Total | 5,161 (100.0%) | $40,381 |
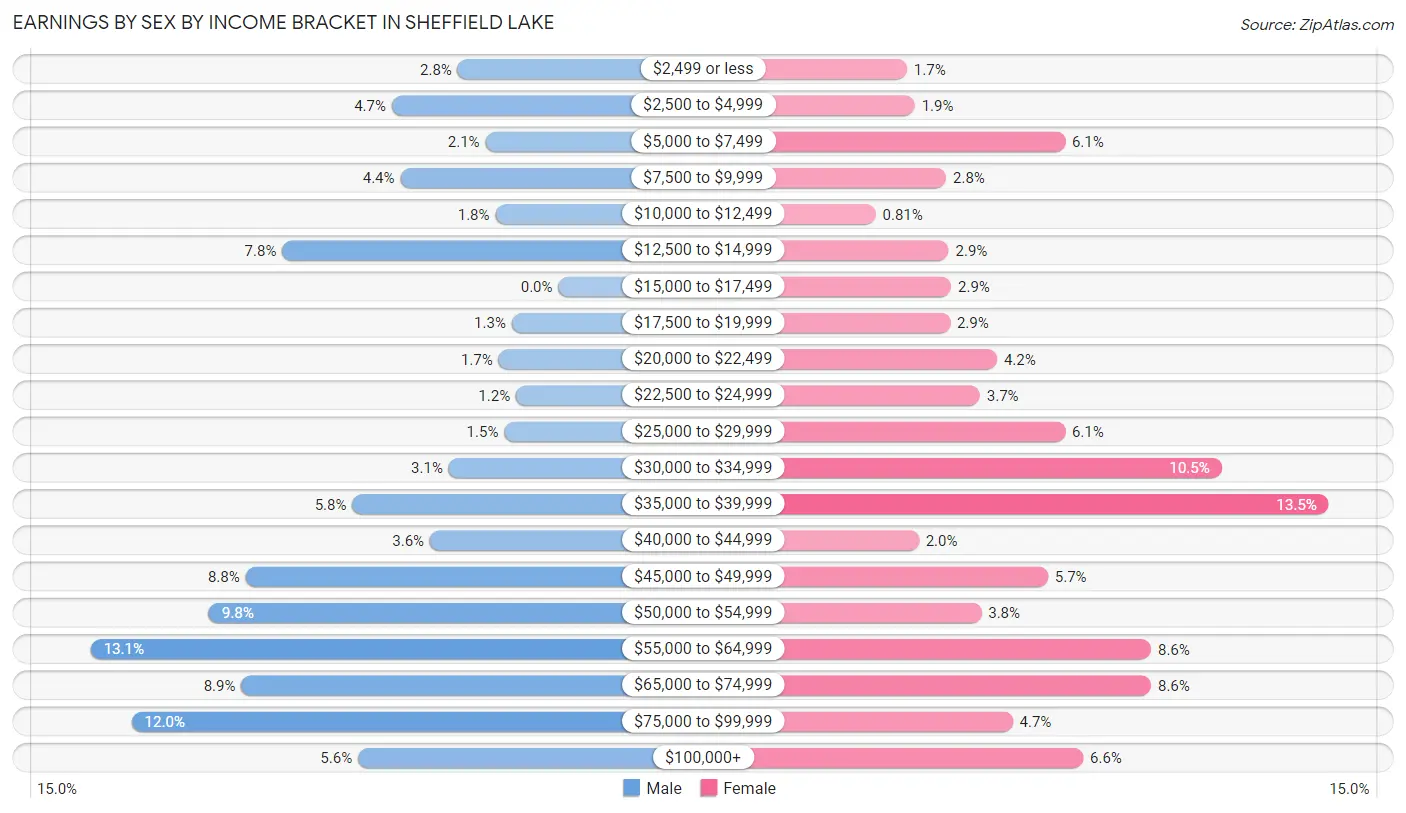
Earnings by Sex by Income Bracket in Sheffield Lake
The most common earnings brackets in Sheffield Lake are $55,000 to $64,999 for men (320 | 13.1%) and $35,000 to $39,999 for women (369 | 13.5%).
| Income | Male | Female |
| $2,499 or less | 69 (2.8%) | 46 (1.7%) |
| $2,500 to $4,999 | 114 (4.7%) | 52 (1.9%) |
| $5,000 to $7,499 | 50 (2.1%) | 167 (6.1%) |
| $7,500 to $9,999 | 108 (4.4%) | 76 (2.8%) |
| $10,000 to $12,499 | 43 (1.8%) | 22 (0.8%) |
| $12,500 to $14,999 | 189 (7.8%) | 78 (2.9%) |
| $15,000 to $17,499 | 0 (0.0%) | 80 (2.9%) |
| $17,500 to $19,999 | 32 (1.3%) | 79 (2.9%) |
| $20,000 to $22,499 | 41 (1.7%) | 115 (4.2%) |
| $22,500 to $24,999 | 29 (1.2%) | 102 (3.7%) |
| $25,000 to $29,999 | 37 (1.5%) | 167 (6.1%) |
| $30,000 to $34,999 | 75 (3.1%) | 287 (10.5%) |
| $35,000 to $39,999 | 141 (5.8%) | 369 (13.5%) |
| $40,000 to $44,999 | 88 (3.6%) | 55 (2.0%) |
| $45,000 to $49,999 | 214 (8.8%) | 154 (5.7%) |
| $50,000 to $54,999 | 239 (9.8%) | 103 (3.8%) |
| $55,000 to $64,999 | 320 (13.1%) | 233 (8.6%) |
| $65,000 to $74,999 | 217 (8.9%) | 233 (8.6%) |
| $75,000 to $99,999 | 292 (12.0%) | 127 (4.7%) |
| $100,000+ | 137 (5.6%) | 181 (6.6%) |
| Total | 2,435 (100.0%) | 2,726 (100.0%) |
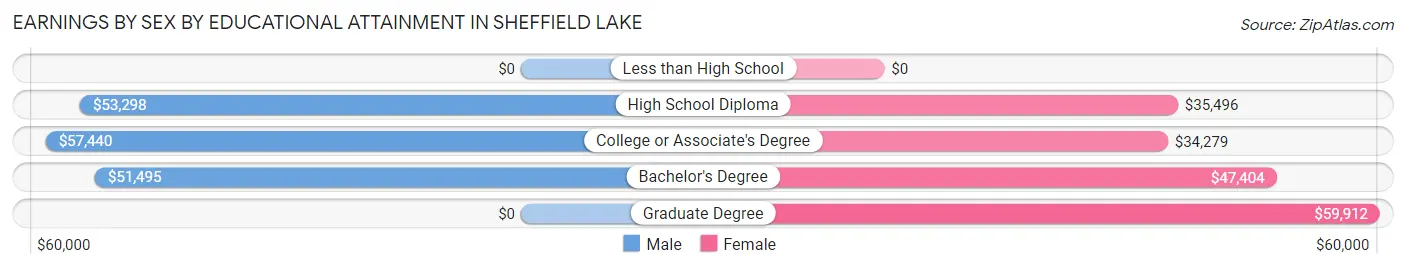
Earnings by Sex by Educational Attainment in Sheffield Lake
Average earnings in Sheffield Lake are $53,502 for men and $38,607 for women, a difference of 27.8%. Men with an educational attainment of college or associate's degree enjoy the highest average annual earnings of $57,440, while those with bachelor's degree education earn the least with $51,495. Women with an educational attainment of graduate degree earn the most with the average annual earnings of $59,912, while those with college or associate's degree education have the smallest earnings of $34,279.
| Educational Attainment | Male Income | Female Income |
| Less than High School | - | - |
| High School Diploma | $53,298 | $35,496 |
| College or Associate's Degree | $57,440 | $34,279 |
| Bachelor's Degree | $51,495 | $47,404 |
| Graduate Degree | - | - |
| Total | $53,502 | $38,607 |
Family Income in Sheffield Lake
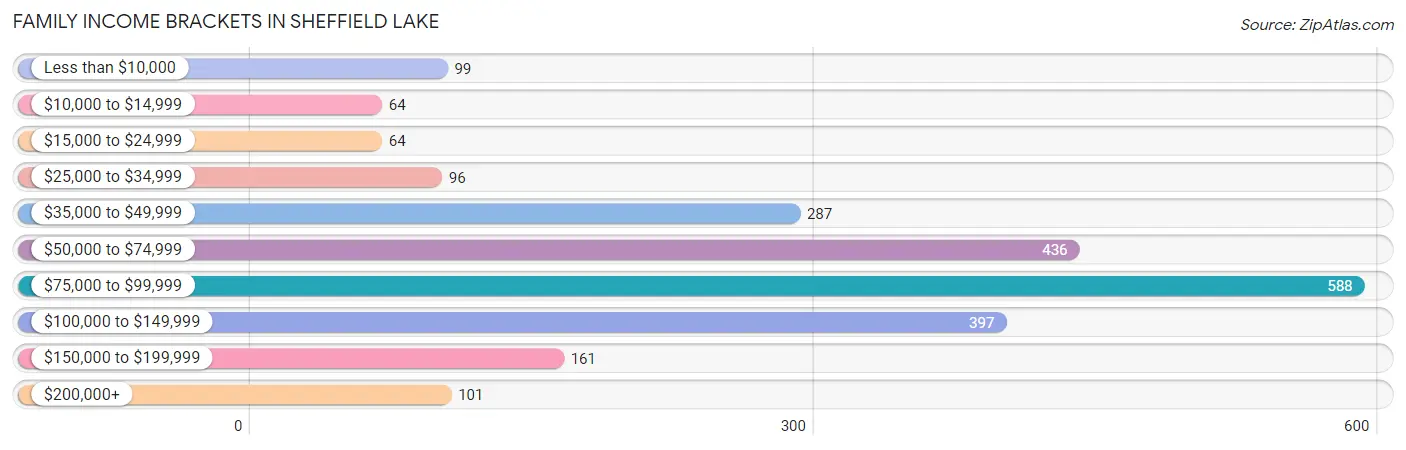
Family Income Brackets in Sheffield Lake
According to the Sheffield Lake family income data, there are 588 families falling into the $75,000 to $99,999 income range, which is the most common income bracket and makes up 25.6% of all families. Conversely, the $10,000 to $14,999 income bracket is the least frequent group with only 64 families (2.8%) belonging to this category.
| Income Bracket | # Families | % Families |
| Less than $10,000 | 99 | 4.3% |
| $10,000 to $14,999 | 64 | 2.8% |
| $15,000 to $24,999 | 64 | 2.8% |
| $25,000 to $34,999 | 96 | 4.2% |
| $35,000 to $49,999 | 287 | 12.5% |
| $50,000 to $74,999 | 436 | 19.0% |
| $75,000 to $99,999 | 588 | 25.6% |
| $100,000 to $149,999 | 397 | 17.3% |
| $150,000 to $199,999 | 161 | 7.0% |
| $200,000+ | 101 | 4.4% |
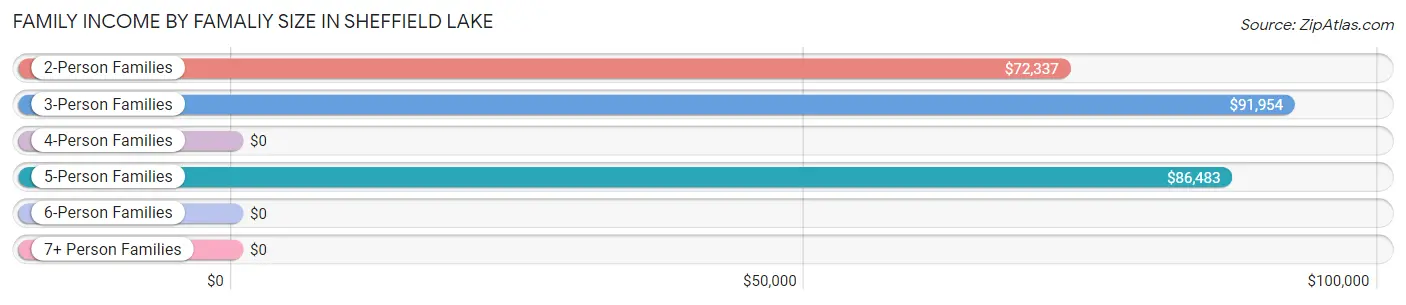
Family Income by Famaliy Size in Sheffield Lake
3-person families (452 | 19.7%) account for the highest median family income in Sheffield Lake with $91,954 per family, while 2-person families (1,381 | 60.2%) have the highest median income of $36,168 per family member.
| Income Bracket | # Families | Median Income |
| 2-Person Families | 1,381 (60.2%) | $72,337 |
| 3-Person Families | 452 (19.7%) | $91,954 |
| 4-Person Families | 304 (13.3%) | $0 |
| 5-Person Families | 117 (5.1%) | $86,483 |
| 6-Person Families | 28 (1.2%) | $0 |
| 7+ Person Families | 13 (0.6%) | $0 |
| Total | 2,295 (100.0%) | $78,520 |
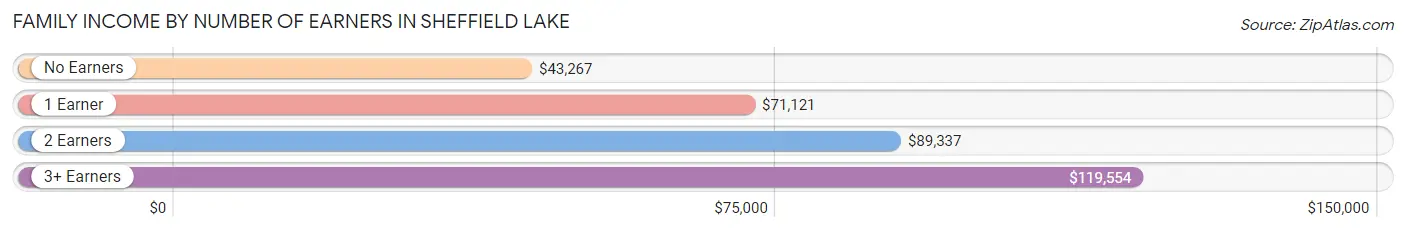
Family Income by Number of Earners in Sheffield Lake
The median family income in Sheffield Lake is $78,520, with families comprising 3+ earners (335) having the highest median family income of $119,554, while families with no earners (450) have the lowest median family income of $43,267, accounting for 14.6% and 19.6% of families, respectively.
| Number of Earners | # Families | Median Income |
| No Earners | 450 (19.6%) | $43,267 |
| 1 Earner | 698 (30.4%) | $71,121 |
| 2 Earners | 812 (35.4%) | $89,337 |
| 3+ Earners | 335 (14.6%) | $119,554 |
| Total | 2,295 (100.0%) | $78,520 |
Household Income in Sheffield Lake
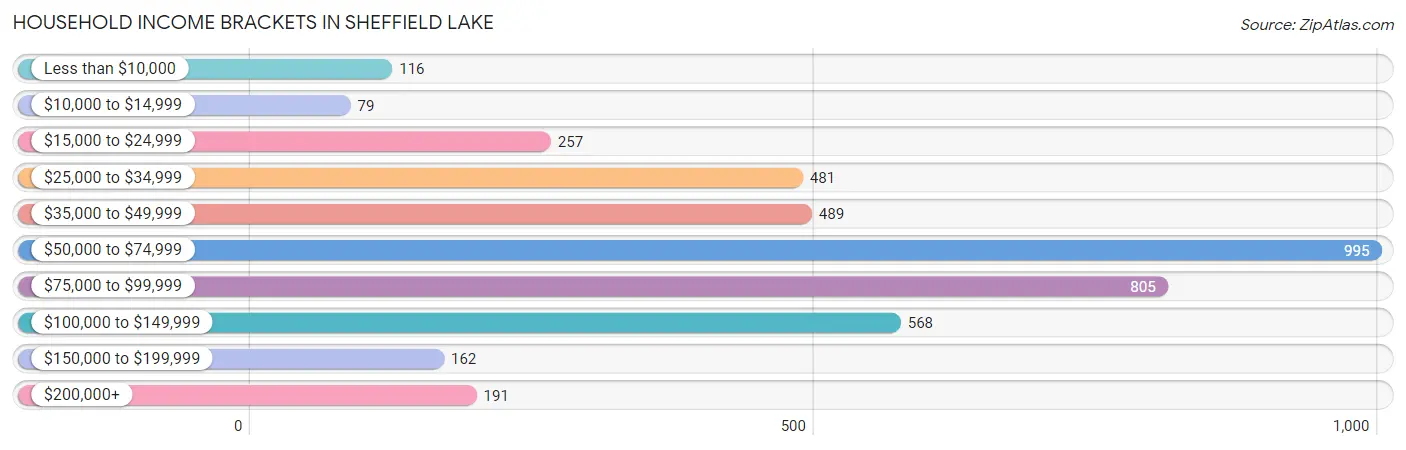
Household Income Brackets in Sheffield Lake
With 995 households falling in the category, the $50,000 to $74,999 income range is the most frequent in Sheffield Lake, accounting for 24.0% of all households. In contrast, only 79 households (1.9%) fall into the $10,000 to $14,999 income bracket, making it the least populous group.
| Income Bracket | # Households | % Households |
| Less than $10,000 | 116 | 2.8% |
| $10,000 to $14,999 | 79 | 1.9% |
| $15,000 to $24,999 | 257 | 6.2% |
| $25,000 to $34,999 | 481 | 11.6% |
| $35,000 to $49,999 | 489 | 11.8% |
| $50,000 to $74,999 | 995 | 24.0% |
| $75,000 to $99,999 | 805 | 19.4% |
| $100,000 to $149,999 | 568 | 13.7% |
| $150,000 to $199,999 | 162 | 3.9% |
| $200,000+ | 191 | 4.6% |
Household Income by Householder Age in Sheffield Lake
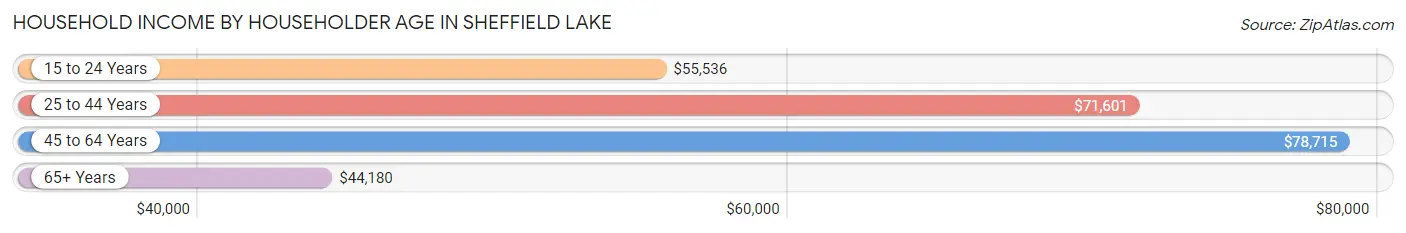
The median household income in Sheffield Lake is $61,699, with the highest median household income of $78,715 found in the 45 to 64 years age bracket for the primary householder. A total of 1,539 households (37.1%) fall into this category. Meanwhile, the 65+ years age bracket for the primary householder has the lowest median household income of $44,180, with 1,242 households (29.9%) in this group.
| Income Bracket | # Households | Median Income |
| 15 to 24 Years | 69 (1.7%) | $55,536 |
| 25 to 44 Years | 1,297 (31.3%) | $71,601 |
| 45 to 64 Years | 1,539 (37.1%) | $78,715 |
| 65+ Years | 1,242 (29.9%) | $44,180 |
| Total | 4,147 (100.0%) | $61,699 |
Poverty in Sheffield Lake
Income Below Poverty by Sex and Age in Sheffield Lake
With 9.8% poverty level for males and 14.0% for females among the residents of Sheffield Lake, 5 year old males and 16 and 17 year old females are the most vulnerable to poverty, with 30 males (81.1%) and 61 females (58.7%) in their respective age groups living below the poverty level.
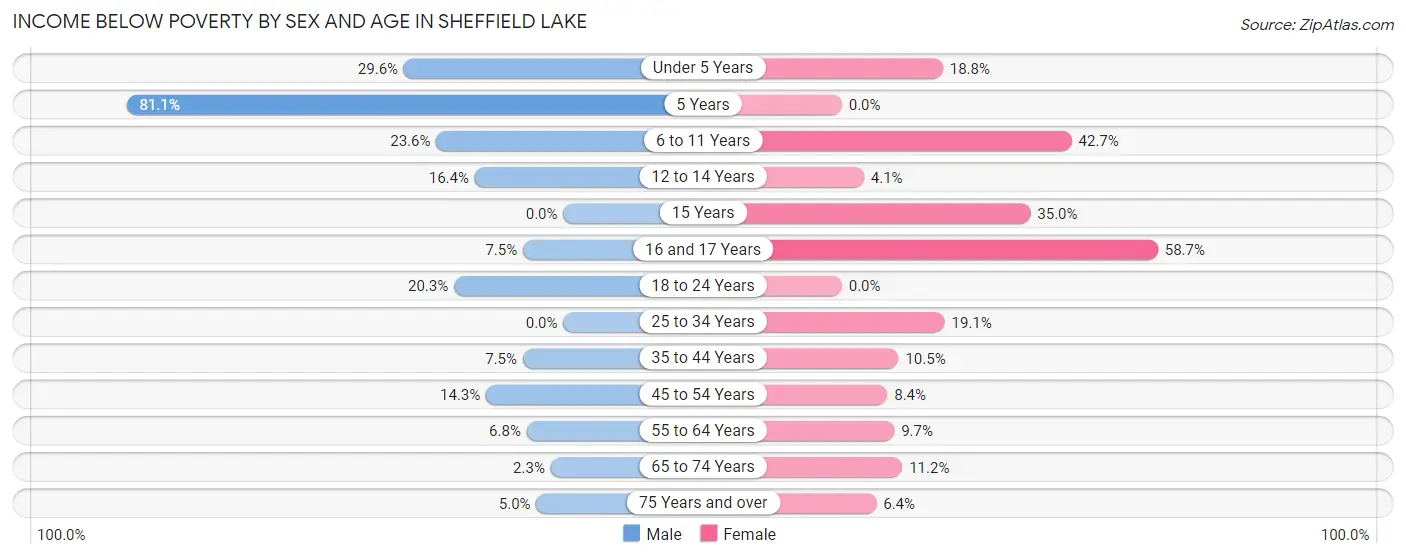
| Age Bracket | Male | Female |
| Under 5 Years | 37 (29.6%) | 39 (18.8%) |
| 5 Years | 30 (81.1%) | 0 (0.0%) |
| 6 to 11 Years | 54 (23.6%) | 122 (42.7%) |
| 12 to 14 Years | 23 (16.4%) | 8 (4.1%) |
| 15 Years | 0 (0.0%) | 14 (35.0%) |
| 16 and 17 Years | 11 (7.5%) | 61 (58.7%) |
| 18 to 24 Years | 69 (20.3%) | 0 (0.0%) |
| 25 to 34 Years | 0 (0.0%) | 124 (19.1%) |
| 35 to 44 Years | 35 (7.5%) | 69 (10.5%) |
| 45 to 54 Years | 75 (14.3%) | 38 (8.4%) |
| 55 to 64 Years | 63 (6.8%) | 75 (9.7%) |
| 65 to 74 Years | 14 (2.3%) | 80 (11.2%) |
| 75 Years and over | 7 (5.0%) | 21 (6.4%) |
| Total | 418 (9.8%) | 651 (14.0%) |
Income Above Poverty by Sex and Age in Sheffield Lake
According to the poverty statistics in Sheffield Lake, males aged 15 years and females aged 5 years are the age groups that are most secure financially, with 100.0% of males and 100.0% of females in these age groups living above the poverty line.
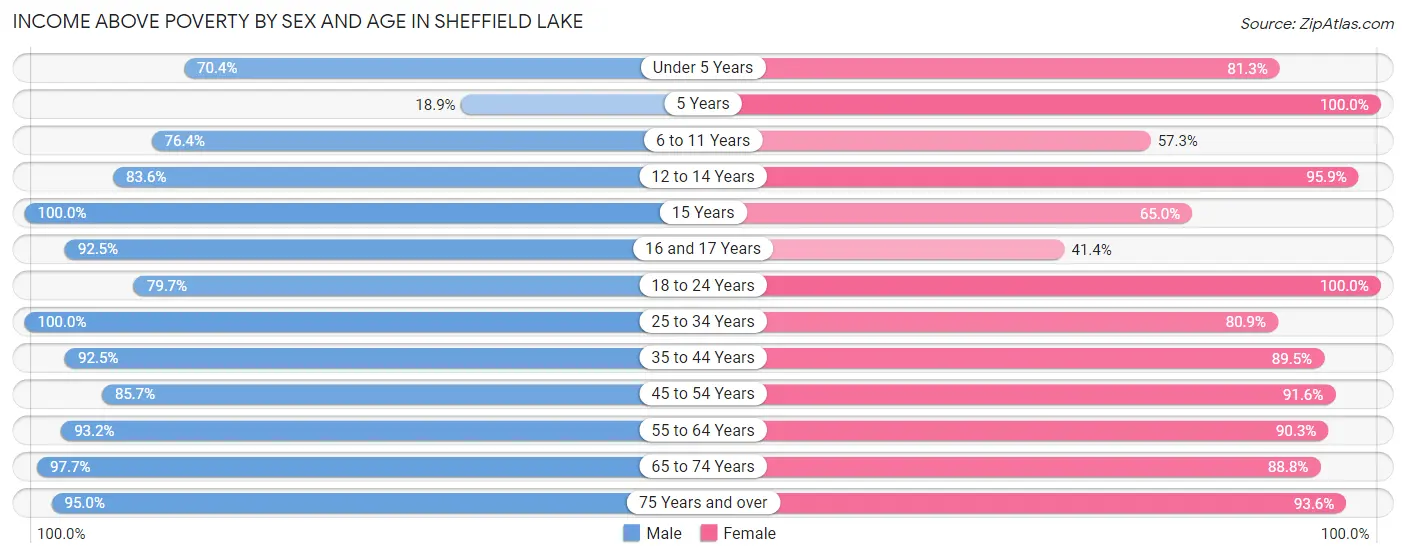
| Age Bracket | Male | Female |
| Under 5 Years | 88 (70.4%) | 169 (81.2%) |
| 5 Years | 7 (18.9%) | 14 (100.0%) |
| 6 to 11 Years | 175 (76.4%) | 164 (57.3%) |
| 12 to 14 Years | 117 (83.6%) | 187 (95.9%) |
| 15 Years | 28 (100.0%) | 26 (65.0%) |
| 16 and 17 Years | 136 (92.5%) | 43 (41.3%) |
| 18 to 24 Years | 271 (79.7%) | 247 (100.0%) |
| 25 to 34 Years | 557 (100.0%) | 526 (80.9%) |
| 35 to 44 Years | 430 (92.5%) | 587 (89.5%) |
| 45 to 54 Years | 448 (85.7%) | 412 (91.6%) |
| 55 to 64 Years | 864 (93.2%) | 696 (90.3%) |
| 65 to 74 Years | 585 (97.7%) | 633 (88.8%) |
| 75 Years and over | 133 (95.0%) | 307 (93.6%) |
| Total | 3,839 (90.2%) | 4,011 (86.0%) |
Income Below Poverty Among Married-Couple Families in Sheffield Lake
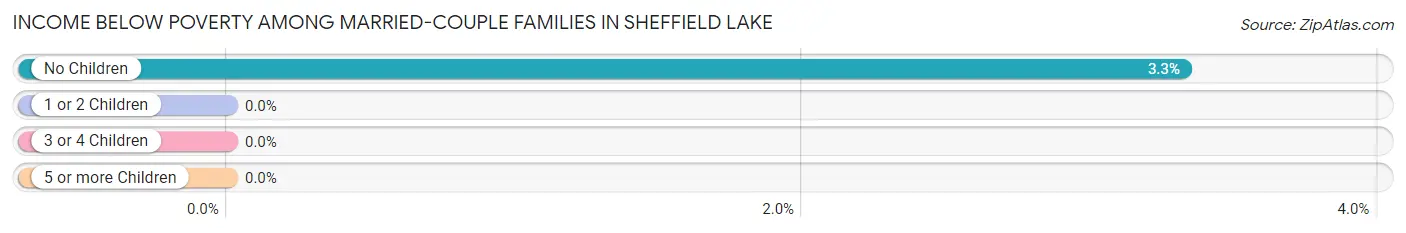
The poverty statistics for married-couple families in Sheffield Lake show that 2.6% or 45 of the total 1,726 families live below the poverty line. Families with no children have the highest poverty rate of 3.3%, comprising of 45 families. On the other hand, families with 1 or 2 children have the lowest poverty rate of 0.0%, which includes 0 families.
| Children | Above Poverty | Below Poverty |
| No Children | 1,310 (96.7%) | 45 (3.3%) |
| 1 or 2 Children | 317 (100.0%) | 0 (0.0%) |
| 3 or 4 Children | 54 (100.0%) | 0 (0.0%) |
| 5 or more Children | 0 (0.0%) | 0 (0.0%) |
| Total | 1,681 (97.4%) | 45 (2.6%) |
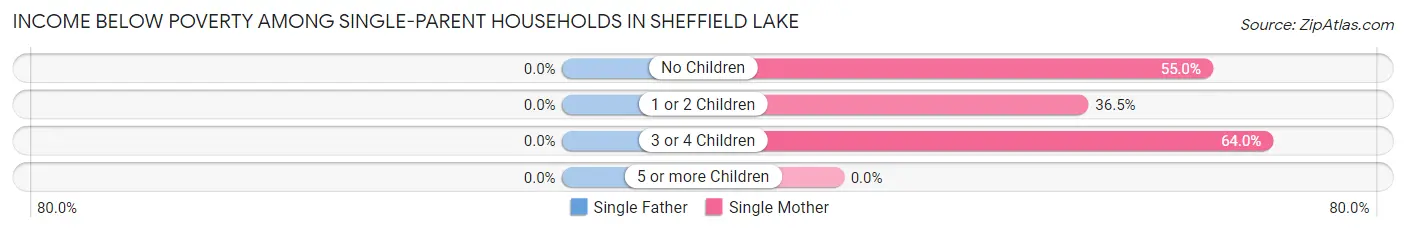
Income Below Poverty Among Single-Parent Households in Sheffield Lake
| Children | Single Father | Single Mother |
| No Children | 0 (0.0%) | 33 (55.0%) |
| 1 or 2 Children | 0 (0.0%) | 93 (36.5%) |
| 3 or 4 Children | 0 (0.0%) | 48 (64.0%) |
| 5 or more Children | 0 (0.0%) | 0 (0.0%) |
| Total | 0 (0.0%) | 174 (42.7%) |
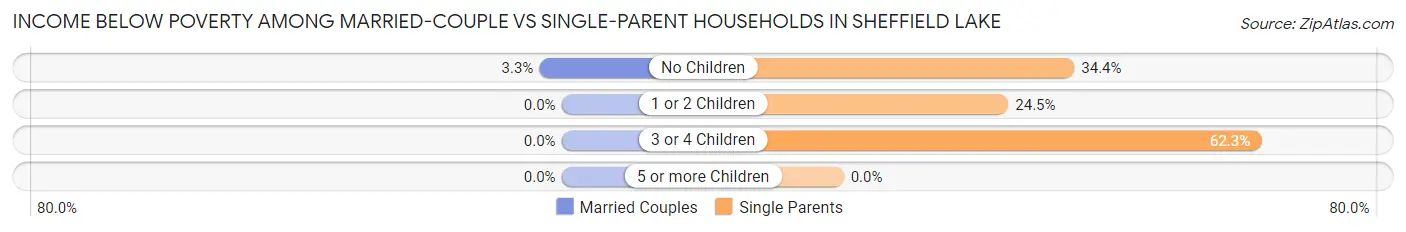
Income Below Poverty Among Married-Couple vs Single-Parent Households in Sheffield Lake
The poverty data for Sheffield Lake shows that 45 of the married-couple family households (2.6%) and 174 of the single-parent households (30.6%) are living below the poverty level. Within the married-couple family households, those with no children have the highest poverty rate, with 45 households (3.3%) falling below the poverty line. Among the single-parent households, those with 3 or 4 children have the highest poverty rate, with 48 household (62.3%) living below poverty.
| Children | Married-Couple Families | Single-Parent Households |
| No Children | 45 (3.3%) | 33 (34.4%) |
| 1 or 2 Children | 0 (0.0%) | 93 (24.5%) |
| 3 or 4 Children | 0 (0.0%) | 48 (62.3%) |
| 5 or more Children | 0 (0.0%) | 0 (0.0%) |
| Total | 45 (2.6%) | 174 (30.6%) |
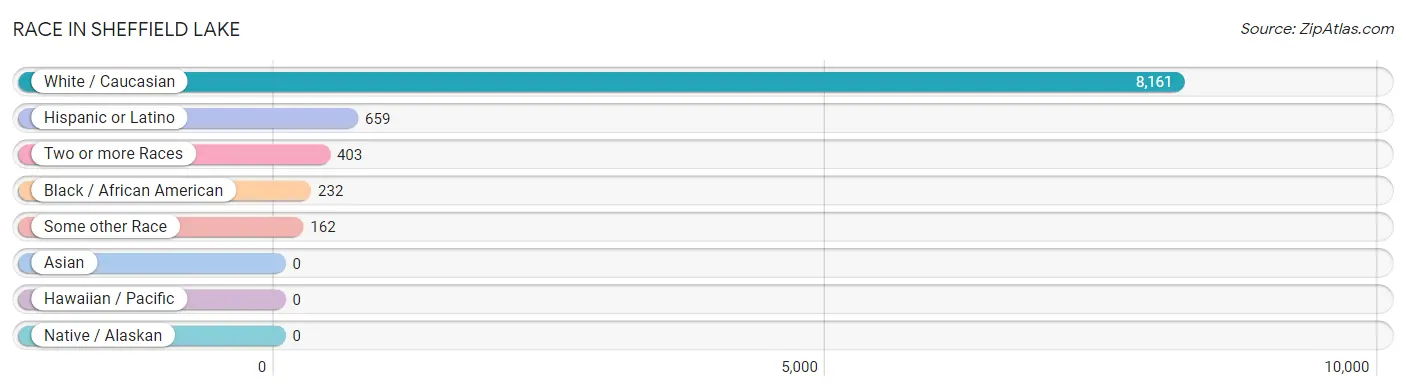
Race in Sheffield Lake
The most populous races in Sheffield Lake are White / Caucasian (8,161 | 91.1%), Hispanic or Latino (659 | 7.4%), and Two or more Races (403 | 4.5%).
| Race | # Population | % Population |
| Asian | 0 | 0.0% |
| Black / African American | 232 | 2.6% |
| Hawaiian / Pacific | 0 | 0.0% |
| Hispanic or Latino | 659 | 7.4% |
| Native / Alaskan | 0 | 0.0% |
| White / Caucasian | 8,161 | 91.1% |
| Two or more Races | 403 | 4.5% |
| Some other Race | 162 | 1.8% |
| Total | 8,958 | 100.0% |
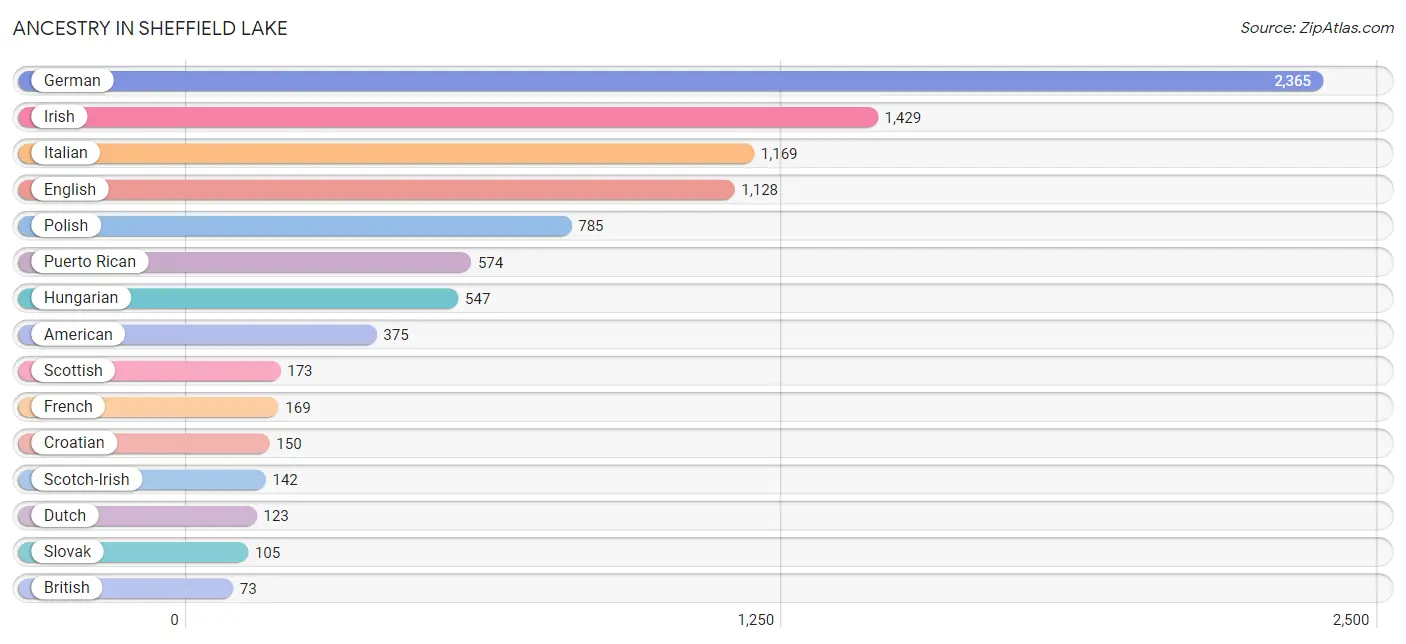
Ancestry in Sheffield Lake
The most populous ancestries reported in Sheffield Lake are German (2,365 | 26.4%), Irish (1,429 | 16.0%), Italian (1,169 | 13.1%), English (1,128 | 12.6%), and Polish (785 | 8.8%), together accounting for 76.8% of all Sheffield Lake residents.
| Ancestry | # Population | % Population |
| American | 375 | 4.2% |
| Arab | 40 | 0.4% |
| British | 73 | 0.8% |
| Canadian | 14 | 0.2% |
| Central American | 19 | 0.2% |
| Cherokee | 17 | 0.2% |
| Croatian | 150 | 1.7% |
| Crow | 10 | 0.1% |
| Czechoslovakian | 16 | 0.2% |
| Danish | 7 | 0.1% |
| Dutch | 123 | 1.4% |
| Eastern European | 38 | 0.4% |
| English | 1,128 | 12.6% |
| Ethiopian | 29 | 0.3% |
| European | 11 | 0.1% |
| Finnish | 72 | 0.8% |
| French | 169 | 1.9% |
| German | 2,365 | 26.4% |
| Hungarian | 547 | 6.1% |
| Irish | 1,429 | 16.0% |
| Italian | 1,169 | 13.1% |
| Lebanese | 35 | 0.4% |
| Lithuanian | 26 | 0.3% |
| Mexican | 58 | 0.6% |
| Northern European | 45 | 0.5% |
| Palestinian | 5 | 0.1% |
| Polish | 785 | 8.8% |
| Portuguese | 20 | 0.2% |
| Potawatomi | 10 | 0.1% |
| Puerto Rican | 574 | 6.4% |
| Romanian | 9 | 0.1% |
| Russian | 68 | 0.8% |
| Salvadoran | 19 | 0.2% |
| Scandinavian | 13 | 0.2% |
| Scotch-Irish | 142 | 1.6% |
| Scottish | 173 | 1.9% |
| Slovak | 105 | 1.2% |
| Slovene | 31 | 0.4% |
| Spanish | 8 | 0.1% |
| Subsaharan African | 29 | 0.3% |
| Swedish | 7 | 0.1% |
| Swiss | 13 | 0.2% |
| Turkish | 28 | 0.3% |
| Ukrainian | 65 | 0.7% |
| Welsh | 36 | 0.4% | View All 45 Rows |
Immigrants in Sheffield Lake
The most numerous immigrant groups reported in Sheffield Lake came from Europe (159 | 1.8%), Eastern Europe (147 | 1.6%), Russia (147 | 1.6%), Africa (29 | 0.3%), and Eastern Africa (29 | 0.3%), together accounting for 5.7% of all Sheffield Lake residents.
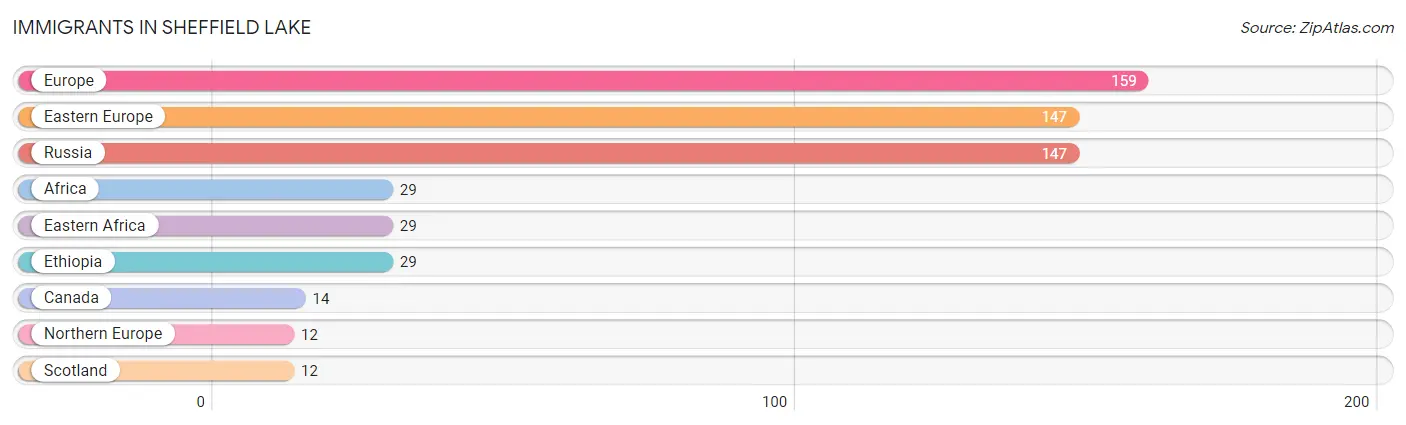
| Immigration Origin | # Population | % Population |
| Africa | 29 | 0.3% |
| Canada | 14 | 0.2% |
| Eastern Africa | 29 | 0.3% |
| Eastern Europe | 147 | 1.6% |
| Ethiopia | 29 | 0.3% |
| Europe | 159 | 1.8% |
| Northern Europe | 12 | 0.1% |
| Russia | 147 | 1.6% |
| Scotland | 12 | 0.1% | View All 9 Rows |
Sex and Age in Sheffield Lake
Sex and Age in Sheffield Lake
The most populous age groups in Sheffield Lake are 60 to 64 Years (557 | 13.1%) for men and 40 to 44 Years (495 | 10.5%) for women.
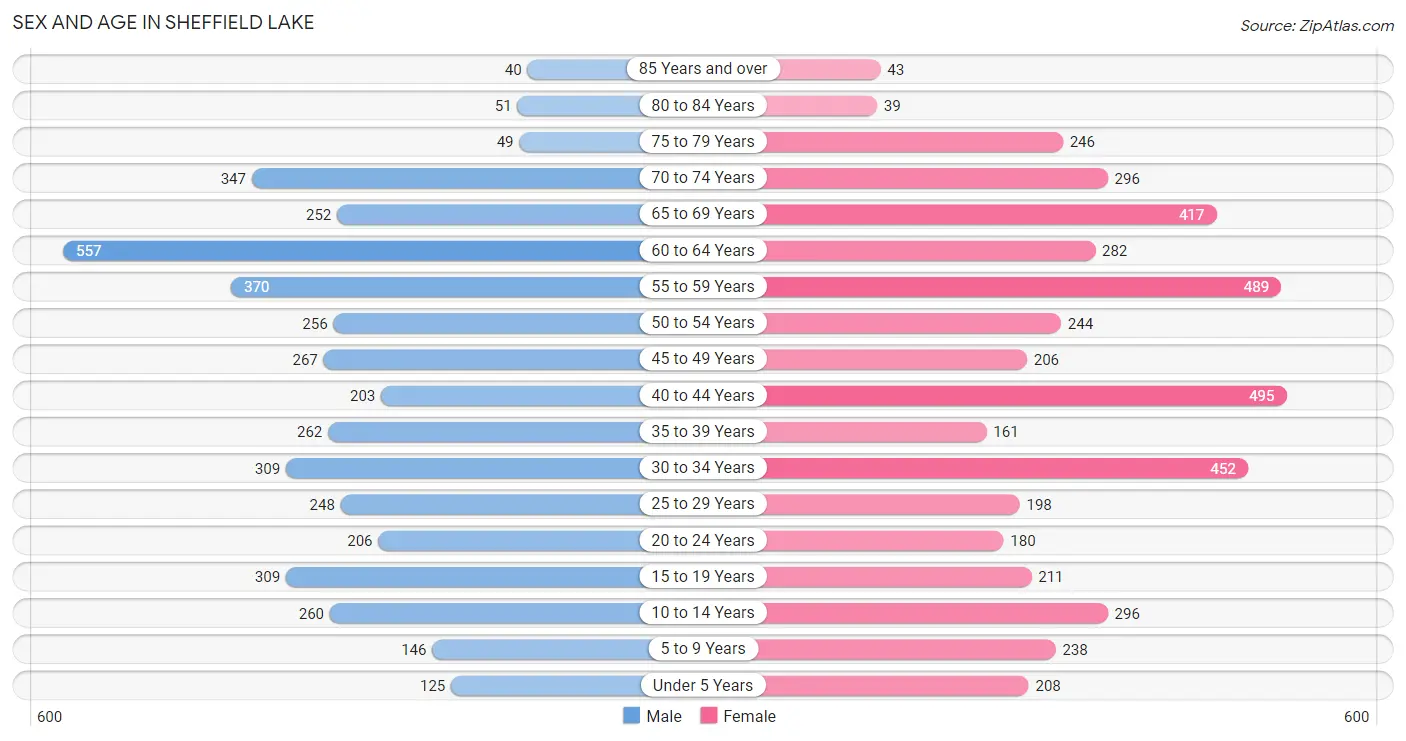
| Age Bracket | Male | Female |
| Under 5 Years | 125 (2.9%) | 208 (4.4%) |
| 5 to 9 Years | 146 (3.4%) | 238 (5.1%) |
| 10 to 14 Years | 260 (6.1%) | 296 (6.3%) |
| 15 to 19 Years | 309 (7.3%) | 211 (4.5%) |
| 20 to 24 Years | 206 (4.8%) | 180 (3.8%) |
| 25 to 29 Years | 248 (5.8%) | 198 (4.2%) |
| 30 to 34 Years | 309 (7.3%) | 452 (9.6%) |
| 35 to 39 Years | 262 (6.1%) | 161 (3.4%) |
| 40 to 44 Years | 203 (4.8%) | 495 (10.5%) |
| 45 to 49 Years | 267 (6.3%) | 206 (4.4%) |
| 50 to 54 Years | 256 (6.0%) | 244 (5.2%) |
| 55 to 59 Years | 370 (8.7%) | 489 (10.4%) |
| 60 to 64 Years | 557 (13.1%) | 282 (6.0%) |
| 65 to 69 Years | 252 (5.9%) | 417 (8.9%) |
| 70 to 74 Years | 347 (8.2%) | 296 (6.3%) |
| 75 to 79 Years | 49 (1.1%) | 246 (5.2%) |
| 80 to 84 Years | 51 (1.2%) | 39 (0.8%) |
| 85 Years and over | 40 (0.9%) | 43 (0.9%) |
| Total | 4,257 (100.0%) | 4,701 (100.0%) |
Families and Households in Sheffield Lake
Median Family Size in Sheffield Lake
The median family size in Sheffield Lake is 2.79 persons per family, with single female/mother families (407 | 17.7%) accounting for the largest median family size of 3.85 persons per family. On the other hand, married-couple families (1,726 | 75.2%) represent the smallest median family size with 2.56 persons per family.
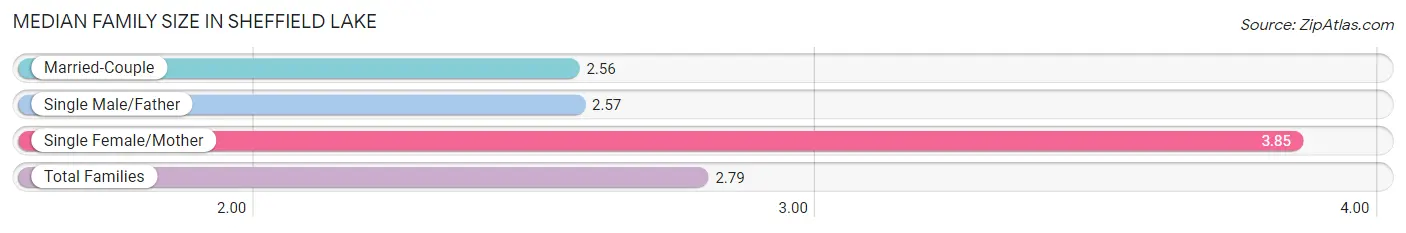
| Family Type | # Families | Family Size |
| Married-Couple | 1,726 (75.2%) | 2.56 |
| Single Male/Father | 162 (7.1%) | 2.57 |
| Single Female/Mother | 407 (17.7%) | 3.85 |
| Total Families | 2,295 (100.0%) | 2.79 |
Median Household Size in Sheffield Lake
The median household size in Sheffield Lake is 2.16 persons per household, with single female/mother households (407 | 9.8%) accounting for the largest median household size of 4.12 persons per household. non-family households (1,852 | 44.7%) represent the smallest median household size with 1.22 persons per household.
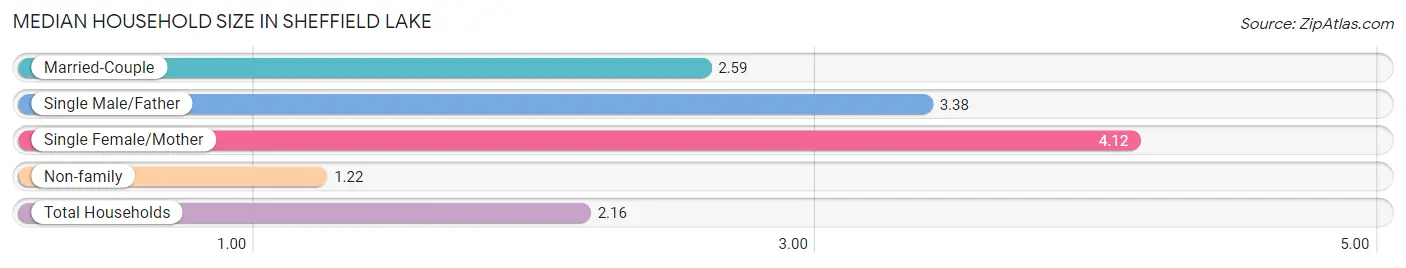
| Household Type | # Households | Household Size |
| Married-Couple | 1,726 (41.6%) | 2.59 |
| Single Male/Father | 162 (3.9%) | 3.38 |
| Single Female/Mother | 407 (9.8%) | 4.12 |
| Non-family | 1,852 (44.7%) | 1.22 |
| Total Households | 4,147 (100.0%) | 2.16 |
Household Size by Marriage Status in Sheffield Lake
Out of a total of 4,147 households in Sheffield Lake, 2,295 (55.3%) are family households, while 1,852 (44.7%) are nonfamily households. The most numerous type of family households are 2-person households, comprising 1,267, and the most common type of nonfamily households are 1-person households, comprising 1,544.
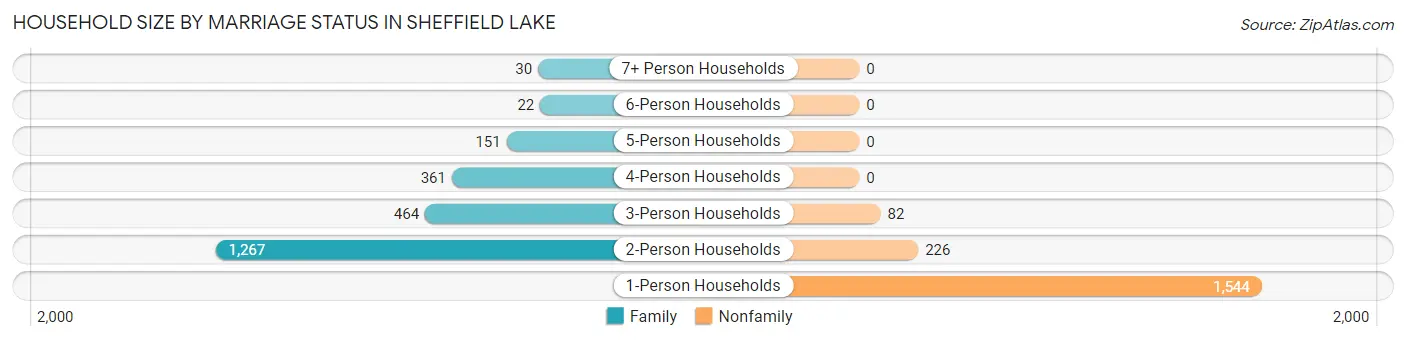
| Household Size | Family Households | Nonfamily Households |
| 1-Person Households | - | 1,544 (37.2%) |
| 2-Person Households | 1,267 (30.5%) | 226 (5.4%) |
| 3-Person Households | 464 (11.2%) | 82 (2.0%) |
| 4-Person Households | 361 (8.7%) | 0 (0.0%) |
| 5-Person Households | 151 (3.6%) | 0 (0.0%) |
| 6-Person Households | 22 (0.5%) | 0 (0.0%) |
| 7+ Person Households | 30 (0.7%) | 0 (0.0%) |
| Total | 2,295 (55.3%) | 1,852 (44.7%) |
Female Fertility in Sheffield Lake
Fertility by Age in Sheffield Lake
Average fertility rate in Sheffield Lake is 31.0 births per 1,000 women. Women in the age bracket of 20 to 34 years have the highest fertility rate with 63.0 births per 1,000 women. Women in the age bracket of 20 to 34 years acount for 86.7% of all women with births.
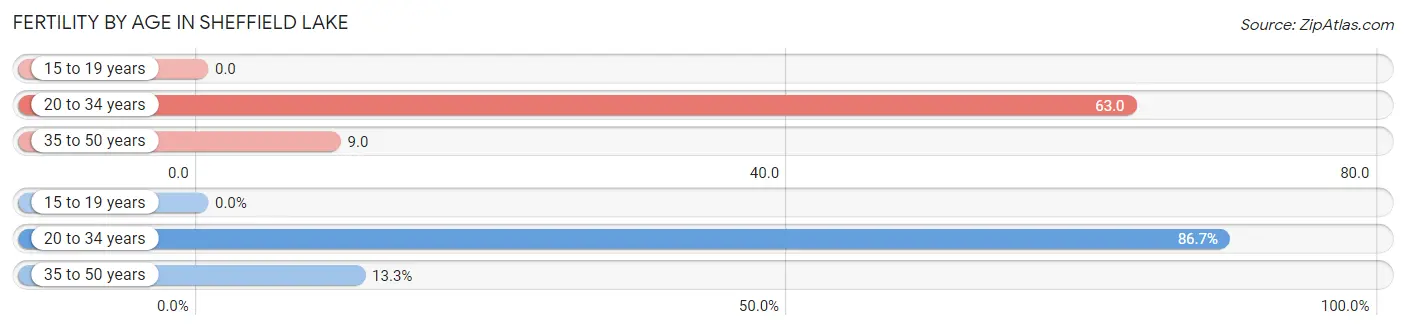
| Age Bracket | Women with Births | Births / 1,000 Women |
| 15 to 19 years | 0 (0.0%) | 0.0 |
| 20 to 34 years | 52 (86.7%) | 63.0 |
| 35 to 50 years | 8 (13.3%) | 9.0 |
| Total | 60 (100.0%) | 31.0 |
Fertility by Age by Marriage Status in Sheffield Lake
51.7% of women with births (60) in Sheffield Lake are married. The highest percentage of unmarried women with births falls into 20 to 34 years age bracket with 55.8% of them unmarried at the time of birth, while the lowest percentage of unmarried women with births belong to 35 to 50 years age bracket with 0.0% of them unmarried.
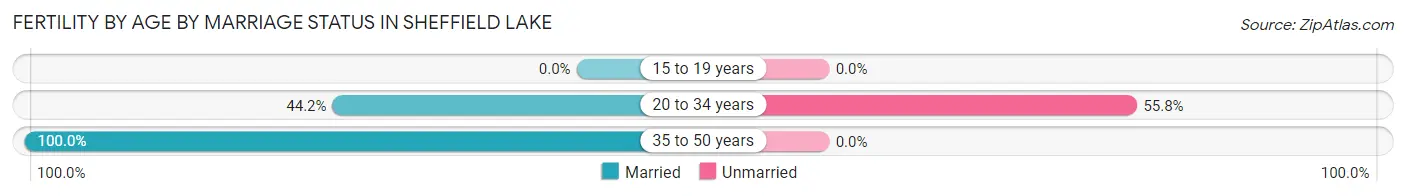
| Age Bracket | Married | Unmarried |
| 15 to 19 years | 0 (0.0%) | 0 (0.0%) |
| 20 to 34 years | 23 (44.2%) | 29 (55.8%) |
| 35 to 50 years | 8 (100.0%) | 0 (0.0%) |
| Total | 31 (51.7%) | 29 (48.3%) |
Fertility by Education in Sheffield Lake
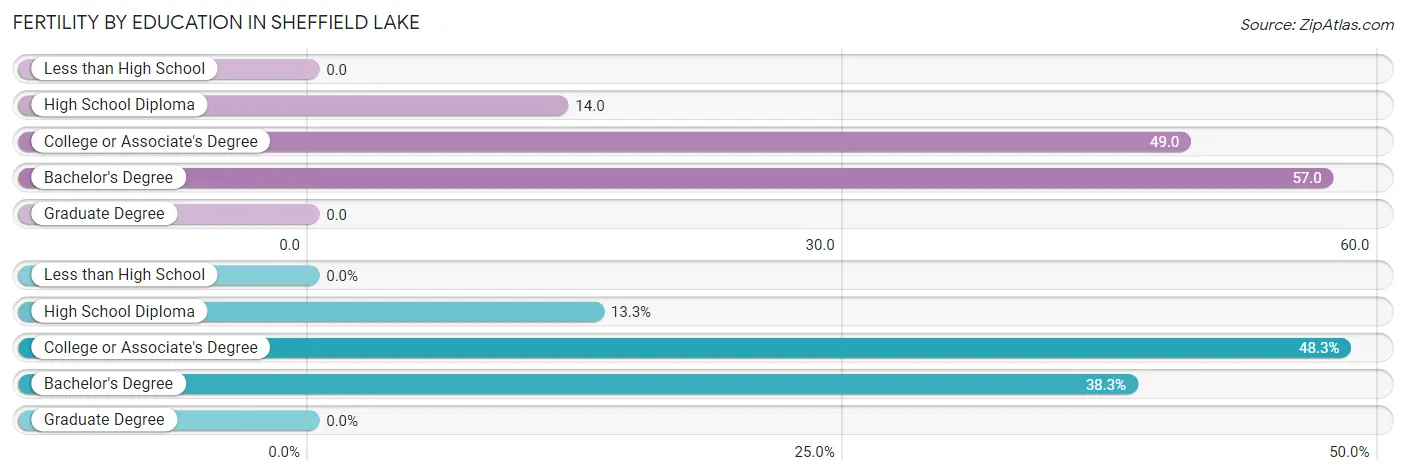
| Educational Attainment | Women with Births | Births / 1,000 Women |
| Less than High School | 0 (0.0%) | 0.0 |
| High School Diploma | 8 (13.3%) | 14.0 |
| College or Associate's Degree | 29 (48.3%) | 49.0 |
| Bachelor's Degree | 23 (38.3%) | 57.0 |
| Graduate Degree | 0 (0.0%) | 0.0 |
| Total | 60 (100.0%) | 31.0 |
Fertility by Education by Marriage Status in Sheffield Lake
48.3% of women with births in Sheffield Lake are unmarried. Women with the educational attainment of high school diploma are most likely to be married with 100.0% of them married at childbirth, while women with the educational attainment of college or associate's degree are least likely to be married with 100.0% of them unmarried at childbirth.
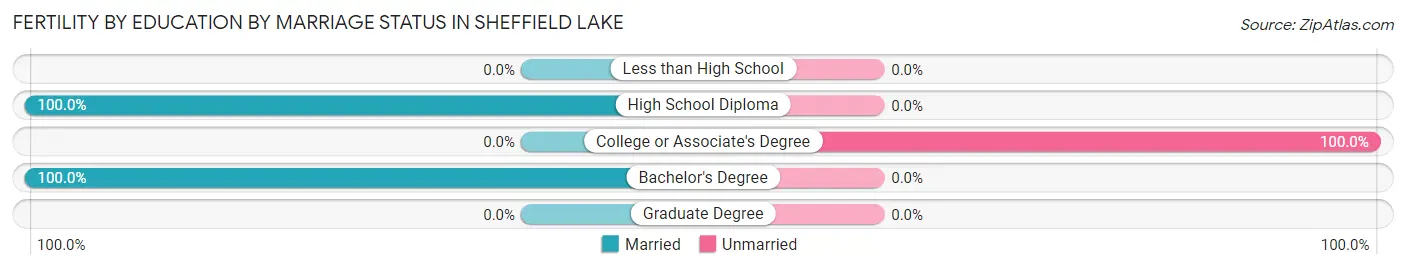
| Educational Attainment | Married | Unmarried |
| Less than High School | 0 (0.0%) | 0 (0.0%) |
| High School Diploma | 8 (100.0%) | 0 (0.0%) |
| College or Associate's Degree | 0 (0.0%) | 29 (100.0%) |
| Bachelor's Degree | 23 (100.0%) | 0 (0.0%) |
| Graduate Degree | 0 (0.0%) | 0 (0.0%) |
| Total | 31 (51.7%) | 29 (48.3%) |
Employment Characteristics in Sheffield Lake
Employment by Class of Employer in Sheffield Lake
Among the 4,858 employed individuals in Sheffield Lake, private company employees (3,471 | 71.5%), local government employees (458 | 9.4%), and not-for-profit organizations (307 | 6.3%) make up the most common classes of employment.
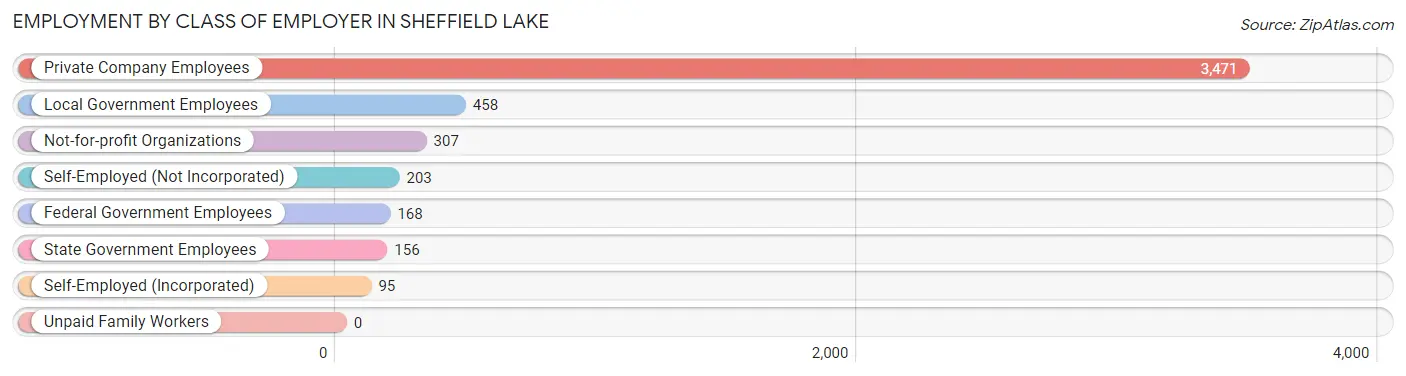
| Employer Class | # Employees | % Employees |
| Private Company Employees | 3,471 | 71.5% |
| Self-Employed (Incorporated) | 95 | 2.0% |
| Self-Employed (Not Incorporated) | 203 | 4.2% |
| Not-for-profit Organizations | 307 | 6.3% |
| Local Government Employees | 458 | 9.4% |
| State Government Employees | 156 | 3.2% |
| Federal Government Employees | 168 | 3.5% |
| Unpaid Family Workers | 0 | 0.0% |
| Total | 4,858 | 100.0% |
Employment Status by Age in Sheffield Lake
According to the labor force statistics for Sheffield Lake, out of the total population over 16 years of age (7,617), 66.1% or 5,035 individuals are in the labor force, with 3.2% or 161 of them unemployed. The age group with the highest labor force participation rate is 35 to 44 years, with 97.2% or 1,090 individuals in the labor force. Within the labor force, the 75 years and over age range has the highest percentage of unemployed individuals, with 37.3% or 25 of them being unemployed.
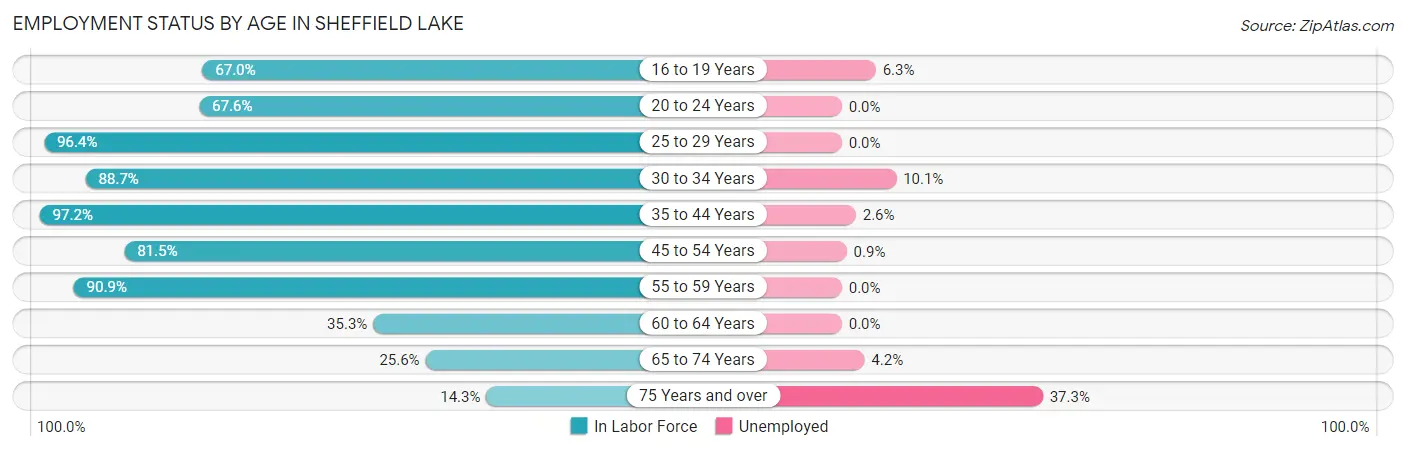
| Age Bracket | In Labor Force | Unemployed |
| 16 to 19 Years | 303 (67.0%) | 19 (6.3%) |
| 20 to 24 Years | 261 (67.6%) | 0 (0.0%) |
| 25 to 29 Years | 430 (96.4%) | 0 (0.0%) |
| 30 to 34 Years | 675 (88.7%) | 68 (10.1%) |
| 35 to 44 Years | 1,090 (97.2%) | 28 (2.6%) |
| 45 to 54 Years | 793 (81.5%) | 7 (0.9%) |
| 55 to 59 Years | 781 (90.9%) | 0 (0.0%) |
| 60 to 64 Years | 296 (35.3%) | 0 (0.0%) |
| 65 to 74 Years | 336 (25.6%) | 14 (4.2%) |
| 75 Years and over | 67 (14.3%) | 25 (37.3%) |
| Total | 5,035 (66.1%) | 161 (3.2%) |
Employment Status by Educational Attainment in Sheffield Lake
According to labor force statistics for Sheffield Lake, 81.3% of individuals (4,064) out of the total population between 25 and 64 years of age (4,999) are in the labor force, with 2.5% or 102 of them being unemployed. The group with the highest labor force participation rate are those with the educational attainment of bachelor's degree or higher, with 94.6% or 1,027 individuals in the labor force. Within the labor force, individuals with high school diploma education have the highest percentage of unemployment, with 3.2% or 54 of them being unemployed.
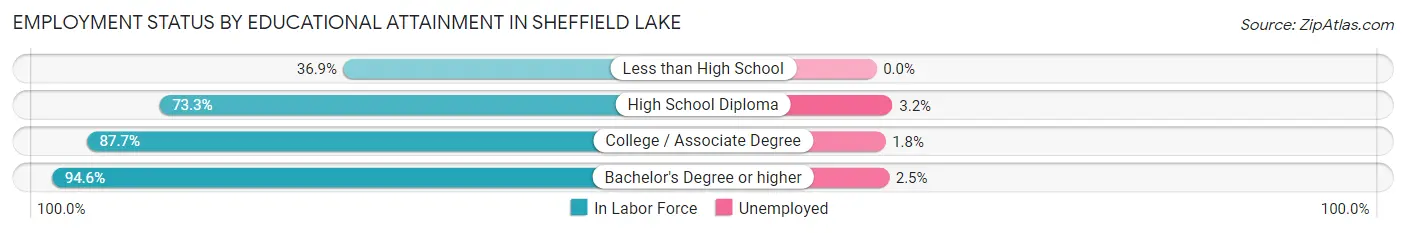
| Educational Attainment | In Labor Force | Unemployed |
| Less than High School | 45 (36.9%) | 0 (0.0%) |
| High School Diploma | 1,694 (73.3%) | 74 (3.2%) |
| College / Associate Degree | 1,298 (87.7%) | 27 (1.8%) |
| Bachelor's Degree or higher | 1,027 (94.6%) | 27 (2.5%) |
| Total | 4,064 (81.3%) | 125 (2.5%) |
Employment Occupations by Sex in Sheffield Lake
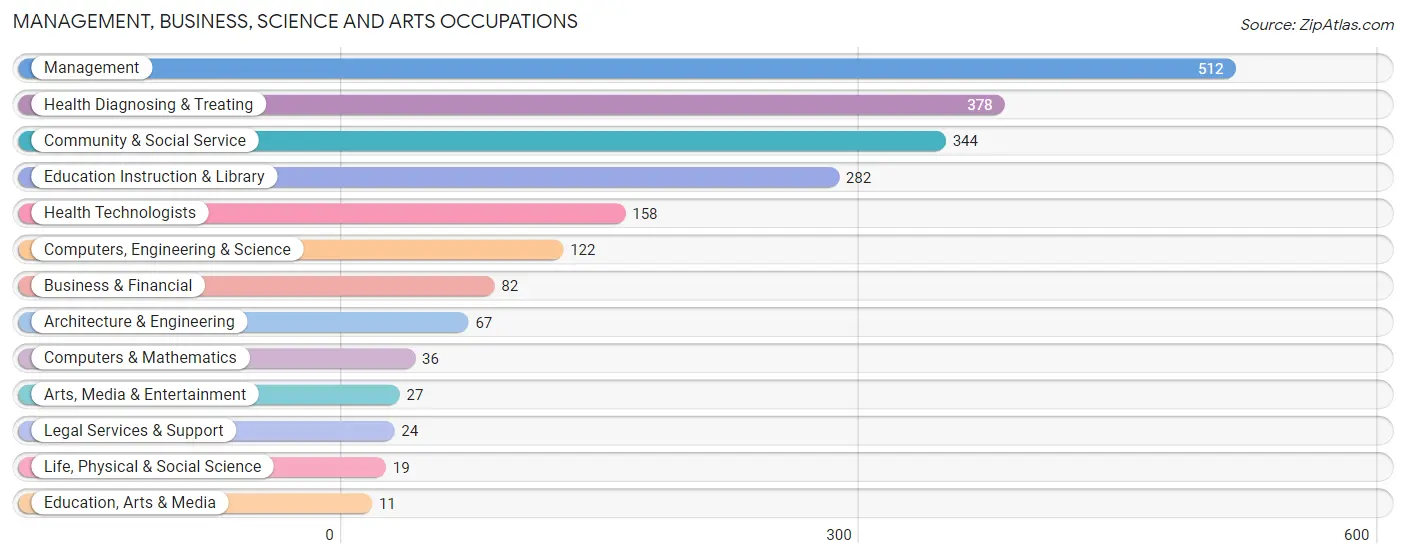
Management, Business, Science and Arts Occupations
The most common Management, Business, Science and Arts occupations in Sheffield Lake are Management (512 | 10.5%), Health Diagnosing & Treating (378 | 7.8%), Community & Social Service (344 | 7.1%), Education Instruction & Library (282 | 5.8%), and Health Technologists (158 | 3.2%).
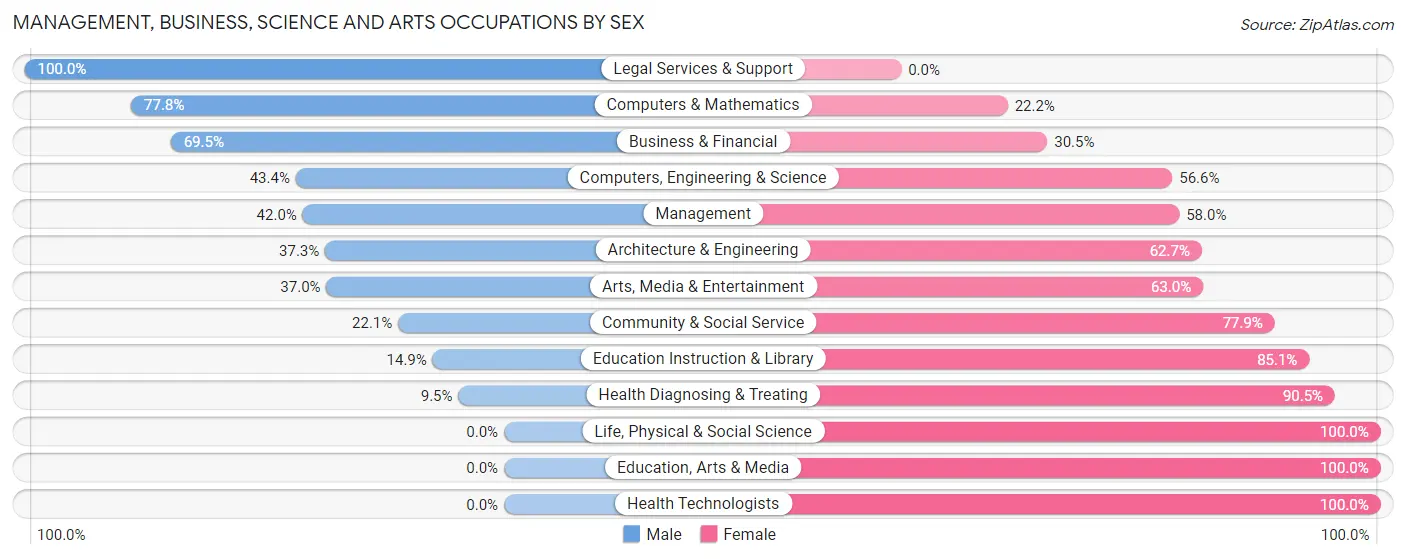
Management, Business, Science and Arts Occupations by Sex
Within the Management, Business, Science and Arts occupations in Sheffield Lake, the most male-oriented occupations are Legal Services & Support (100.0%), Computers & Mathematics (77.8%), and Business & Financial (69.5%), while the most female-oriented occupations are Life, Physical & Social Science (100.0%), Education, Arts & Media (100.0%), and Health Technologists (100.0%).
| Occupation | Male | Female |
| Management | 215 (42.0%) | 297 (58.0%) |
| Business & Financial | 57 (69.5%) | 25 (30.5%) |
| Computers, Engineering & Science | 53 (43.4%) | 69 (56.6%) |
| Computers & Mathematics | 28 (77.8%) | 8 (22.2%) |
| Architecture & Engineering | 25 (37.3%) | 42 (62.7%) |
| Life, Physical & Social Science | 0 (0.0%) | 19 (100.0%) |
| Community & Social Service | 76 (22.1%) | 268 (77.9%) |
| Education, Arts & Media | 0 (0.0%) | 11 (100.0%) |
| Legal Services & Support | 24 (100.0%) | 0 (0.0%) |
| Education Instruction & Library | 42 (14.9%) | 240 (85.1%) |
| Arts, Media & Entertainment | 10 (37.0%) | 17 (63.0%) |
| Health Diagnosing & Treating | 36 (9.5%) | 342 (90.5%) |
| Health Technologists | 0 (0.0%) | 158 (100.0%) |
| Total (Category) | 437 (30.4%) | 1,001 (69.6%) |
| Total (Overall) | 2,224 (45.7%) | 2,647 (54.3%) |
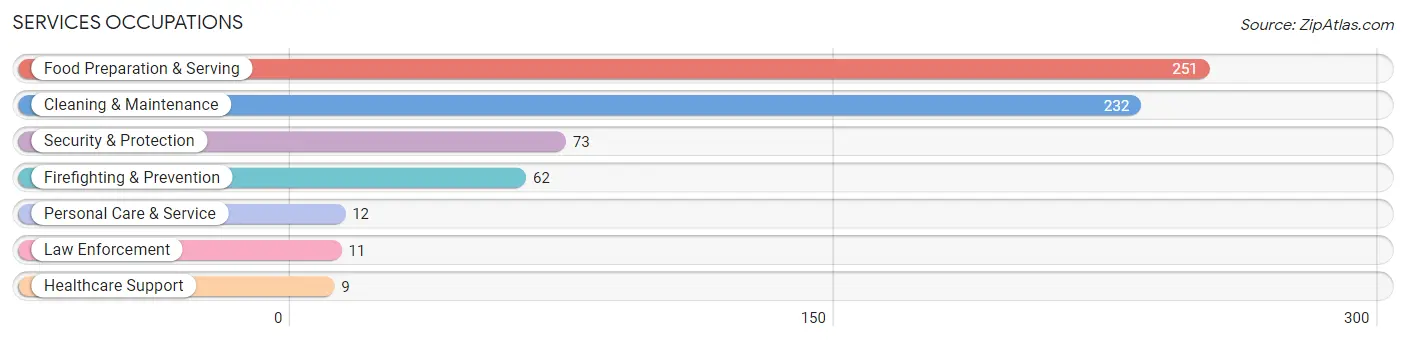
Services Occupations
The most common Services occupations in Sheffield Lake are Food Preparation & Serving (251 | 5.1%), Cleaning & Maintenance (232 | 4.8%), Security & Protection (73 | 1.5%), Firefighting & Prevention (62 | 1.3%), and Personal Care & Service (12 | 0.3%).
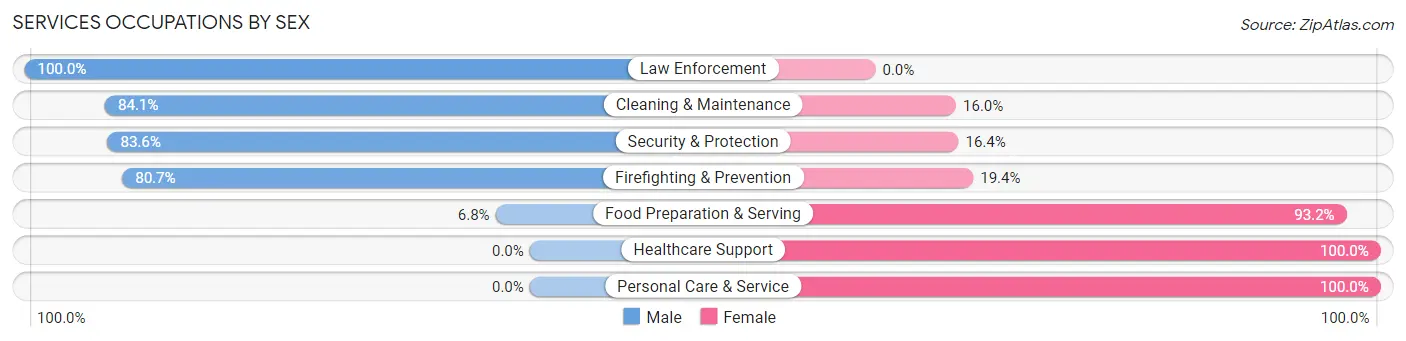
Services Occupations by Sex
Within the Services occupations in Sheffield Lake, the most male-oriented occupations are Law Enforcement (100.0%), Cleaning & Maintenance (84.1%), and Security & Protection (83.6%), while the most female-oriented occupations are Healthcare Support (100.0%), Personal Care & Service (100.0%), and Food Preparation & Serving (93.2%).
| Occupation | Male | Female |
| Healthcare Support | 0 (0.0%) | 9 (100.0%) |
| Security & Protection | 61 (83.6%) | 12 (16.4%) |
| Firefighting & Prevention | 50 (80.6%) | 12 (19.4%) |
| Law Enforcement | 11 (100.0%) | 0 (0.0%) |
| Food Preparation & Serving | 17 (6.8%) | 234 (93.2%) |
| Cleaning & Maintenance | 195 (84.1%) | 37 (16.0%) |
| Personal Care & Service | 0 (0.0%) | 12 (100.0%) |
| Total (Category) | 273 (47.3%) | 304 (52.7%) |
| Total (Overall) | 2,224 (45.7%) | 2,647 (54.3%) |
Sales and Office Occupations
The most common Sales and Office occupations in Sheffield Lake are Office & Administration (839 | 17.2%), and Sales & Related (451 | 9.3%).
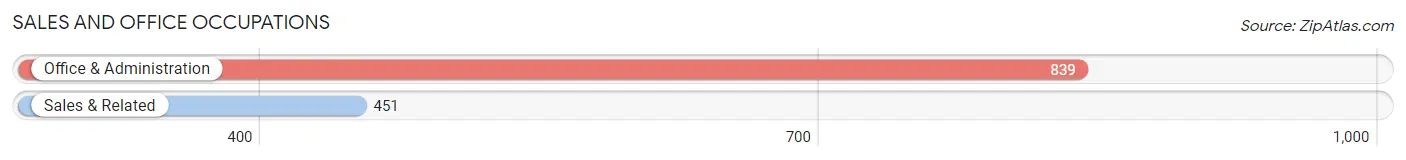
Sales and Office Occupations by Sex
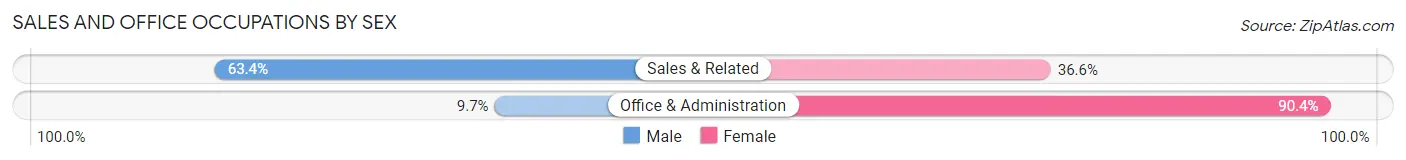
| Occupation | Male | Female |
| Sales & Related | 286 (63.4%) | 165 (36.6%) |
| Office & Administration | 81 (9.7%) | 758 (90.3%) |
| Total (Category) | 367 (28.4%) | 923 (71.6%) |
| Total (Overall) | 2,224 (45.7%) | 2,647 (54.3%) |
Natural Resources, Construction and Maintenance Occupations
The most common Natural Resources, Construction and Maintenance occupations in Sheffield Lake are Construction & Extraction (372 | 7.6%), and Installation, Maintenance & Repair (237 | 4.9%).
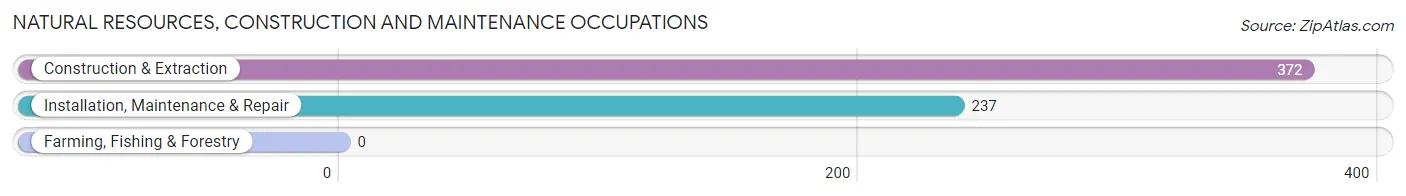
Natural Resources, Construction and Maintenance Occupations by Sex
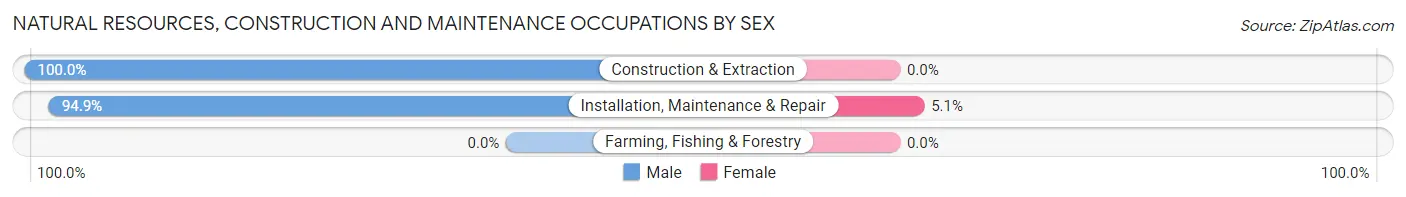
| Occupation | Male | Female |
| Farming, Fishing & Forestry | 0 (0.0%) | 0 (0.0%) |
| Construction & Extraction | 372 (100.0%) | 0 (0.0%) |
| Installation, Maintenance & Repair | 225 (94.9%) | 12 (5.1%) |
| Total (Category) | 597 (98.0%) | 12 (2.0%) |
| Total (Overall) | 2,224 (45.7%) | 2,647 (54.3%) |
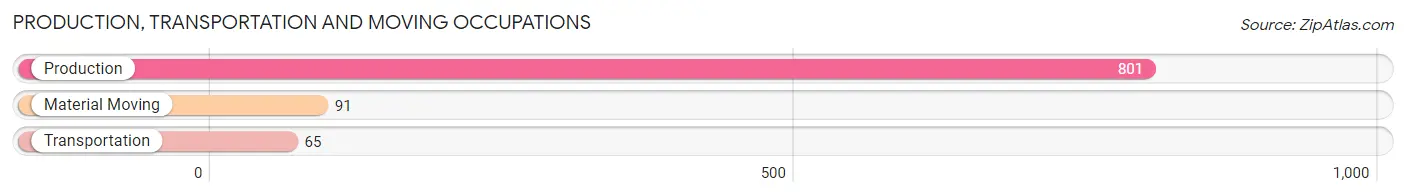
Production, Transportation and Moving Occupations
The most common Production, Transportation and Moving occupations in Sheffield Lake are Production (801 | 16.4%), Material Moving (91 | 1.9%), and Transportation (65 | 1.3%).
Production, Transportation and Moving Occupations by Sex
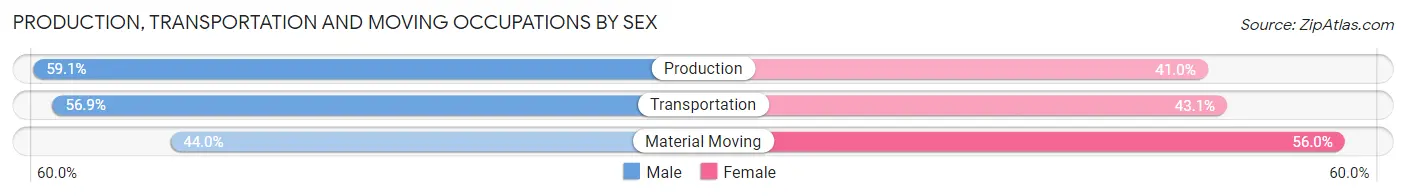
| Occupation | Male | Female |
| Production | 473 (59.1%) | 328 (40.9%) |
| Transportation | 37 (56.9%) | 28 (43.1%) |
| Material Moving | 40 (44.0%) | 51 (56.0%) |
| Total (Category) | 550 (57.5%) | 407 (42.5%) |
| Total (Overall) | 2,224 (45.7%) | 2,647 (54.3%) |
Employment Industries by Sex in Sheffield Lake
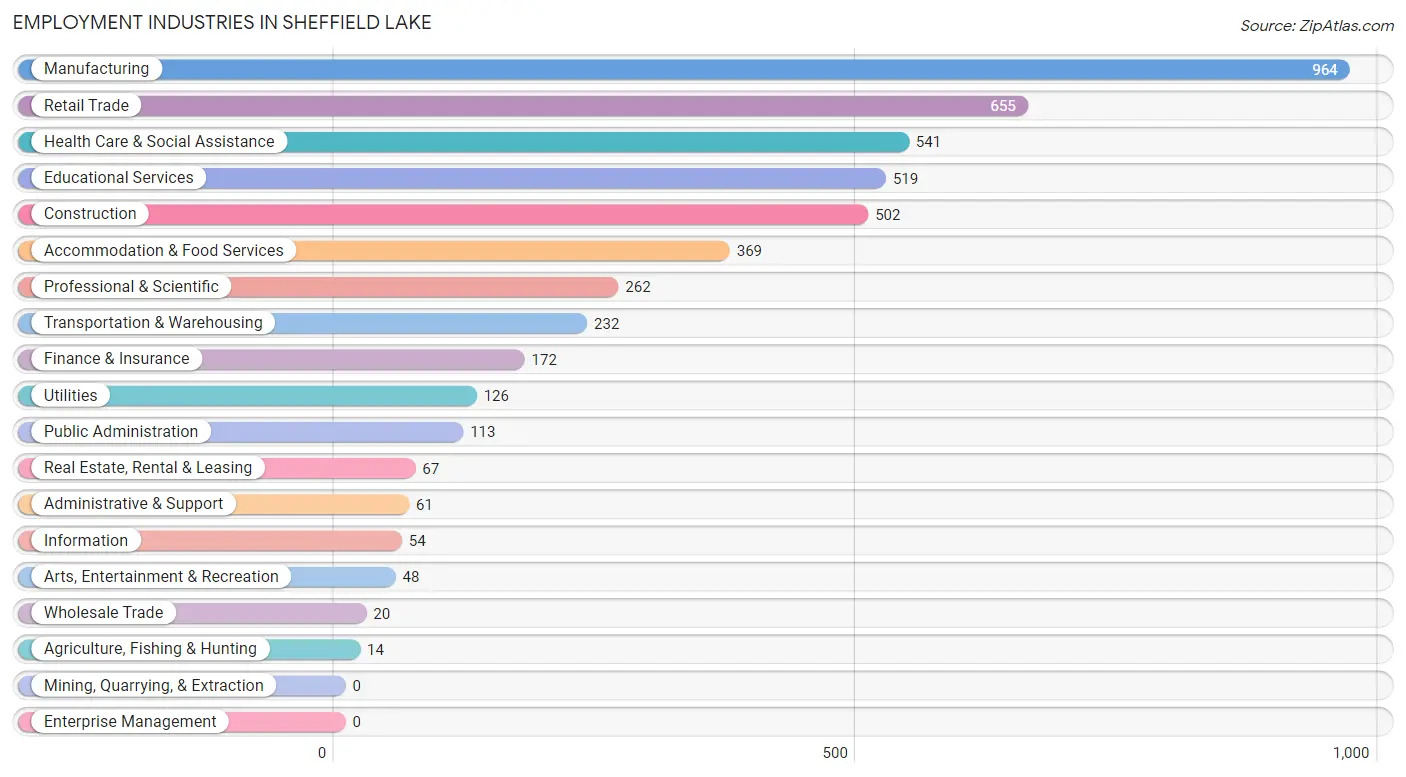
Employment Industries in Sheffield Lake
The major employment industries in Sheffield Lake include Manufacturing (964 | 19.8%), Retail Trade (655 | 13.5%), Health Care & Social Assistance (541 | 11.1%), Educational Services (519 | 10.6%), and Construction (502 | 10.3%).
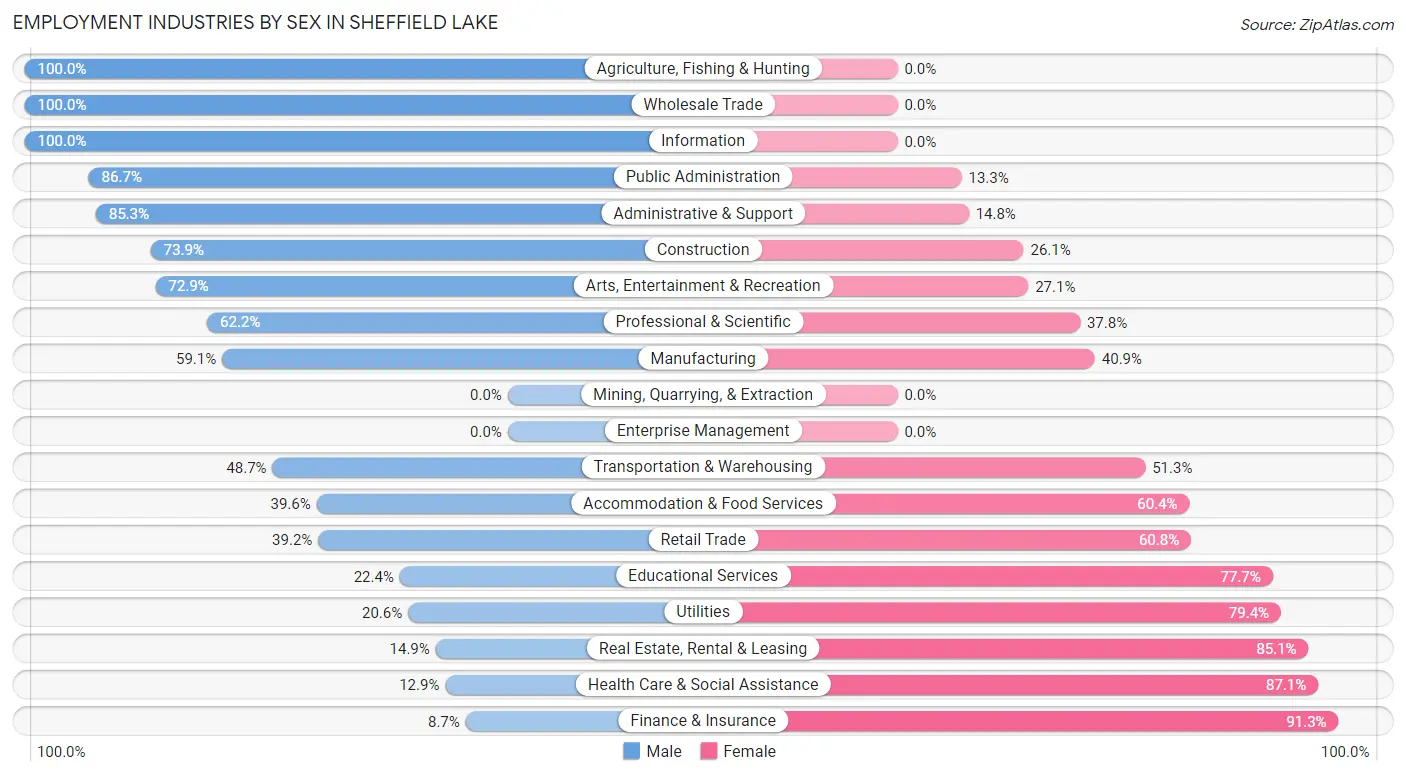
Employment Industries by Sex in Sheffield Lake
The Sheffield Lake industries that see more men than women are Agriculture, Fishing & Hunting (100.0%), Wholesale Trade (100.0%), and Information (100.0%), whereas the industries that tend to have a higher number of women are Finance & Insurance (91.3%), Health Care & Social Assistance (87.1%), and Real Estate, Rental & Leasing (85.1%).
| Industry | Male | Female |
| Agriculture, Fishing & Hunting | 14 (100.0%) | 0 (0.0%) |
| Mining, Quarrying, & Extraction | 0 (0.0%) | 0 (0.0%) |
| Construction | 371 (73.9%) | 131 (26.1%) |
| Manufacturing | 570 (59.1%) | 394 (40.9%) |
| Wholesale Trade | 20 (100.0%) | 0 (0.0%) |
| Retail Trade | 257 (39.2%) | 398 (60.8%) |
| Transportation & Warehousing | 113 (48.7%) | 119 (51.3%) |
| Utilities | 26 (20.6%) | 100 (79.4%) |
| Information | 54 (100.0%) | 0 (0.0%) |
| Finance & Insurance | 15 (8.7%) | 157 (91.3%) |
| Real Estate, Rental & Leasing | 10 (14.9%) | 57 (85.1%) |
| Professional & Scientific | 163 (62.2%) | 99 (37.8%) |
| Enterprise Management | 0 (0.0%) | 0 (0.0%) |
| Administrative & Support | 52 (85.3%) | 9 (14.7%) |
| Educational Services | 116 (22.4%) | 403 (77.6%) |
| Health Care & Social Assistance | 70 (12.9%) | 471 (87.1%) |
| Arts, Entertainment & Recreation | 35 (72.9%) | 13 (27.1%) |
| Accommodation & Food Services | 146 (39.6%) | 223 (60.4%) |
| Public Administration | 98 (86.7%) | 15 (13.3%) |
| Total | 2,224 (45.7%) | 2,647 (54.3%) |
Education in Sheffield Lake
School Enrollment in Sheffield Lake
The most common levels of schooling among the 2,029 students in Sheffield Lake are high school (588 | 29.0%), middle school (441 | 21.7%), and college / undergraduate (391 | 19.3%).
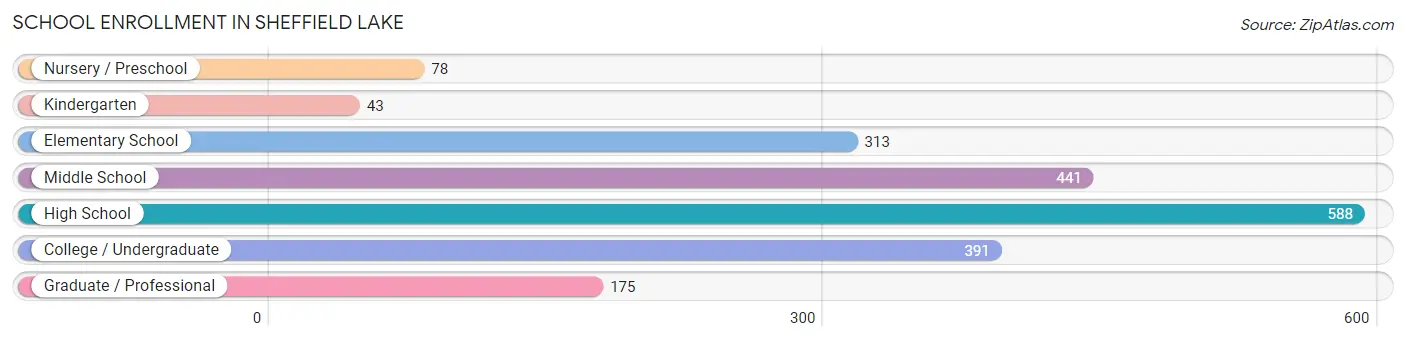
| School Level | # Students | % Students |
| Nursery / Preschool | 78 | 3.8% |
| Kindergarten | 43 | 2.1% |
| Elementary School | 313 | 15.4% |
| Middle School | 441 | 21.7% |
| High School | 588 | 29.0% |
| College / Undergraduate | 391 | 19.3% |
| Graduate / Professional | 175 | 8.6% |
| Total | 2,029 | 100.0% |
School Enrollment by Age by Funding Source in Sheffield Lake
Out of a total of 2,029 students who are enrolled in schools in Sheffield Lake, 345 (17.0%) attend a private institution, while the remaining 1,684 (83.0%) are enrolled in public schools. The age group of 35 years and over has the highest likelihood of being enrolled in private schools, with 178 (89.9% in the age bracket) enrolled. Conversely, the age group of 15 to 17 year olds has the lowest likelihood of being enrolled in a private school, with 298 (97.7% in the age bracket) attending a public institution.
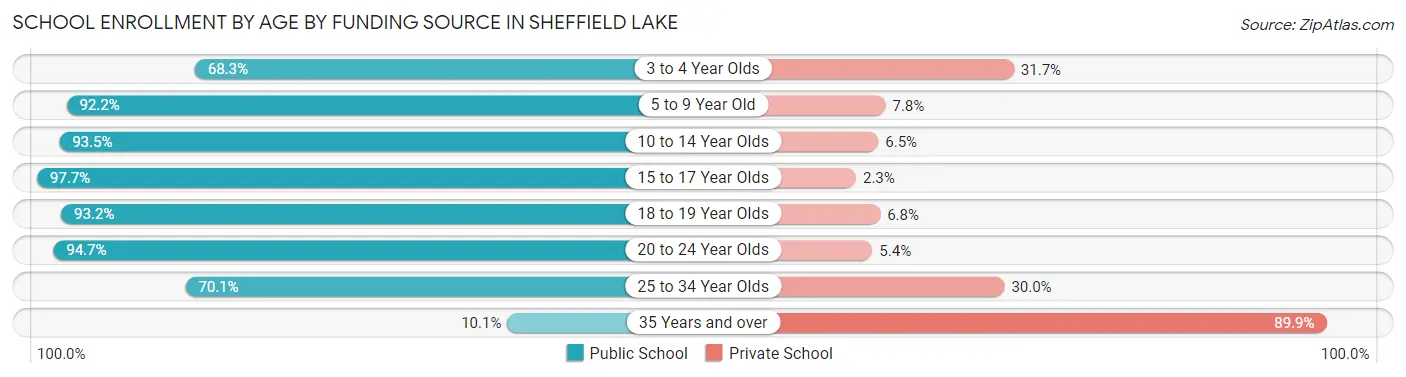
| Age Bracket | Public School | Private School |
| 3 to 4 Year Olds | 28 (68.3%) | 13 (31.7%) |
| 5 to 9 Year Old | 319 (92.2%) | 27 (7.8%) |
| 10 to 14 Year Olds | 507 (93.5%) | 35 (6.5%) |
| 15 to 17 Year Olds | 298 (97.7%) | 7 (2.3%) |
| 18 to 19 Year Olds | 137 (93.2%) | 10 (6.8%) |
| 20 to 24 Year Olds | 230 (94.7%) | 13 (5.3%) |
| 25 to 34 Year Olds | 145 (70.1%) | 62 (29.9%) |
| 35 Years and over | 20 (10.1%) | 178 (89.9%) |
| Total | 1,684 (83.0%) | 345 (17.0%) |
Educational Attainment by Field of Study in Sheffield Lake
Business (299 | 20.4%), education (261 | 17.8%), science & technology (192 | 13.1%), liberal arts & history (148 | 10.1%), and social sciences (117 | 8.0%) are the most common fields of study among 1,467 individuals in Sheffield Lake who have obtained a bachelor's degree or higher.
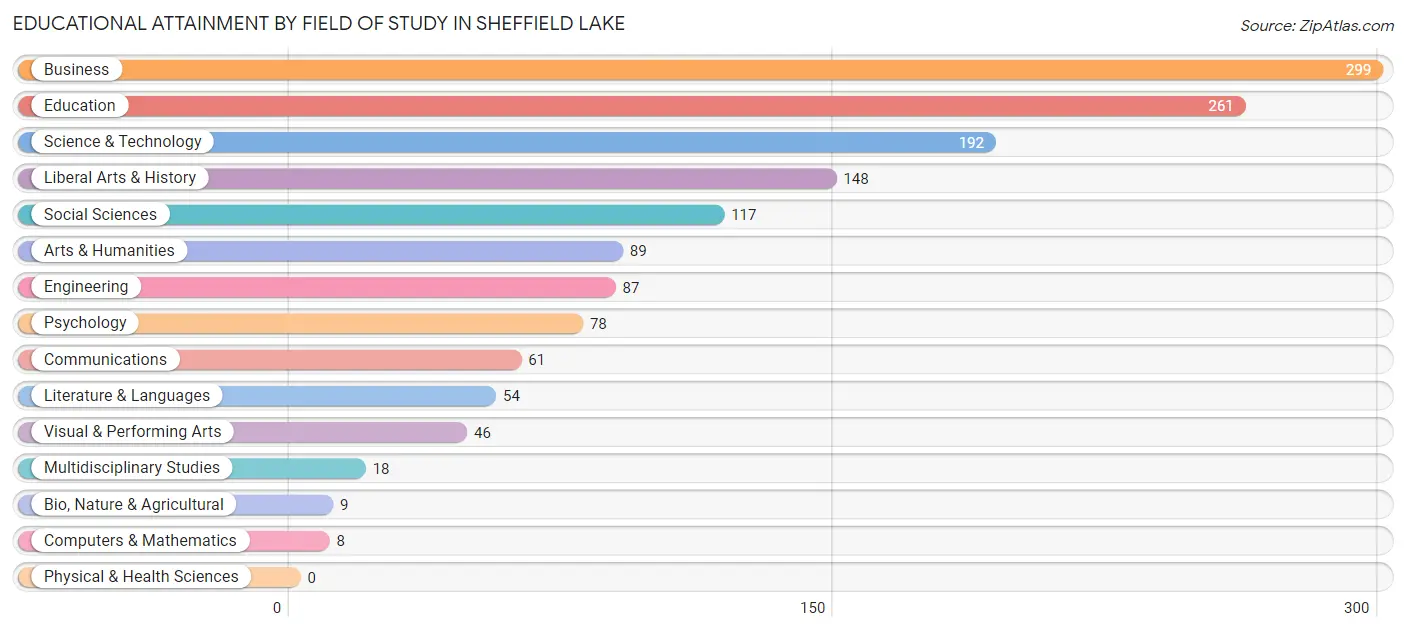
| Field of Study | # Graduates | % Graduates |
| Computers & Mathematics | 8 | 0.5% |
| Bio, Nature & Agricultural | 9 | 0.6% |
| Physical & Health Sciences | 0 | 0.0% |
| Psychology | 78 | 5.3% |
| Social Sciences | 117 | 8.0% |
| Engineering | 87 | 5.9% |
| Multidisciplinary Studies | 18 | 1.2% |
| Science & Technology | 192 | 13.1% |
| Business | 299 | 20.4% |
| Education | 261 | 17.8% |
| Literature & Languages | 54 | 3.7% |
| Liberal Arts & History | 148 | 10.1% |
| Visual & Performing Arts | 46 | 3.1% |
| Communications | 61 | 4.2% |
| Arts & Humanities | 89 | 6.1% |
| Total | 1,467 | 100.0% |
Transportation & Commute in Sheffield Lake
Vehicle Availability by Sex in Sheffield Lake
The most prevalent vehicle ownership categories in Sheffield Lake are males with 2 vehicles (764, accounting for 34.5%) and females with 2 vehicles (832, making up 28.9%).
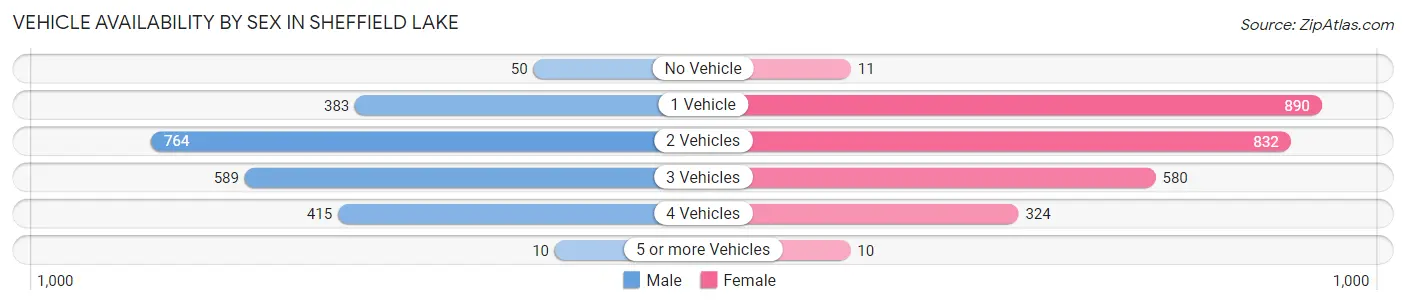
| Vehicles Available | Male | Female |
| No Vehicle | 50 (2.3%) | 11 (0.4%) |
| 1 Vehicle | 383 (17.3%) | 890 (33.6%) |
| 2 Vehicles | 764 (34.5%) | 832 (31.4%) |
| 3 Vehicles | 589 (26.6%) | 580 (21.9%) |
| 4 Vehicles | 415 (18.8%) | 324 (12.2%) |
| 5 or more Vehicles | 10 (0.4%) | 10 (0.4%) |
| Total | 2,211 (100.0%) | 2,647 (100.0%) |
Commute Time in Sheffield Lake
The most frequently occuring commute durations in Sheffield Lake are 15 to 19 minutes (927 commuters, 20.2%), 20 to 24 minutes (596 commuters, 13.0%), and 45 to 59 minutes (584 commuters, 12.7%).
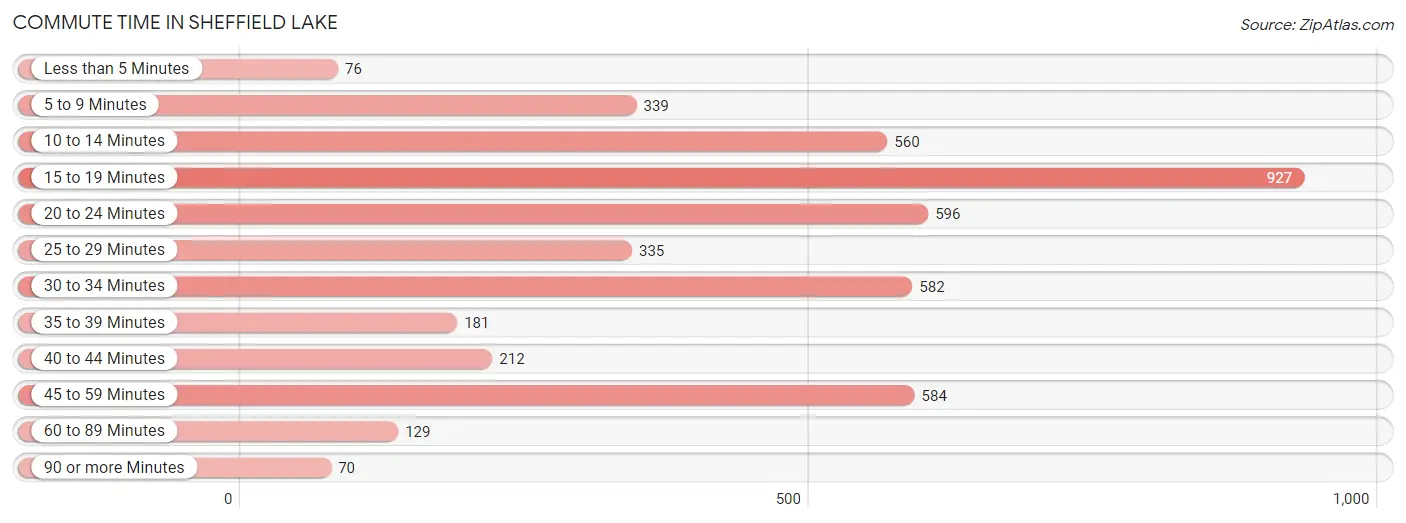
| Commute Time | # Commuters | % Commuters |
| Less than 5 Minutes | 76 | 1.7% |
| 5 to 9 Minutes | 339 | 7.4% |
| 10 to 14 Minutes | 560 | 12.2% |
| 15 to 19 Minutes | 927 | 20.2% |
| 20 to 24 Minutes | 596 | 13.0% |
| 25 to 29 Minutes | 335 | 7.3% |
| 30 to 34 Minutes | 582 | 12.7% |
| 35 to 39 Minutes | 181 | 3.9% |
| 40 to 44 Minutes | 212 | 4.6% |
| 45 to 59 Minutes | 584 | 12.7% |
| 60 to 89 Minutes | 129 | 2.8% |
| 90 or more Minutes | 70 | 1.5% |
Commute Time by Sex in Sheffield Lake
The most common commute times in Sheffield Lake are 45 to 59 minutes (447 commuters, 20.6%) for males and 15 to 19 minutes (535 commuters, 22.1%) for females.
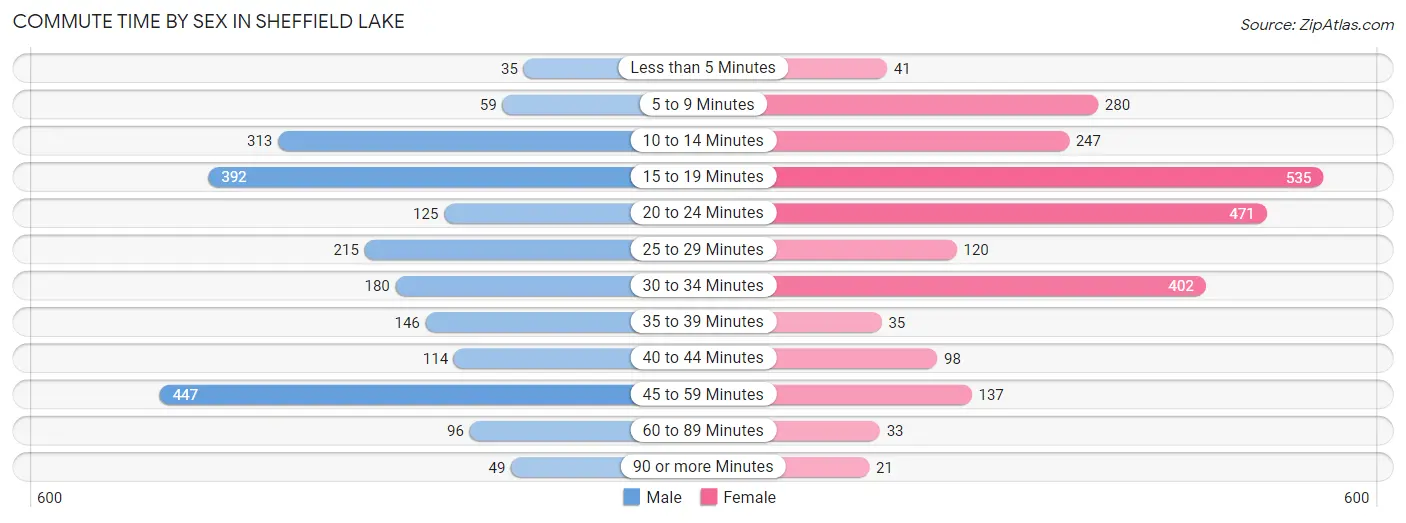
| Commute Time | Male | Female |
| Less than 5 Minutes | 35 (1.6%) | 41 (1.7%) |
| 5 to 9 Minutes | 59 (2.7%) | 280 (11.6%) |
| 10 to 14 Minutes | 313 (14.4%) | 247 (10.2%) |
| 15 to 19 Minutes | 392 (18.1%) | 535 (22.1%) |
| 20 to 24 Minutes | 125 (5.8%) | 471 (19.5%) |
| 25 to 29 Minutes | 215 (9.9%) | 120 (5.0%) |
| 30 to 34 Minutes | 180 (8.3%) | 402 (16.6%) |
| 35 to 39 Minutes | 146 (6.7%) | 35 (1.5%) |
| 40 to 44 Minutes | 114 (5.2%) | 98 (4.1%) |
| 45 to 59 Minutes | 447 (20.6%) | 137 (5.7%) |
| 60 to 89 Minutes | 96 (4.4%) | 33 (1.4%) |
| 90 or more Minutes | 49 (2.3%) | 21 (0.9%) |
Time of Departure to Work by Sex in Sheffield Lake
The most frequent times of departure to work in Sheffield Lake are 8:00 AM to 8:29 AM (369, 17.0%) for males and 7:30 AM to 7:59 AM (405, 16.7%) for females.
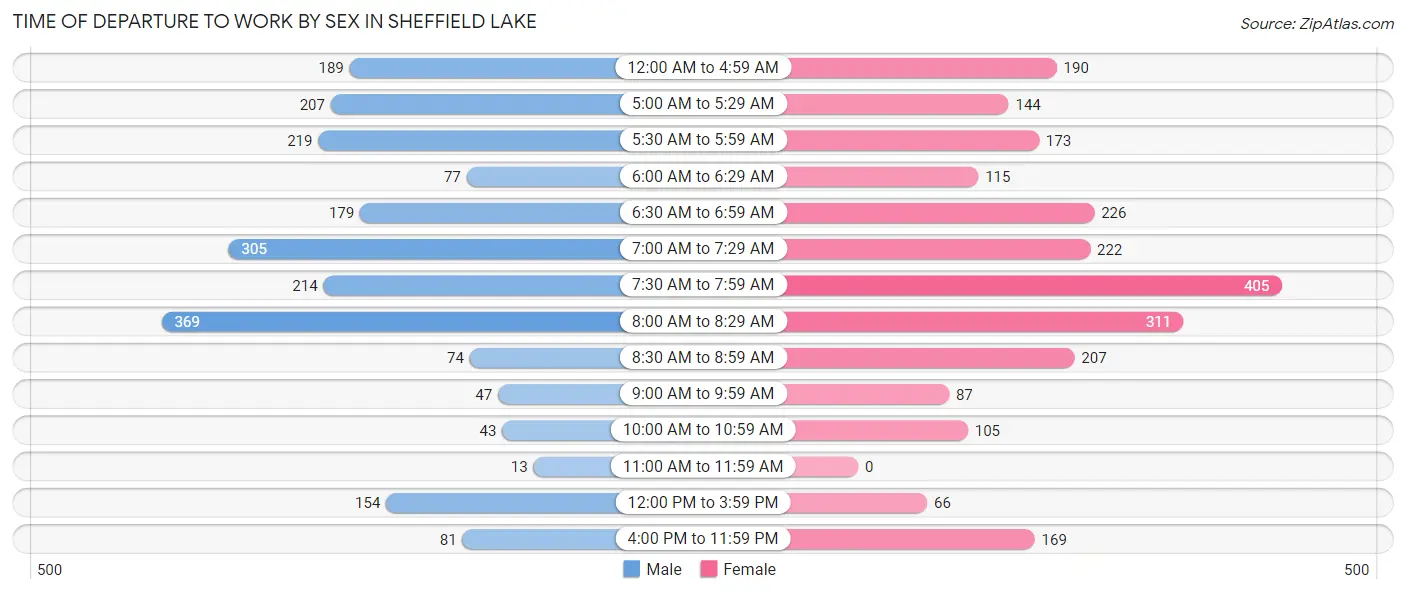
| Time of Departure | Male | Female |
| 12:00 AM to 4:59 AM | 189 (8.7%) | 190 (7.9%) |
| 5:00 AM to 5:29 AM | 207 (9.5%) | 144 (5.9%) |
| 5:30 AM to 5:59 AM | 219 (10.1%) | 173 (7.1%) |
| 6:00 AM to 6:29 AM | 77 (3.5%) | 115 (4.8%) |
| 6:30 AM to 6:59 AM | 179 (8.3%) | 226 (9.3%) |
| 7:00 AM to 7:29 AM | 305 (14.1%) | 222 (9.2%) |
| 7:30 AM to 7:59 AM | 214 (9.9%) | 405 (16.7%) |
| 8:00 AM to 8:29 AM | 369 (17.0%) | 311 (12.9%) |
| 8:30 AM to 8:59 AM | 74 (3.4%) | 207 (8.6%) |
| 9:00 AM to 9:59 AM | 47 (2.2%) | 87 (3.6%) |
| 10:00 AM to 10:59 AM | 43 (2.0%) | 105 (4.3%) |
| 11:00 AM to 11:59 AM | 13 (0.6%) | 0 (0.0%) |
| 12:00 PM to 3:59 PM | 154 (7.1%) | 66 (2.7%) |
| 4:00 PM to 11:59 PM | 81 (3.7%) | 169 (7.0%) |
| Total | 2,171 (100.0%) | 2,420 (100.0%) |
Housing Occupancy in Sheffield Lake
Occupancy by Ownership in Sheffield Lake
Of the total 4,147 dwellings in Sheffield Lake, owner-occupied units account for 3,172 (76.5%), while renter-occupied units make up 975 (23.5%).
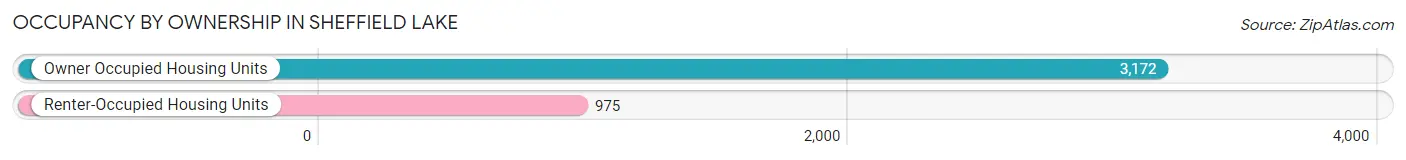
| Occupancy | # Housing Units | % Housing Units |
| Owner Occupied Housing Units | 3,172 | 76.5% |
| Renter-Occupied Housing Units | 975 | 23.5% |
| Total Occupied Housing Units | 4,147 | 100.0% |
Occupancy by Household Size in Sheffield Lake
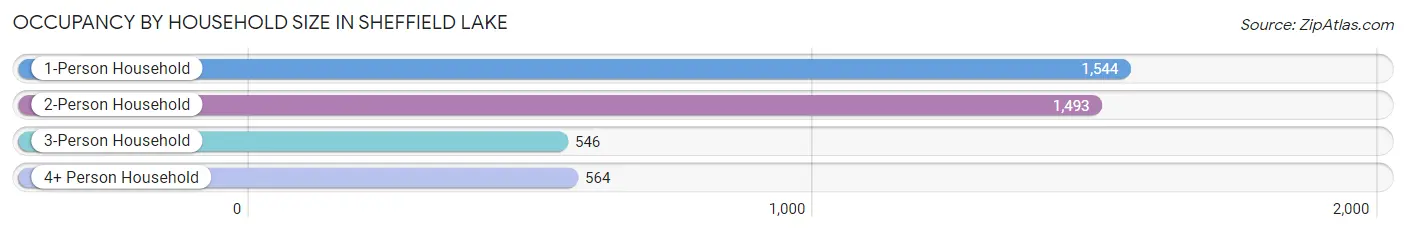
| Household Size | # Housing Units | % Housing Units |
| 1-Person Household | 1,544 | 37.2% |
| 2-Person Household | 1,493 | 36.0% |
| 3-Person Household | 546 | 13.2% |
| 4+ Person Household | 564 | 13.6% |
| Total Housing Units | 4,147 | 100.0% |
Occupancy by Ownership by Household Size in Sheffield Lake
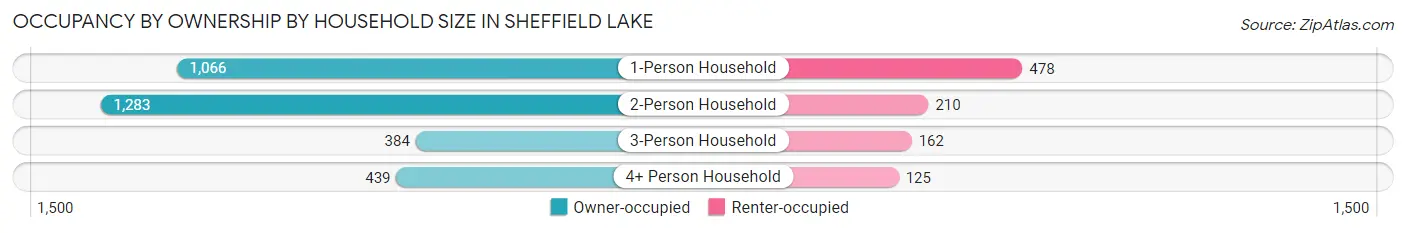
| Household Size | Owner-occupied | Renter-occupied |
| 1-Person Household | 1,066 (69.0%) | 478 (31.0%) |
| 2-Person Household | 1,283 (85.9%) | 210 (14.1%) |
| 3-Person Household | 384 (70.3%) | 162 (29.7%) |
| 4+ Person Household | 439 (77.8%) | 125 (22.2%) |
| Total Housing Units | 3,172 (76.5%) | 975 (23.5%) |
Occupancy by Educational Attainment in Sheffield Lake
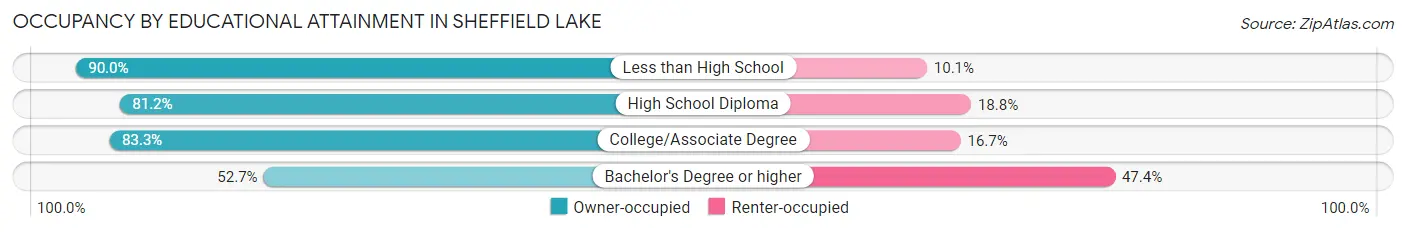
| Household Size | Owner-occupied | Renter-occupied |
| Less than High School | 170 (89.9%) | 19 (10.1%) |
| High School Diploma | 1,326 (81.2%) | 307 (18.8%) |
| College/Associate Degree | 1,229 (83.3%) | 247 (16.7%) |
| Bachelor's Degree or higher | 447 (52.6%) | 402 (47.3%) |
Occupancy by Age of Householder in Sheffield Lake
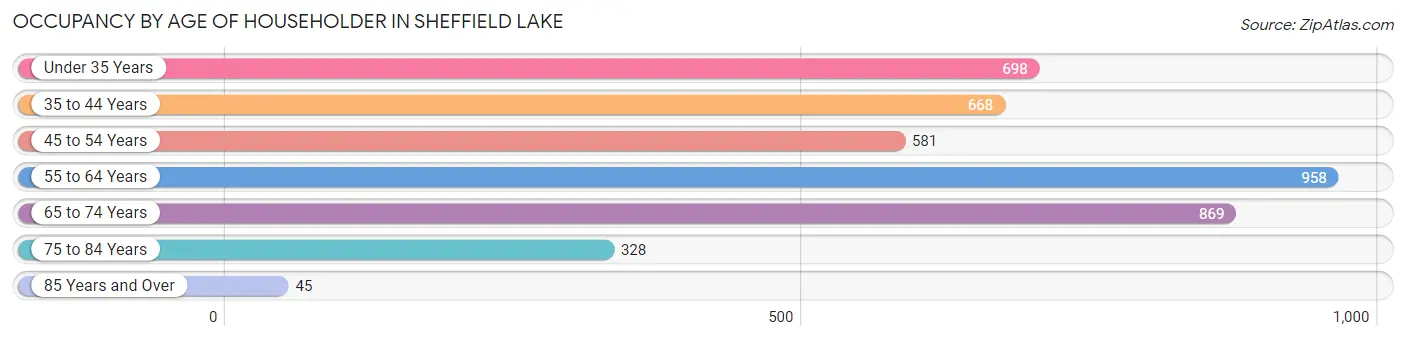
| Age Bracket | # Households | % Households |
| Under 35 Years | 698 | 16.8% |
| 35 to 44 Years | 668 | 16.1% |
| 45 to 54 Years | 581 | 14.0% |
| 55 to 64 Years | 958 | 23.1% |
| 65 to 74 Years | 869 | 20.9% |
| 75 to 84 Years | 328 | 7.9% |
| 85 Years and Over | 45 | 1.1% |
| Total | 4,147 | 100.0% |
Housing Finances in Sheffield Lake
Median Income by Occupancy in Sheffield Lake
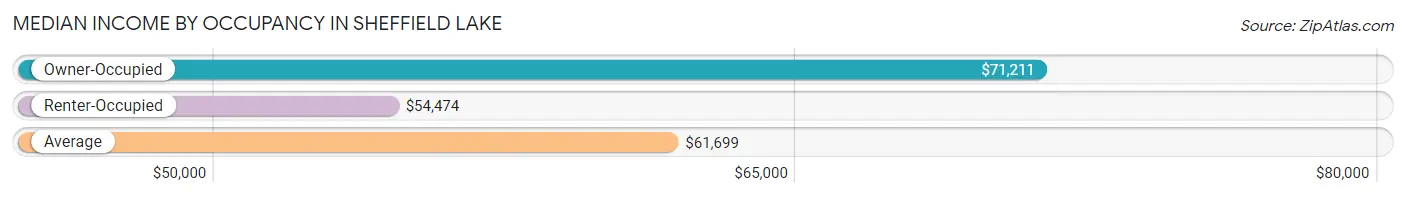
| Occupancy Type | # Households | Median Income |
| Owner-Occupied | 3,172 (76.5%) | $71,211 |
| Renter-Occupied | 975 (23.5%) | $54,474 |
| Average | 4,147 (100.0%) | $61,699 |
Occupancy by Householder Income Bracket in Sheffield Lake
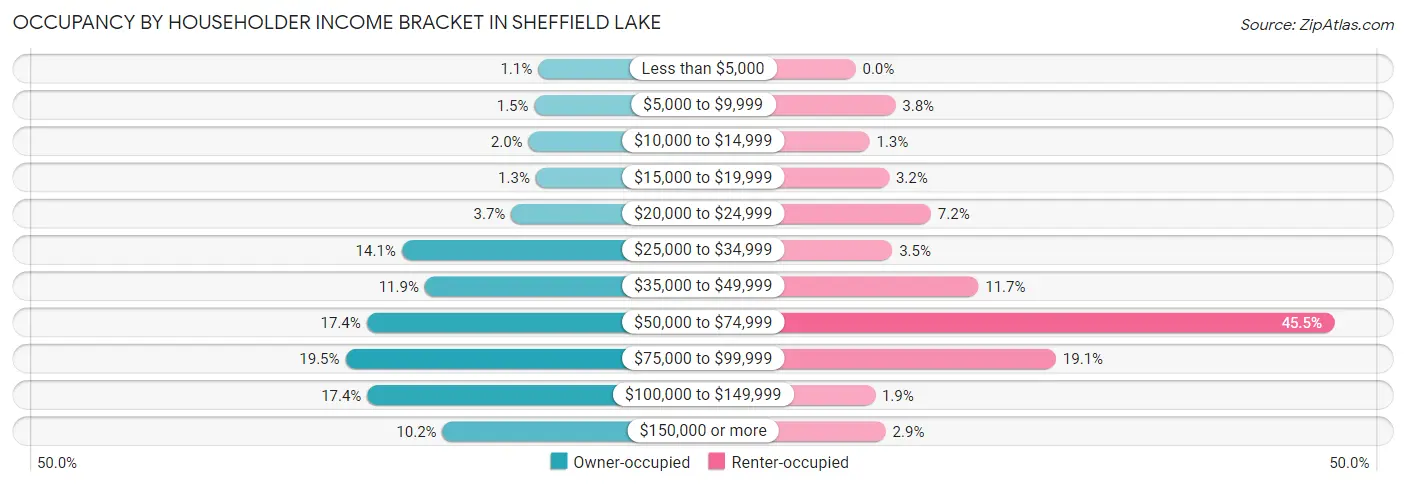
| Income Bracket | Owner-occupied | Renter-occupied |
| Less than $5,000 | 35 (1.1%) | 0 (0.0%) |
| $5,000 to $9,999 | 46 (1.5%) | 37 (3.8%) |
| $10,000 to $14,999 | 64 (2.0%) | 13 (1.3%) |
| $15,000 to $19,999 | 42 (1.3%) | 31 (3.2%) |
| $20,000 to $24,999 | 116 (3.7%) | 70 (7.2%) |
| $25,000 to $34,999 | 447 (14.1%) | 34 (3.5%) |
| $35,000 to $49,999 | 377 (11.9%) | 114 (11.7%) |
| $50,000 to $74,999 | 553 (17.4%) | 444 (45.5%) |
| $75,000 to $99,999 | 617 (19.5%) | 186 (19.1%) |
| $100,000 to $149,999 | 551 (17.4%) | 18 (1.8%) |
| $150,000 or more | 324 (10.2%) | 28 (2.9%) |
| Total | 3,172 (100.0%) | 975 (100.0%) |
Monthly Housing Cost Tiers in Sheffield Lake
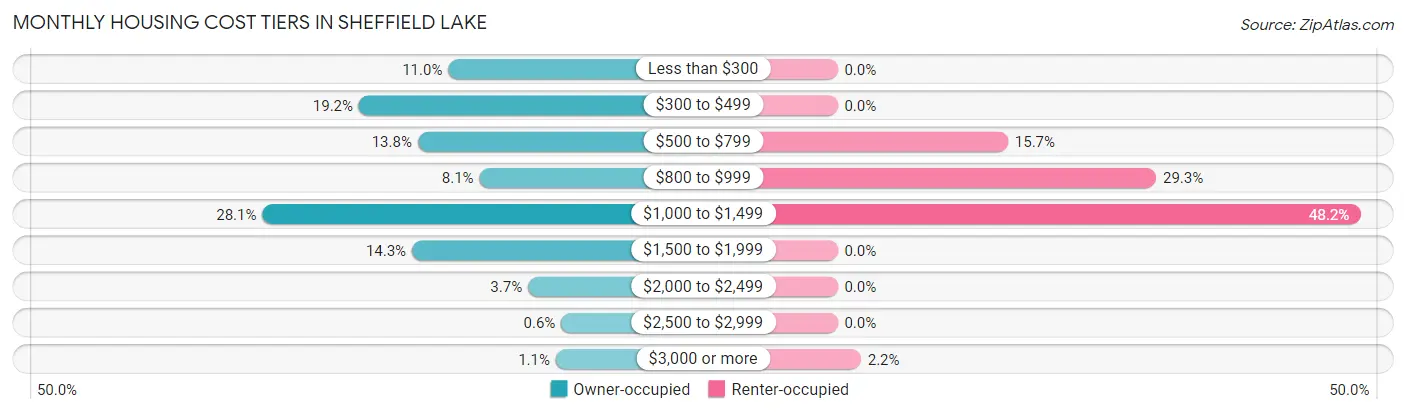
| Monthly Cost | Owner-occupied | Renter-occupied |
| Less than $300 | 349 (11.0%) | 0 (0.0%) |
| $300 to $499 | 610 (19.2%) | 0 (0.0%) |
| $500 to $799 | 438 (13.8%) | 153 (15.7%) |
| $800 to $999 | 258 (8.1%) | 286 (29.3%) |
| $1,000 to $1,499 | 892 (28.1%) | 470 (48.2%) |
| $1,500 to $1,999 | 455 (14.3%) | 0 (0.0%) |
| $2,000 to $2,499 | 116 (3.7%) | 0 (0.0%) |
| $2,500 to $2,999 | 19 (0.6%) | 0 (0.0%) |
| $3,000 or more | 35 (1.1%) | 21 (2.1%) |
| Total | 3,172 (100.0%) | 975 (100.0%) |
Physical Housing Characteristics in Sheffield Lake
Housing Structures in Sheffield Lake
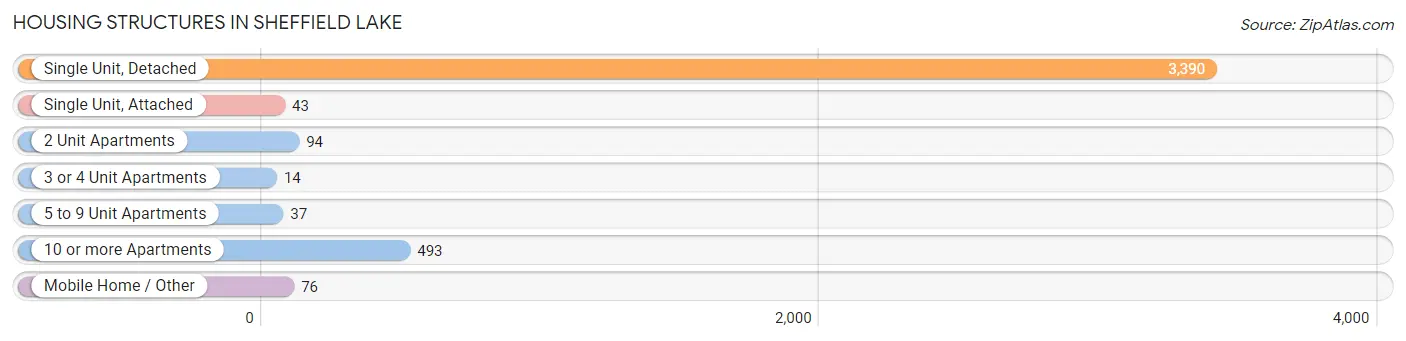
| Structure Type | # Housing Units | % Housing Units |
| Single Unit, Detached | 3,390 | 81.8% |
| Single Unit, Attached | 43 | 1.0% |
| 2 Unit Apartments | 94 | 2.3% |
| 3 or 4 Unit Apartments | 14 | 0.3% |
| 5 to 9 Unit Apartments | 37 | 0.9% |
| 10 or more Apartments | 493 | 11.9% |
| Mobile Home / Other | 76 | 1.8% |
| Total | 4,147 | 100.0% |
Housing Structures by Occupancy in Sheffield Lake
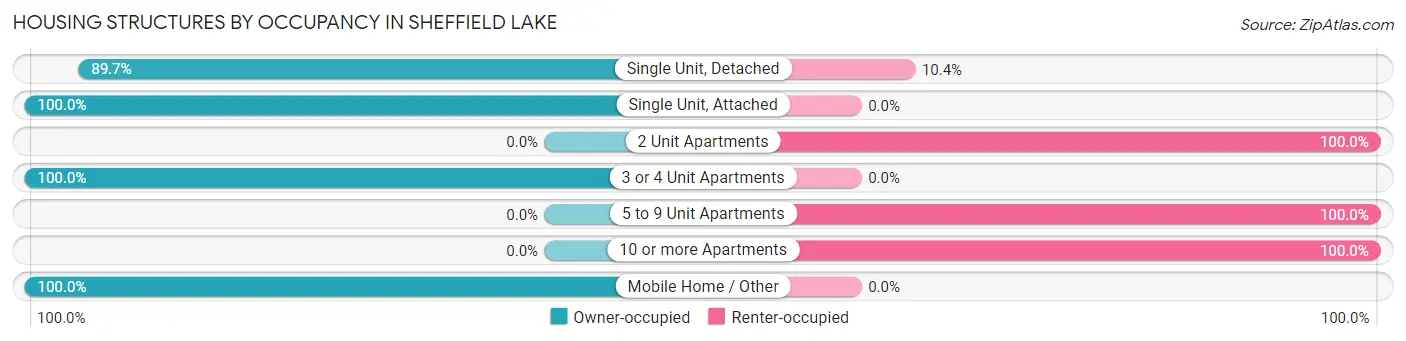
| Structure Type | Owner-occupied | Renter-occupied |
| Single Unit, Detached | 3,039 (89.6%) | 351 (10.3%) |
| Single Unit, Attached | 43 (100.0%) | 0 (0.0%) |
| 2 Unit Apartments | 0 (0.0%) | 94 (100.0%) |
| 3 or 4 Unit Apartments | 14 (100.0%) | 0 (0.0%) |
| 5 to 9 Unit Apartments | 0 (0.0%) | 37 (100.0%) |
| 10 or more Apartments | 0 (0.0%) | 493 (100.0%) |
| Mobile Home / Other | 76 (100.0%) | 0 (0.0%) |
| Total | 3,172 (76.5%) | 975 (23.5%) |
Housing Structures by Number of Rooms in Sheffield Lake
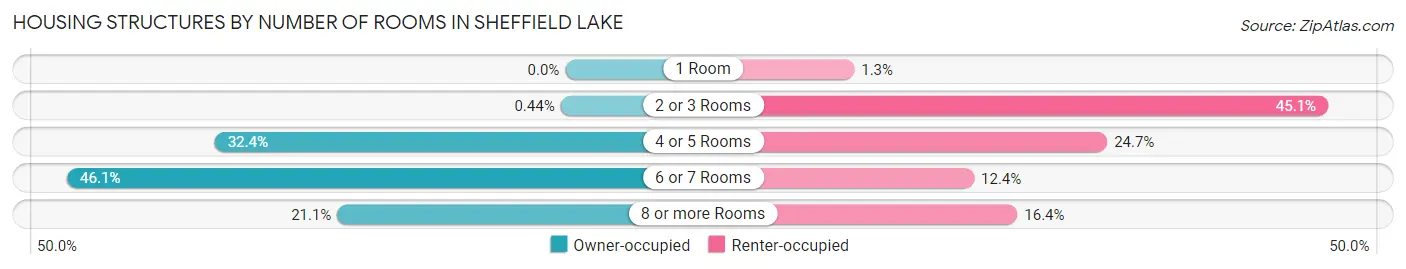
| Number of Rooms | Owner-occupied | Renter-occupied |
| 1 Room | 0 (0.0%) | 13 (1.3%) |
| 2 or 3 Rooms | 14 (0.4%) | 440 (45.1%) |
| 4 or 5 Rooms | 1,028 (32.4%) | 241 (24.7%) |
| 6 or 7 Rooms | 1,461 (46.1%) | 121 (12.4%) |
| 8 or more Rooms | 669 (21.1%) | 160 (16.4%) |
| Total | 3,172 (100.0%) | 975 (100.0%) |
Housing Structure by Heating Type in Sheffield Lake
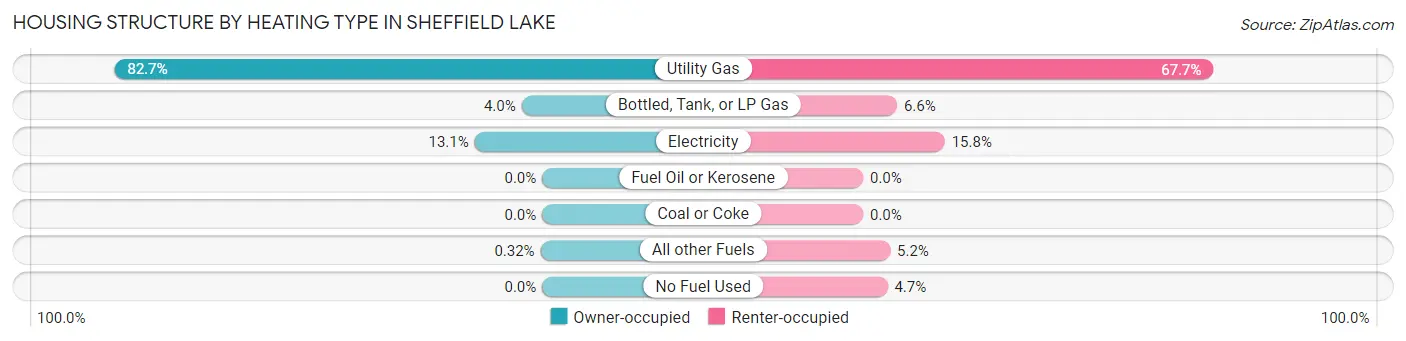
| Heating Type | Owner-occupied | Renter-occupied |
| Utility Gas | 2,622 (82.7%) | 660 (67.7%) |
| Bottled, Tank, or LP Gas | 126 (4.0%) | 64 (6.6%) |
| Electricity | 414 (13.1%) | 154 (15.8%) |
| Fuel Oil or Kerosene | 0 (0.0%) | 0 (0.0%) |
| Coal or Coke | 0 (0.0%) | 0 (0.0%) |
| All other Fuels | 10 (0.3%) | 51 (5.2%) |
| No Fuel Used | 0 (0.0%) | 46 (4.7%) |
| Total | 3,172 (100.0%) | 975 (100.0%) |
Household Vehicle Usage in Sheffield Lake
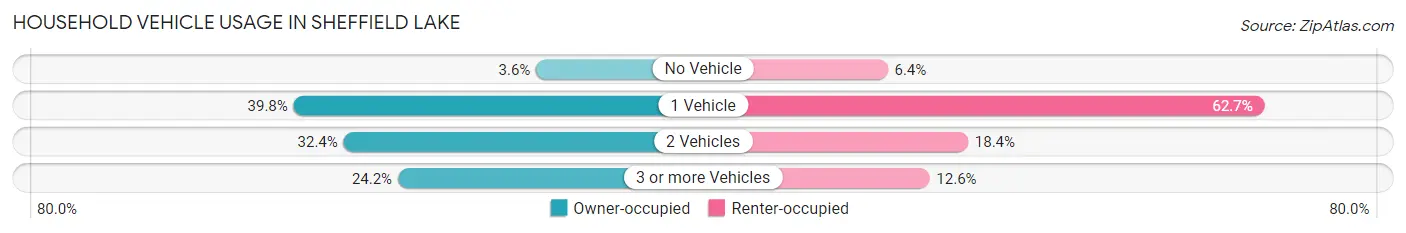
| Vehicles per Household | Owner-occupied | Renter-occupied |
| No Vehicle | 114 (3.6%) | 62 (6.4%) |
| 1 Vehicle | 1,263 (39.8%) | 611 (62.7%) |
| 2 Vehicles | 1,026 (32.4%) | 179 (18.4%) |
| 3 or more Vehicles | 769 (24.2%) | 123 (12.6%) |
| Total | 3,172 (100.0%) | 975 (100.0%) |
Real Estate & Mortgages in Sheffield Lake
Real Estate and Mortgage Overview in Sheffield Lake
| Characteristic | Without Mortgage | With Mortgage |
| Housing Units | 1,369 | 1,803 |
| Median Property Value | $105,500 | $159,000 |
| Median Household Income | $52,453 | $220 |
| Monthly Housing Costs | $431 | $35 |
| Real Estate Taxes | $1,971 | $75 |
Property Value by Mortgage Status in Sheffield Lake
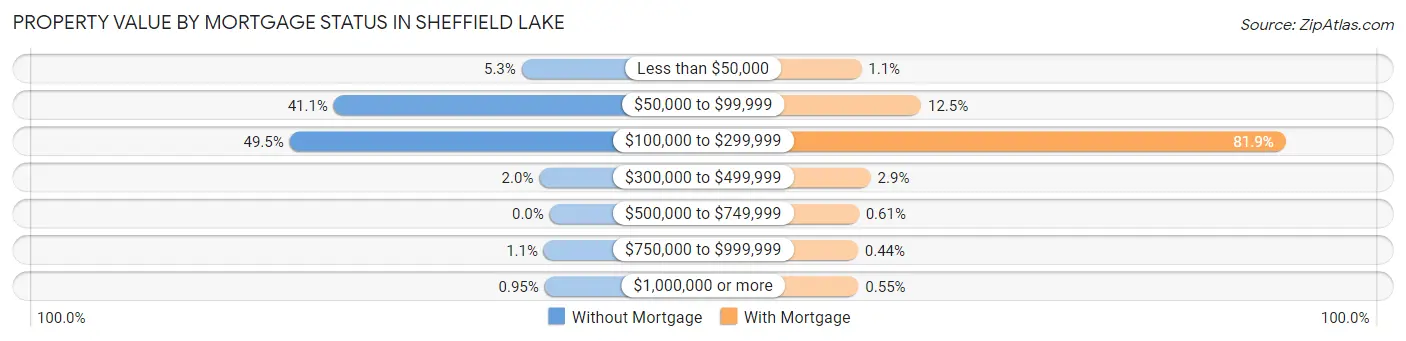
| Property Value | Without Mortgage | With Mortgage |
| Less than $50,000 | 73 (5.3%) | 20 (1.1%) |
| $50,000 to $99,999 | 563 (41.1%) | 225 (12.5%) |
| $100,000 to $299,999 | 678 (49.5%) | 1,477 (81.9%) |
| $300,000 to $499,999 | 27 (2.0%) | 52 (2.9%) |
| $500,000 to $749,999 | 0 (0.0%) | 11 (0.6%) |
| $750,000 to $999,999 | 15 (1.1%) | 8 (0.4%) |
| $1,000,000 or more | 13 (0.9%) | 10 (0.5%) |
| Total | 1,369 (100.0%) | 1,803 (100.0%) |
Household Income by Mortgage Status in Sheffield Lake
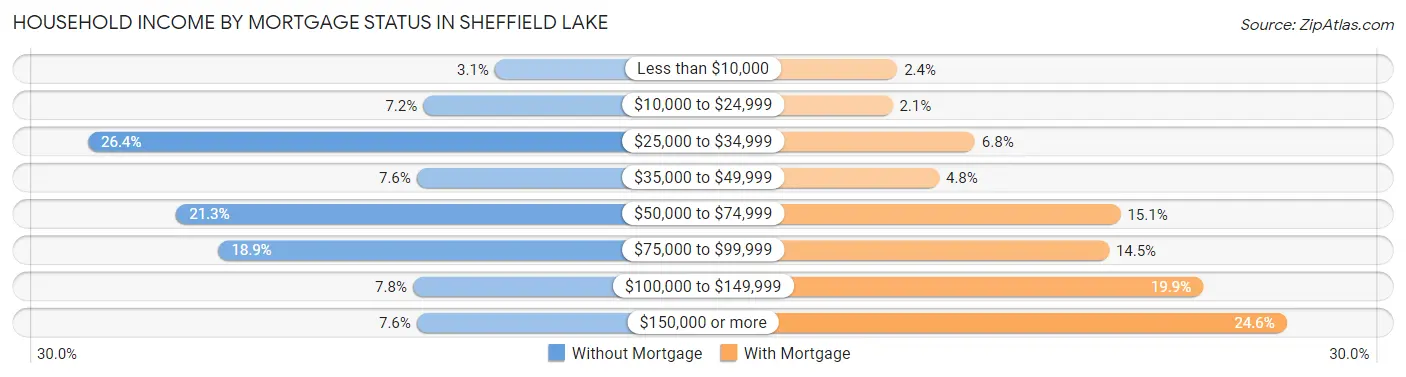
| Household Income | Without Mortgage | With Mortgage |
| Less than $10,000 | 43 (3.1%) | 43 (2.4%) |
| $10,000 to $24,999 | 99 (7.2%) | 38 (2.1%) |
| $25,000 to $34,999 | 361 (26.4%) | 123 (6.8%) |
| $35,000 to $49,999 | 104 (7.6%) | 86 (4.8%) |
| $50,000 to $74,999 | 292 (21.3%) | 273 (15.1%) |
| $75,000 to $99,999 | 259 (18.9%) | 261 (14.5%) |
| $100,000 to $149,999 | 107 (7.8%) | 358 (19.9%) |
| $150,000 or more | 104 (7.6%) | 444 (24.6%) |
| Total | 1,369 (100.0%) | 1,803 (100.0%) |
Property Value to Household Income Ratio in Sheffield Lake
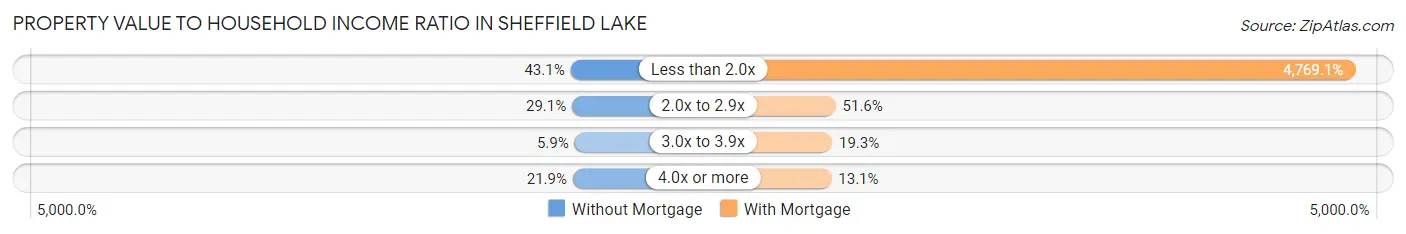
| Value-to-Income Ratio | Without Mortgage | With Mortgage |
| Less than 2.0x | 590 (43.1%) | 85,987 (4,769.1%) |
| 2.0x to 2.9x | 398 (29.1%) | 931 (51.6%) |
| 3.0x to 3.9x | 81 (5.9%) | 347 (19.3%) |
| 4.0x or more | 300 (21.9%) | 236 (13.1%) |
| Total | 1,369 (100.0%) | 1,803 (100.0%) |
Real Estate Taxes by Mortgage Status in Sheffield Lake
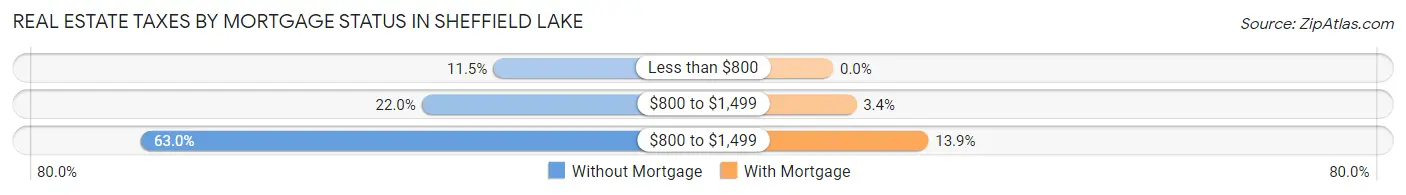
| Property Taxes | Without Mortgage | With Mortgage |
| Less than $800 | 158 (11.5%) | 0 (0.0%) |
| $800 to $1,499 | 301 (22.0%) | 61 (3.4%) |
| $800 to $1,499 | 862 (63.0%) | 251 (13.9%) |
| Total | 1,369 (100.0%) | 1,803 (100.0%) |
Health & Disability in Sheffield Lake
Health Insurance Coverage by Age in Sheffield Lake
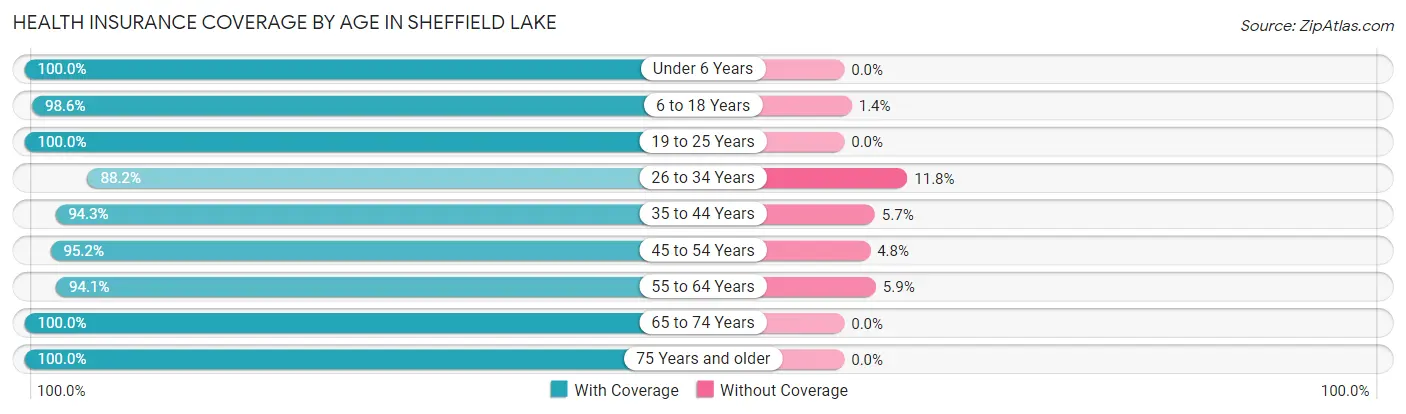
| Age Bracket | With Coverage | Without Coverage |
| Under 6 Years | 384 (100.0%) | 0 (0.0%) |
| 6 to 18 Years | 1,336 (98.6%) | 19 (1.4%) |
| 19 to 25 Years | 440 (100.0%) | 0 (0.0%) |
| 26 to 34 Years | 1,065 (88.2%) | 142 (11.8%) |
| 35 to 44 Years | 1,057 (94.3%) | 64 (5.7%) |
| 45 to 54 Years | 926 (95.2%) | 47 (4.8%) |
| 55 to 64 Years | 1,598 (94.1%) | 100 (5.9%) |
| 65 to 74 Years | 1,312 (100.0%) | 0 (0.0%) |
| 75 Years and older | 468 (100.0%) | 0 (0.0%) |
| Total | 8,586 (95.9%) | 372 (4.2%) |
Health Insurance Coverage by Citizenship Status in Sheffield Lake
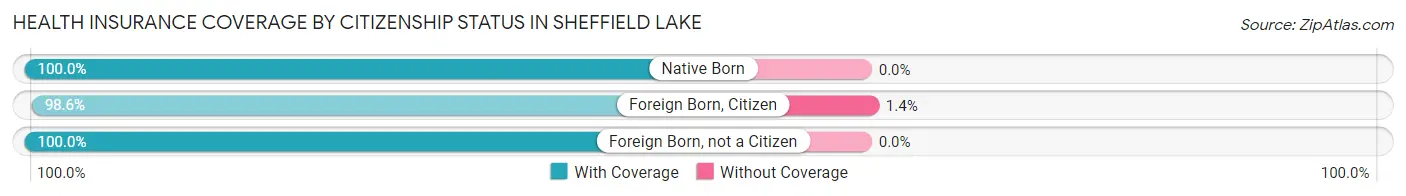
| Citizenship Status | With Coverage | Without Coverage |
| Native Born | 384 (100.0%) | 0 (0.0%) |
| Foreign Born, Citizen | 1,336 (98.6%) | 19 (1.4%) |
| Foreign Born, not a Citizen | 440 (100.0%) | 0 (0.0%) |
Health Insurance Coverage by Household Income in Sheffield Lake
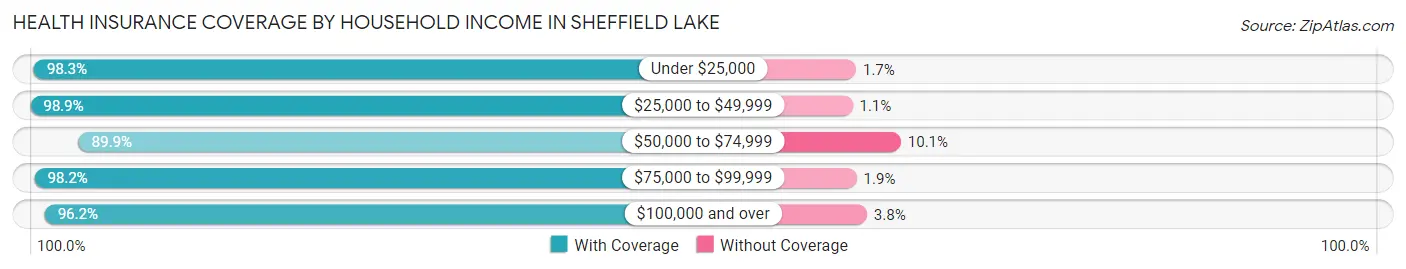
| Household Income | With Coverage | Without Coverage |
| Under $25,000 | 739 (98.3%) | 13 (1.7%) |
| $25,000 to $49,999 | 1,579 (98.9%) | 17 (1.1%) |
| $50,000 to $74,999 | 1,854 (89.9%) | 209 (10.1%) |
| $75,000 to $99,999 | 1,961 (98.2%) | 37 (1.8%) |
| $100,000 and over | 2,453 (96.2%) | 96 (3.8%) |
Public vs Private Health Insurance Coverage by Age in Sheffield Lake
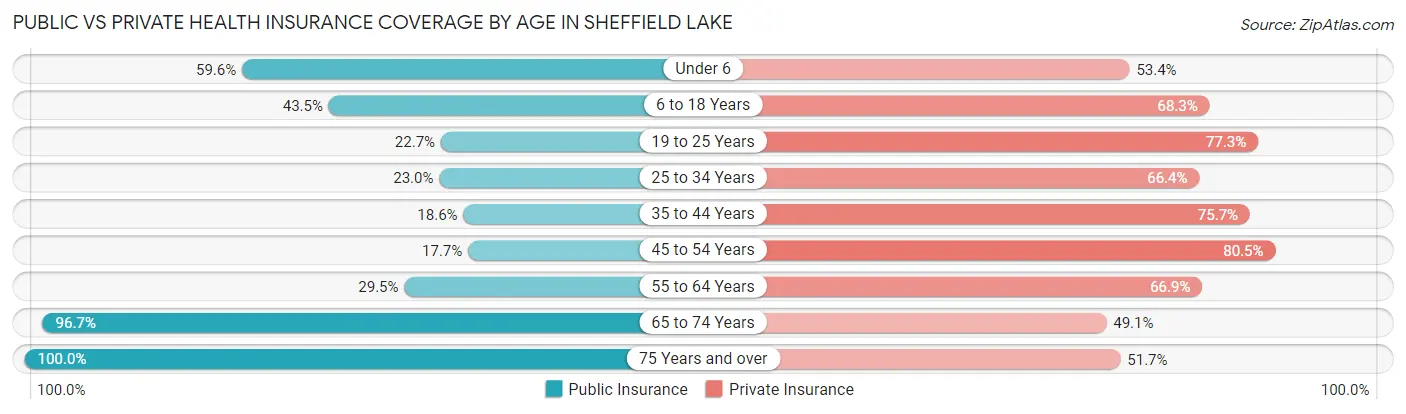
| Age Bracket | Public Insurance | Private Insurance |
| Under 6 | 229 (59.6%) | 205 (53.4%) |
| 6 to 18 Years | 590 (43.5%) | 925 (68.3%) |
| 19 to 25 Years | 100 (22.7%) | 340 (77.3%) |
| 25 to 34 Years | 278 (23.0%) | 801 (66.4%) |
| 35 to 44 Years | 208 (18.5%) | 849 (75.7%) |
| 45 to 54 Years | 172 (17.7%) | 783 (80.5%) |
| 55 to 64 Years | 501 (29.5%) | 1,136 (66.9%) |
| 65 to 74 Years | 1,268 (96.7%) | 644 (49.1%) |
| 75 Years and over | 468 (100.0%) | 242 (51.7%) |
| Total | 3,814 (42.6%) | 5,925 (66.1%) |
Disability Status by Sex by Age in Sheffield Lake
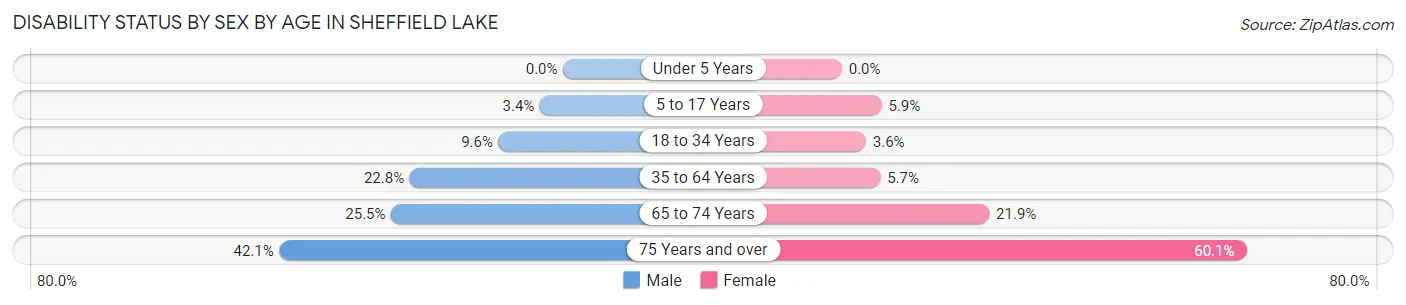
| Age Bracket | Male | Female |
| Under 5 Years | 0 (0.0%) | 0 (0.0%) |
| 5 to 17 Years | 20 (3.4%) | 40 (5.9%) |
| 18 to 34 Years | 86 (9.6%) | 32 (3.6%) |
| 35 to 64 Years | 436 (22.8%) | 107 (5.7%) |
| 65 to 74 Years | 153 (25.5%) | 156 (21.9%) |
| 75 Years and over | 59 (42.1%) | 197 (60.1%) |
Disability Class by Sex by Age in Sheffield Lake
Disability Class: Hearing Difficulty
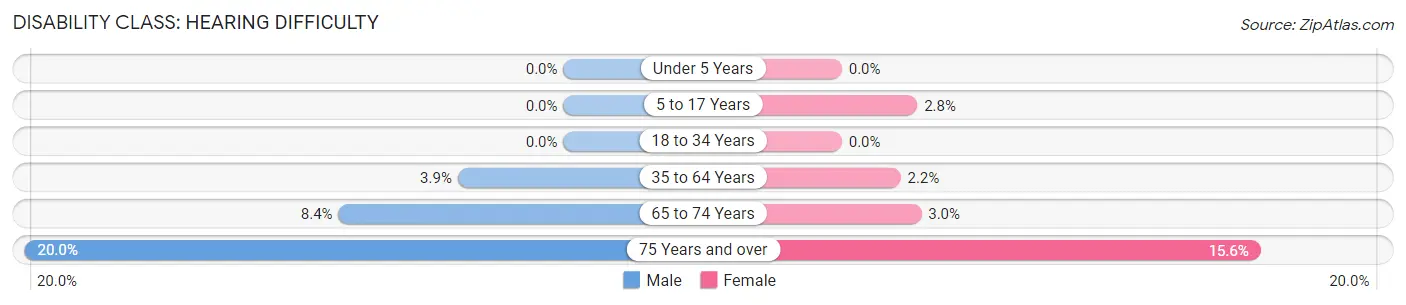
| Age Bracket | Male | Female |
| Under 5 Years | 0 (0.0%) | 0 (0.0%) |
| 5 to 17 Years | 0 (0.0%) | 19 (2.8%) |
| 18 to 34 Years | 0 (0.0%) | 0 (0.0%) |
| 35 to 64 Years | 75 (3.9%) | 41 (2.2%) |
| 65 to 74 Years | 50 (8.4%) | 21 (2.9%) |
| 75 Years and over | 28 (20.0%) | 51 (15.5%) |
Disability Class: Vision Difficulty
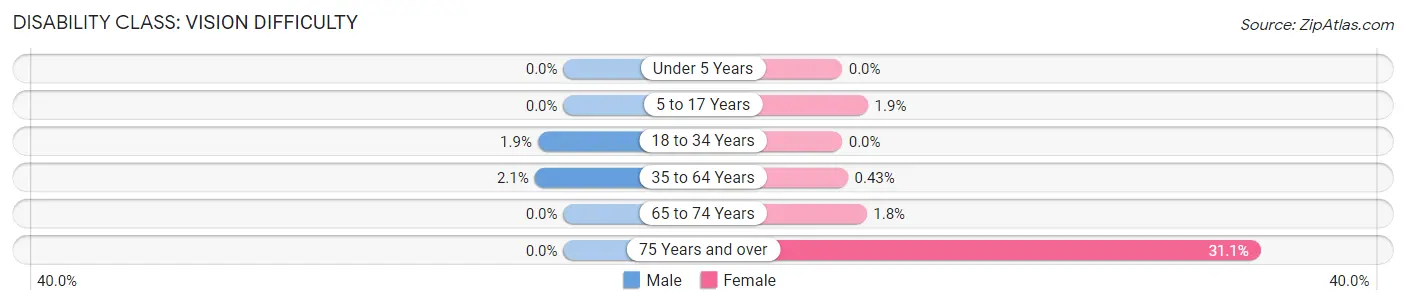
| Age Bracket | Male | Female |
| Under 5 Years | 0 (0.0%) | 0 (0.0%) |
| 5 to 17 Years | 0 (0.0%) | 13 (1.9%) |
| 18 to 34 Years | 17 (1.9%) | 0 (0.0%) |
| 35 to 64 Years | 41 (2.1%) | 8 (0.4%) |
| 65 to 74 Years | 0 (0.0%) | 13 (1.8%) |
| 75 Years and over | 0 (0.0%) | 102 (31.1%) |
Disability Class: Cognitive Difficulty
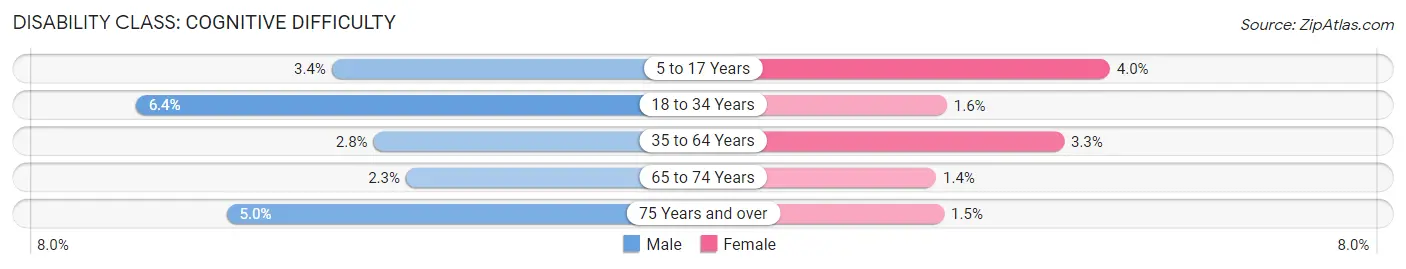
| Age Bracket | Male | Female |
| 5 to 17 Years | 20 (3.4%) | 27 (4.0%) |
| 18 to 34 Years | 57 (6.4%) | 14 (1.6%) |
| 35 to 64 Years | 54 (2.8%) | 62 (3.3%) |
| 65 to 74 Years | 14 (2.3%) | 10 (1.4%) |
| 75 Years and over | 7 (5.0%) | 5 (1.5%) |
Disability Class: Ambulatory Difficulty
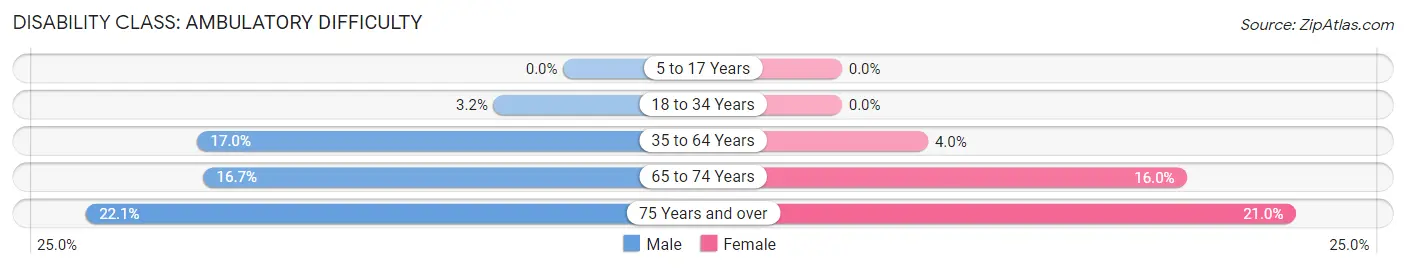
| Age Bracket | Male | Female |
| 5 to 17 Years | 0 (0.0%) | 0 (0.0%) |
| 18 to 34 Years | 29 (3.2%) | 0 (0.0%) |
| 35 to 64 Years | 325 (17.0%) | 75 (4.0%) |
| 65 to 74 Years | 100 (16.7%) | 114 (16.0%) |
| 75 Years and over | 31 (22.1%) | 69 (21.0%) |
Disability Class: Self-Care Difficulty
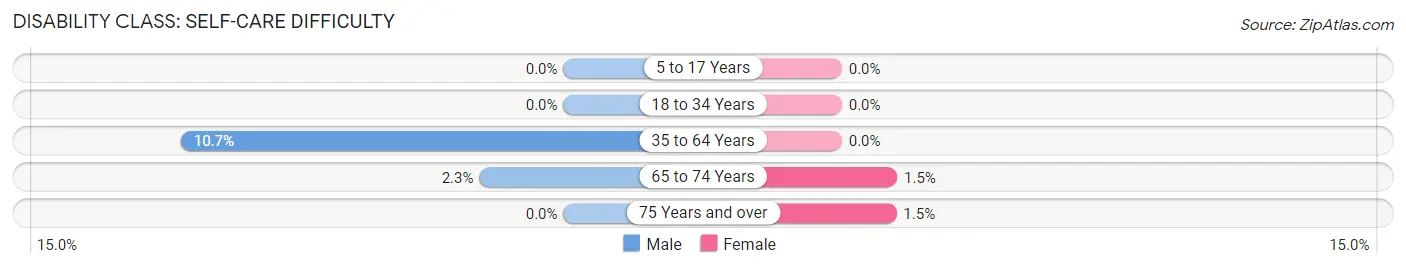
| Age Bracket | Male | Female |
| 5 to 17 Years | 0 (0.0%) | 0 (0.0%) |
| 18 to 34 Years | 0 (0.0%) | 0 (0.0%) |
| 35 to 64 Years | 204 (10.6%) | 0 (0.0%) |
| 65 to 74 Years | 14 (2.3%) | 11 (1.5%) |
| 75 Years and over | 0 (0.0%) | 5 (1.5%) |
Technology Access in Sheffield Lake
Computing Device Access in Sheffield Lake
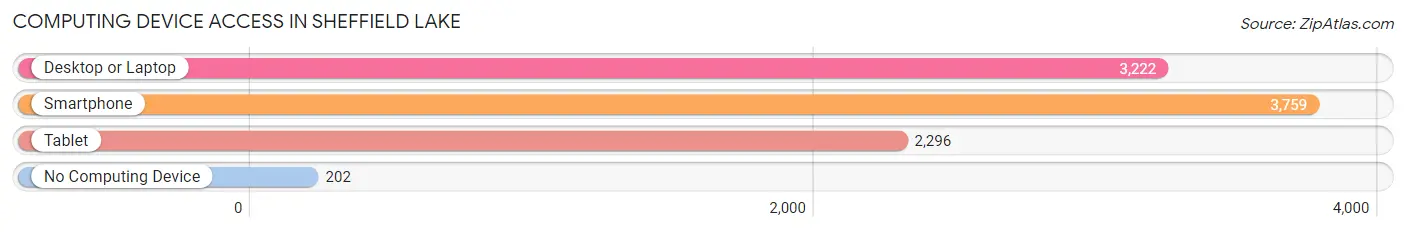
| Device Type | # Households | % Households |
| Desktop or Laptop | 3,222 | 77.7% |
| Smartphone | 3,759 | 90.6% |
| Tablet | 2,296 | 55.4% |
| No Computing Device | 202 | 4.9% |
| Total | 4,147 | 100.0% |
Internet Access in Sheffield Lake
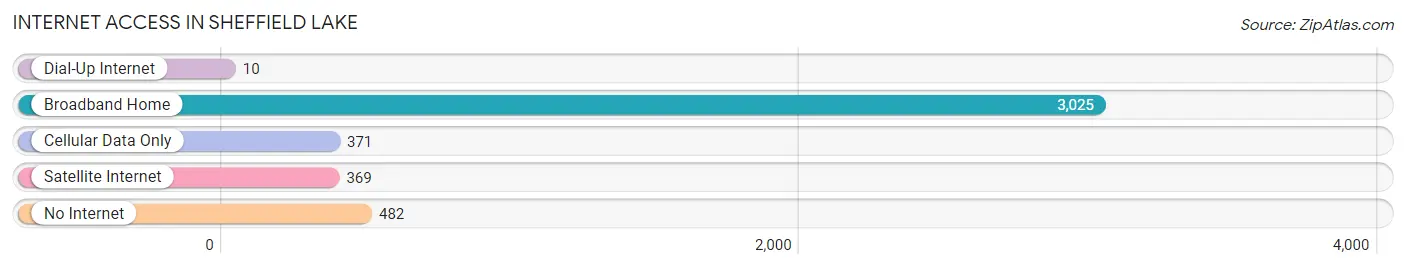
| Internet Type | # Households | % Households |
| Dial-Up Internet | 10 | 0.2% |
| Broadband Home | 3,025 | 72.9% |
| Cellular Data Only | 371 | 8.9% |
| Satellite Internet | 369 | 8.9% |
| No Internet | 482 | 11.6% |
| Total | 4,147 | 100.0% |
Sheffield Lake Summary
Sheffield Lake is a city located in Lorain County, Ohio, United States. The population was 8,919 at the 2010 census. It is part of the Cleveland-Elyria Metropolitan Statistical Area.
Geography
Sheffield Lake is located at 41 25 17 North 82 7 17 West 41 421400 82 121400
According to the United States Census Bureau, the city has a total area of 4.2 square miles (10.8 km2), of which 4.1 square miles (10.6 km2) is land and 0.1 square miles (0.2 km2) is water.
History
The area that is now Sheffield Lake was first settled in 1810 by a group of settlers from Connecticut. The settlement was originally known as "New Connecticut" and was later renamed "Sheffield" after Sheffield, England. The village was incorporated in 1915 and the name was changed to Sheffield Lake in 1923.
Economy
The economy of Sheffield Lake is largely based on manufacturing and retail. The city is home to several manufacturing companies, including a steel mill, a plastics plant, and a paper mill. Retail businesses in the city include a variety of restaurants, grocery stores, and other retail outlets.
Demographics
As of the census of 2010, there were 8,919 people, 3,541 households, and 2,521 families residing in the city. The population density was 2,179.2 people per square mile (841.3/km2). There were 3,845 housing units at an average density of 937.2 per square mile (362.3/km2). The racial makeup of the city was 94.2% White, 1.7% African American, 0.3% Native American, 0.7% Asian, 0.1% Pacific Islander, 1.2% from other races, and 2.0% from two or more races. Hispanic or Latino of any race were 3.7% of the population.
There were 3,541 households, out of which 32.2% had children under the age of 18 living with them, 53.2% were married couples living together, 12.2% had a female householder with no husband present, and 29.7% were non-families. 24.7% of all households were made up of individuals, and 10.2% had someone living alone who was 65 years of age or older. The average household size was 2.53 and the average family size was 3.02.
In the city, the population was spread out, with 25.2% under the age of 18, 7.7% from 18 to 24, 28.7% from 25 to 44, 24.2% from 45 to 64, and 14.2% who were 65 years of age or older. The median age was 38 years. For every 100 females, there were 93.2 males. For every 100 females age 18 and over, there were 89.3 males.
The median income for a household in the city was $45,945, and the median income for a family was $54,945. Males had a median income of $41,945 versus $30,945 for females. The per capita income for the city was $21,945. About 5.2% of families and 7.2% of the population were below the poverty line, including 9.2% of those under age 18 and 6.2% of those age 65 or over.
Common Questions
What is Per Capita Income in Sheffield Lake?
Per Capita income in Sheffield Lake is $37,181.
What is the Median Family Income in Sheffield Lake?
Median Family Income in Sheffield Lake is $78,520.
What is the Median Household income in Sheffield Lake?
Median Household Income in Sheffield Lake is $61,699.
What is Income or Wage Gap in Sheffield Lake?
Income or Wage Gap in Sheffield Lake is 24.4%.
Women in Sheffield Lake earn 75.6 cents for every dollar earned by a man.
What is Family Income Deficit in Sheffield Lake?
Family Income Deficit in Sheffield Lake is $13,445.
Families that are below poverty line in Sheffield Lake earn $13,445 less on average than the poverty threshold level.
What is Inequality or Gini Index in Sheffield Lake?
Inequality or Gini Index in Sheffield Lake is 0.40.
What is the Total Population of Sheffield Lake?
Total Population of Sheffield Lake is 8,958.
What is the Total Male Population of Sheffield Lake?
Total Male Population of Sheffield Lake is 4,257.
What is the Total Female Population of Sheffield Lake?
Total Female Population of Sheffield Lake is 4,701.
What is the Ratio of Males per 100 Females in Sheffield Lake?
There are 90.56 Males per 100 Females in Sheffield Lake.
What is the Ratio of Females per 100 Males in Sheffield Lake?
There are 110.43 Females per 100 Males in Sheffield Lake.
What is the Median Population Age in Sheffield Lake?
Median Population Age in Sheffield Lake is 44.8 Years.
What is the Average Family Size in Sheffield Lake
Average Family Size in Sheffield Lake is 2.8 People.
What is the Average Household Size in Sheffield Lake
Average Household Size in Sheffield Lake is 2.2 People.
How Large is the Labor Force in Sheffield Lake?
There are 5,035 People in the Labor Forcein in Sheffield Lake.
What is the Percentage of People in the Labor Force in Sheffield Lake?
66.1% of People are in the Labor Force in Sheffield Lake.
What is the Unemployment Rate in Sheffield Lake?
Unemployment Rate in Sheffield Lake is 3.2%.