Salesville, OH Map & Demographics
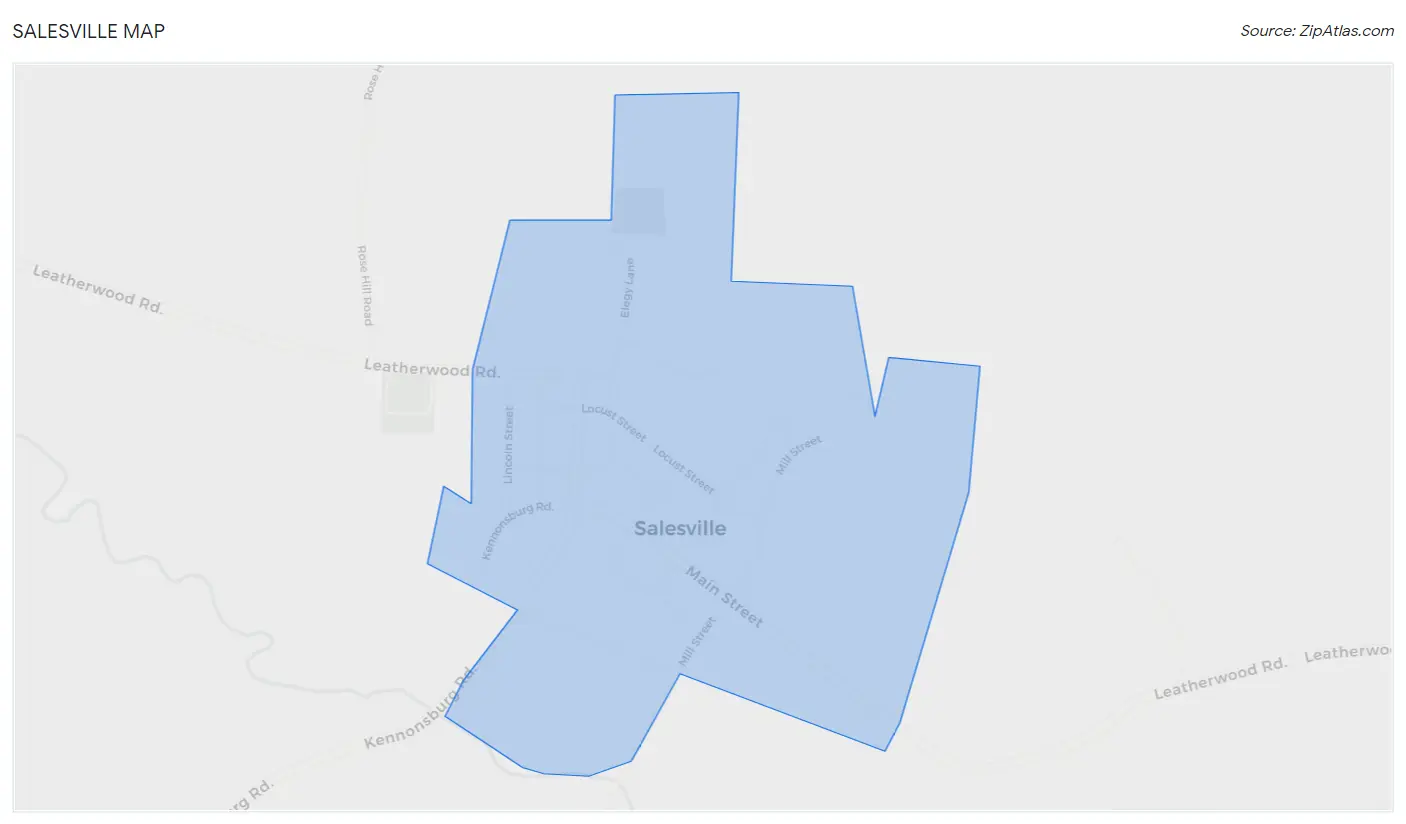
Salesville Map
Salesville Overview
$31,763
PER CAPITA INCOME
$88,750
AVG FAMILY INCOME
$36,453
AVG HOUSEHOLD INCOME
0.37
INEQUALITY / GINI INDEX
150
TOTAL POPULATION
106
MALE POPULATION
44
FEMALE POPULATION
240.91
MALES / 100 FEMALES
41.51
FEMALES / 100 MALES
69.3
MEDIAN AGE
2.0
AVG FAMILY SIZE
1.3
AVG HOUSEHOLD SIZE
81
LABOR FORCE [ PEOPLE ]
54.4%
PERCENT IN LABOR FORCE
Salesville Zip Codes
Salesville Area Codes
Income in Salesville
Income Overview in Salesville
Per Capita Income in Salesville is $31,763, while median incomes of families and households are $88,750 and $36,453 respectively.
| Characteristic | Number | Measure |
| Per Capita Income | 150 | $31,763 |
| Median Family Income | 38 | $88,750 |
| Mean Family Income | 38 | $88,232 |
| Median Household Income | 112 | $36,453 |
| Mean Household Income | 112 | $47,929 |
| Income Deficit | 38 | $0 |
| Wage / Income Gap (%) | 150 | 0.00% |
| Wage / Income Gap ($) | 150 | 100.00¢ per $1 |
| Gini / Inequality Index | 150 | 0.37 |
Earnings by Sex in Salesville
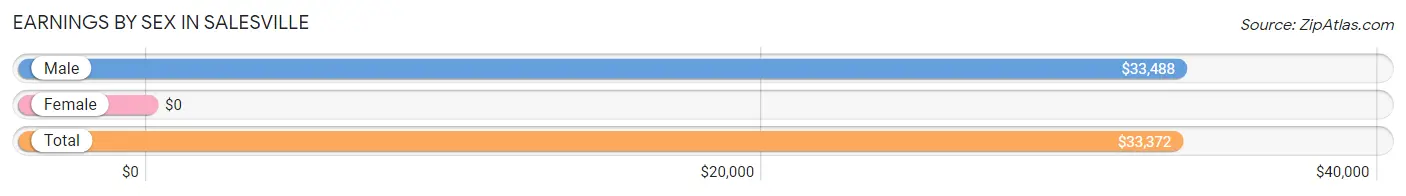
| Sex | Number | Average Earnings |
| Male | 56 (68.3%) | $33,488 |
| Female | 26 (31.7%) | $0 |
| Total | 82 (100.0%) | $33,372 |
Earnings by Sex by Income Bracket in Salesville
The most common earnings brackets in Salesville are $30,000 to $34,999 for men (43 | 76.8%) and $7,500 to $9,999 for women (13 | 50.0%).
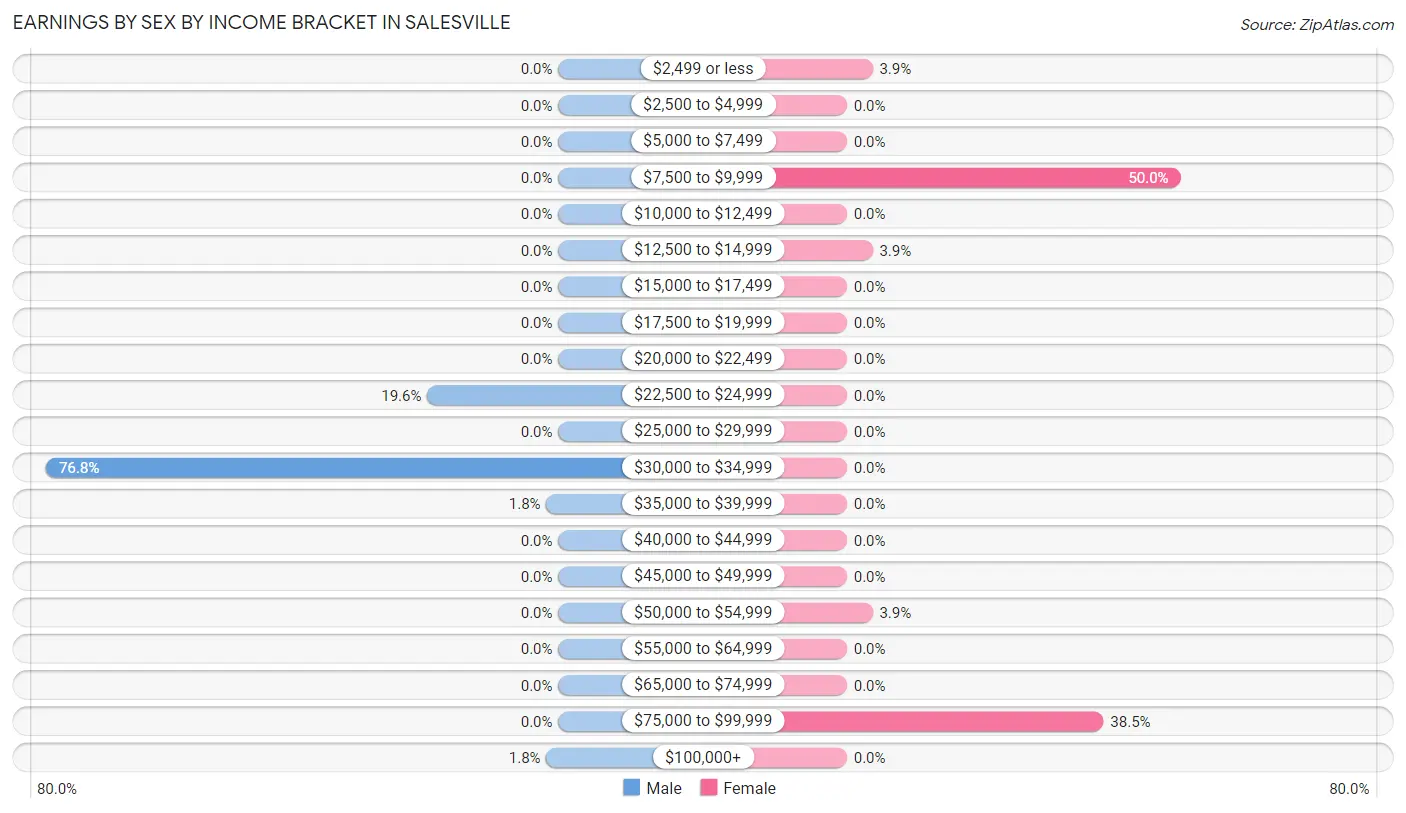
| Income | Male | Female |
| $2,499 or less | 0 (0.0%) | 1 (3.8%) |
| $2,500 to $4,999 | 0 (0.0%) | 0 (0.0%) |
| $5,000 to $7,499 | 0 (0.0%) | 0 (0.0%) |
| $7,500 to $9,999 | 0 (0.0%) | 13 (50.0%) |
| $10,000 to $12,499 | 0 (0.0%) | 0 (0.0%) |
| $12,500 to $14,999 | 0 (0.0%) | 1 (3.8%) |
| $15,000 to $17,499 | 0 (0.0%) | 0 (0.0%) |
| $17,500 to $19,999 | 0 (0.0%) | 0 (0.0%) |
| $20,000 to $22,499 | 0 (0.0%) | 0 (0.0%) |
| $22,500 to $24,999 | 11 (19.6%) | 0 (0.0%) |
| $25,000 to $29,999 | 0 (0.0%) | 0 (0.0%) |
| $30,000 to $34,999 | 43 (76.8%) | 0 (0.0%) |
| $35,000 to $39,999 | 1 (1.8%) | 0 (0.0%) |
| $40,000 to $44,999 | 0 (0.0%) | 0 (0.0%) |
| $45,000 to $49,999 | 0 (0.0%) | 0 (0.0%) |
| $50,000 to $54,999 | 0 (0.0%) | 1 (3.8%) |
| $55,000 to $64,999 | 0 (0.0%) | 0 (0.0%) |
| $65,000 to $74,999 | 0 (0.0%) | 0 (0.0%) |
| $75,000 to $99,999 | 0 (0.0%) | 10 (38.5%) |
| $100,000+ | 1 (1.8%) | 0 (0.0%) |
| Total | 56 (100.0%) | 26 (100.0%) |
Earnings by Sex by Educational Attainment in Salesville
| Educational Attainment | Male Income | Female Income |
| Less than High School | - | - |
| High School Diploma | - | - |
| College or Associate's Degree | - | - |
| Bachelor's Degree | - | - |
| Graduate Degree | - | - |
| Total | $33,459 | $0 |
Family Income in Salesville
Family Income Brackets in Salesville
According to the Salesville family income data, there are 18 families falling into the $100,000 to $149,999 income range, which is the most common income bracket and makes up 47.4% of all families.
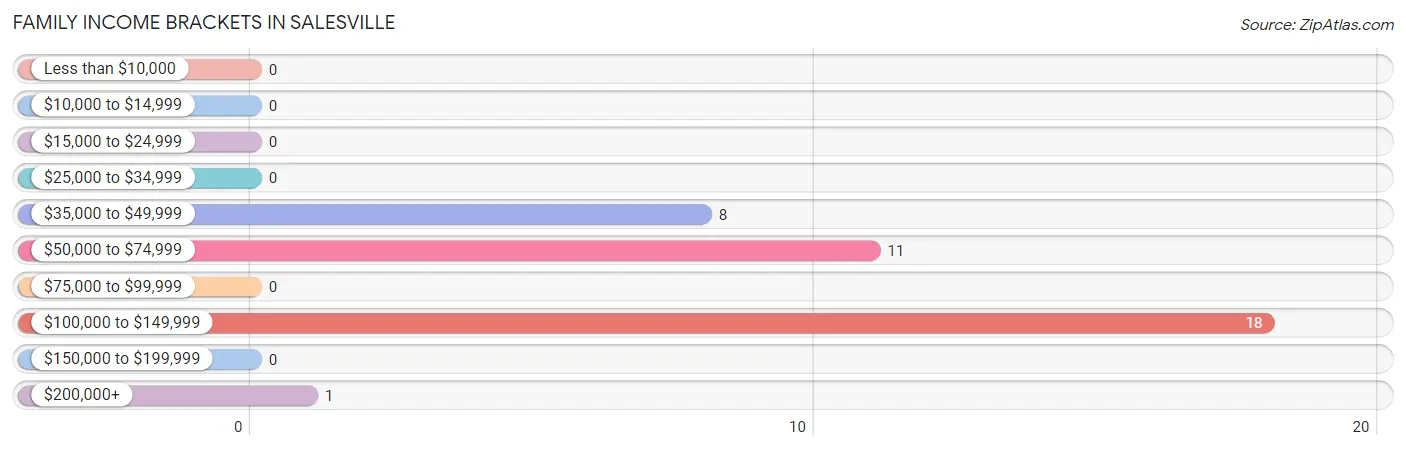
| Income Bracket | # Families | % Families |
| Less than $10,000 | 0 | 0.0% |
| $10,000 to $14,999 | 0 | 0.0% |
| $15,000 to $24,999 | 0 | 0.0% |
| $25,000 to $34,999 | 0 | 0.0% |
| $35,000 to $49,999 | 8 | 21.1% |
| $50,000 to $74,999 | 11 | 28.9% |
| $75,000 to $99,999 | 0 | 0.0% |
| $100,000 to $149,999 | 18 | 47.4% |
| $150,000 to $199,999 | 0 | 0.0% |
| $200,000+ | 1 | 2.6% |
Family Income by Famaliy Size in Salesville
| Income Bracket | # Families | Median Income |
| 2-Person Families | 37 (97.4%) | $0 |
| 3-Person Families | 0 (0.0%) | $0 |
| 4-Person Families | 0 (0.0%) | $0 |
| 5-Person Families | 0 (0.0%) | $0 |
| 6-Person Families | 1 (2.6%) | $0 |
| 7+ Person Families | 0 (0.0%) | $0 |
| Total | 38 (100.0%) | $88,750 |
Family Income by Number of Earners in Salesville
| Number of Earners | # Families | Median Income |
| No Earners | 0 (0.0%) | $0 |
| 1 Earner | 37 (97.4%) | $0 |
| 2 Earners | 0 (0.0%) | $0 |
| 3+ Earners | 1 (2.6%) | $0 |
| Total | 38 (100.0%) | $88,750 |
Household Income in Salesville
Household Income Brackets in Salesville
With 51 households falling in the category, the $35,000 to $49,999 income range is the most frequent in Salesville, accounting for 45.5% of all households.
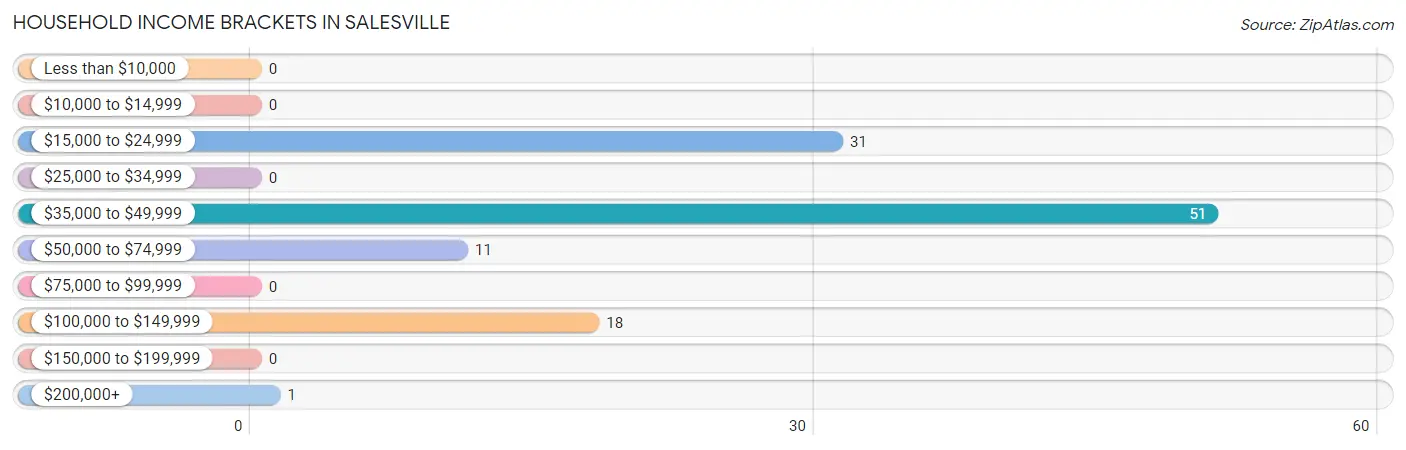
| Income Bracket | # Households | % Households |
| Less than $10,000 | 0 | 0.0% |
| $10,000 to $14,999 | 0 | 0.0% |
| $15,000 to $24,999 | 31 | 27.7% |
| $25,000 to $34,999 | 0 | 0.0% |
| $35,000 to $49,999 | 51 | 45.5% |
| $50,000 to $74,999 | 11 | 9.8% |
| $75,000 to $99,999 | 0 | 0.0% |
| $100,000 to $149,999 | 18 | 16.1% |
| $150,000 to $199,999 | 0 | 0.0% |
| $200,000+ | 1 | 0.9% |
Household Income by Householder Age in Salesville
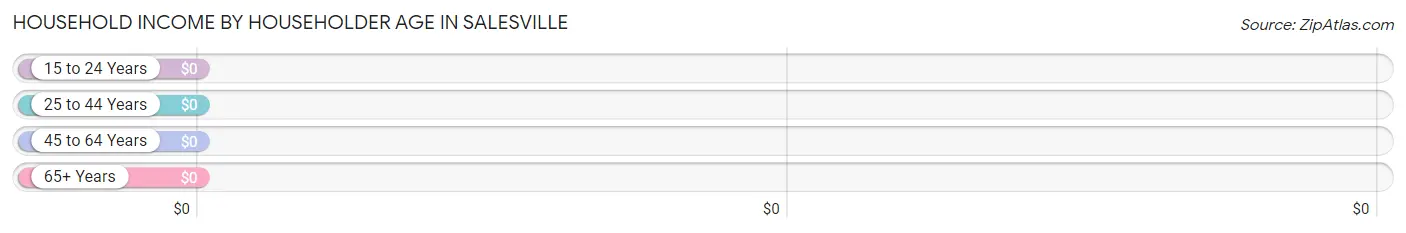
| Income Bracket | # Households | Median Income |
| 15 to 24 Years | 0 (0.0%) | $0 |
| 25 to 44 Years | 0 (0.0%) | $0 |
| 45 to 64 Years | 44 (39.3%) | $0 |
| 65+ Years | 68 (60.7%) | $0 |
| Total | 112 (100.0%) | $36,453 |
Poverty in Salesville
Income Below Poverty by Sex and Age in Salesville
| Age Bracket | Male | Female |
| Under 5 Years | 0 (0.0%) | 0 (0.0%) |
| 5 Years | 0 (0.0%) | 0 (0.0%) |
| 6 to 11 Years | 0 (0.0%) | 0 (0.0%) |
| 12 to 14 Years | 0 (0.0%) | 0 (0.0%) |
| 15 Years | 0 (0.0%) | 0 (0.0%) |
| 16 and 17 Years | 0 (0.0%) | 0 (0.0%) |
| 18 to 24 Years | 0 (0.0%) | 0 (0.0%) |
| 25 to 34 Years | 0 (0.0%) | 0 (0.0%) |
| 35 to 44 Years | 0 (0.0%) | 0 (0.0%) |
| 45 to 54 Years | 0 (0.0%) | 0 (0.0%) |
| 55 to 64 Years | 0 (0.0%) | 0 (0.0%) |
| 65 to 74 Years | 0 (0.0%) | 0 (0.0%) |
| 75 Years and over | 0 (0.0%) | 0 (0.0%) |
| Total | 0 (0.0%) | 0 (0.0%) |
Income Above Poverty by Sex and Age in Salesville
According to the poverty statistics in Salesville, males aged under 5 years and females aged 18 to 24 years are the age groups that are most secure financially, with 100.0% of males and 100.0% of females in these age groups living above the poverty line.
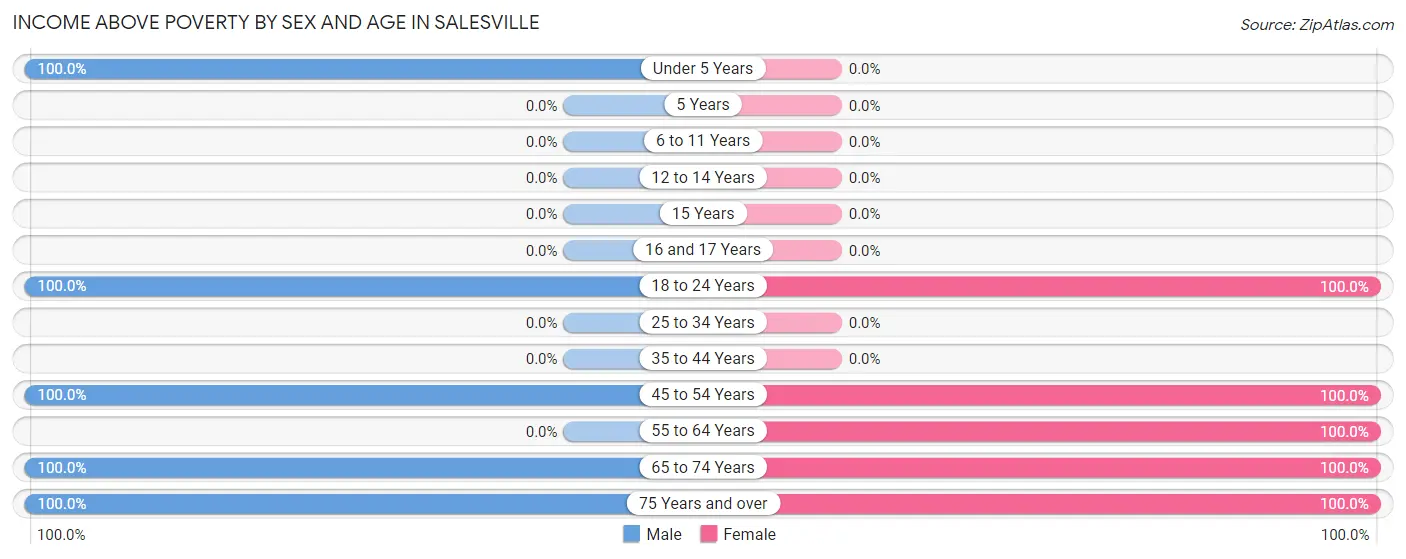
| Age Bracket | Male | Female |
| Under 5 Years | 1 (100.0%) | 0 (0.0%) |
| 5 Years | 0 (0.0%) | 0 (0.0%) |
| 6 to 11 Years | 0 (0.0%) | 0 (0.0%) |
| 12 to 14 Years | 0 (0.0%) | 0 (0.0%) |
| 15 Years | 0 (0.0%) | 0 (0.0%) |
| 16 and 17 Years | 0 (0.0%) | 0 (0.0%) |
| 18 to 24 Years | 1 (100.0%) | 15 (100.0%) |
| 25 to 34 Years | 0 (0.0%) | 0 (0.0%) |
| 35 to 44 Years | 0 (0.0%) | 0 (0.0%) |
| 45 to 54 Years | 44 (100.0%) | 1 (100.0%) |
| 55 to 64 Years | 0 (0.0%) | 10 (100.0%) |
| 65 to 74 Years | 29 (100.0%) | 10 (100.0%) |
| 75 Years and over | 31 (100.0%) | 8 (100.0%) |
| Total | 106 (100.0%) | 44 (100.0%) |
Income Below Poverty Among Married-Couple Families in Salesville
| Children | Above Poverty | Below Poverty |
| No Children | 29 (100.0%) | 0 (0.0%) |
| 1 or 2 Children | 1 (100.0%) | 0 (0.0%) |
| 3 or 4 Children | 0 (0.0%) | 0 (0.0%) |
| 5 or more Children | 0 (0.0%) | 0 (0.0%) |
| Total | 30 (100.0%) | 0 (0.0%) |
Income Below Poverty Among Single-Parent Households in Salesville
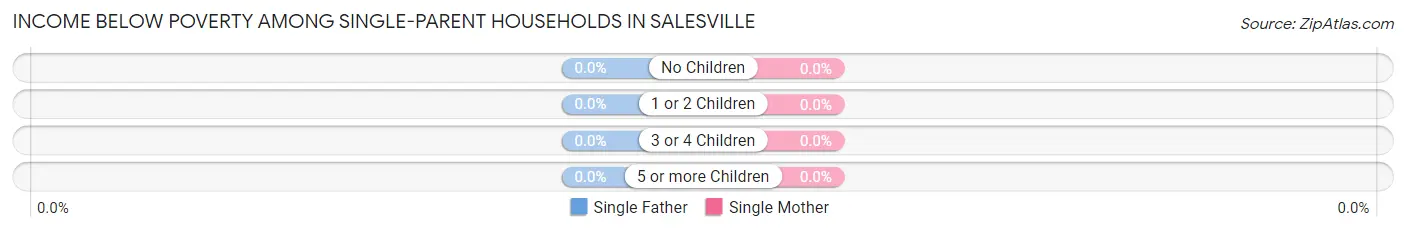
| Children | Single Father | Single Mother |
| No Children | 0 (0.0%) | 0 (0.0%) |
| 1 or 2 Children | 0 (0.0%) | 0 (0.0%) |
| 3 or 4 Children | 0 (0.0%) | 0 (0.0%) |
| 5 or more Children | 0 (0.0%) | 0 (0.0%) |
| Total | 0 (0.0%) | 0 (0.0%) |
Income Below Poverty Among Married-Couple vs Single-Parent Households in Salesville
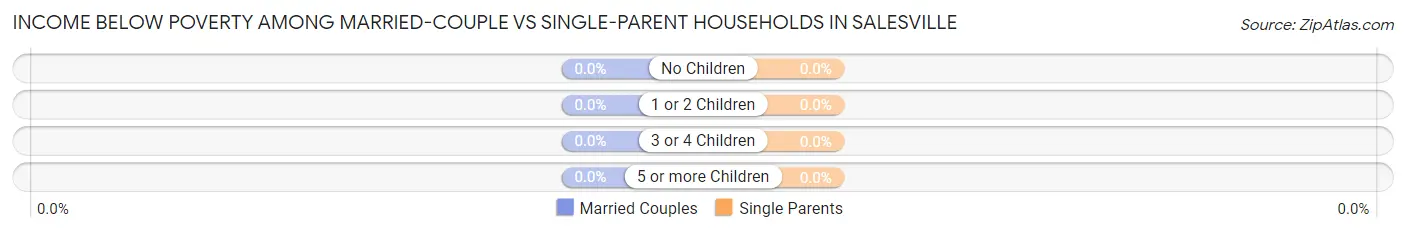
| Children | Married-Couple Families | Single-Parent Households |
| No Children | 0 (0.0%) | 0 (0.0%) |
| 1 or 2 Children | 0 (0.0%) | 0 (0.0%) |
| 3 or 4 Children | 0 (0.0%) | 0 (0.0%) |
| 5 or more Children | 0 (0.0%) | 0 (0.0%) |
| Total | 0 (0.0%) | 0 (0.0%) |
Race in Salesville
The most populous races in Salesville are White / Caucasian (140 | 93.3%), and Two or more Races (10 | 6.7%).
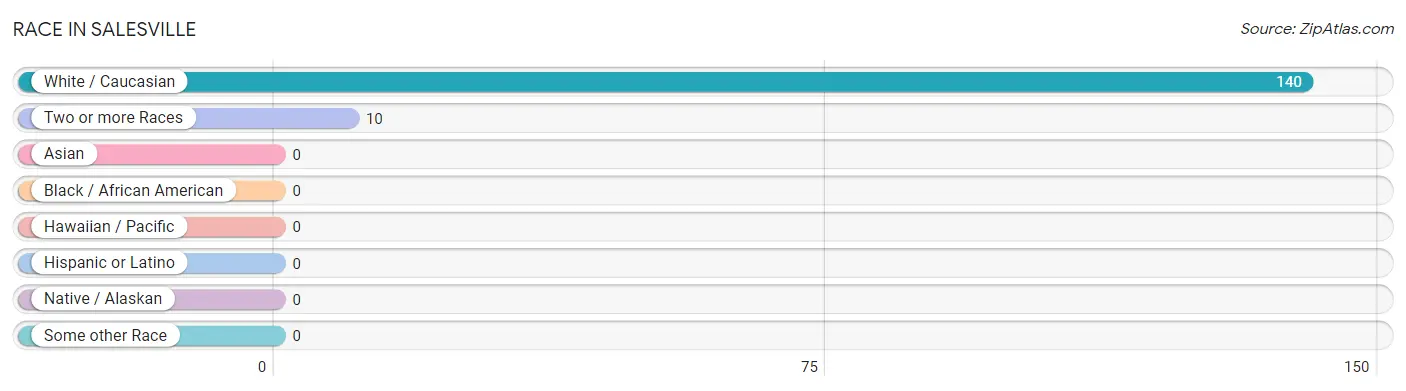
| Race | # Population | % Population |
| Asian | 0 | 0.0% |
| Black / African American | 0 | 0.0% |
| Hawaiian / Pacific | 0 | 0.0% |
| Hispanic or Latino | 0 | 0.0% |
| Native / Alaskan | 0 | 0.0% |
| White / Caucasian | 140 | 93.3% |
| Two or more Races | 10 | 6.7% |
| Some other Race | 0 | 0.0% |
| Total | 150 | 100.0% |
Ancestry in Salesville
The most populous ancestries reported in Salesville are Slovak (54 | 36.0%), Polish (43 | 28.7%), English (28 | 18.7%), American (21 | 14.0%), and German (18 | 12.0%), together accounting for 109.3% of all Salesville residents.
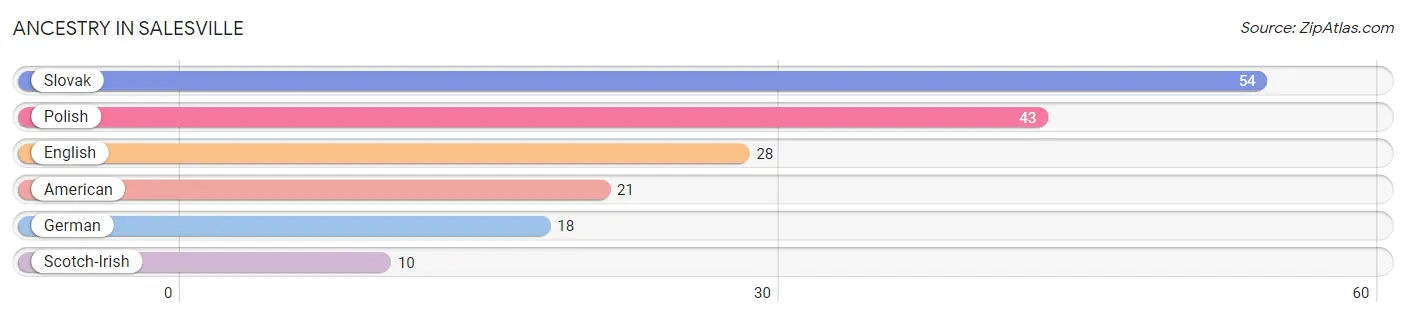
| Ancestry | # Population | % Population |
| American | 21 | 14.0% |
| English | 28 | 18.7% |
| German | 18 | 12.0% |
| Polish | 43 | 28.7% |
| Scotch-Irish | 10 | 6.7% |
| Slovak | 54 | 36.0% | View All 6 Rows |
Immigrants in Salesville

| Immigration Origin | # Population | % Population | View All 0 Rows |
Sex and Age in Salesville
Sex and Age in Salesville
The most populous age groups in Salesville are 50 to 54 Years (43 | 40.6%) for men and 15 to 19 Years (13 | 29.5%) for women.
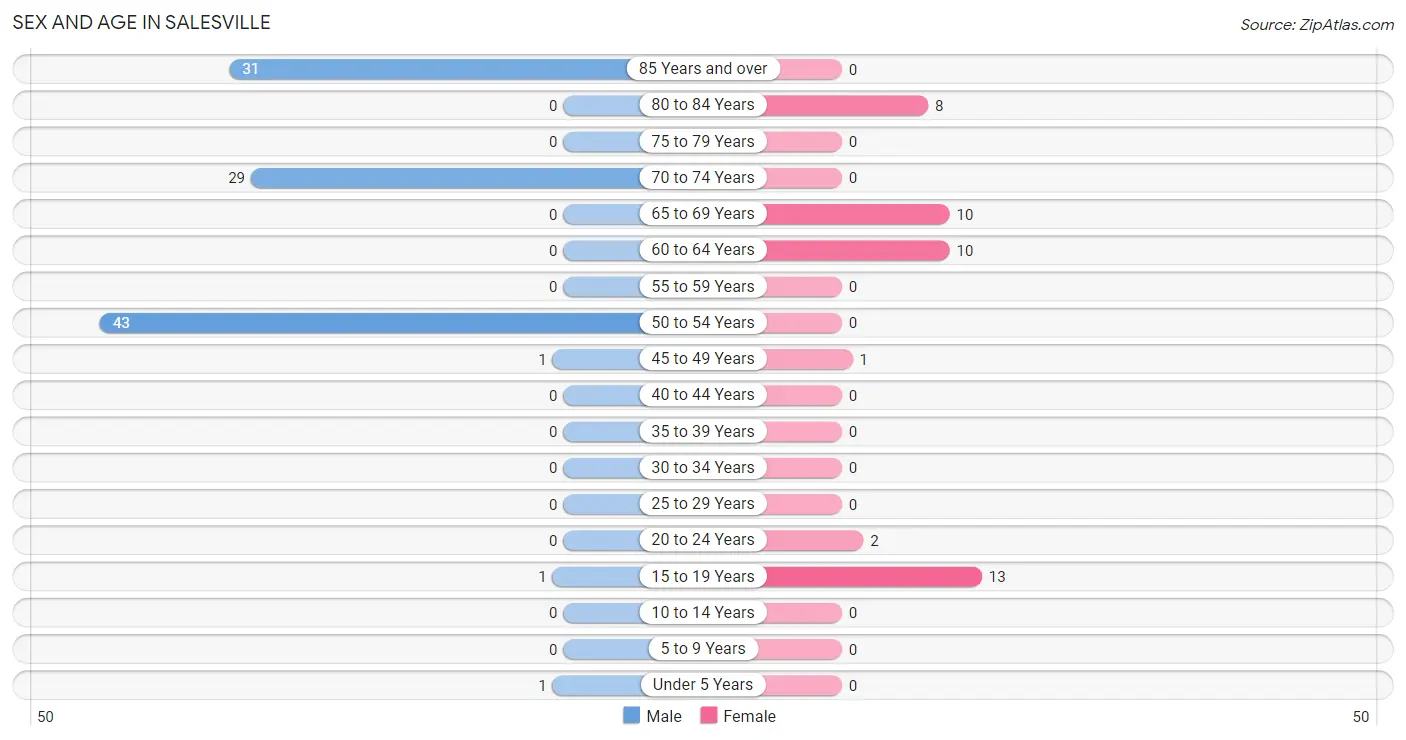
| Age Bracket | Male | Female |
| Under 5 Years | 1 (0.9%) | 0 (0.0%) |
| 5 to 9 Years | 0 (0.0%) | 0 (0.0%) |
| 10 to 14 Years | 0 (0.0%) | 0 (0.0%) |
| 15 to 19 Years | 1 (0.9%) | 13 (29.5%) |
| 20 to 24 Years | 0 (0.0%) | 2 (4.5%) |
| 25 to 29 Years | 0 (0.0%) | 0 (0.0%) |
| 30 to 34 Years | 0 (0.0%) | 0 (0.0%) |
| 35 to 39 Years | 0 (0.0%) | 0 (0.0%) |
| 40 to 44 Years | 0 (0.0%) | 0 (0.0%) |
| 45 to 49 Years | 1 (0.9%) | 1 (2.3%) |
| 50 to 54 Years | 43 (40.6%) | 0 (0.0%) |
| 55 to 59 Years | 0 (0.0%) | 0 (0.0%) |
| 60 to 64 Years | 0 (0.0%) | 10 (22.7%) |
| 65 to 69 Years | 0 (0.0%) | 10 (22.7%) |
| 70 to 74 Years | 29 (27.4%) | 0 (0.0%) |
| 75 to 79 Years | 0 (0.0%) | 0 (0.0%) |
| 80 to 84 Years | 0 (0.0%) | 8 (18.2%) |
| 85 Years and over | 31 (29.2%) | 0 (0.0%) |
| Total | 106 (100.0%) | 44 (100.0%) |
Families and Households in Salesville
Median Family Size in Salesville
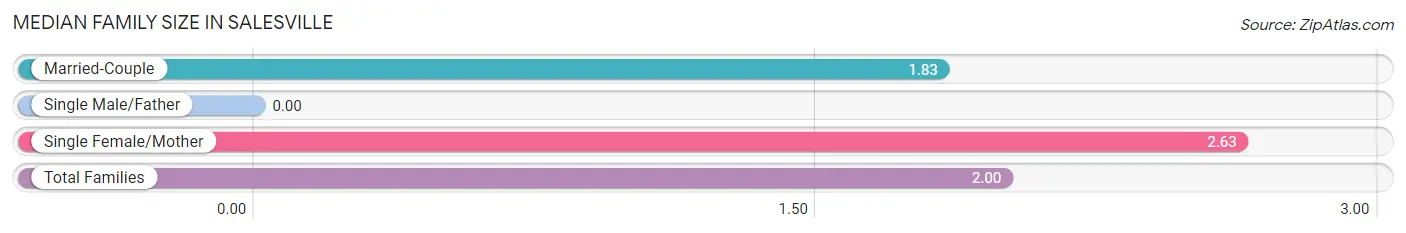
| Family Type | # Families | Family Size |
| Married-Couple | 30 (78.9%) | 1.83 |
| Single Male/Father | 0 (0.0%) | - |
| Single Female/Mother | 8 (21.0%) | 2.63 |
| Total Families | 38 (100.0%) | 2.00 |
Median Household Size in Salesville
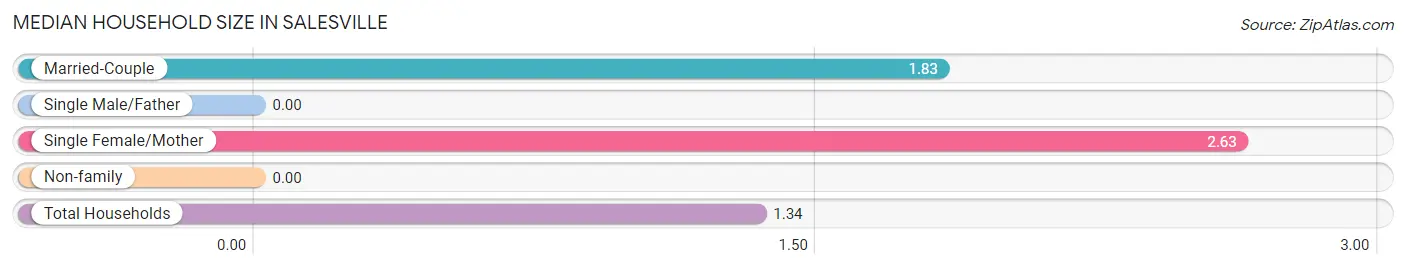
| Household Type | # Households | Household Size |
| Married-Couple | 30 (26.8%) | 1.83 |
| Single Male/Father | 0 (0.0%) | - |
| Single Female/Mother | 8 (7.1%) | 2.63 |
| Non-family | 74 (66.1%) | - |
| Total Households | 112 (100.0%) | 1.34 |
Household Size by Marriage Status in Salesville
Out of a total of 112 households in Salesville, 38 (33.9%) are family households, while 74 (66.1%) are nonfamily households. The most numerous type of family households are 2-person households, comprising 37, and the most common type of nonfamily households are 1-person households, comprising 74.
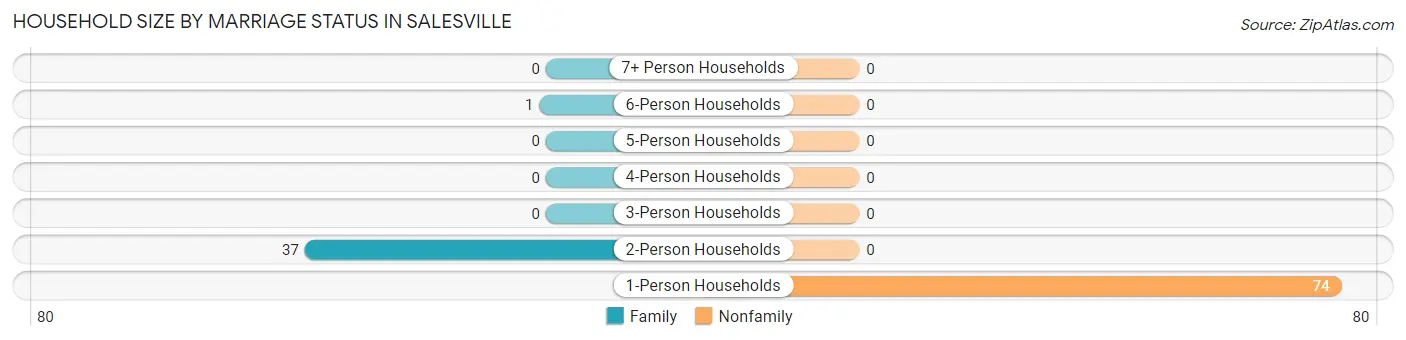
| Household Size | Family Households | Nonfamily Households |
| 1-Person Households | - | 74 (66.1%) |
| 2-Person Households | 37 (33.0%) | 0 (0.0%) |
| 3-Person Households | 0 (0.0%) | 0 (0.0%) |
| 4-Person Households | 0 (0.0%) | 0 (0.0%) |
| 5-Person Households | 0 (0.0%) | 0 (0.0%) |
| 6-Person Households | 1 (0.9%) | 0 (0.0%) |
| 7+ Person Households | 0 (0.0%) | 0 (0.0%) |
| Total | 38 (33.9%) | 74 (66.1%) |
Female Fertility in Salesville
Fertility by Age in Salesville
Average fertility rate in Salesville is 125.0 births per 1,000 women. Women in the age bracket of 20 to 34 years have the highest fertility rate with 1,000.0 births per 1,000 women. Women in the age bracket of 20 to 34 years acount for 100.0% of all women with births.
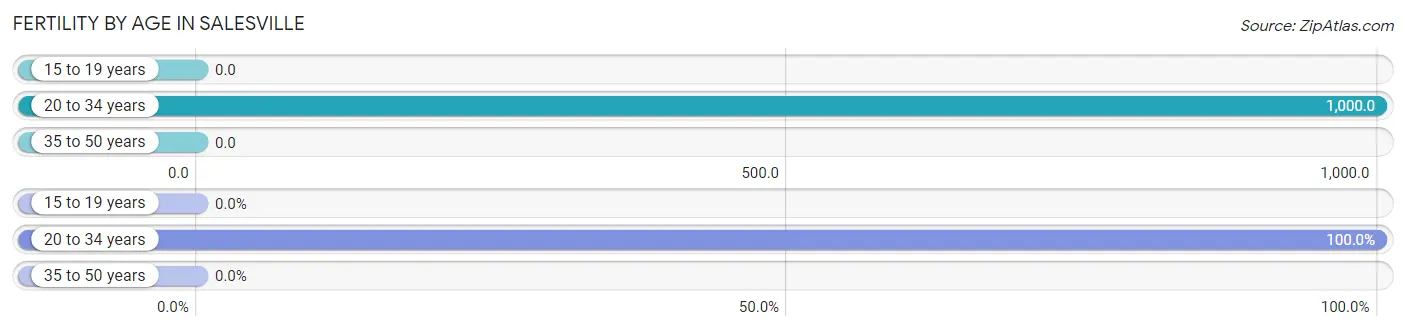
| Age Bracket | Women with Births | Births / 1,000 Women |
| 15 to 19 years | 0 (0.0%) | 0.0 |
| 20 to 34 years | 2 (100.0%) | 1,000.0 |
| 35 to 50 years | 0 (0.0%) | 0.0 |
| Total | 2 (100.0%) | 125.0 |
Fertility by Age by Marriage Status in Salesville
| Age Bracket | Married | Unmarried |
| 15 to 19 years | 0 (0.0%) | 0 (0.0%) |
| 20 to 34 years | 0 (0.0%) | 2 (100.0%) |
| 35 to 50 years | 0 (0.0%) | 0 (0.0%) |
| Total | 0 (0.0%) | 2 (100.0%) |
Fertility by Education in Salesville
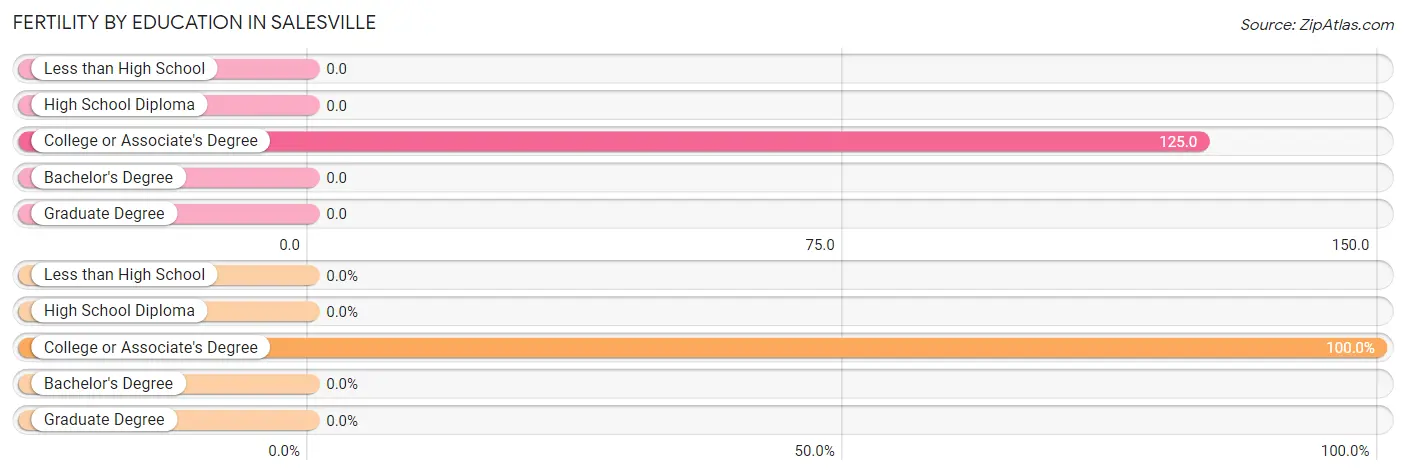
| Educational Attainment | Women with Births | Births / 1,000 Women |
| Less than High School | 0 (0.0%) | 0.0 |
| High School Diploma | 0 (0.0%) | 0.0 |
| College or Associate's Degree | 2 (100.0%) | 125.0 |
| Bachelor's Degree | 0 (0.0%) | 0.0 |
| Graduate Degree | 0 (0.0%) | 0.0 |
| Total | 2 (100.0%) | 125.0 |
Fertility by Education by Marriage Status in Salesville
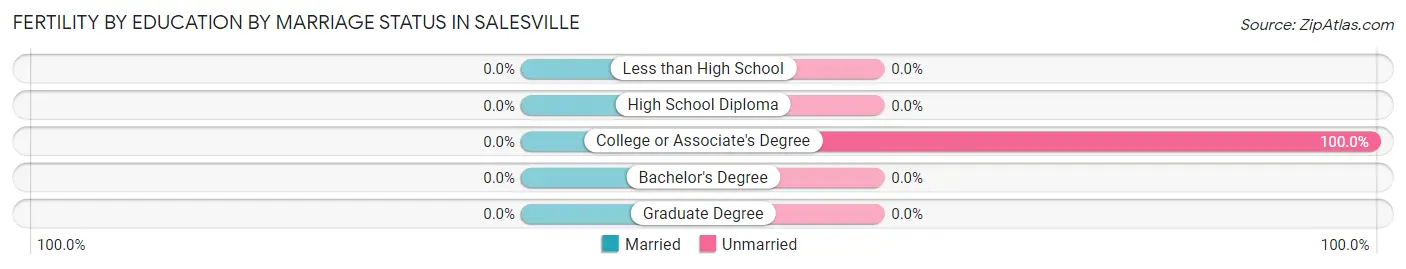
| Educational Attainment | Married | Unmarried |
| Less than High School | 0 (0.0%) | 0 (0.0%) |
| High School Diploma | 0 (0.0%) | 0 (0.0%) |
| College or Associate's Degree | 0 (0.0%) | 2 (100.0%) |
| Bachelor's Degree | 0 (0.0%) | 0 (0.0%) |
| Graduate Degree | 0 (0.0%) | 0 (0.0%) |
| Total | 0 (0.0%) | 2 (100.0%) |
Employment Characteristics in Salesville
Employment by Class of Employer in Salesville
Among the 81 employed individuals in Salesville, self-employed (incorporated) (43 | 53.1%), private company employees (27 | 33.3%), and self-employed (not incorporated) (11 | 13.6%) make up the most common classes of employment.
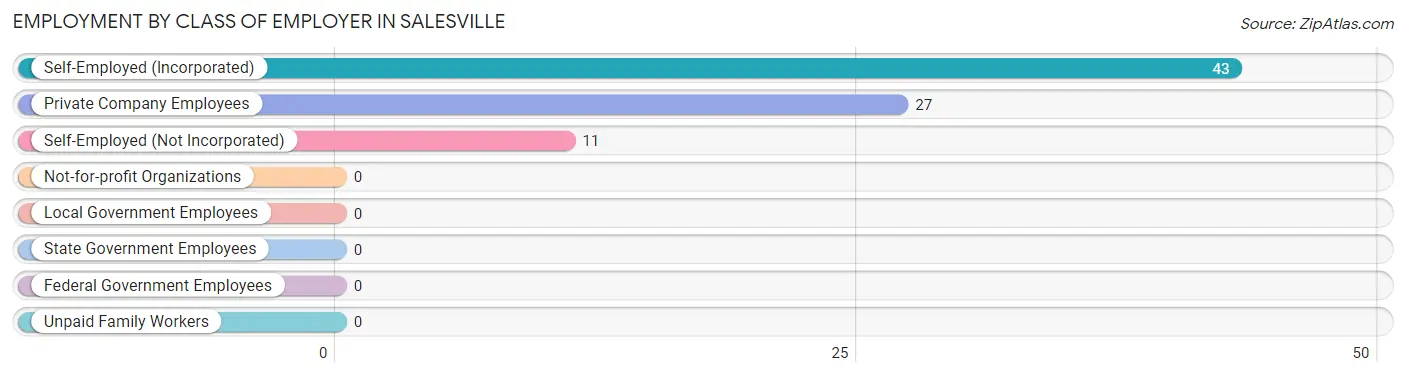
| Employer Class | # Employees | % Employees |
| Private Company Employees | 27 | 33.3% |
| Self-Employed (Incorporated) | 43 | 53.1% |
| Self-Employed (Not Incorporated) | 11 | 13.6% |
| Not-for-profit Organizations | 0 | 0.0% |
| Local Government Employees | 0 | 0.0% |
| State Government Employees | 0 | 0.0% |
| Federal Government Employees | 0 | 0.0% |
| Unpaid Family Workers | 0 | 0.0% |
| Total | 81 | 100.0% |
Employment Status by Age in Salesville
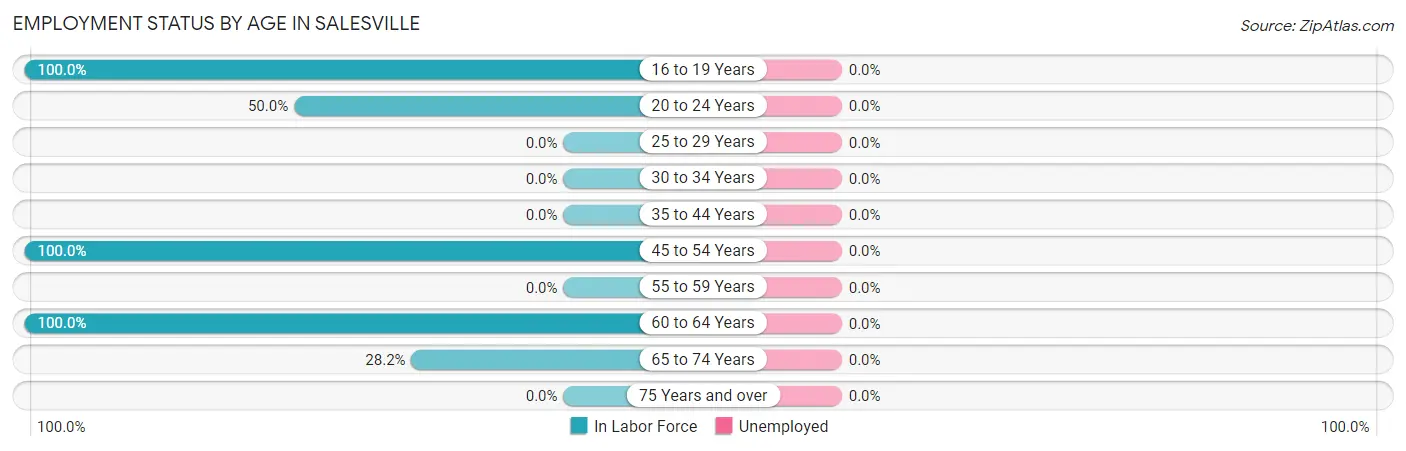
| Age Bracket | In Labor Force | Unemployed |
| 16 to 19 Years | 14 (100.0%) | 0 (0.0%) |
| 20 to 24 Years | 1 (50.0%) | 0 (0.0%) |
| 25 to 29 Years | 0 (0.0%) | 0 (0.0%) |
| 30 to 34 Years | 0 (0.0%) | 0 (0.0%) |
| 35 to 44 Years | 0 (0.0%) | 0 (0.0%) |
| 45 to 54 Years | 45 (100.0%) | 0 (0.0%) |
| 55 to 59 Years | 0 (0.0%) | 0 (0.0%) |
| 60 to 64 Years | 10 (100.0%) | 0 (0.0%) |
| 65 to 74 Years | 11 (28.2%) | 0 (0.0%) |
| 75 Years and over | 0 (0.0%) | 0 (0.0%) |
| Total | 81 (54.4%) | 0 (0.0%) |
Employment Status by Educational Attainment in Salesville
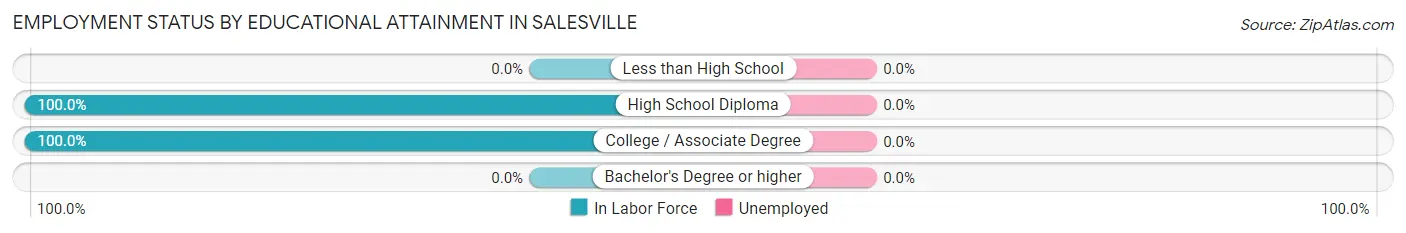
| Educational Attainment | In Labor Force | Unemployed |
| Less than High School | 0 (0.0%) | 0 (0.0%) |
| High School Diploma | 44 (100.0%) | 0 (0.0%) |
| College / Associate Degree | 11 (100.0%) | 0 (0.0%) |
| Bachelor's Degree or higher | 0 (0.0%) | 0 (0.0%) |
| Total | 55 (100.0%) | 0 (0.0%) |
Employment Occupations by Sex in Salesville
Management, Business, Science and Arts Occupations
The most common Management, Business, Science and Arts occupations in Salesville are Management (43 | 53.1%), and Business & Financial (10 | 12.3%).
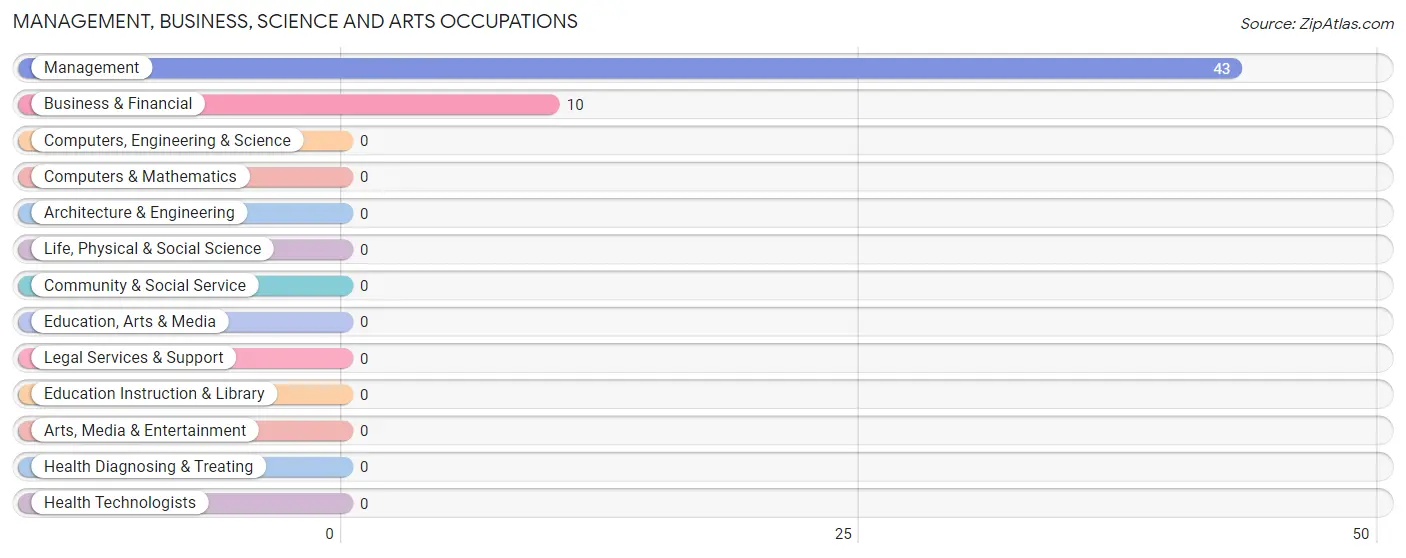
Management, Business, Science and Arts Occupations by Sex
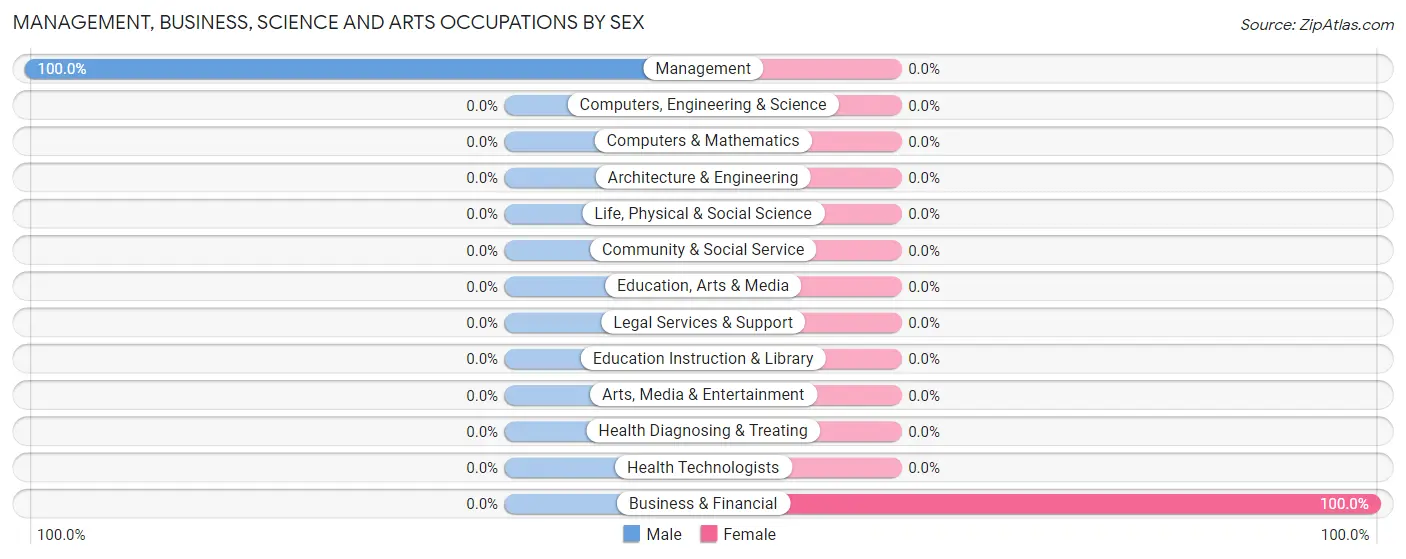
| Occupation | Male | Female |
| Management | 43 (100.0%) | 0 (0.0%) |
| Business & Financial | 0 (0.0%) | 10 (100.0%) |
| Computers, Engineering & Science | 0 (0.0%) | 0 (0.0%) |
| Computers & Mathematics | 0 (0.0%) | 0 (0.0%) |
| Architecture & Engineering | 0 (0.0%) | 0 (0.0%) |
| Life, Physical & Social Science | 0 (0.0%) | 0 (0.0%) |
| Community & Social Service | 0 (0.0%) | 0 (0.0%) |
| Education, Arts & Media | 0 (0.0%) | 0 (0.0%) |
| Legal Services & Support | 0 (0.0%) | 0 (0.0%) |
| Education Instruction & Library | 0 (0.0%) | 0 (0.0%) |
| Arts, Media & Entertainment | 0 (0.0%) | 0 (0.0%) |
| Health Diagnosing & Treating | 0 (0.0%) | 0 (0.0%) |
| Health Technologists | 0 (0.0%) | 0 (0.0%) |
| Total (Category) | 43 (81.1%) | 10 (18.9%) |
| Total (Overall) | 56 (69.1%) | 25 (30.9%) |
Services Occupations
The most common Services occupations in Salesville are Healthcare Support (1 | 1.2%), and Personal Care & Service (1 | 1.2%).
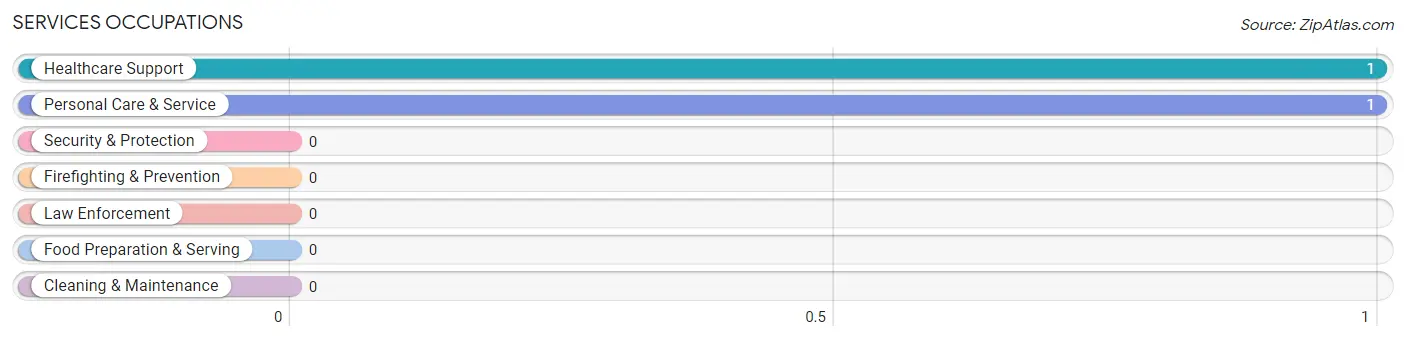
Services Occupations by Sex
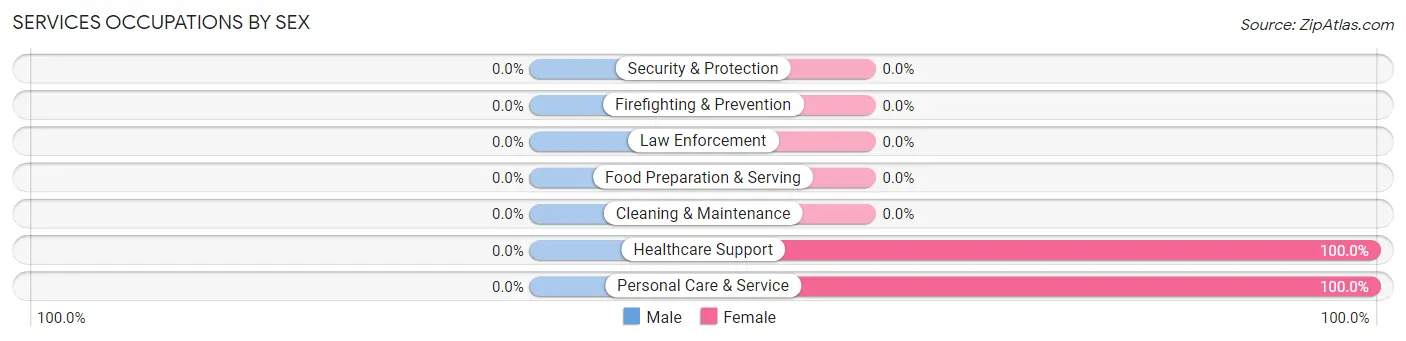
| Occupation | Male | Female |
| Healthcare Support | 0 (0.0%) | 1 (100.0%) |
| Security & Protection | 0 (0.0%) | 0 (0.0%) |
| Firefighting & Prevention | 0 (0.0%) | 0 (0.0%) |
| Law Enforcement | 0 (0.0%) | 0 (0.0%) |
| Food Preparation & Serving | 0 (0.0%) | 0 (0.0%) |
| Cleaning & Maintenance | 0 (0.0%) | 0 (0.0%) |
| Personal Care & Service | 0 (0.0%) | 1 (100.0%) |
| Total (Category) | 0 (0.0%) | 2 (100.0%) |
| Total (Overall) | 56 (69.1%) | 25 (30.9%) |
Sales and Office Occupations
The most common Sales and Office occupations in Salesville are , and Office & Administration (13 | 16.1%).
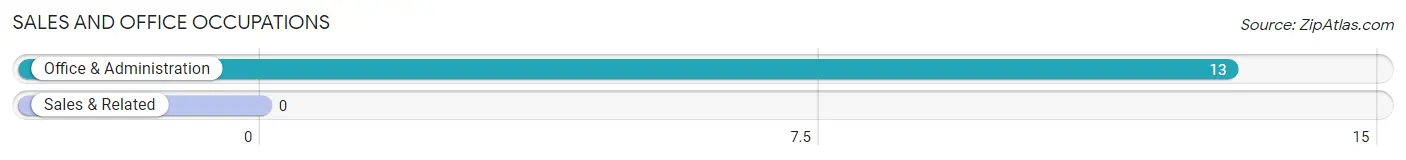
Sales and Office Occupations by Sex
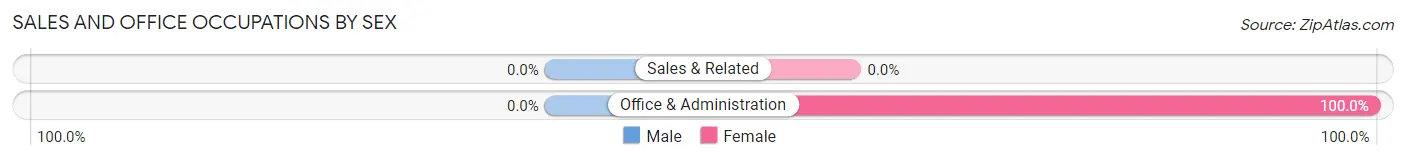
| Occupation | Male | Female |
| Sales & Related | 0 (0.0%) | 0 (0.0%) |
| Office & Administration | 0 (0.0%) | 13 (100.0%) |
| Total (Category) | 0 (0.0%) | 13 (100.0%) |
| Total (Overall) | 56 (69.1%) | 25 (30.9%) |
Natural Resources, Construction and Maintenance Occupations
The most common Natural Resources, Construction and Maintenance occupations in Salesville are , and Construction & Extraction (12 | 14.8%).
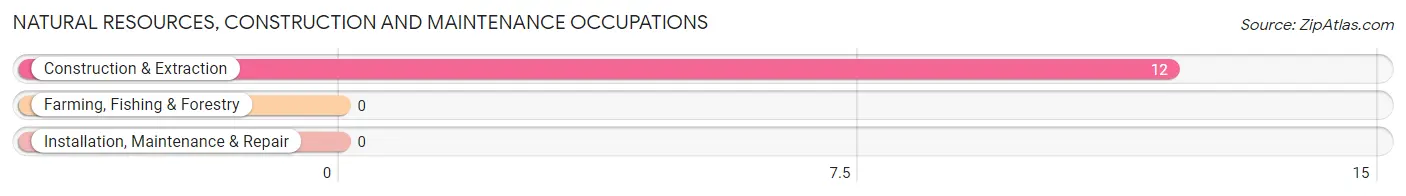
Natural Resources, Construction and Maintenance Occupations by Sex
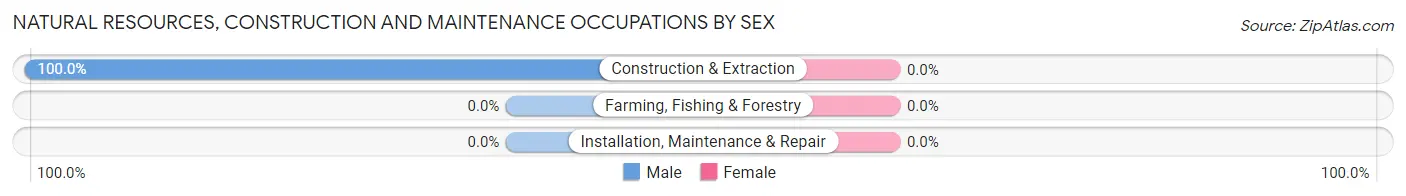
| Occupation | Male | Female |
| Farming, Fishing & Forestry | 0 (0.0%) | 0 (0.0%) |
| Construction & Extraction | 12 (100.0%) | 0 (0.0%) |
| Installation, Maintenance & Repair | 0 (0.0%) | 0 (0.0%) |
| Total (Category) | 12 (100.0%) | 0 (0.0%) |
| Total (Overall) | 56 (69.1%) | 25 (30.9%) |
Production, Transportation and Moving Occupations
The most common Production, Transportation and Moving occupations in Salesville are , and Production (1 | 1.2%).
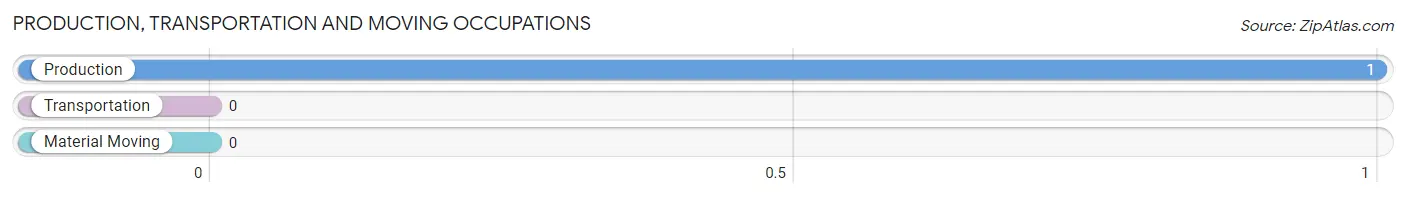
Production, Transportation and Moving Occupations by Sex
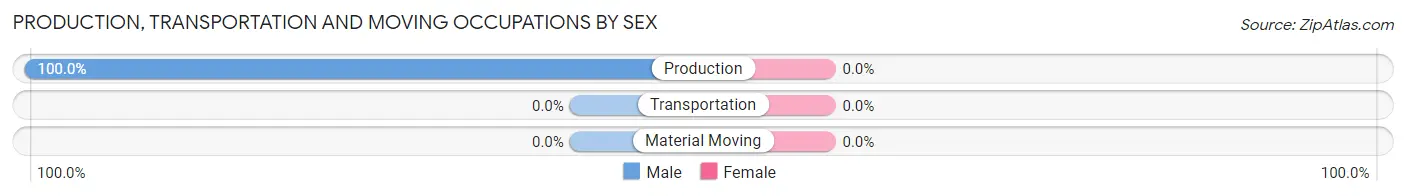
| Occupation | Male | Female |
| Production | 1 (100.0%) | 0 (0.0%) |
| Transportation | 0 (0.0%) | 0 (0.0%) |
| Material Moving | 0 (0.0%) | 0 (0.0%) |
| Total (Category) | 1 (100.0%) | 0 (0.0%) |
| Total (Overall) | 56 (69.1%) | 25 (30.9%) |
Employment Industries by Sex in Salesville
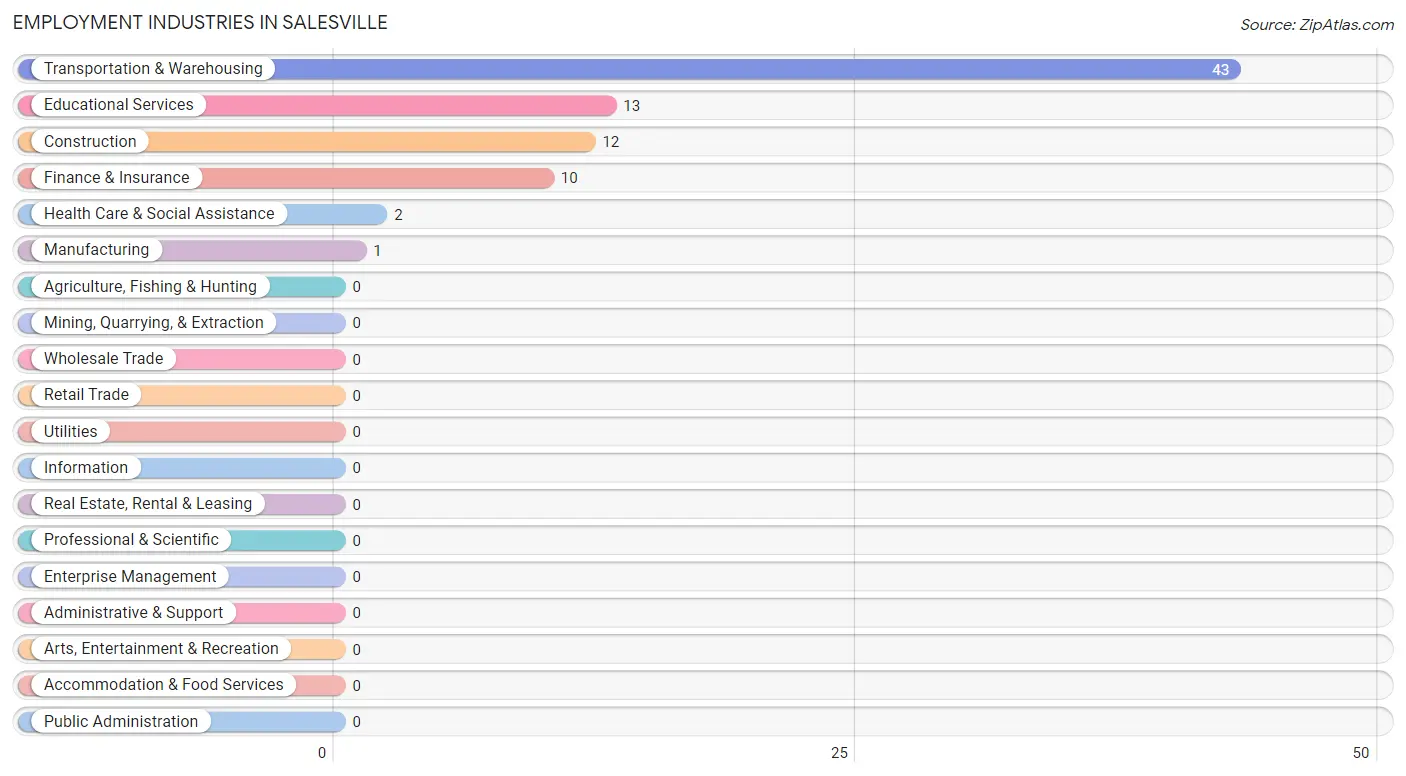
Employment Industries in Salesville
The major employment industries in Salesville include Transportation & Warehousing (43 | 53.1%), Educational Services (13 | 16.1%), Construction (12 | 14.8%), Finance & Insurance (10 | 12.3%), and Health Care & Social Assistance (2 | 2.5%).
Employment Industries by Sex in Salesville
The Salesville industries that see more men than women are Construction (100.0%), Manufacturing (100.0%), and Transportation & Warehousing (100.0%), whereas the industries that tend to have a higher number of women are Finance & Insurance (100.0%), Educational Services (100.0%), and Health Care & Social Assistance (100.0%).
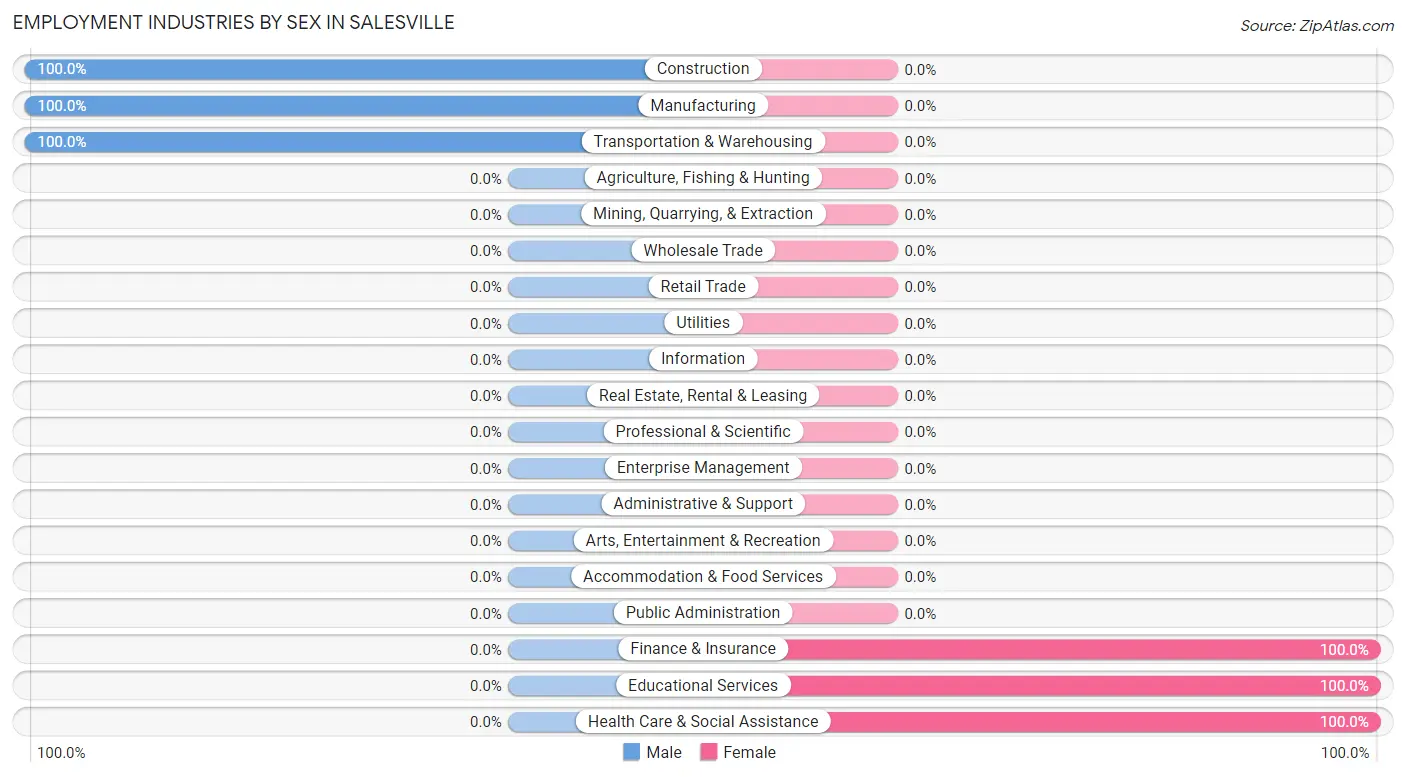
| Industry | Male | Female |
| Agriculture, Fishing & Hunting | 0 (0.0%) | 0 (0.0%) |
| Mining, Quarrying, & Extraction | 0 (0.0%) | 0 (0.0%) |
| Construction | 12 (100.0%) | 0 (0.0%) |
| Manufacturing | 1 (100.0%) | 0 (0.0%) |
| Wholesale Trade | 0 (0.0%) | 0 (0.0%) |
| Retail Trade | 0 (0.0%) | 0 (0.0%) |
| Transportation & Warehousing | 43 (100.0%) | 0 (0.0%) |
| Utilities | 0 (0.0%) | 0 (0.0%) |
| Information | 0 (0.0%) | 0 (0.0%) |
| Finance & Insurance | 0 (0.0%) | 10 (100.0%) |
| Real Estate, Rental & Leasing | 0 (0.0%) | 0 (0.0%) |
| Professional & Scientific | 0 (0.0%) | 0 (0.0%) |
| Enterprise Management | 0 (0.0%) | 0 (0.0%) |
| Administrative & Support | 0 (0.0%) | 0 (0.0%) |
| Educational Services | 0 (0.0%) | 13 (100.0%) |
| Health Care & Social Assistance | 0 (0.0%) | 2 (100.0%) |
| Arts, Entertainment & Recreation | 0 (0.0%) | 0 (0.0%) |
| Accommodation & Food Services | 0 (0.0%) | 0 (0.0%) |
| Public Administration | 0 (0.0%) | 0 (0.0%) |
| Total | 56 (69.1%) | 25 (30.9%) |
Education in Salesville
School Enrollment in Salesville
The most common levels of schooling among the 14 students in Salesville are high school (13 | 92.9%), and college / undergraduate (1 | 7.1%).
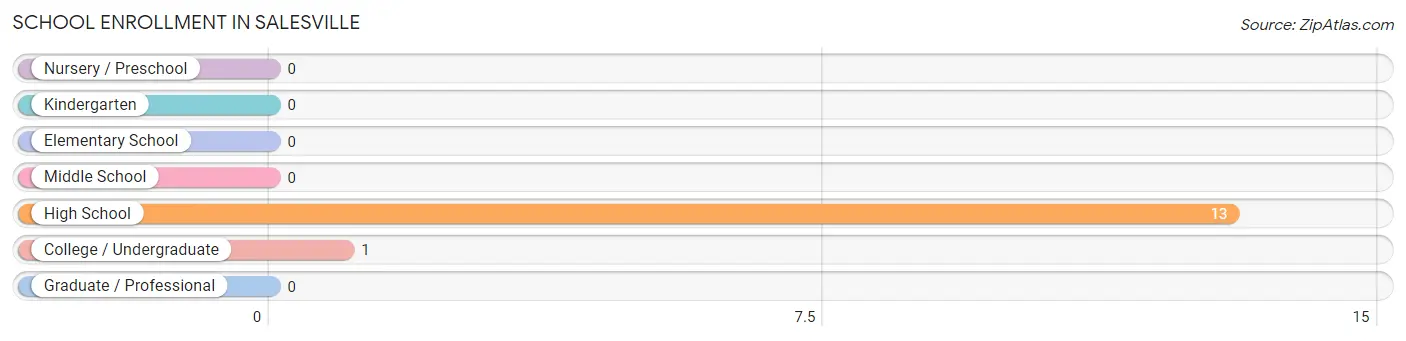
| School Level | # Students | % Students |
| Nursery / Preschool | 0 | 0.0% |
| Kindergarten | 0 | 0.0% |
| Elementary School | 0 | 0.0% |
| Middle School | 0 | 0.0% |
| High School | 13 | 92.9% |
| College / Undergraduate | 1 | 7.1% |
| Graduate / Professional | 0 | 0.0% |
| Total | 14 | 100.0% |
School Enrollment by Age by Funding Source in Salesville
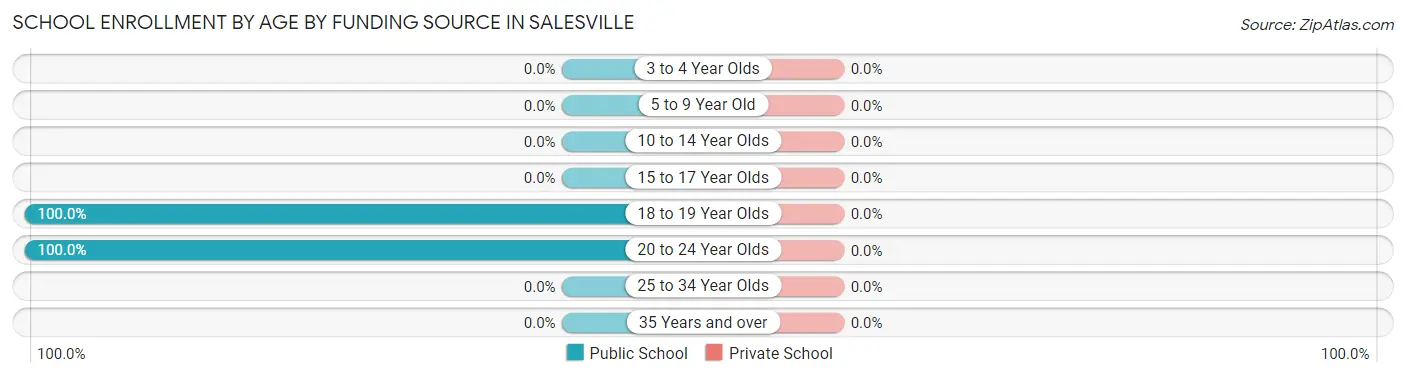
| Age Bracket | Public School | Private School |
| 3 to 4 Year Olds | 0 (0.0%) | 0 (0.0%) |
| 5 to 9 Year Old | 0 (0.0%) | 0 (0.0%) |
| 10 to 14 Year Olds | 0 (0.0%) | 0 (0.0%) |
| 15 to 17 Year Olds | 0 (0.0%) | 0 (0.0%) |
| 18 to 19 Year Olds | 13 (100.0%) | 0 (0.0%) |
| 20 to 24 Year Olds | 1 (100.0%) | 0 (0.0%) |
| 25 to 34 Year Olds | 0 (0.0%) | 0 (0.0%) |
| 35 Years and over | 0 (0.0%) | 0 (0.0%) |
| Total | 14 (100.0%) | 0 (0.0%) |
Educational Attainment by Field of Study in Salesville
| Field of Study | # Graduates | % Graduates |
| Computers & Mathematics | 0 | 0.0% |
| Bio, Nature & Agricultural | 0 | 0.0% |
| Physical & Health Sciences | 0 | 0.0% |
| Psychology | 0 | 0.0% |
| Social Sciences | 0 | 0.0% |
| Engineering | 0 | 0.0% |
| Multidisciplinary Studies | 0 | 0.0% |
| Science & Technology | 0 | 0.0% |
| Business | 0 | 0.0% |
| Education | 0 | 0.0% |
| Literature & Languages | 0 | 0.0% |
| Liberal Arts & History | 0 | 0.0% |
| Visual & Performing Arts | 0 | 0.0% |
| Communications | 0 | 0.0% |
| Arts & Humanities | 0 | 0.0% |
| Total | 0 | 0.0% |
Transportation & Commute in Salesville
Vehicle Availability by Sex in Salesville
The most prevalent vehicle ownership categories in Salesville are males with 2 vehicles (54, accounting for 96.4%) and females with 2 vehicles (23, making up 216.0%).

| Vehicles Available | Male | Female |
| No Vehicle | 0 (0.0%) | 0 (0.0%) |
| 1 Vehicle | 0 (0.0%) | 0 (0.0%) |
| 2 Vehicles | 54 (96.4%) | 23 (92.0%) |
| 3 Vehicles | 0 (0.0%) | 0 (0.0%) |
| 4 Vehicles | 0 (0.0%) | 0 (0.0%) |
| 5 or more Vehicles | 2 (3.6%) | 2 (8.0%) |
| Total | 56 (100.0%) | 25 (100.0%) |
Commute Time in Salesville
The most frequently occuring commute durations in Salesville are less than 5 minutes (54 commuters, 76.1%), 60 to 89 minutes (13 commuters, 18.3%), and 20 to 24 minutes (1 commuters, 1.4%).
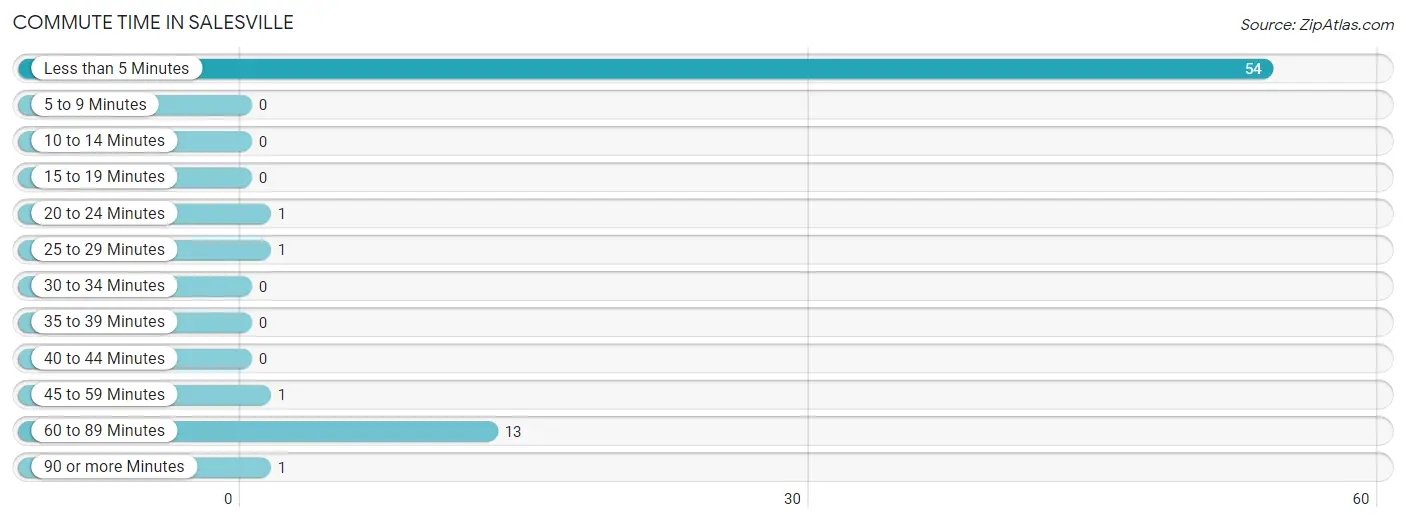
| Commute Time | # Commuters | % Commuters |
| Less than 5 Minutes | 54 | 76.1% |
| 5 to 9 Minutes | 0 | 0.0% |
| 10 to 14 Minutes | 0 | 0.0% |
| 15 to 19 Minutes | 0 | 0.0% |
| 20 to 24 Minutes | 1 | 1.4% |
| 25 to 29 Minutes | 1 | 1.4% |
| 30 to 34 Minutes | 0 | 0.0% |
| 35 to 39 Minutes | 0 | 0.0% |
| 40 to 44 Minutes | 0 | 0.0% |
| 45 to 59 Minutes | 1 | 1.4% |
| 60 to 89 Minutes | 13 | 18.3% |
| 90 or more Minutes | 1 | 1.4% |
Commute Time by Sex in Salesville
The most common commute times in Salesville are less than 5 minutes (54 commuters, 96.4%) for males and 60 to 89 minutes (13 commuters, 86.7%) for females.
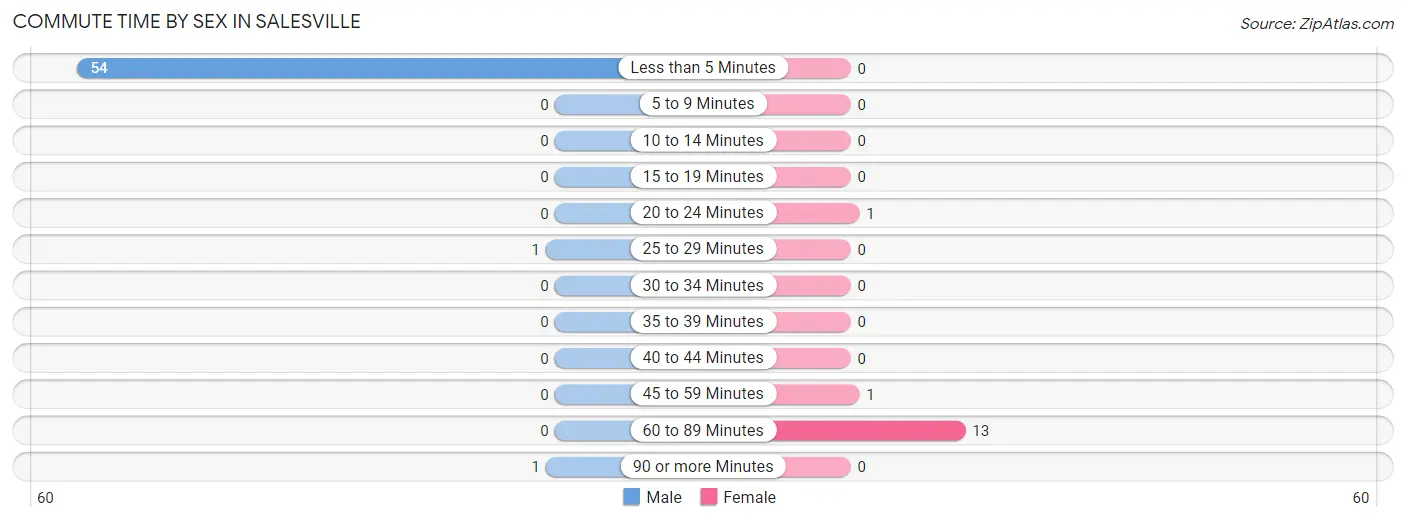
| Commute Time | Male | Female |
| Less than 5 Minutes | 54 (96.4%) | 0 (0.0%) |
| 5 to 9 Minutes | 0 (0.0%) | 0 (0.0%) |
| 10 to 14 Minutes | 0 (0.0%) | 0 (0.0%) |
| 15 to 19 Minutes | 0 (0.0%) | 0 (0.0%) |
| 20 to 24 Minutes | 0 (0.0%) | 1 (6.7%) |
| 25 to 29 Minutes | 1 (1.8%) | 0 (0.0%) |
| 30 to 34 Minutes | 0 (0.0%) | 0 (0.0%) |
| 35 to 39 Minutes | 0 (0.0%) | 0 (0.0%) |
| 40 to 44 Minutes | 0 (0.0%) | 0 (0.0%) |
| 45 to 59 Minutes | 0 (0.0%) | 1 (6.7%) |
| 60 to 89 Minutes | 0 (0.0%) | 13 (86.7%) |
| 90 or more Minutes | 1 (1.8%) | 0 (0.0%) |
Time of Departure to Work by Sex in Salesville
The most frequent times of departure to work in Salesville are 6:00 AM to 6:29 AM (54, 96.4%) for males and 7:00 AM to 7:29 AM (14, 93.3%) for females.
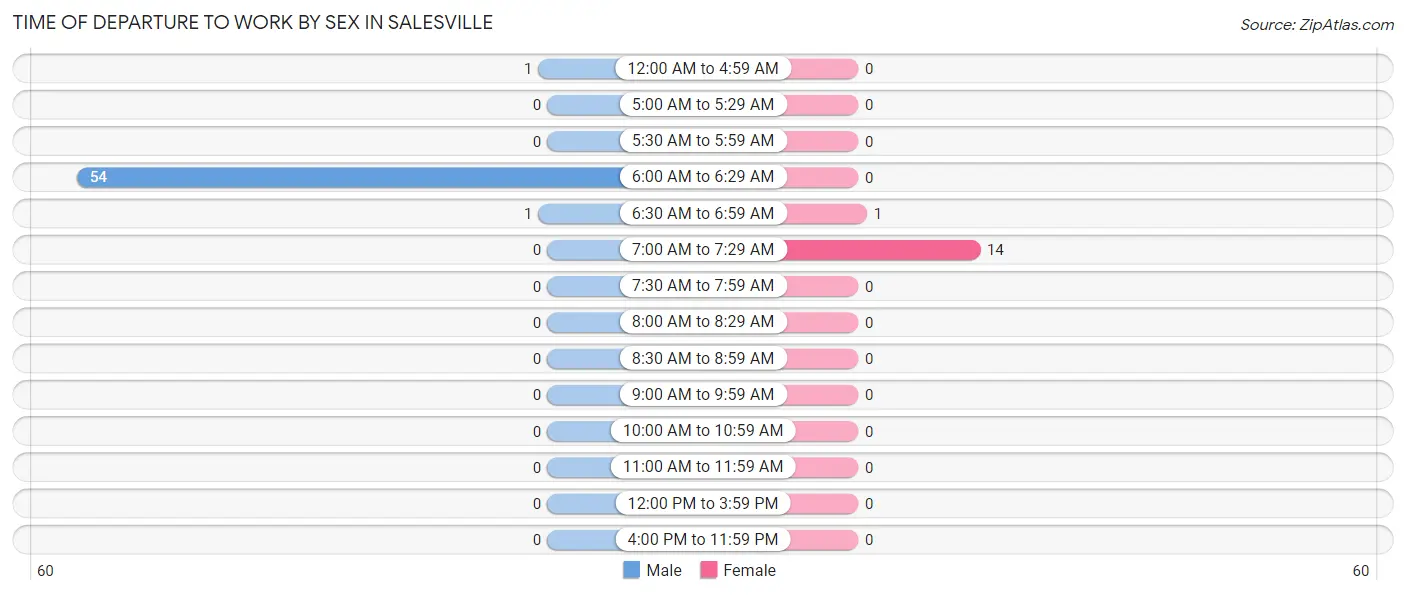
| Time of Departure | Male | Female |
| 12:00 AM to 4:59 AM | 1 (1.8%) | 0 (0.0%) |
| 5:00 AM to 5:29 AM | 0 (0.0%) | 0 (0.0%) |
| 5:30 AM to 5:59 AM | 0 (0.0%) | 0 (0.0%) |
| 6:00 AM to 6:29 AM | 54 (96.4%) | 0 (0.0%) |
| 6:30 AM to 6:59 AM | 1 (1.8%) | 1 (6.7%) |
| 7:00 AM to 7:29 AM | 0 (0.0%) | 14 (93.3%) |
| 7:30 AM to 7:59 AM | 0 (0.0%) | 0 (0.0%) |
| 8:00 AM to 8:29 AM | 0 (0.0%) | 0 (0.0%) |
| 8:30 AM to 8:59 AM | 0 (0.0%) | 0 (0.0%) |
| 9:00 AM to 9:59 AM | 0 (0.0%) | 0 (0.0%) |
| 10:00 AM to 10:59 AM | 0 (0.0%) | 0 (0.0%) |
| 11:00 AM to 11:59 AM | 0 (0.0%) | 0 (0.0%) |
| 12:00 PM to 3:59 PM | 0 (0.0%) | 0 (0.0%) |
| 4:00 PM to 11:59 PM | 0 (0.0%) | 0 (0.0%) |
| Total | 56 (100.0%) | 15 (100.0%) |
Housing Occupancy in Salesville
Occupancy by Ownership in Salesville
Of the total 112 dwellings in Salesville, owner-occupied units account for 112 (100.0%), while renter-occupied units make up 0 (0.0%).
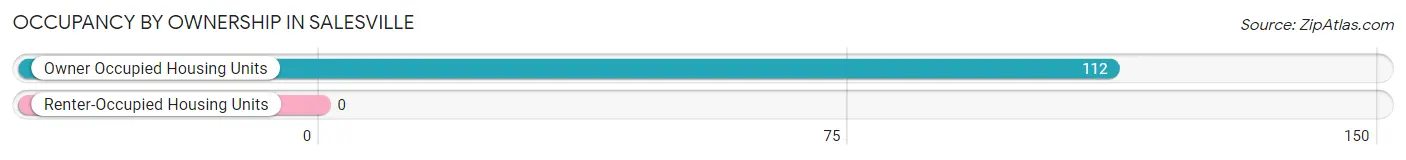
| Occupancy | # Housing Units | % Housing Units |
| Owner Occupied Housing Units | 112 | 100.0% |
| Renter-Occupied Housing Units | 0 | 0.0% |
| Total Occupied Housing Units | 112 | 100.0% |
Occupancy by Household Size in Salesville
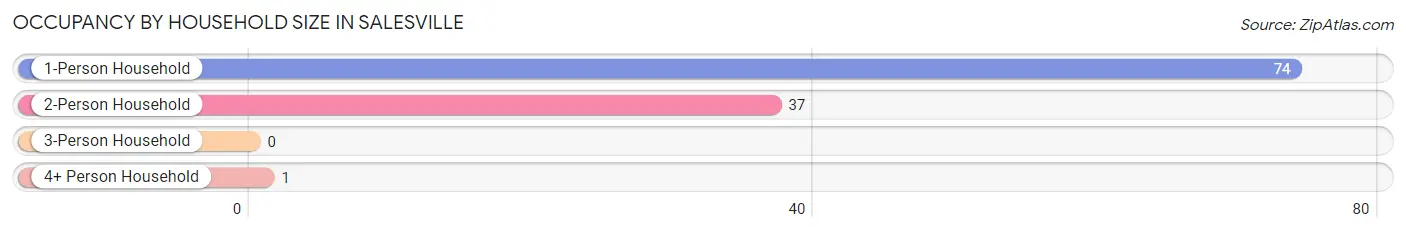
| Household Size | # Housing Units | % Housing Units |
| 1-Person Household | 74 | 66.1% |
| 2-Person Household | 37 | 33.0% |
| 3-Person Household | 0 | 0.0% |
| 4+ Person Household | 1 | 0.9% |
| Total Housing Units | 112 | 100.0% |
Occupancy by Ownership by Household Size in Salesville
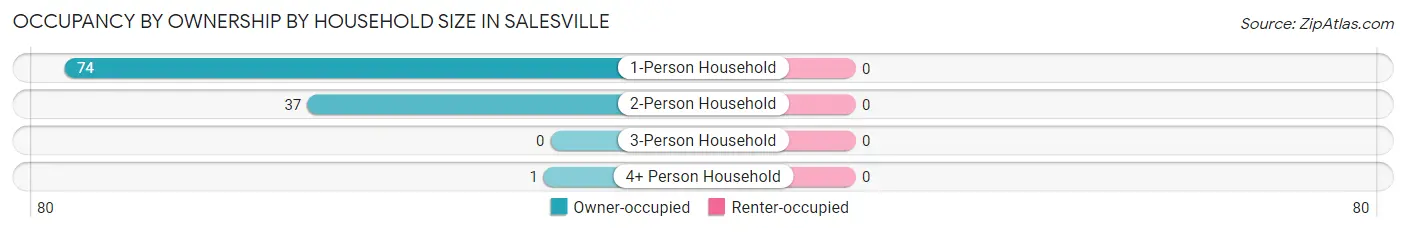
| Household Size | Owner-occupied | Renter-occupied |
| 1-Person Household | 74 (100.0%) | 0 (0.0%) |
| 2-Person Household | 37 (100.0%) | 0 (0.0%) |
| 3-Person Household | 0 (0.0%) | 0 (0.0%) |
| 4+ Person Household | 1 (100.0%) | 0 (0.0%) |
| Total Housing Units | 112 (100.0%) | 0 (0.0%) |
Occupancy by Educational Attainment in Salesville
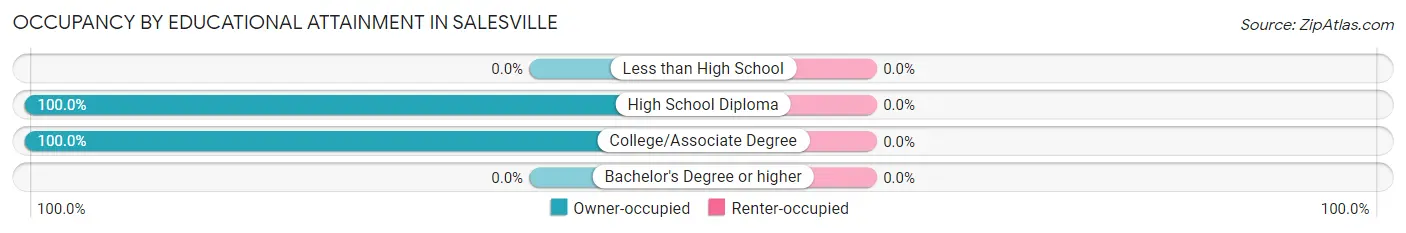
| Household Size | Owner-occupied | Renter-occupied |
| Less than High School | 0 (0.0%) | 0 (0.0%) |
| High School Diploma | 101 (100.0%) | 0 (0.0%) |
| College/Associate Degree | 11 (100.0%) | 0 (0.0%) |
| Bachelor's Degree or higher | 0 (0.0%) | 0 (0.0%) |
Occupancy by Age of Householder in Salesville
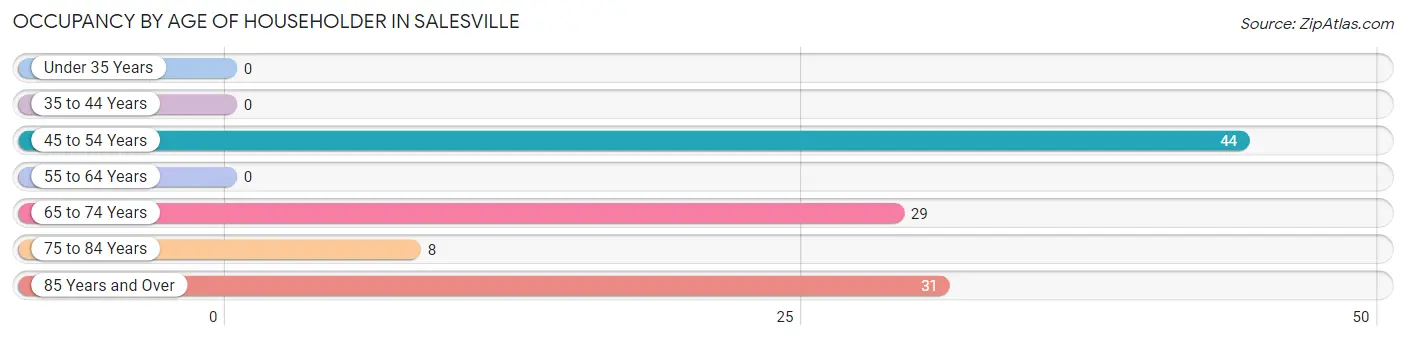
| Age Bracket | # Households | % Households |
| Under 35 Years | 0 | 0.0% |
| 35 to 44 Years | 0 | 0.0% |
| 45 to 54 Years | 44 | 39.3% |
| 55 to 64 Years | 0 | 0.0% |
| 65 to 74 Years | 29 | 25.9% |
| 75 to 84 Years | 8 | 7.1% |
| 85 Years and Over | 31 | 27.7% |
| Total | 112 | 100.0% |
Housing Finances in Salesville
Median Income by Occupancy in Salesville
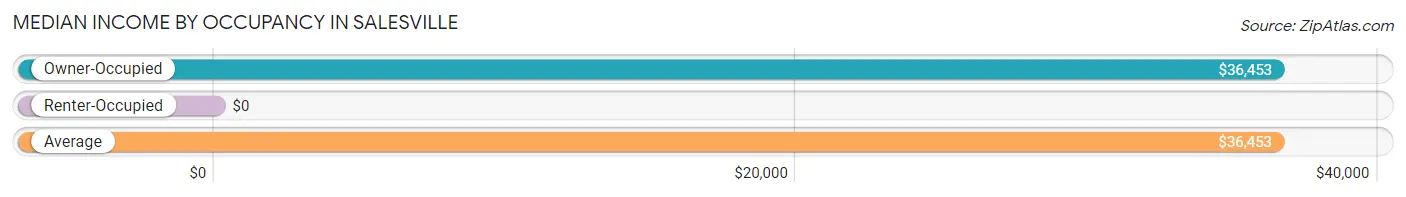
| Occupancy Type | # Households | Median Income |
| Owner-Occupied | 112 (100.0%) | $36,453 |
| Renter-Occupied | 0 (0.0%) | $0 |
| Average | 112 (100.0%) | $36,453 |
Occupancy by Householder Income Bracket in Salesville
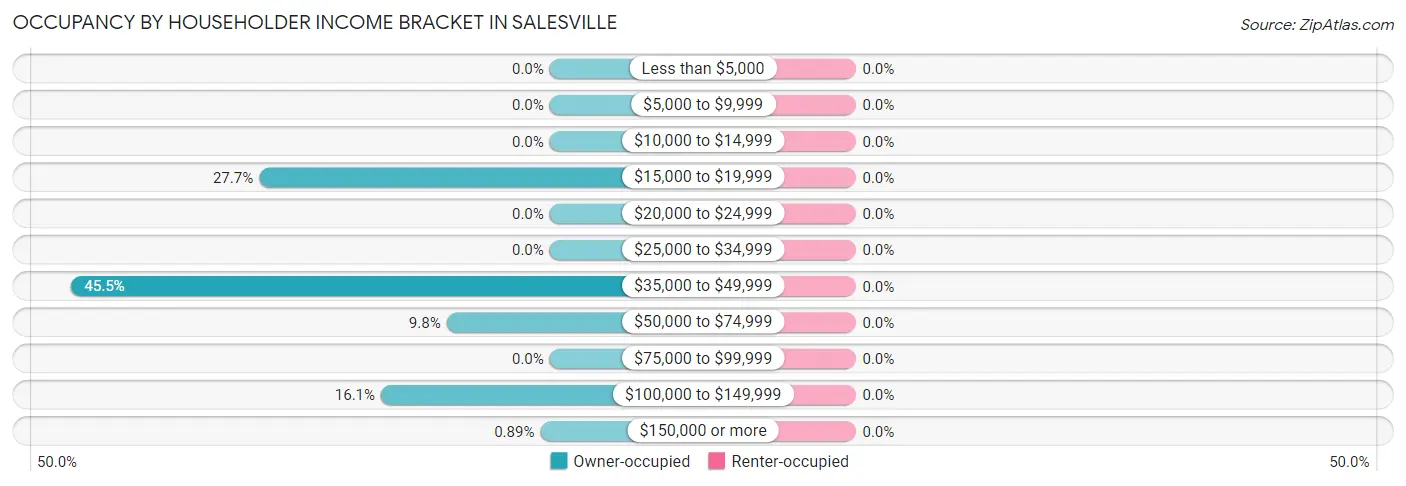
| Income Bracket | Owner-occupied | Renter-occupied |
| Less than $5,000 | 0 (0.0%) | 0 (0.0%) |
| $5,000 to $9,999 | 0 (0.0%) | 0 (0.0%) |
| $10,000 to $14,999 | 0 (0.0%) | 0 (0.0%) |
| $15,000 to $19,999 | 31 (27.7%) | 0 (0.0%) |
| $20,000 to $24,999 | 0 (0.0%) | 0 (0.0%) |
| $25,000 to $34,999 | 0 (0.0%) | 0 (0.0%) |
| $35,000 to $49,999 | 51 (45.5%) | 0 (0.0%) |
| $50,000 to $74,999 | 11 (9.8%) | 0 (0.0%) |
| $75,000 to $99,999 | 0 (0.0%) | 0 (0.0%) |
| $100,000 to $149,999 | 18 (16.1%) | 0 (0.0%) |
| $150,000 or more | 1 (0.9%) | 0 (0.0%) |
| Total | 112 (100.0%) | 0 (0.0%) |
Monthly Housing Cost Tiers in Salesville
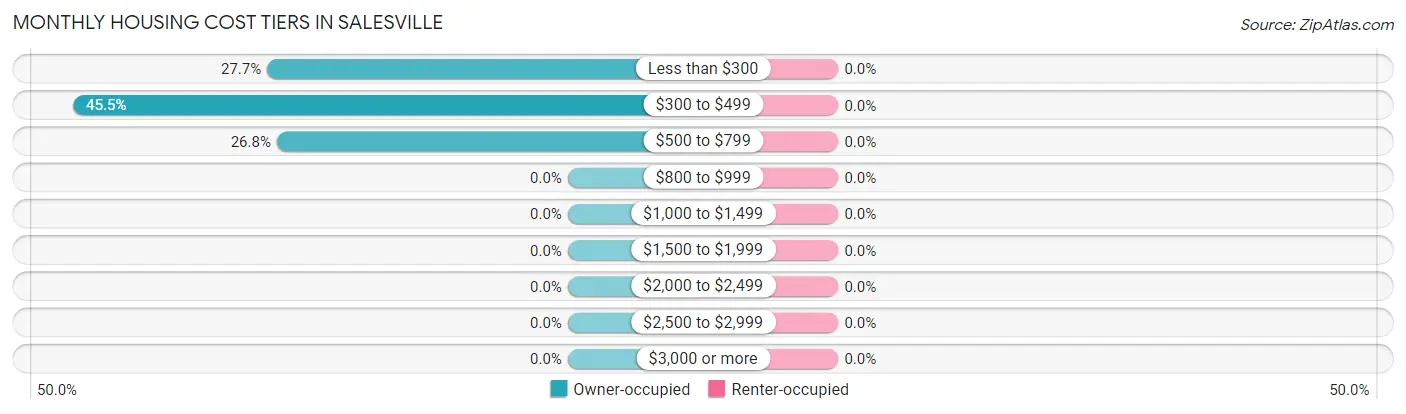
| Monthly Cost | Owner-occupied | Renter-occupied |
| Less than $300 | 31 (27.7%) | 0 (0.0%) |
| $300 to $499 | 51 (45.5%) | 0 (0.0%) |
| $500 to $799 | 30 (26.8%) | 0 (0.0%) |
| $800 to $999 | 0 (0.0%) | 0 (0.0%) |
| $1,000 to $1,499 | 0 (0.0%) | 0 (0.0%) |
| $1,500 to $1,999 | 0 (0.0%) | 0 (0.0%) |
| $2,000 to $2,499 | 0 (0.0%) | 0 (0.0%) |
| $2,500 to $2,999 | 0 (0.0%) | 0 (0.0%) |
| $3,000 or more | 0 (0.0%) | 0 (0.0%) |
| Total | 112 (100.0%) | 0 (0.0%) |
Physical Housing Characteristics in Salesville
Housing Structures in Salesville
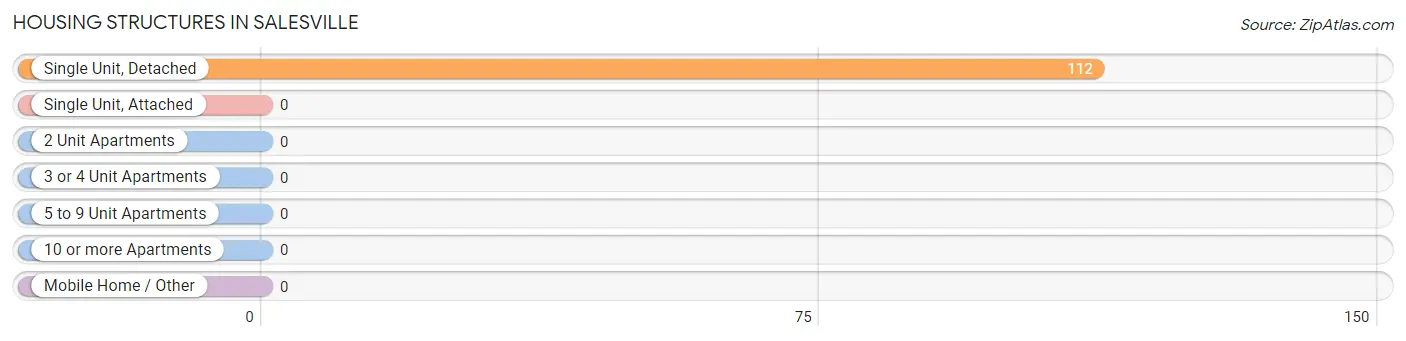
| Structure Type | # Housing Units | % Housing Units |
| Single Unit, Detached | 112 | 100.0% |
| Single Unit, Attached | 0 | 0.0% |
| 2 Unit Apartments | 0 | 0.0% |
| 3 or 4 Unit Apartments | 0 | 0.0% |
| 5 to 9 Unit Apartments | 0 | 0.0% |
| 10 or more Apartments | 0 | 0.0% |
| Mobile Home / Other | 0 | 0.0% |
| Total | 112 | 100.0% |
Housing Structures by Occupancy in Salesville
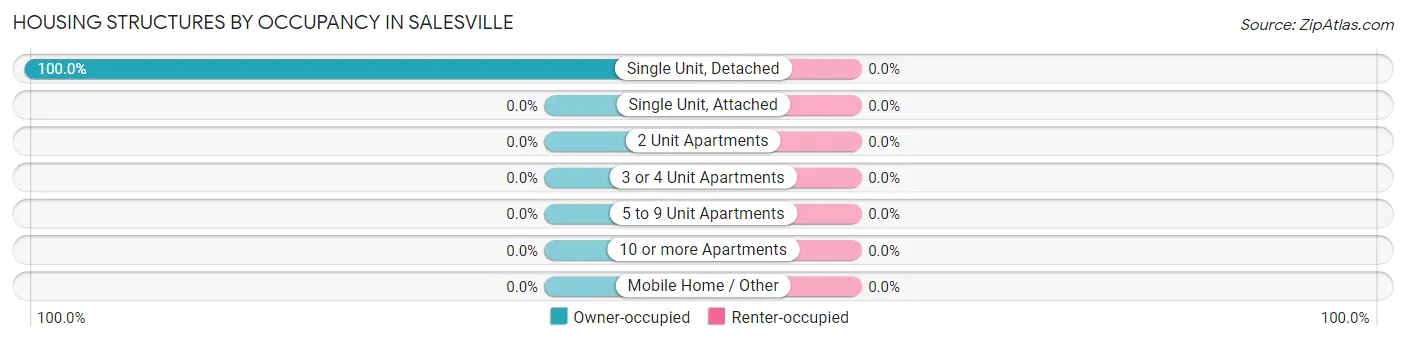
| Structure Type | Owner-occupied | Renter-occupied |
| Single Unit, Detached | 112 (100.0%) | 0 (0.0%) |
| Single Unit, Attached | 0 (0.0%) | 0 (0.0%) |
| 2 Unit Apartments | 0 (0.0%) | 0 (0.0%) |
| 3 or 4 Unit Apartments | 0 (0.0%) | 0 (0.0%) |
| 5 to 9 Unit Apartments | 0 (0.0%) | 0 (0.0%) |
| 10 or more Apartments | 0 (0.0%) | 0 (0.0%) |
| Mobile Home / Other | 0 (0.0%) | 0 (0.0%) |
| Total | 112 (100.0%) | 0 (0.0%) |
Housing Structures by Number of Rooms in Salesville
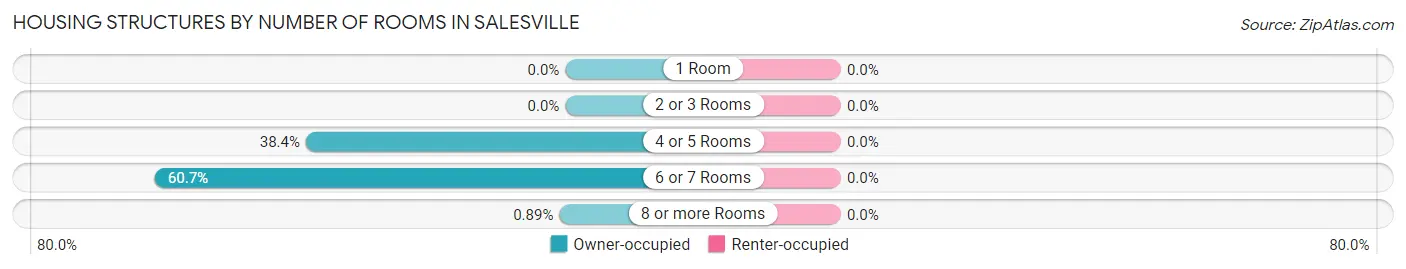
| Number of Rooms | Owner-occupied | Renter-occupied |
| 1 Room | 0 (0.0%) | 0 (0.0%) |
| 2 or 3 Rooms | 0 (0.0%) | 0 (0.0%) |
| 4 or 5 Rooms | 43 (38.4%) | 0 (0.0%) |
| 6 or 7 Rooms | 68 (60.7%) | 0 (0.0%) |
| 8 or more Rooms | 1 (0.9%) | 0 (0.0%) |
| Total | 112 (100.0%) | 0 (0.0%) |
Housing Structure by Heating Type in Salesville
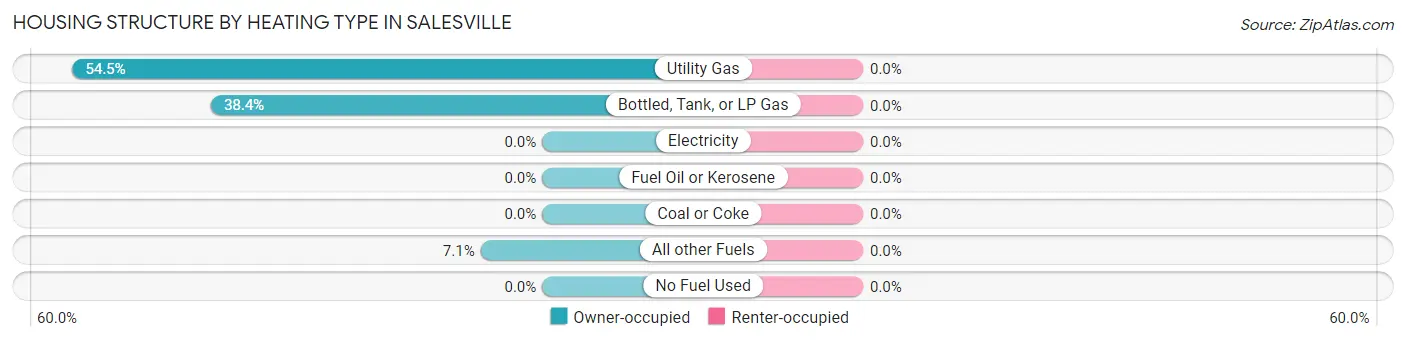
| Heating Type | Owner-occupied | Renter-occupied |
| Utility Gas | 61 (54.5%) | 0 (0.0%) |
| Bottled, Tank, or LP Gas | 43 (38.4%) | 0 (0.0%) |
| Electricity | 0 (0.0%) | 0 (0.0%) |
| Fuel Oil or Kerosene | 0 (0.0%) | 0 (0.0%) |
| Coal or Coke | 0 (0.0%) | 0 (0.0%) |
| All other Fuels | 8 (7.1%) | 0 (0.0%) |
| No Fuel Used | 0 (0.0%) | 0 (0.0%) |
| Total | 112 (100.0%) | 0 (0.0%) |
Household Vehicle Usage in Salesville
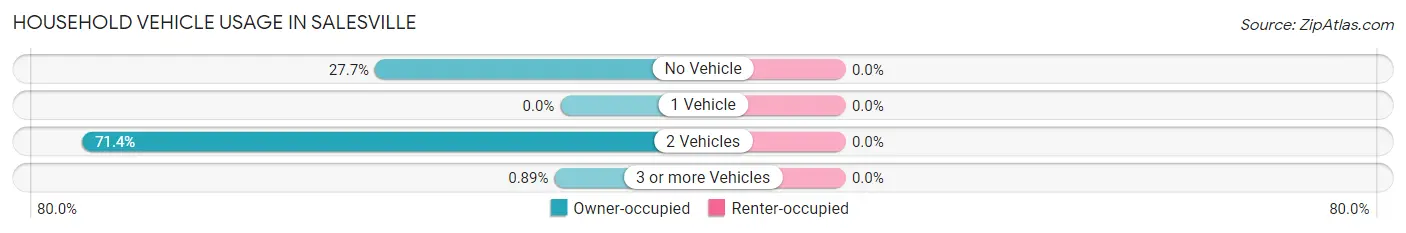
| Vehicles per Household | Owner-occupied | Renter-occupied |
| No Vehicle | 31 (27.7%) | 0 (0.0%) |
| 1 Vehicle | 0 (0.0%) | 0 (0.0%) |
| 2 Vehicles | 80 (71.4%) | 0 (0.0%) |
| 3 or more Vehicles | 1 (0.9%) | 0 (0.0%) |
| Total | 112 (100.0%) | 0 (0.0%) |
Real Estate & Mortgages in Salesville
Real Estate and Mortgage Overview in Salesville
| Characteristic | Without Mortgage | With Mortgage |
| Housing Units | 83 | 29 |
| Median Property Value | - | - |
| Median Household Income | $35,610 | $0 |
| Monthly Housing Costs | $360 | $0 |
| Real Estate Taxes | - | - |
Property Value by Mortgage Status in Salesville
| Property Value | Without Mortgage | With Mortgage |
| Less than $50,000 | 0 (0.0%) | 0 (0.0%) |
| $50,000 to $99,999 | 8 (9.6%) | 11 (37.9%) |
| $100,000 to $299,999 | 75 (90.4%) | 18 (62.1%) |
| $300,000 to $499,999 | 0 (0.0%) | 0 (0.0%) |
| $500,000 to $749,999 | 0 (0.0%) | 0 (0.0%) |
| $750,000 to $999,999 | 0 (0.0%) | 0 (0.0%) |
| $1,000,000 or more | 0 (0.0%) | 0 (0.0%) |
| Total | 83 (100.0%) | 29 (100.0%) |
Household Income by Mortgage Status in Salesville
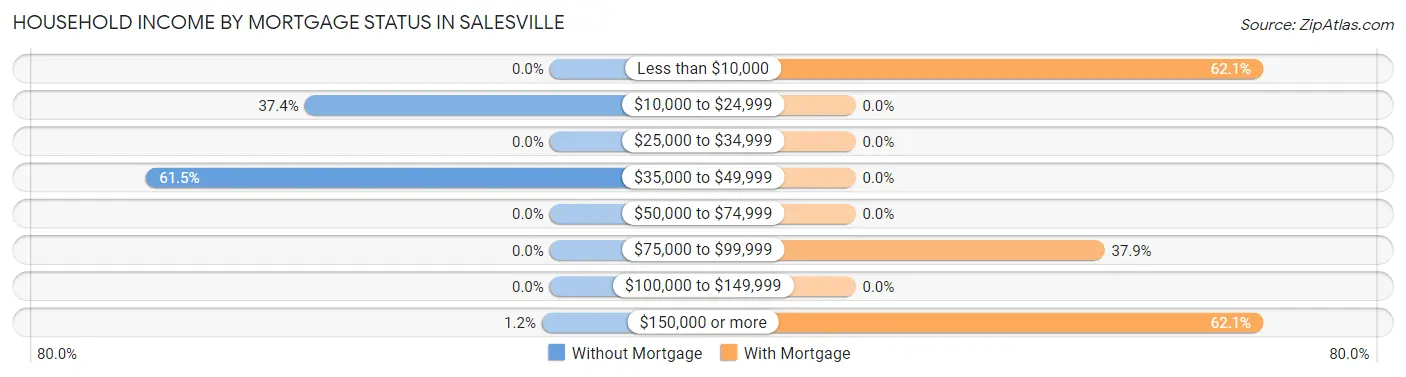
| Household Income | Without Mortgage | With Mortgage |
| Less than $10,000 | 0 (0.0%) | 18 (62.1%) |
| $10,000 to $24,999 | 31 (37.3%) | 0 (0.0%) |
| $25,000 to $34,999 | 0 (0.0%) | 0 (0.0%) |
| $35,000 to $49,999 | 51 (61.5%) | 0 (0.0%) |
| $50,000 to $74,999 | 0 (0.0%) | 0 (0.0%) |
| $75,000 to $99,999 | 0 (0.0%) | 11 (37.9%) |
| $100,000 to $149,999 | 0 (0.0%) | 0 (0.0%) |
| $150,000 or more | 1 (1.2%) | 18 (62.1%) |
| Total | 83 (100.0%) | 29 (100.0%) |
Property Value to Household Income Ratio in Salesville
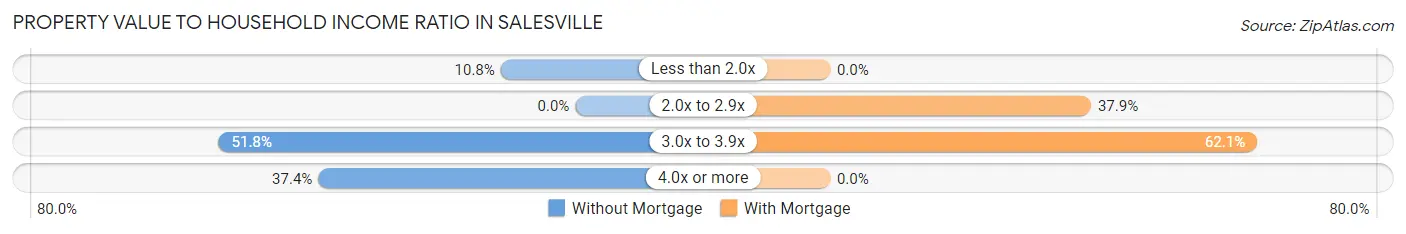
| Value-to-Income Ratio | Without Mortgage | With Mortgage |
| Less than 2.0x | 9 (10.8%) | 0 (0.0%) |
| 2.0x to 2.9x | 0 (0.0%) | 11 (37.9%) |
| 3.0x to 3.9x | 43 (51.8%) | 18 (62.1%) |
| 4.0x or more | 31 (37.3%) | 0 (0.0%) |
| Total | 83 (100.0%) | 29 (100.0%) |
Real Estate Taxes by Mortgage Status in Salesville
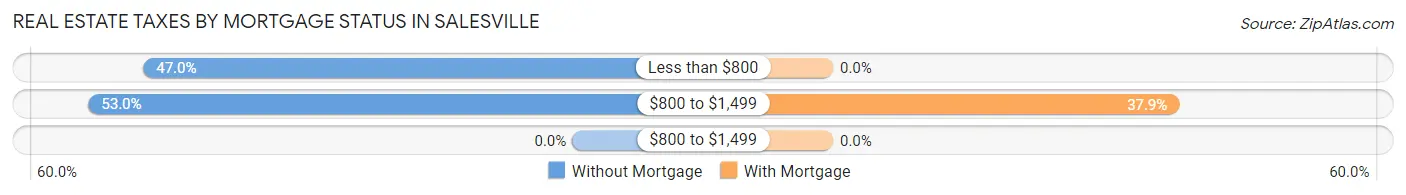
| Property Taxes | Without Mortgage | With Mortgage |
| Less than $800 | 39 (47.0%) | 0 (0.0%) |
| $800 to $1,499 | 44 (53.0%) | 11 (37.9%) |
| $800 to $1,499 | 0 (0.0%) | 0 (0.0%) |
| Total | 83 (100.0%) | 29 (100.0%) |
Health & Disability in Salesville
Health Insurance Coverage by Age in Salesville
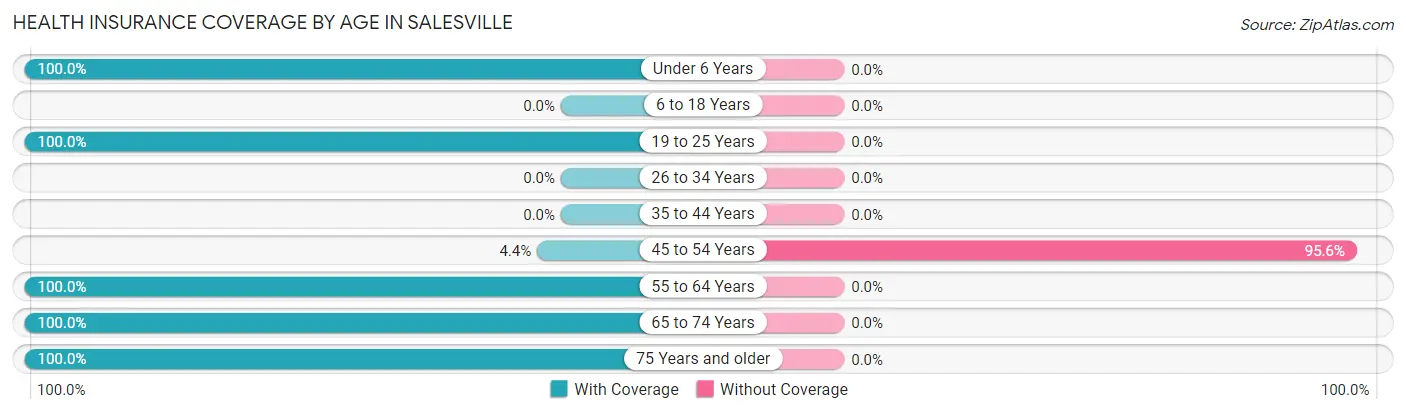
| Age Bracket | With Coverage | Without Coverage |
| Under 6 Years | 1 (100.0%) | 0 (0.0%) |
| 6 to 18 Years | 0 (0.0%) | 0 (0.0%) |
| 19 to 25 Years | 16 (100.0%) | 0 (0.0%) |
| 26 to 34 Years | 0 (0.0%) | 0 (0.0%) |
| 35 to 44 Years | 0 (0.0%) | 0 (0.0%) |
| 45 to 54 Years | 2 (4.4%) | 43 (95.6%) |
| 55 to 64 Years | 10 (100.0%) | 0 (0.0%) |
| 65 to 74 Years | 39 (100.0%) | 0 (0.0%) |
| 75 Years and older | 39 (100.0%) | 0 (0.0%) |
| Total | 107 (71.3%) | 43 (28.7%) |
Health Insurance Coverage by Citizenship Status in Salesville
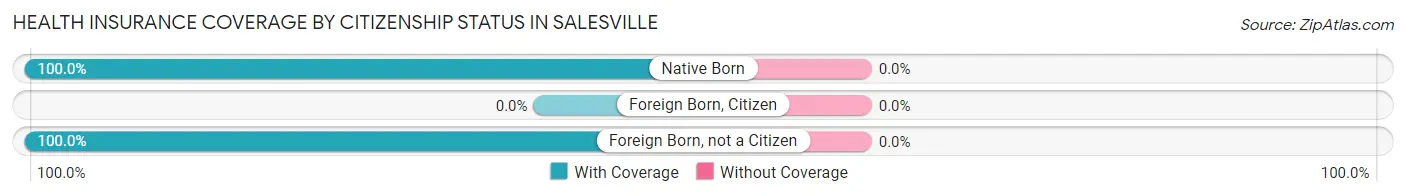
| Citizenship Status | With Coverage | Without Coverage |
| Native Born | 1 (100.0%) | 0 (0.0%) |
| Foreign Born, Citizen | 0 (0.0%) | 0 (0.0%) |
| Foreign Born, not a Citizen | 16 (100.0%) | 0 (0.0%) |
Health Insurance Coverage by Household Income in Salesville
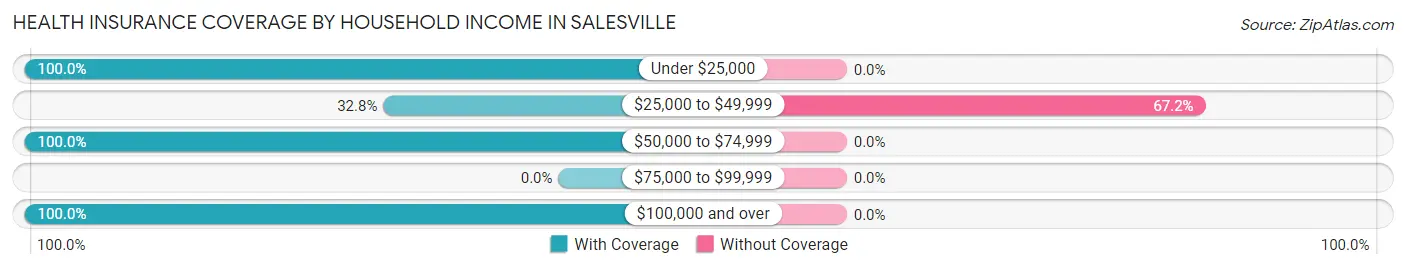
| Household Income | With Coverage | Without Coverage |
| Under $25,000 | 31 (100.0%) | 0 (0.0%) |
| $25,000 to $49,999 | 21 (32.8%) | 43 (67.2%) |
| $50,000 to $74,999 | 21 (100.0%) | 0 (0.0%) |
| $75,000 to $99,999 | 0 (0.0%) | 0 (0.0%) |
| $100,000 and over | 34 (100.0%) | 0 (0.0%) |
Public vs Private Health Insurance Coverage by Age in Salesville
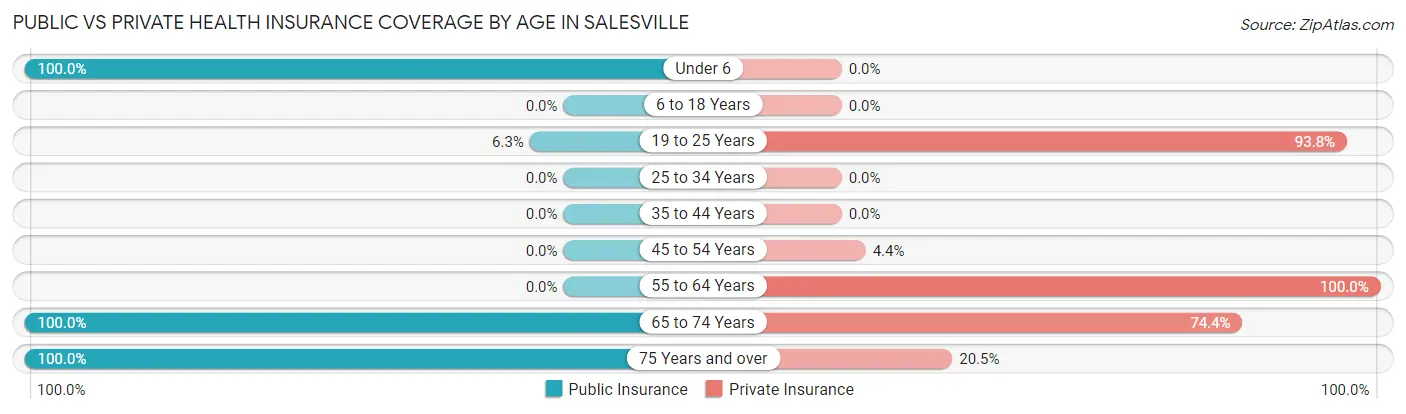
| Age Bracket | Public Insurance | Private Insurance |
| Under 6 | 1 (100.0%) | 0 (0.0%) |
| 6 to 18 Years | 0 (0.0%) | 0 (0.0%) |
| 19 to 25 Years | 1 (6.2%) | 15 (93.8%) |
| 25 to 34 Years | 0 (0.0%) | 0 (0.0%) |
| 35 to 44 Years | 0 (0.0%) | 0 (0.0%) |
| 45 to 54 Years | 0 (0.0%) | 2 (4.4%) |
| 55 to 64 Years | 0 (0.0%) | 10 (100.0%) |
| 65 to 74 Years | 39 (100.0%) | 29 (74.4%) |
| 75 Years and over | 39 (100.0%) | 8 (20.5%) |
| Total | 80 (53.3%) | 64 (42.7%) |
Disability Status by Sex by Age in Salesville
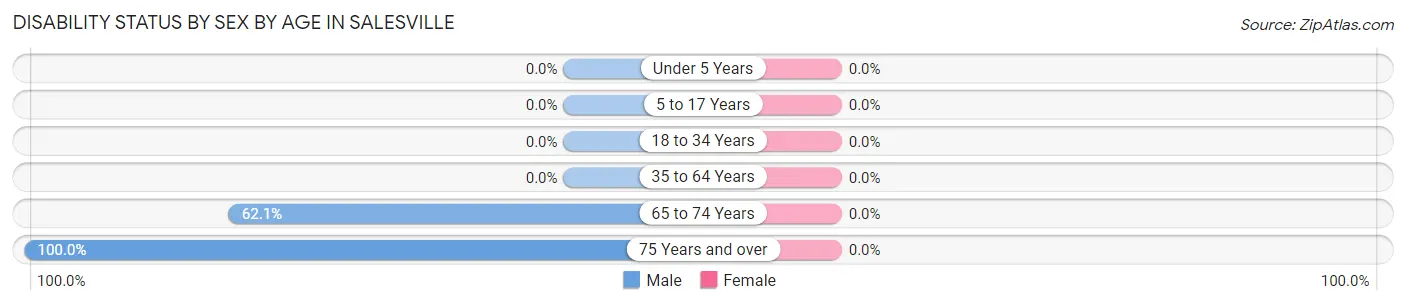
| Age Bracket | Male | Female |
| Under 5 Years | 0 (0.0%) | 0 (0.0%) |
| 5 to 17 Years | 0 (0.0%) | 0 (0.0%) |
| 18 to 34 Years | 0 (0.0%) | 0 (0.0%) |
| 35 to 64 Years | 0 (0.0%) | 0 (0.0%) |
| 65 to 74 Years | 18 (62.1%) | 0 (0.0%) |
| 75 Years and over | 31 (100.0%) | 0 (0.0%) |
Disability Class by Sex by Age in Salesville
Disability Class: Hearing Difficulty
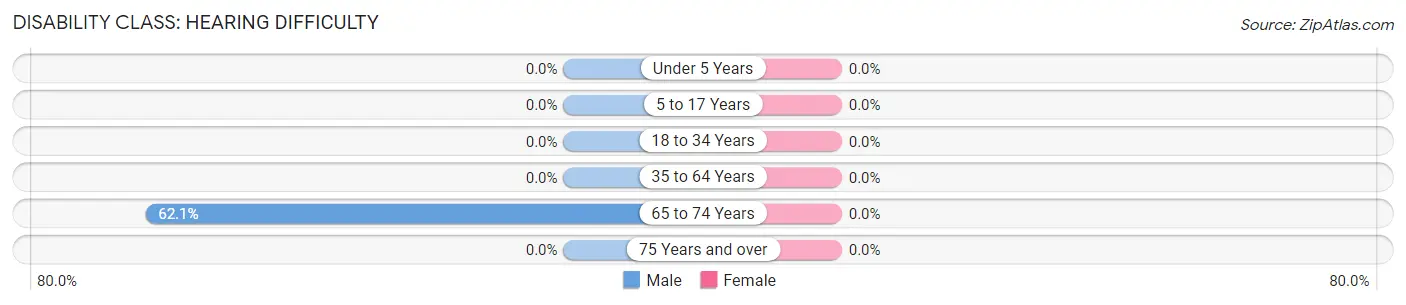
| Age Bracket | Male | Female |
| Under 5 Years | 0 (0.0%) | 0 (0.0%) |
| 5 to 17 Years | 0 (0.0%) | 0 (0.0%) |
| 18 to 34 Years | 0 (0.0%) | 0 (0.0%) |
| 35 to 64 Years | 0 (0.0%) | 0 (0.0%) |
| 65 to 74 Years | 18 (62.1%) | 0 (0.0%) |
| 75 Years and over | 0 (0.0%) | 0 (0.0%) |
Disability Class: Vision Difficulty
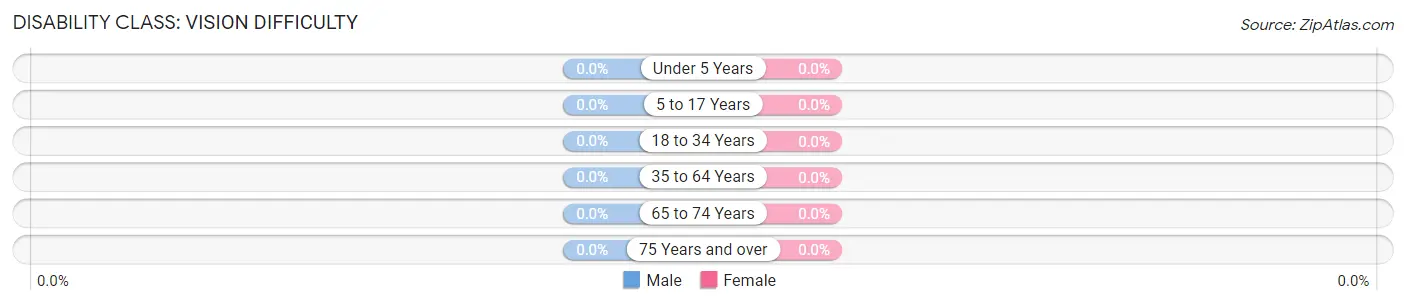
| Age Bracket | Male | Female |
| Under 5 Years | 0 (0.0%) | 0 (0.0%) |
| 5 to 17 Years | 0 (0.0%) | 0 (0.0%) |
| 18 to 34 Years | 0 (0.0%) | 0 (0.0%) |
| 35 to 64 Years | 0 (0.0%) | 0 (0.0%) |
| 65 to 74 Years | 0 (0.0%) | 0 (0.0%) |
| 75 Years and over | 0 (0.0%) | 0 (0.0%) |
Disability Class: Cognitive Difficulty
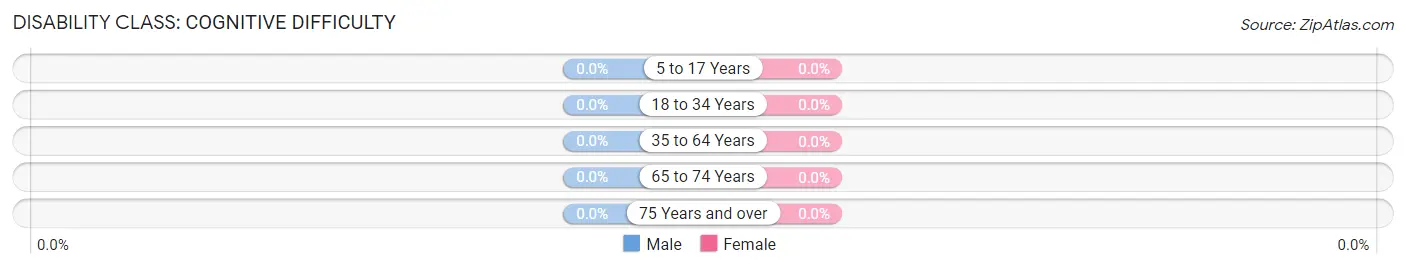
| Age Bracket | Male | Female |
| 5 to 17 Years | 0 (0.0%) | 0 (0.0%) |
| 18 to 34 Years | 0 (0.0%) | 0 (0.0%) |
| 35 to 64 Years | 0 (0.0%) | 0 (0.0%) |
| 65 to 74 Years | 0 (0.0%) | 0 (0.0%) |
| 75 Years and over | 0 (0.0%) | 0 (0.0%) |
Disability Class: Ambulatory Difficulty
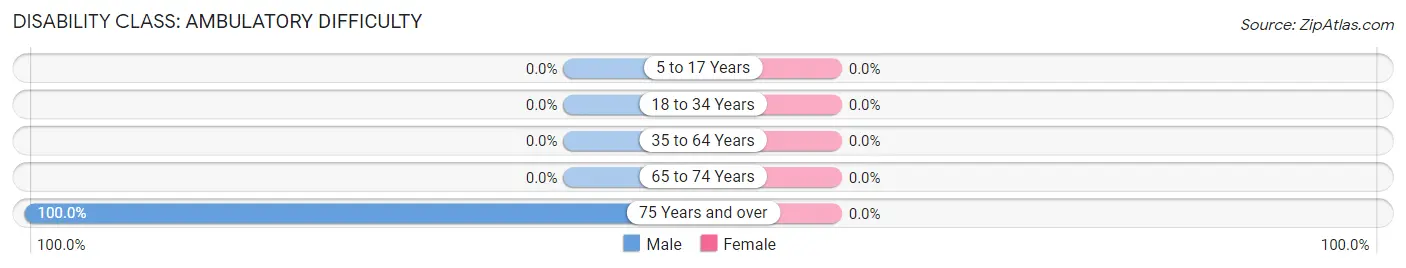
| Age Bracket | Male | Female |
| 5 to 17 Years | 0 (0.0%) | 0 (0.0%) |
| 18 to 34 Years | 0 (0.0%) | 0 (0.0%) |
| 35 to 64 Years | 0 (0.0%) | 0 (0.0%) |
| 65 to 74 Years | 0 (0.0%) | 0 (0.0%) |
| 75 Years and over | 31 (100.0%) | 0 (0.0%) |
Disability Class: Self-Care Difficulty

| Age Bracket | Male | Female |
| 5 to 17 Years | 0 (0.0%) | 0 (0.0%) |
| 18 to 34 Years | 0 (0.0%) | 0 (0.0%) |
| 35 to 64 Years | 0 (0.0%) | 0 (0.0%) |
| 65 to 74 Years | 0 (0.0%) | 0 (0.0%) |
| 75 Years and over | 0 (0.0%) | 0 (0.0%) |
Technology Access in Salesville
Computing Device Access in Salesville
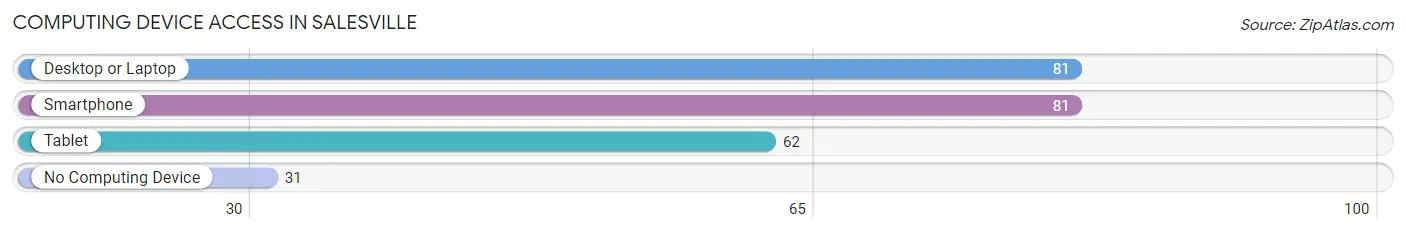
| Device Type | # Households | % Households |
| Desktop or Laptop | 81 | 72.3% |
| Smartphone | 81 | 72.3% |
| Tablet | 62 | 55.4% |
| No Computing Device | 31 | 27.7% |
| Total | 112 | 100.0% |
Internet Access in Salesville
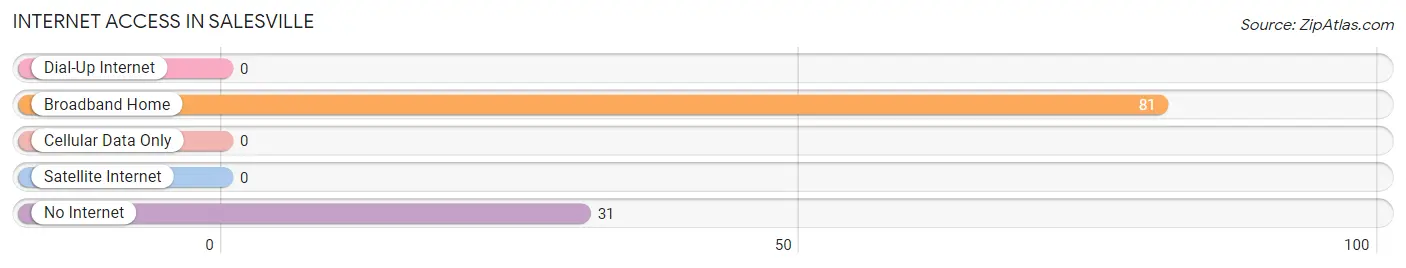
| Internet Type | # Households | % Households |
| Dial-Up Internet | 0 | 0.0% |
| Broadband Home | 81 | 72.3% |
| Cellular Data Only | 0 | 0.0% |
| Satellite Internet | 0 | 0.0% |
| No Internet | 31 | 27.7% |
| Total | 112 | 100.0% |
Salesville Summary
Salesville, Ohio is a small village located in Guernsey County, Ohio. It is situated on the banks of the Muskingum River, approximately 25 miles east of Cambridge. The village has a population of approximately 500 people and is part of the Cambridge Micropolitan Statistical Area.
History
The area that is now Salesville was first settled in 1806 by a group of settlers from Pennsylvania. The village was originally known as “Mud Creek”, but was later renamed “Salesville” in honor of the first settler, John Sale. The village was officially incorporated in 1837.
In the late 19th century, Salesville was a thriving agricultural community. The village was home to several mills, including a grist mill, a saw mill, and a woolen mill. The village also had a blacksmith shop, a general store, and a post office.
In the early 20th century, the village began to decline as the population shifted to larger cities. The mills and other businesses closed, and the population decreased. In the 1950s, the village was revitalized with the construction of a new bridge over the Muskingum River. This allowed for increased access to the village and helped to attract new businesses and residents.
Geography
Salesville is located in Guernsey County, Ohio. It is situated on the banks of the Muskingum River, approximately 25 miles east of Cambridge. The village is located in a rural area, surrounded by rolling hills and farmland. The climate is humid continental, with hot summers and cold winters.
Economy
The economy of Salesville is largely based on agriculture. The village is home to several farms, which produce a variety of crops, including corn, soybeans, and wheat. The village also has several small businesses, including a grocery store, a hardware store, and a restaurant.
Demographics
As of the 2010 census, the population of Salesville was 498. The racial makeup of the village was 97.2% White, 0.2% African American, 0.2% Native American, 0.4% Asian, 0.2% from other races, and 1.9% from two or more races. Hispanic or Latino of any race were 0.6% of the population.
The median household income in Salesville was $37,500, and the median family income was $41,250. The per capita income was $17,845. About 11.2% of families and 13.2% of the population were below the poverty line, including 16.7% of those under age 18 and 8.3% of those age 65 or over.
Salesville is a small village with a rich history and a strong agricultural economy. The village is home to a diverse population and offers a variety of amenities and services. With its close proximity to larger cities, Salesville is an ideal place to live and work.
Common Questions
What is Per Capita Income in Salesville?
Per Capita income in Salesville is $31,763.
What is the Median Family Income in Salesville?
Median Family Income in Salesville is $88,750.
What is the Median Household income in Salesville?
Median Household Income in Salesville is $36,453.
What is Inequality or Gini Index in Salesville?
Inequality or Gini Index in Salesville is 0.37.
What is the Total Population of Salesville?
Total Population of Salesville is 150.
What is the Total Male Population of Salesville?
Total Male Population of Salesville is 106.
What is the Total Female Population of Salesville?
Total Female Population of Salesville is 44.
What is the Ratio of Males per 100 Females in Salesville?
There are 240.91 Males per 100 Females in Salesville.
What is the Ratio of Females per 100 Males in Salesville?
There are 41.51 Females per 100 Males in Salesville.
What is the Median Population Age in Salesville?
Median Population Age in Salesville is 69.3 Years.
What is the Average Family Size in Salesville
Average Family Size in Salesville is 2.0 People.
What is the Average Household Size in Salesville
Average Household Size in Salesville is 1.3 People.
How Large is the Labor Force in Salesville?
There are 81 People in the Labor Forcein in Salesville.
What is the Percentage of People in the Labor Force in Salesville?
54.4% of People are in the Labor Force in Salesville.