Rushville, OH Map & Demographics
Rushville Map
Rushville Overview
$29,940
PER CAPITA INCOME
$67,596
AVG FAMILY INCOME
$67,723
AVG HOUSEHOLD INCOME
0.40
INEQUALITY / GINI INDEX
326
TOTAL POPULATION
192
MALE POPULATION
134
FEMALE POPULATION
143.28
MALES / 100 FEMALES
69.79
FEMALES / 100 MALES
41.0
MEDIAN AGE
3.1
AVG FAMILY SIZE
2.8
AVG HOUSEHOLD SIZE
158
LABOR FORCE [ PEOPLE ]
65.3%
PERCENT IN LABOR FORCE
2.5%
UNEMPLOYMENT RATE
Rushville Zip Codes
Rushville Area Codes
Income in Rushville
Income Overview in Rushville
Per Capita Income in Rushville is $29,940, while median incomes of families and households are $67,596 and $67,723 respectively.
| Characteristic | Number | Measure |
| Per Capita Income | 326 | $29,940 |
| Median Family Income | 98 | $67,596 |
| Mean Family Income | 98 | $79,009 |
| Median Household Income | 115 | $67,723 |
| Mean Household Income | 115 | $75,968 |
| Income Deficit | 98 | $0 |
| Wage / Income Gap (%) | 326 | 0.00% |
| Wage / Income Gap ($) | 326 | 100.00¢ per $1 |
| Gini / Inequality Index | 326 | 0.40 |
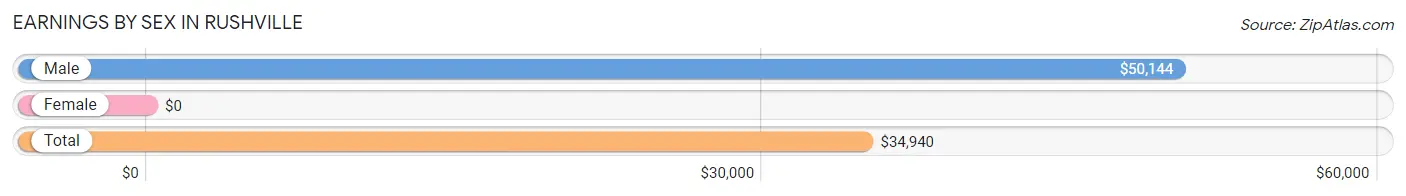
Earnings by Sex in Rushville
| Sex | Number | Average Earnings |
| Male | 103 (64.8%) | $50,144 |
| Female | 56 (35.2%) | $0 |
| Total | 159 (100.0%) | $34,940 |
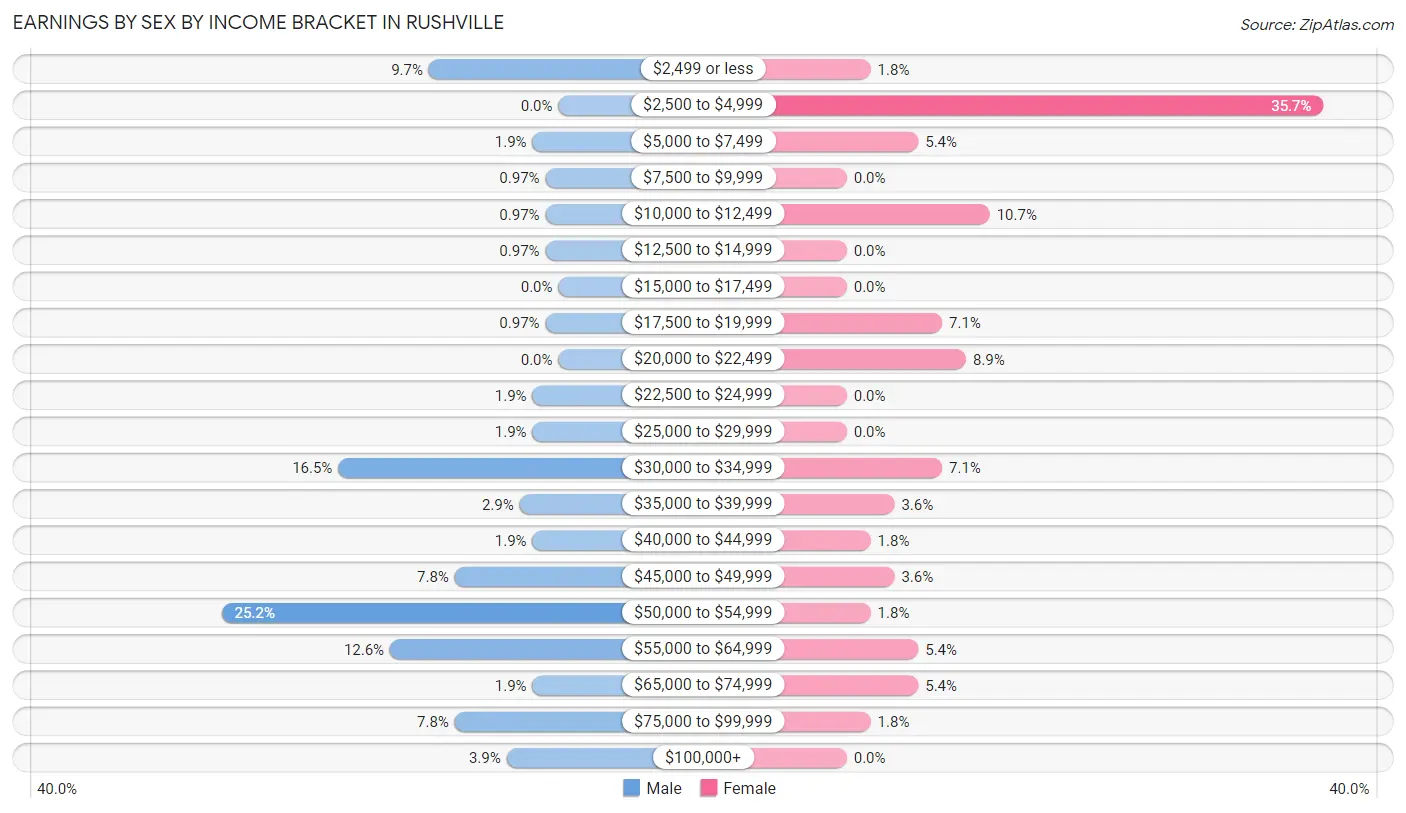
Earnings by Sex by Income Bracket in Rushville
The most common earnings brackets in Rushville are $50,000 to $54,999 for men (26 | 25.2%) and $2,500 to $4,999 for women (20 | 35.7%).
| Income | Male | Female |
| $2,499 or less | 10 (9.7%) | 1 (1.8%) |
| $2,500 to $4,999 | 0 (0.0%) | 20 (35.7%) |
| $5,000 to $7,499 | 2 (1.9%) | 3 (5.4%) |
| $7,500 to $9,999 | 1 (1.0%) | 0 (0.0%) |
| $10,000 to $12,499 | 1 (1.0%) | 6 (10.7%) |
| $12,500 to $14,999 | 1 (1.0%) | 0 (0.0%) |
| $15,000 to $17,499 | 0 (0.0%) | 0 (0.0%) |
| $17,500 to $19,999 | 1 (1.0%) | 4 (7.1%) |
| $20,000 to $22,499 | 0 (0.0%) | 5 (8.9%) |
| $22,500 to $24,999 | 2 (1.9%) | 0 (0.0%) |
| $25,000 to $29,999 | 2 (1.9%) | 0 (0.0%) |
| $30,000 to $34,999 | 17 (16.5%) | 4 (7.1%) |
| $35,000 to $39,999 | 3 (2.9%) | 2 (3.6%) |
| $40,000 to $44,999 | 2 (1.9%) | 1 (1.8%) |
| $45,000 to $49,999 | 8 (7.8%) | 2 (3.6%) |
| $50,000 to $54,999 | 26 (25.2%) | 1 (1.8%) |
| $55,000 to $64,999 | 13 (12.6%) | 3 (5.4%) |
| $65,000 to $74,999 | 2 (1.9%) | 3 (5.4%) |
| $75,000 to $99,999 | 8 (7.8%) | 1 (1.8%) |
| $100,000+ | 4 (3.9%) | 0 (0.0%) |
| Total | 103 (100.0%) | 56 (100.0%) |
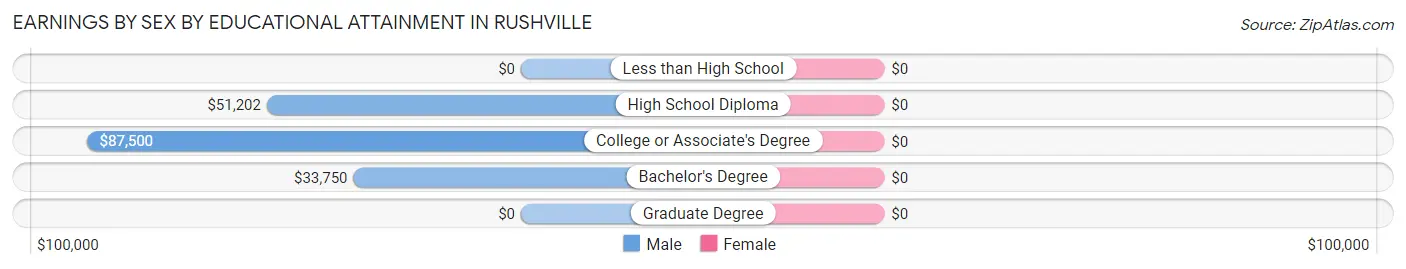
Earnings by Sex by Educational Attainment in Rushville
| Educational Attainment | Male Income | Female Income |
| Less than High School | - | - |
| High School Diploma | $51,202 | $0 |
| College or Associate's Degree | $87,500 | $0 |
| Bachelor's Degree | $33,750 | $0 |
| Graduate Degree | - | - |
| Total | $50,913 | $0 |
Family Income in Rushville
Family Income Brackets in Rushville
According to the Rushville family income data, there are 41 families falling into the $50,000 to $74,999 income range, which is the most common income bracket and makes up 41.8% of all families. Conversely, the less than $10,000 income bracket is the least frequent group with only 1 families (1.0%) belonging to this category.
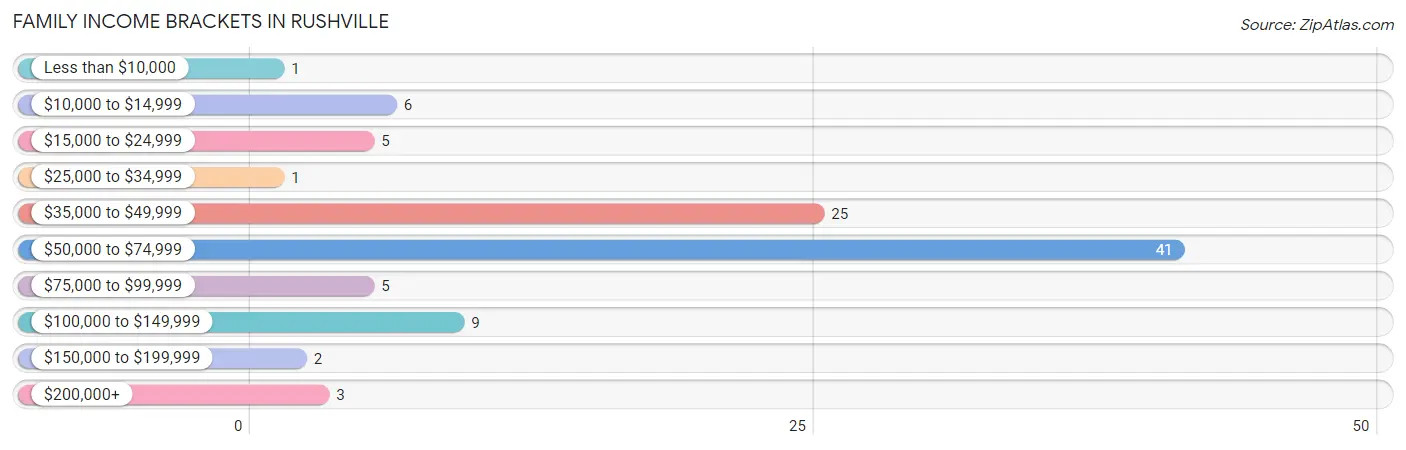
| Income Bracket | # Families | % Families |
| Less than $10,000 | 1 | 1.0% |
| $10,000 to $14,999 | 6 | 6.1% |
| $15,000 to $24,999 | 5 | 5.1% |
| $25,000 to $34,999 | 1 | 1.0% |
| $35,000 to $49,999 | 25 | 25.5% |
| $50,000 to $74,999 | 41 | 41.8% |
| $75,000 to $99,999 | 5 | 5.1% |
| $100,000 to $149,999 | 9 | 9.2% |
| $150,000 to $199,999 | 2 | 2.0% |
| $200,000+ | 3 | 3.1% |
Family Income by Famaliy Size in Rushville
3-person families (37 | 37.8%) account for the highest median family income in Rushville with $68,798 per family, while 2-person families (39 | 39.8%) have the highest median income of $23,840 per family member.
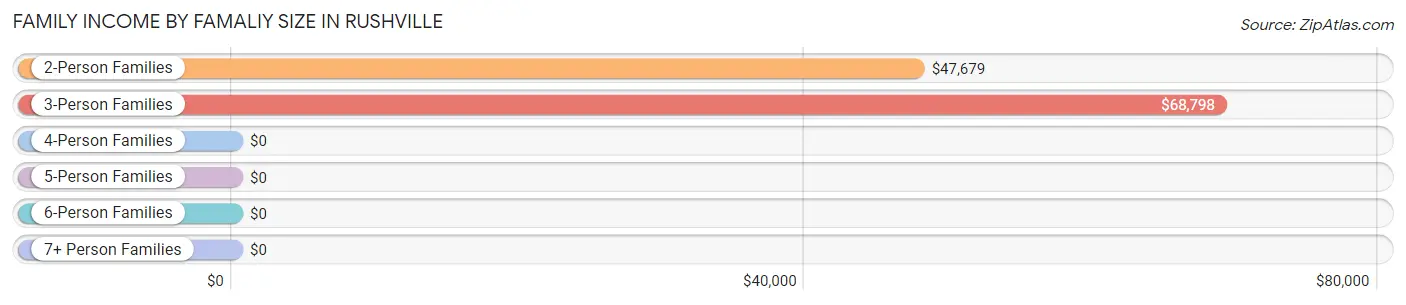
| Income Bracket | # Families | Median Income |
| 2-Person Families | 39 (39.8%) | $47,679 |
| 3-Person Families | 37 (37.8%) | $68,798 |
| 4-Person Families | 9 (9.2%) | $0 |
| 5-Person Families | 4 (4.1%) | $0 |
| 6-Person Families | 8 (8.2%) | $0 |
| 7+ Person Families | 1 (1.0%) | $0 |
| Total | 98 (100.0%) | $67,596 |
Family Income by Number of Earners in Rushville
The median family income in Rushville is $67,596, with families comprising 3+ earners (7) having the highest median family income of $117,188, while families with no earners (17) have the lowest median family income of $49,107, accounting for 7.1% and 17.3% of families, respectively.
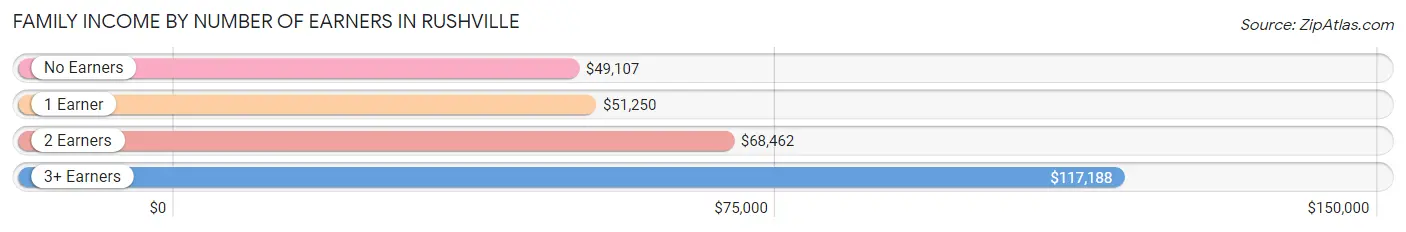
| Number of Earners | # Families | Median Income |
| No Earners | 17 (17.3%) | $49,107 |
| 1 Earner | 24 (24.5%) | $51,250 |
| 2 Earners | 50 (51.0%) | $68,462 |
| 3+ Earners | 7 (7.1%) | $117,188 |
| Total | 98 (100.0%) | $67,596 |
Household Income in Rushville
Household Income Brackets in Rushville
With 49 households falling in the category, the $50,000 to $74,999 income range is the most frequent in Rushville, accounting for 42.6% of all households. In contrast, only 2 households (1.7%) fall into the $25,000 to $34,999 income bracket, making it the least populous group.
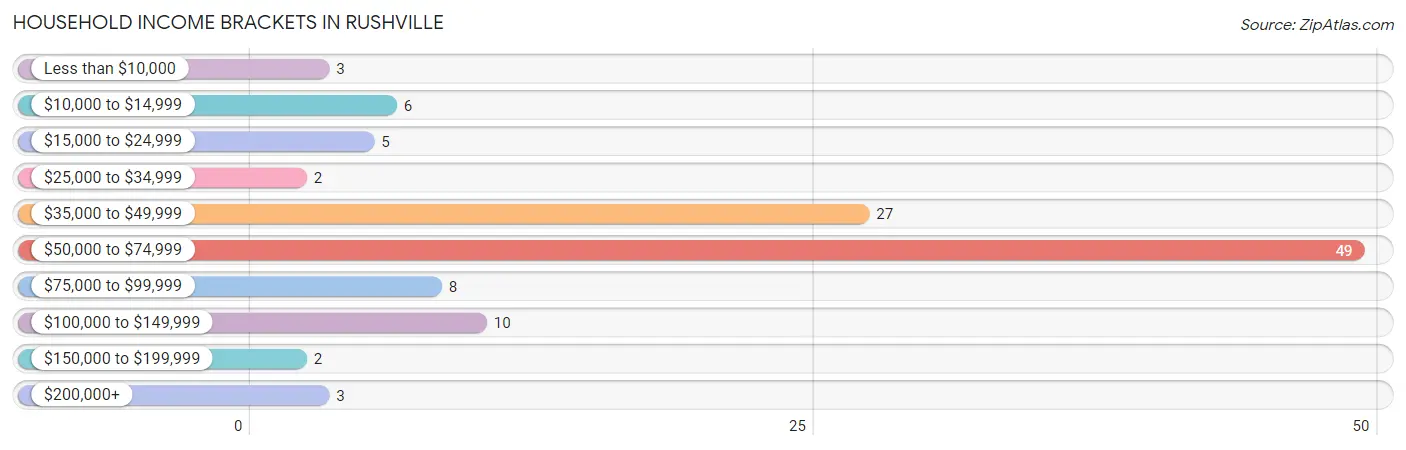
| Income Bracket | # Households | % Households |
| Less than $10,000 | 3 | 2.6% |
| $10,000 to $14,999 | 6 | 5.2% |
| $15,000 to $24,999 | 5 | 4.3% |
| $25,000 to $34,999 | 2 | 1.7% |
| $35,000 to $49,999 | 27 | 23.5% |
| $50,000 to $74,999 | 49 | 42.6% |
| $75,000 to $99,999 | 8 | 7.0% |
| $100,000 to $149,999 | 10 | 8.7% |
| $150,000 to $199,999 | 2 | 1.7% |
| $200,000+ | 3 | 2.6% |
Household Income by Householder Age in Rushville
The median household income in Rushville is $67,723, with the highest median household income of $70,313 found in the 65+ years age bracket for the primary householder. A total of 31 households (27.0%) fall into this category. Meanwhile, the 15 to 24 years age bracket for the primary householder has the lowest median household income of $0, with 3 households (2.6%) in this group.
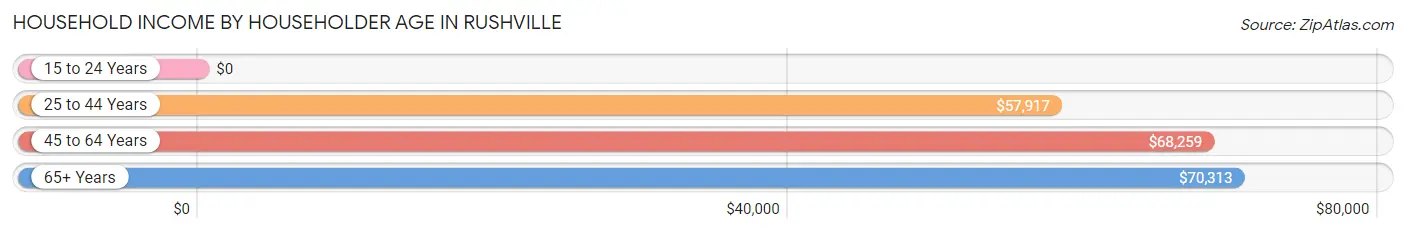
| Income Bracket | # Households | Median Income |
| 15 to 24 Years | 3 (2.6%) | $0 |
| 25 to 44 Years | 34 (29.6%) | $57,917 |
| 45 to 64 Years | 47 (40.9%) | $68,259 |
| 65+ Years | 31 (27.0%) | $70,313 |
| Total | 115 (100.0%) | $67,723 |
Poverty in Rushville
Income Below Poverty by Sex and Age in Rushville
With 6.8% poverty level for males and 28.4% for females among the residents of Rushville, 12 to 14 year old males and under 5 year old females are the most vulnerable to poverty, with 4 males (26.7%) and 14 females (93.3%) in their respective age groups living below the poverty level.
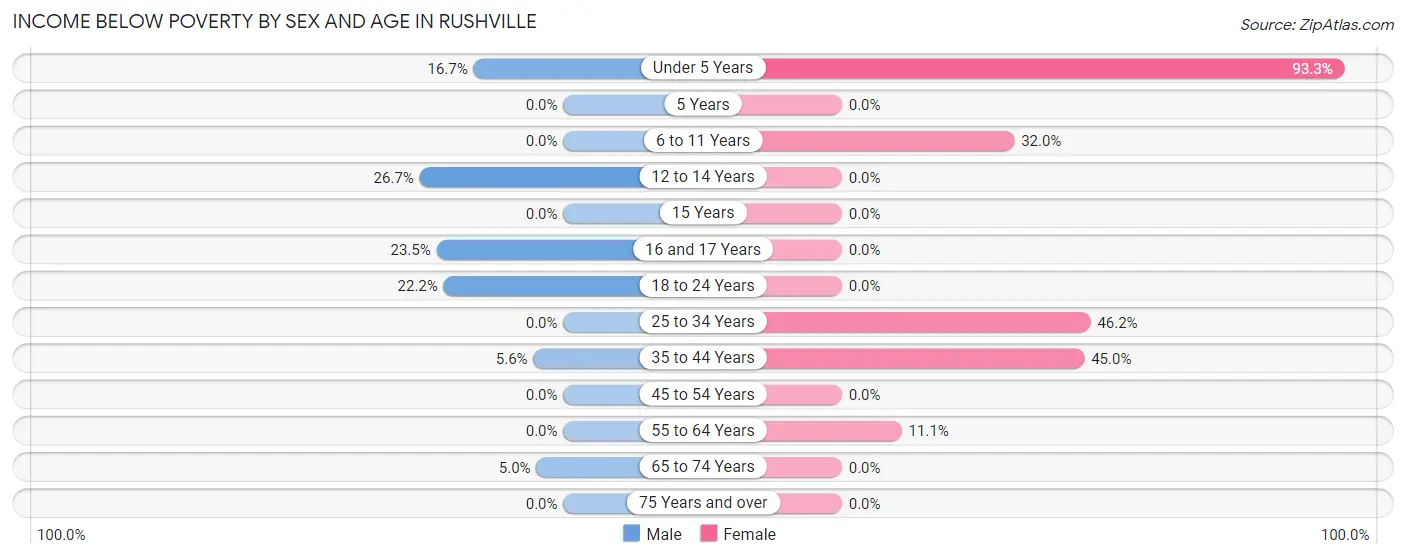
| Age Bracket | Male | Female |
| Under 5 Years | 1 (16.7%) | 14 (93.3%) |
| 5 Years | 0 (0.0%) | 0 (0.0%) |
| 6 to 11 Years | 0 (0.0%) | 8 (32.0%) |
| 12 to 14 Years | 4 (26.7%) | 0 (0.0%) |
| 15 Years | 0 (0.0%) | 0 (0.0%) |
| 16 and 17 Years | 4 (23.5%) | 0 (0.0%) |
| 18 to 24 Years | 2 (22.2%) | 0 (0.0%) |
| 25 to 34 Years | 0 (0.0%) | 6 (46.2%) |
| 35 to 44 Years | 1 (5.6%) | 9 (45.0%) |
| 45 to 54 Years | 0 (0.0%) | 0 (0.0%) |
| 55 to 64 Years | 0 (0.0%) | 1 (11.1%) |
| 65 to 74 Years | 1 (5.0%) | 0 (0.0%) |
| 75 Years and over | 0 (0.0%) | 0 (0.0%) |
| Total | 13 (6.8%) | 38 (28.4%) |
Income Above Poverty by Sex and Age in Rushville
According to the poverty statistics in Rushville, males aged 5 years and females aged 5 years are the age groups that are most secure financially, with 100.0% of males and 100.0% of females in these age groups living above the poverty line.
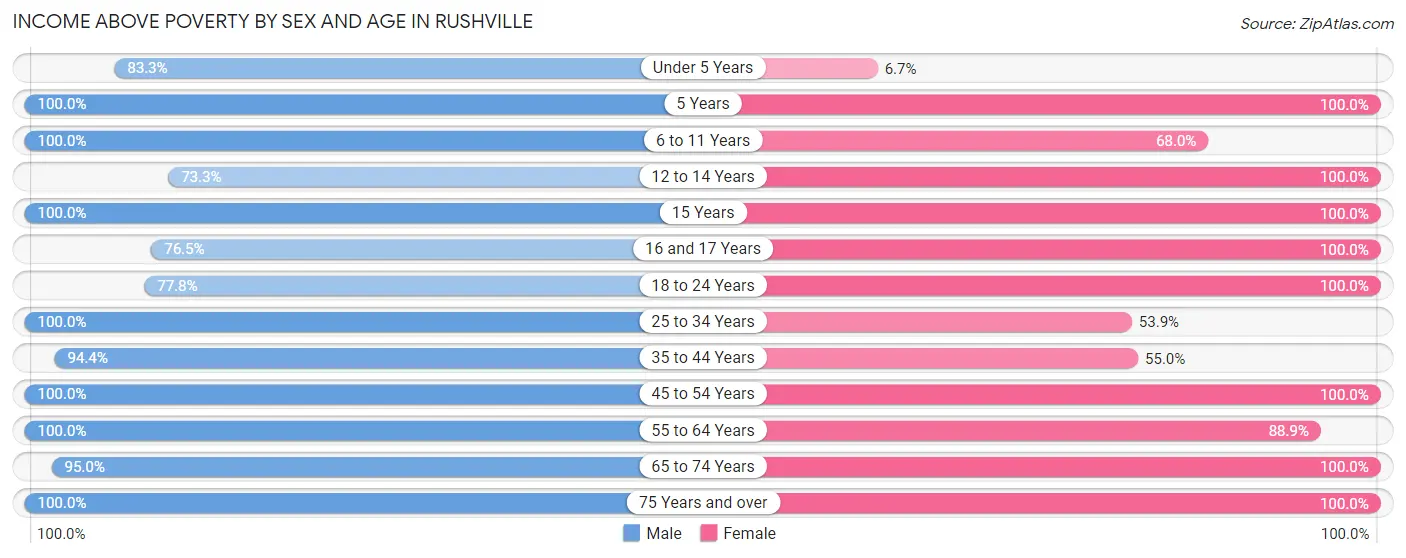
| Age Bracket | Male | Female |
| Under 5 Years | 5 (83.3%) | 1 (6.7%) |
| 5 Years | 4 (100.0%) | 3 (100.0%) |
| 6 to 11 Years | 13 (100.0%) | 17 (68.0%) |
| 12 to 14 Years | 11 (73.3%) | 1 (100.0%) |
| 15 Years | 1 (100.0%) | 1 (100.0%) |
| 16 and 17 Years | 13 (76.5%) | 2 (100.0%) |
| 18 to 24 Years | 7 (77.8%) | 1 (100.0%) |
| 25 to 34 Years | 6 (100.0%) | 7 (53.8%) |
| 35 to 44 Years | 17 (94.4%) | 11 (55.0%) |
| 45 to 54 Years | 48 (100.0%) | 19 (100.0%) |
| 55 to 64 Years | 5 (100.0%) | 8 (88.9%) |
| 65 to 74 Years | 19 (95.0%) | 14 (100.0%) |
| 75 Years and over | 30 (100.0%) | 11 (100.0%) |
| Total | 179 (93.2%) | 96 (71.6%) |
Income Below Poverty Among Married-Couple Families in Rushville
The poverty statistics for married-couple families in Rushville show that 2.9% or 2 of the total 70 families live below the poverty line. Families with 1 or 2 children have the highest poverty rate of 33.3%, comprising of 1 families. On the other hand, families with 3 or 4 children have the lowest poverty rate of 0.0%, which includes 0 families.
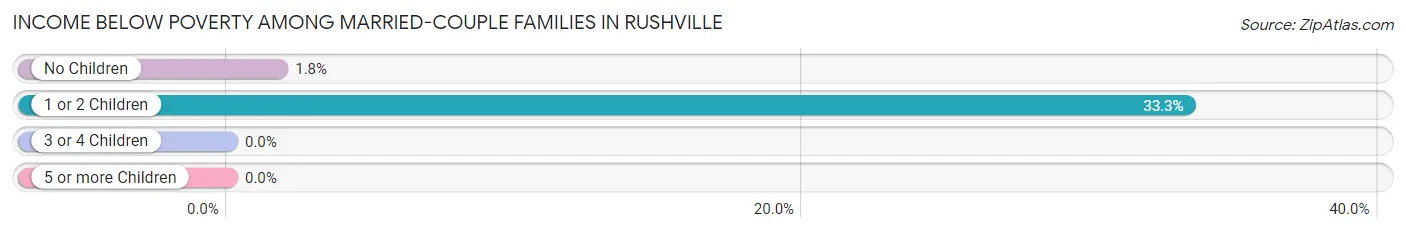
| Children | Above Poverty | Below Poverty |
| No Children | 56 (98.3%) | 1 (1.8%) |
| 1 or 2 Children | 2 (66.7%) | 1 (33.3%) |
| 3 or 4 Children | 10 (100.0%) | 0 (0.0%) |
| 5 or more Children | 0 (0.0%) | 0 (0.0%) |
| Total | 68 (97.1%) | 2 (2.9%) |
Income Below Poverty Among Single-Parent Households in Rushville
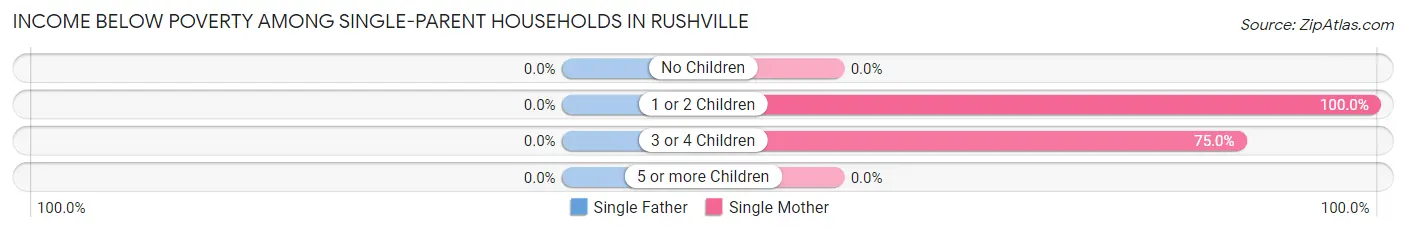
| Children | Single Father | Single Mother |
| No Children | 0 (0.0%) | 0 (0.0%) |
| 1 or 2 Children | 0 (0.0%) | 4 (100.0%) |
| 3 or 4 Children | 0 (0.0%) | 6 (75.0%) |
| 5 or more Children | 0 (0.0%) | 0 (0.0%) |
| Total | 0 (0.0%) | 10 (76.9%) |
Income Below Poverty Among Married-Couple vs Single-Parent Households in Rushville
The poverty data for Rushville shows that 2 of the married-couple family households (2.9%) and 10 of the single-parent households (35.7%) are living below the poverty level. Within the married-couple family households, those with 1 or 2 children have the highest poverty rate, with 1 households (33.3%) falling below the poverty line. Among the single-parent households, those with 3 or 4 children have the highest poverty rate, with 6 household (75.0%) living below poverty.
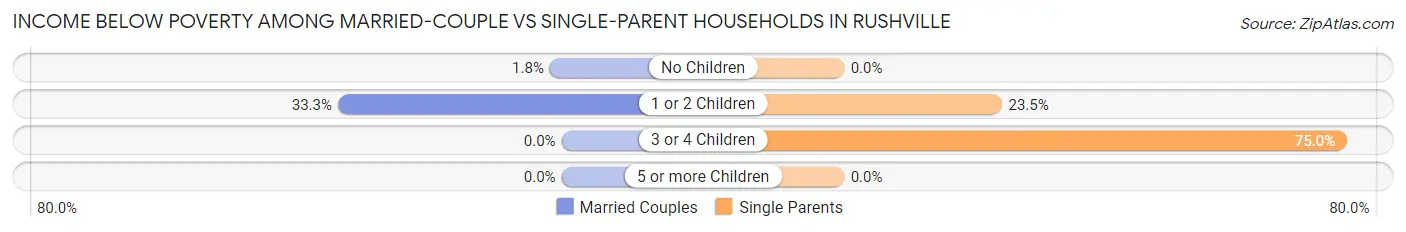
| Children | Married-Couple Families | Single-Parent Households |
| No Children | 1 (1.8%) | 0 (0.0%) |
| 1 or 2 Children | 1 (33.3%) | 4 (23.5%) |
| 3 or 4 Children | 0 (0.0%) | 6 (75.0%) |
| 5 or more Children | 0 (0.0%) | 0 (0.0%) |
| Total | 2 (2.9%) | 10 (35.7%) |
Race in Rushville
The most populous races in Rushville are White / Caucasian (317 | 97.2%), and Two or more Races (9 | 2.8%).
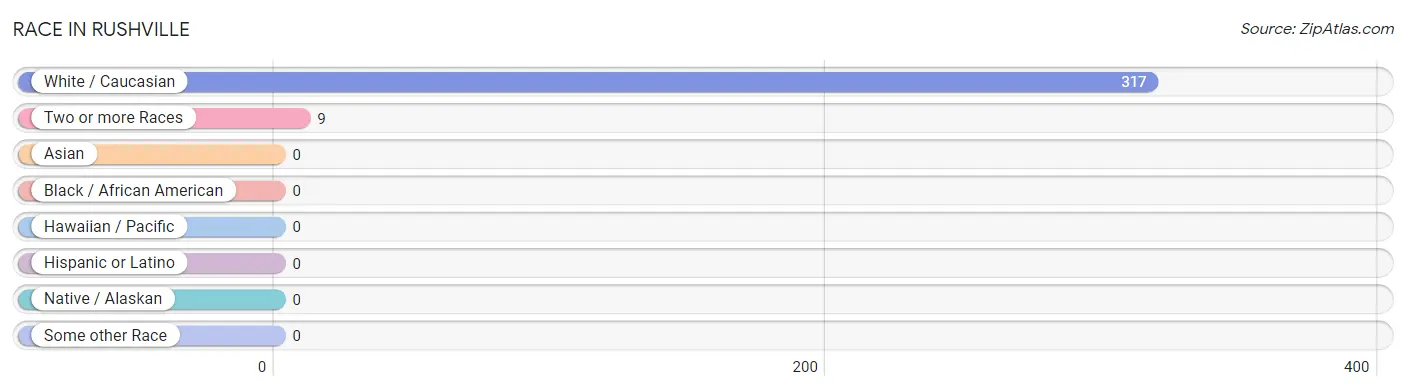
| Race | # Population | % Population |
| Asian | 0 | 0.0% |
| Black / African American | 0 | 0.0% |
| Hawaiian / Pacific | 0 | 0.0% |
| Hispanic or Latino | 0 | 0.0% |
| Native / Alaskan | 0 | 0.0% |
| White / Caucasian | 317 | 97.2% |
| Two or more Races | 9 | 2.8% |
| Some other Race | 0 | 0.0% |
| Total | 326 | 100.0% |
Ancestry in Rushville
The most populous ancestries reported in Rushville are German (64 | 19.6%), English (60 | 18.4%), Irish (32 | 9.8%), Norwegian (23 | 7.1%), and Scottish (10 | 3.1%), together accounting for 58.0% of all Rushville residents.
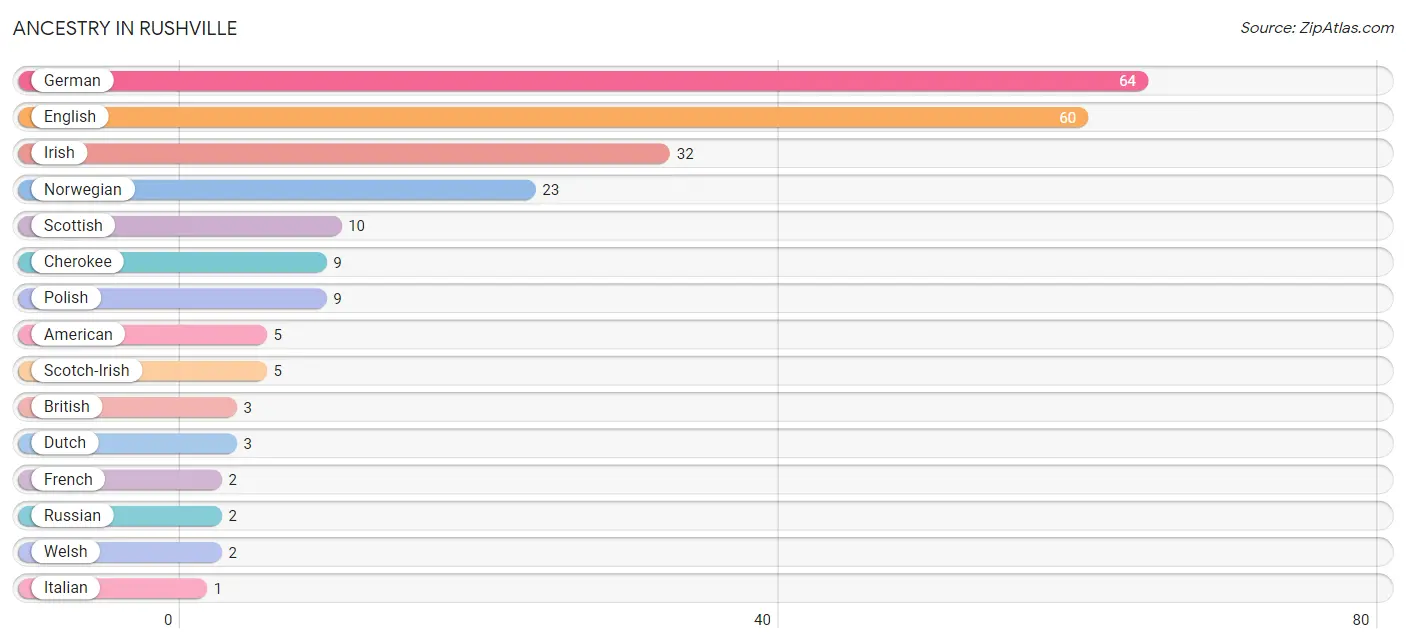
| Ancestry | # Population | % Population |
| American | 5 | 1.5% |
| British | 3 | 0.9% |
| Cherokee | 9 | 2.8% |
| Dutch | 3 | 0.9% |
| English | 60 | 18.4% |
| French | 2 | 0.6% |
| German | 64 | 19.6% |
| Irish | 32 | 9.8% |
| Italian | 1 | 0.3% |
| Norwegian | 23 | 7.1% |
| Polish | 9 | 2.8% |
| Russian | 2 | 0.6% |
| Scotch-Irish | 5 | 1.5% |
| Scottish | 10 | 3.1% |
| Welsh | 2 | 0.6% | View All 15 Rows |
Immigrants in Rushville

| Immigration Origin | # Population | % Population | View All 0 Rows |
Sex and Age in Rushville
Sex and Age in Rushville
The most populous age groups in Rushville are 50 to 54 Years (41 | 21.3%) for men and 50 to 54 Years (19 | 14.2%) for women.
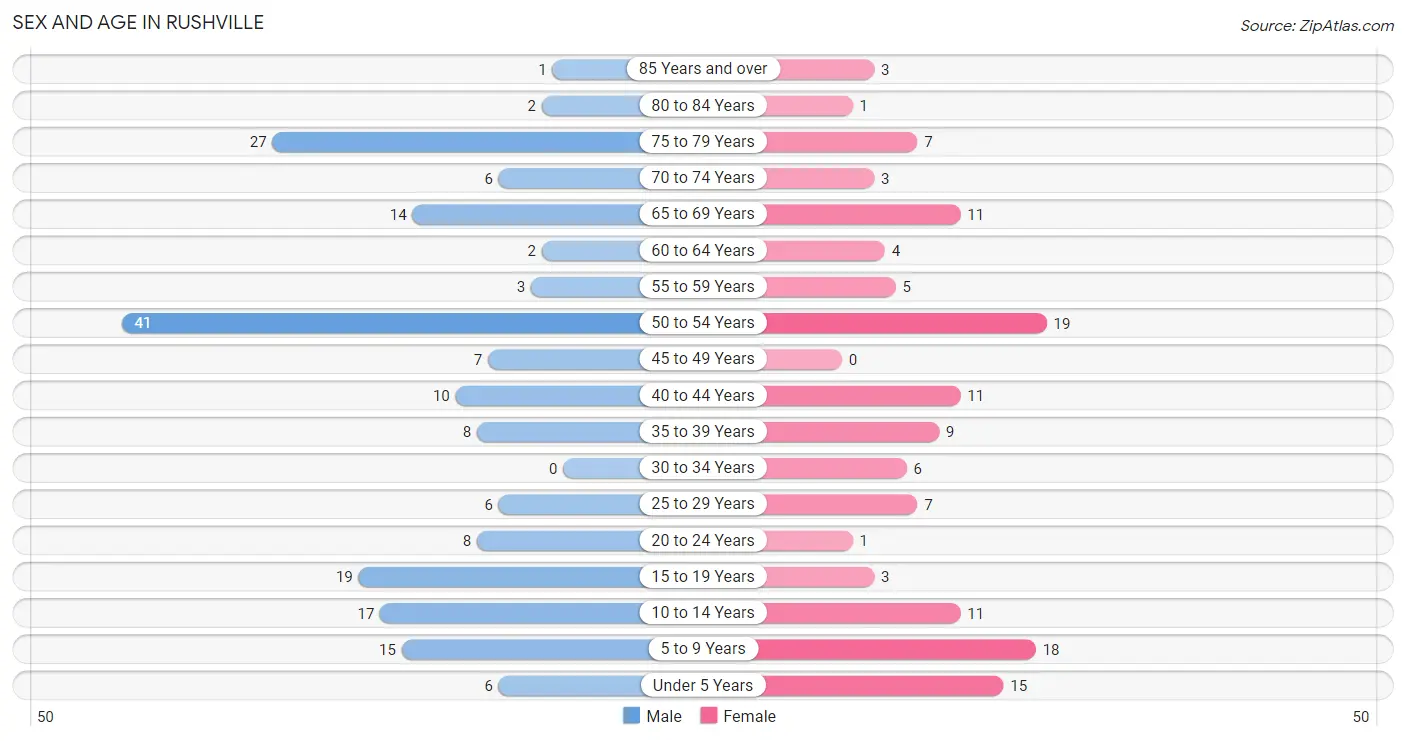
| Age Bracket | Male | Female |
| Under 5 Years | 6 (3.1%) | 15 (11.2%) |
| 5 to 9 Years | 15 (7.8%) | 18 (13.4%) |
| 10 to 14 Years | 17 (8.8%) | 11 (8.2%) |
| 15 to 19 Years | 19 (9.9%) | 3 (2.2%) |
| 20 to 24 Years | 8 (4.2%) | 1 (0.7%) |
| 25 to 29 Years | 6 (3.1%) | 7 (5.2%) |
| 30 to 34 Years | 0 (0.0%) | 6 (4.5%) |
| 35 to 39 Years | 8 (4.2%) | 9 (6.7%) |
| 40 to 44 Years | 10 (5.2%) | 11 (8.2%) |
| 45 to 49 Years | 7 (3.6%) | 0 (0.0%) |
| 50 to 54 Years | 41 (21.3%) | 19 (14.2%) |
| 55 to 59 Years | 3 (1.6%) | 5 (3.7%) |
| 60 to 64 Years | 2 (1.0%) | 4 (3.0%) |
| 65 to 69 Years | 14 (7.3%) | 11 (8.2%) |
| 70 to 74 Years | 6 (3.1%) | 3 (2.2%) |
| 75 to 79 Years | 27 (14.1%) | 7 (5.2%) |
| 80 to 84 Years | 2 (1.0%) | 1 (0.7%) |
| 85 Years and over | 1 (0.5%) | 3 (2.2%) |
| Total | 192 (100.0%) | 134 (100.0%) |
Families and Households in Rushville
Median Family Size in Rushville
The median family size in Rushville is 3.11 persons per family, with single female/mother families (13 | 13.3%) accounting for the largest median family size of 5 persons per family. On the other hand, single male/father families (15 | 15.3%) represent the smallest median family size with 1.87 persons per family.
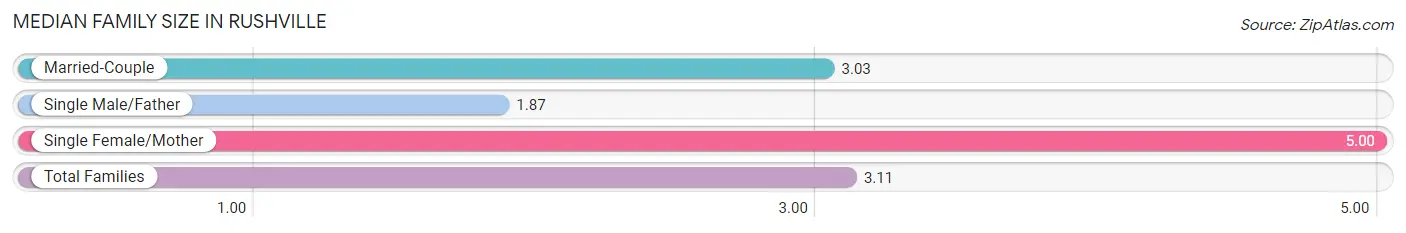
| Family Type | # Families | Family Size |
| Married-Couple | 70 (71.4%) | 3.03 |
| Single Male/Father | 15 (15.3%) | 1.87 |
| Single Female/Mother | 13 (13.3%) | 5.00 |
| Total Families | 98 (100.0%) | 3.11 |
Median Household Size in Rushville
The median household size in Rushville is 2.83 persons per household, with single female/mother households (13 | 11.3%) accounting for the largest median household size of 5 persons per household. non-family households (17 | 14.8%) represent the smallest median household size with 1.12 persons per household.
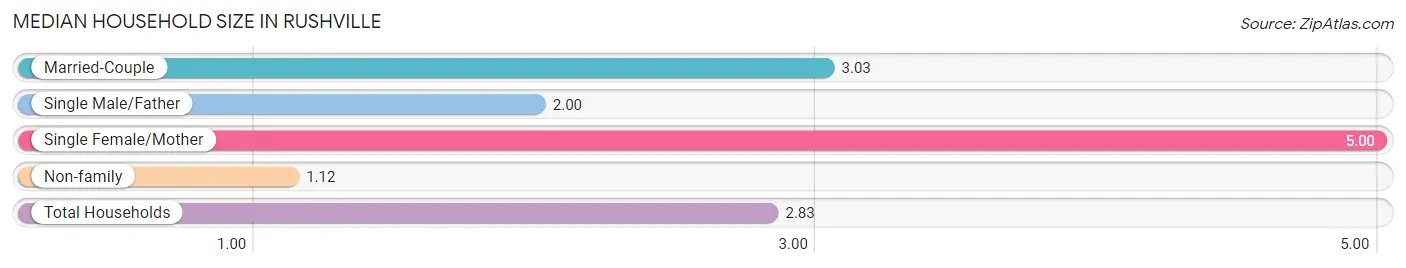
| Household Type | # Households | Household Size |
| Married-Couple | 70 (60.9%) | 3.03 |
| Single Male/Father | 15 (13.0%) | 2.00 |
| Single Female/Mother | 13 (11.3%) | 5.00 |
| Non-family | 17 (14.8%) | 1.12 |
| Total Households | 115 (100.0%) | 2.83 |
Household Size by Marriage Status in Rushville
Out of a total of 115 households in Rushville, 98 (85.2%) are family households, while 17 (14.8%) are nonfamily households. The most numerous type of family households are 2-person households, comprising 39, and the most common type of nonfamily households are 1-person households, comprising 16.
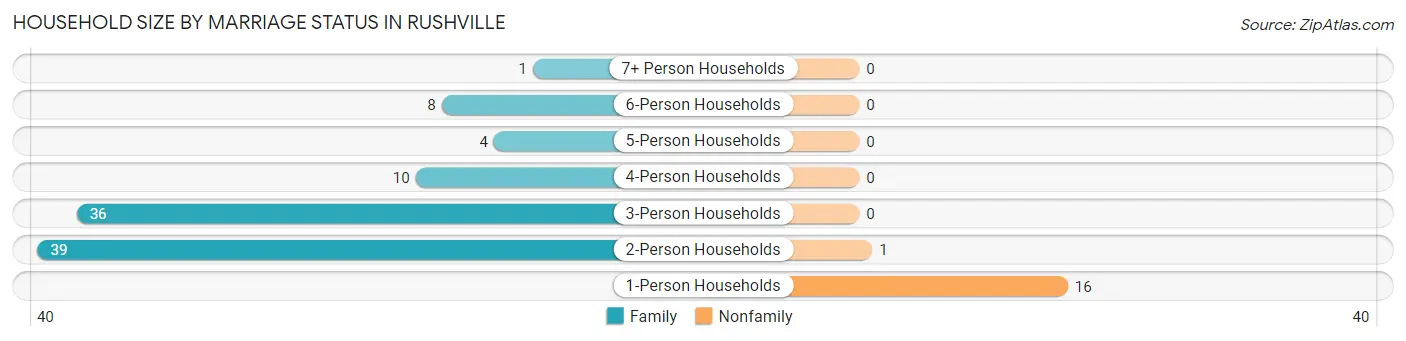
| Household Size | Family Households | Nonfamily Households |
| 1-Person Households | - | 16 (13.9%) |
| 2-Person Households | 39 (33.9%) | 1 (0.9%) |
| 3-Person Households | 36 (31.3%) | 0 (0.0%) |
| 4-Person Households | 10 (8.7%) | 0 (0.0%) |
| 5-Person Households | 4 (3.5%) | 0 (0.0%) |
| 6-Person Households | 8 (7.0%) | 0 (0.0%) |
| 7+ Person Households | 1 (0.9%) | 0 (0.0%) |
| Total | 98 (85.2%) | 17 (14.8%) |
Female Fertility in Rushville
Fertility by Age in Rushville
| Age Bracket | Women with Births | Births / 1,000 Women |
| 15 to 19 years | 0 (0.0%) | 0.0 |
| 20 to 34 years | 0 (0.0%) | 0.0 |
| 35 to 50 years | 0 (0.0%) | 0.0 |
| Total | 0 (0.0%) | 0.0 |
Fertility by Age by Marriage Status in Rushville
| Age Bracket | Married | Unmarried |
| 15 to 19 years | 0 (0.0%) | 0 (0.0%) |
| 20 to 34 years | 0 (0.0%) | 0 (0.0%) |
| 35 to 50 years | 0 (0.0%) | 0 (0.0%) |
| Total | 0 (0.0%) | 0 (0.0%) |
Fertility by Education in Rushville
| Educational Attainment | Women with Births | Births / 1,000 Women |
| Less than High School | 0 (0.0%) | 0.0 |
| High School Diploma | 0 (0.0%) | 0.0 |
| College or Associate's Degree | 0 (0.0%) | 0.0 |
| Bachelor's Degree | 0 (0.0%) | 0.0 |
| Graduate Degree | 0 (0.0%) | 0.0 |
| Total | 0 (0.0%) | 0.0 |
Fertility by Education by Marriage Status in Rushville
| Educational Attainment | Married | Unmarried |
| Less than High School | 0 (0.0%) | 0 (0.0%) |
| High School Diploma | 0 (0.0%) | 0 (0.0%) |
| College or Associate's Degree | 0 (0.0%) | 0 (0.0%) |
| Bachelor's Degree | 0 (0.0%) | 0 (0.0%) |
| Graduate Degree | 0 (0.0%) | 0 (0.0%) |
| Total | 0 (0.0%) | 0 (0.0%) |
Employment Characteristics in Rushville
Employment by Class of Employer in Rushville
Among the 136 employed individuals in Rushville, private company employees (86 | 63.2%), local government employees (23 | 16.9%), and self-employed (incorporated) (8 | 5.9%) make up the most common classes of employment.
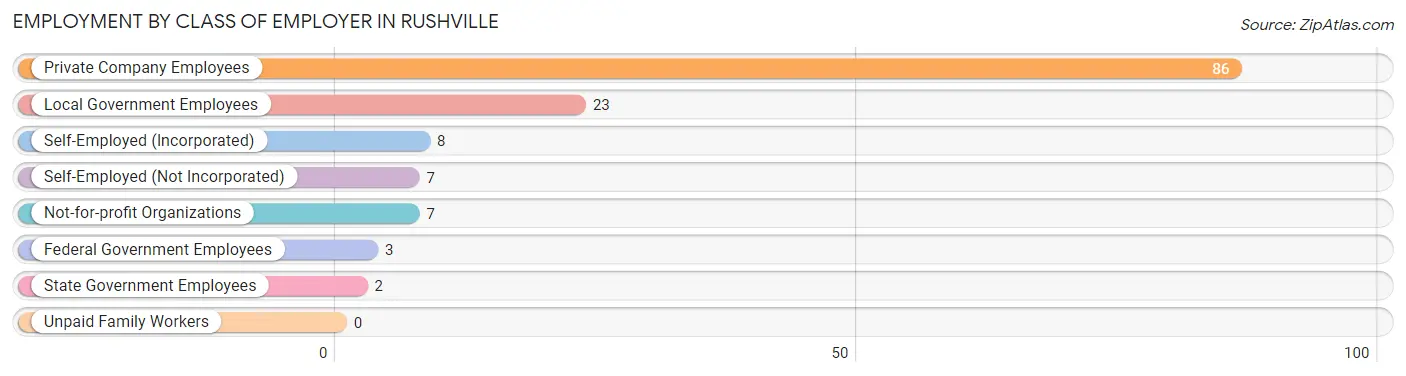
| Employer Class | # Employees | % Employees |
| Private Company Employees | 86 | 63.2% |
| Self-Employed (Incorporated) | 8 | 5.9% |
| Self-Employed (Not Incorporated) | 7 | 5.1% |
| Not-for-profit Organizations | 7 | 5.1% |
| Local Government Employees | 23 | 16.9% |
| State Government Employees | 2 | 1.5% |
| Federal Government Employees | 3 | 2.2% |
| Unpaid Family Workers | 0 | 0.0% |
| Total | 136 | 100.0% |
Employment Status by Age in Rushville
According to the labor force statistics for Rushville, out of the total population over 16 years of age (242), 65.3% or 158 individuals are in the labor force, with 2.5% or 4 of them unemployed. The age group with the highest labor force participation rate is 20 to 24 years, with 100.0% or 9 individuals in the labor force. Within the labor force, the 16 to 19 years age range has the highest percentage of unemployed individuals, with 23.1% or 3 of them being unemployed.
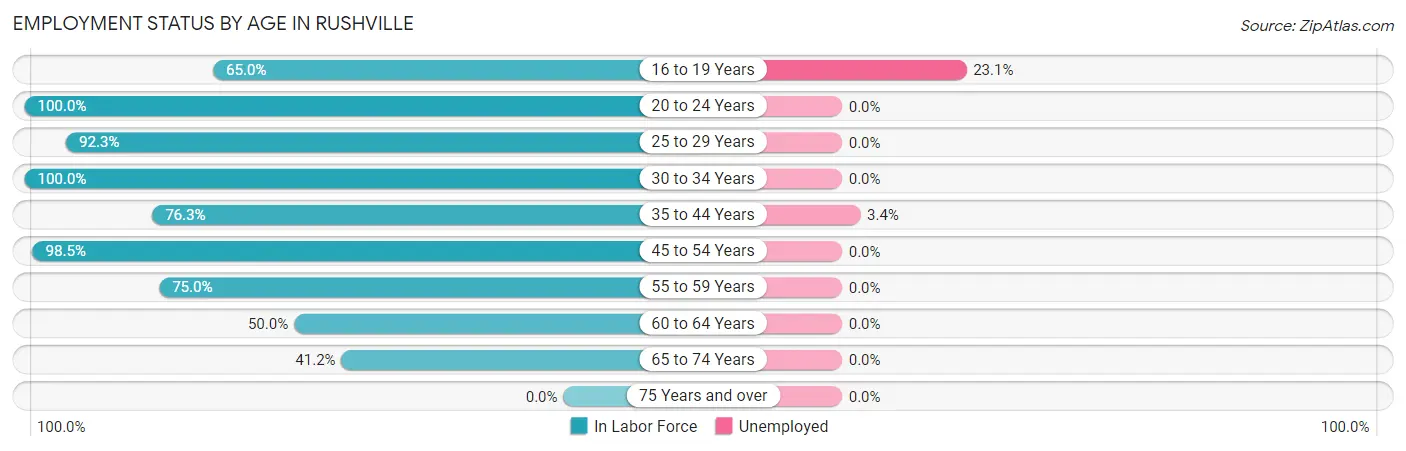
| Age Bracket | In Labor Force | Unemployed |
| 16 to 19 Years | 13 (65.0%) | 3 (23.1%) |
| 20 to 24 Years | 9 (100.0%) | 0 (0.0%) |
| 25 to 29 Years | 12 (92.3%) | 0 (0.0%) |
| 30 to 34 Years | 6 (100.0%) | 0 (0.0%) |
| 35 to 44 Years | 29 (76.3%) | 1 (3.4%) |
| 45 to 54 Years | 66 (98.5%) | 0 (0.0%) |
| 55 to 59 Years | 6 (75.0%) | 0 (0.0%) |
| 60 to 64 Years | 3 (50.0%) | 0 (0.0%) |
| 65 to 74 Years | 14 (41.2%) | 0 (0.0%) |
| 75 Years and over | 0 (0.0%) | 0 (0.0%) |
| Total | 158 (65.3%) | 4 (2.5%) |
Employment Status by Educational Attainment in Rushville
According to labor force statistics for Rushville, 88.4% of individuals (122) out of the total population between 25 and 64 years of age (138) are in the labor force, with 0.8% or 1 of them being unemployed. The group with the highest labor force participation rate are those with the educational attainment of college / associate degree, with 94.6% or 35 individuals in the labor force. Within the labor force, individuals with college / associate degree education have the highest percentage of unemployment, with 2.9% or 1 of them being unemployed.
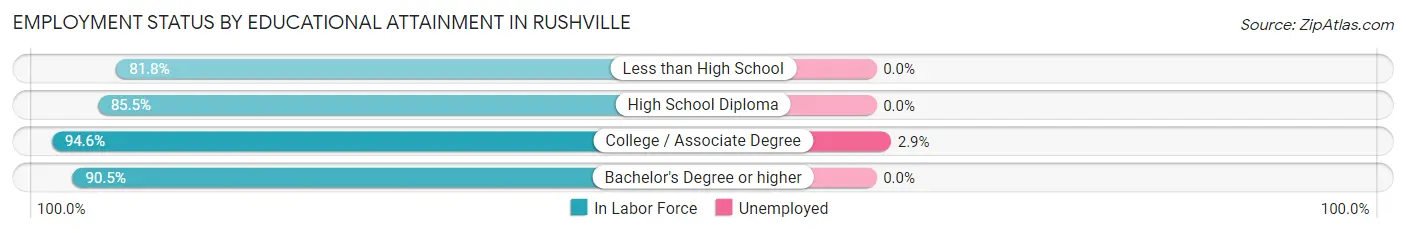
| Educational Attainment | In Labor Force | Unemployed |
| Less than High School | 9 (81.8%) | 0 (0.0%) |
| High School Diploma | 59 (85.5%) | 0 (0.0%) |
| College / Associate Degree | 35 (94.6%) | 1 (2.9%) |
| Bachelor's Degree or higher | 19 (90.5%) | 0 (0.0%) |
| Total | 122 (88.4%) | 1 (0.8%) |
Employment Occupations by Sex in Rushville
Management, Business, Science and Arts Occupations
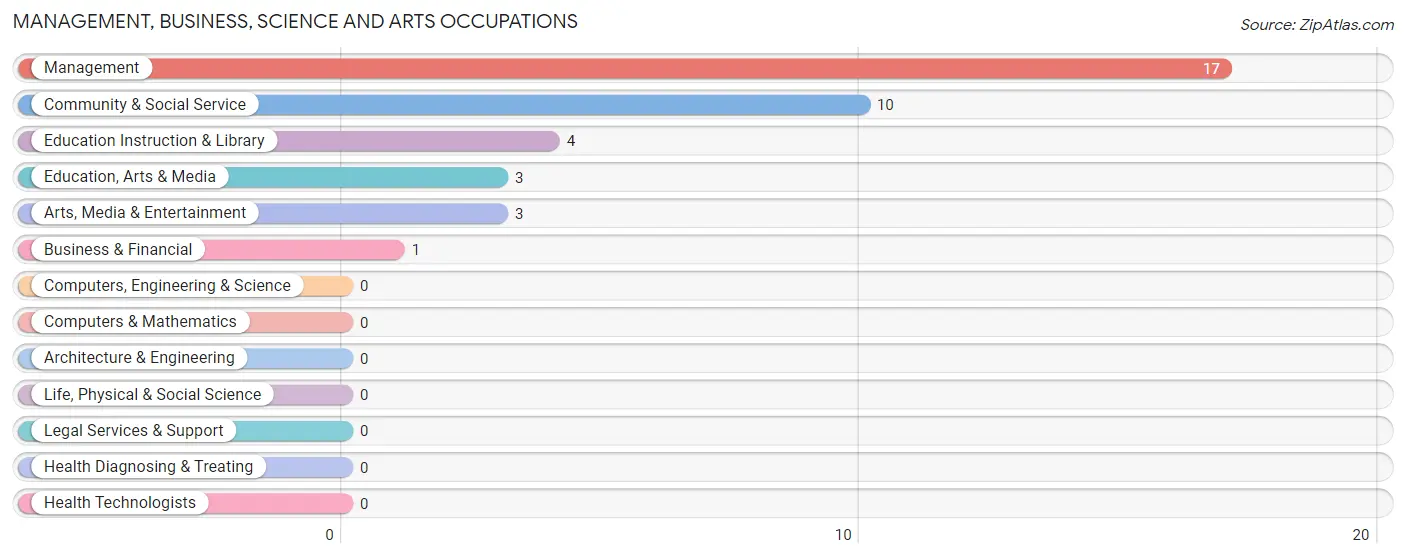
The most common Management, Business, Science and Arts occupations in Rushville are Management (17 | 11.0%), Community & Social Service (10 | 6.5%), Education Instruction & Library (4 | 2.6%), Education, Arts & Media (3 | 1.9%), and Arts, Media & Entertainment (3 | 1.9%).
Management, Business, Science and Arts Occupations by Sex
Within the Management, Business, Science and Arts occupations in Rushville, the most male-oriented occupations are Business & Financial (100.0%), Management (88.2%), and Education, Arts & Media (33.3%), while the most female-oriented occupations are Education Instruction & Library (100.0%), Community & Social Service (80.0%), and Education, Arts & Media (66.7%).
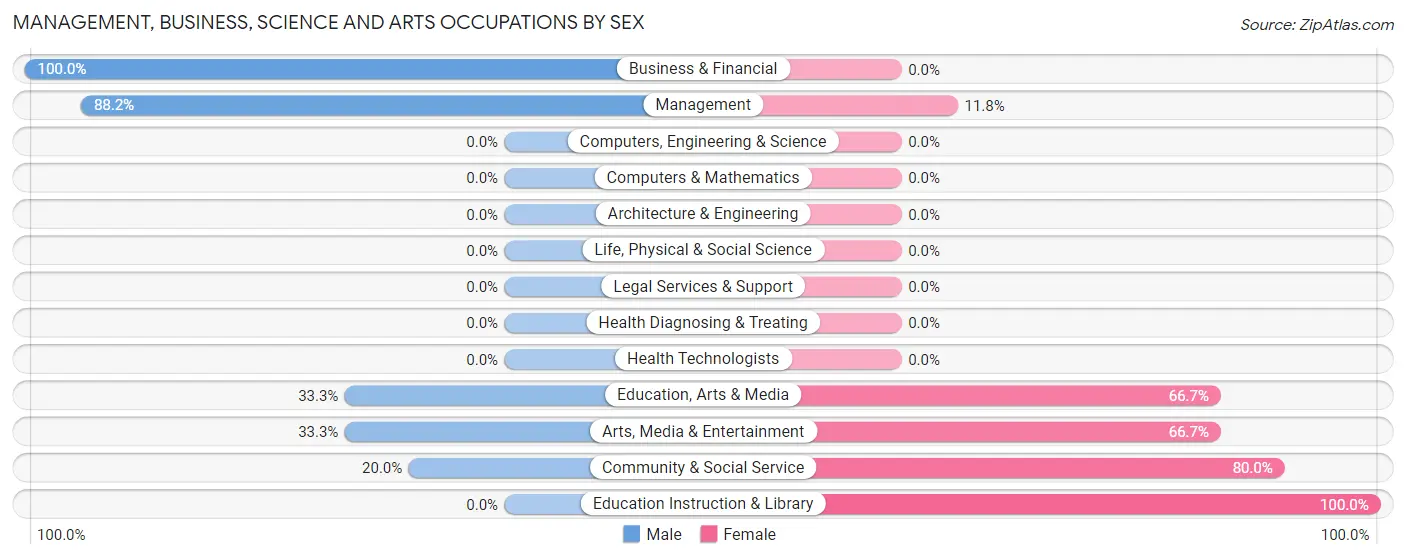
| Occupation | Male | Female |
| Management | 15 (88.2%) | 2 (11.8%) |
| Business & Financial | 1 (100.0%) | 0 (0.0%) |
| Computers, Engineering & Science | 0 (0.0%) | 0 (0.0%) |
| Computers & Mathematics | 0 (0.0%) | 0 (0.0%) |
| Architecture & Engineering | 0 (0.0%) | 0 (0.0%) |
| Life, Physical & Social Science | 0 (0.0%) | 0 (0.0%) |
| Community & Social Service | 2 (20.0%) | 8 (80.0%) |
| Education, Arts & Media | 1 (33.3%) | 2 (66.7%) |
| Legal Services & Support | 0 (0.0%) | 0 (0.0%) |
| Education Instruction & Library | 0 (0.0%) | 4 (100.0%) |
| Arts, Media & Entertainment | 1 (33.3%) | 2 (66.7%) |
| Health Diagnosing & Treating | 0 (0.0%) | 0 (0.0%) |
| Health Technologists | 0 (0.0%) | 0 (0.0%) |
| Total (Category) | 18 (64.3%) | 10 (35.7%) |
| Total (Overall) | 99 (64.3%) | 55 (35.7%) |
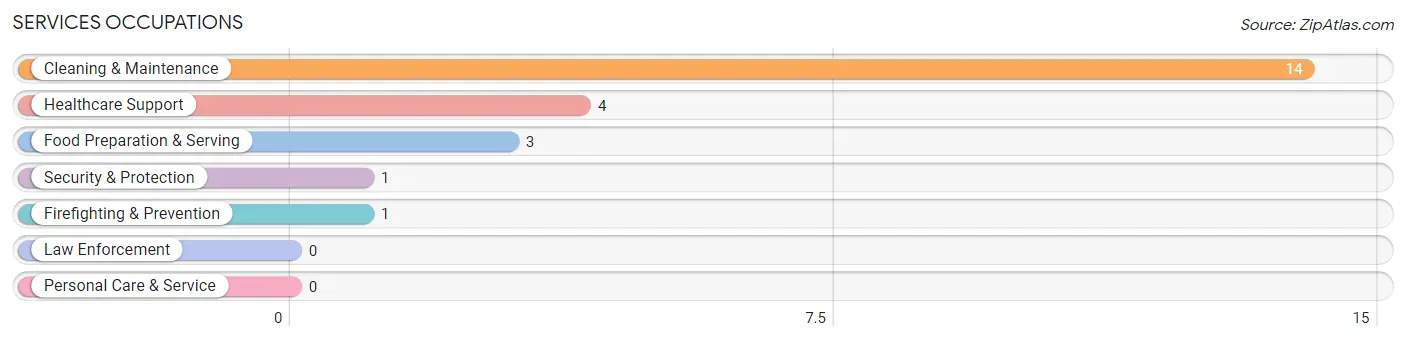
Services Occupations
The most common Services occupations in Rushville are Cleaning & Maintenance (14 | 9.1%), Healthcare Support (4 | 2.6%), Food Preparation & Serving (3 | 1.9%), Security & Protection (1 | 0.6%), and Firefighting & Prevention (1 | 0.6%).
Services Occupations by Sex
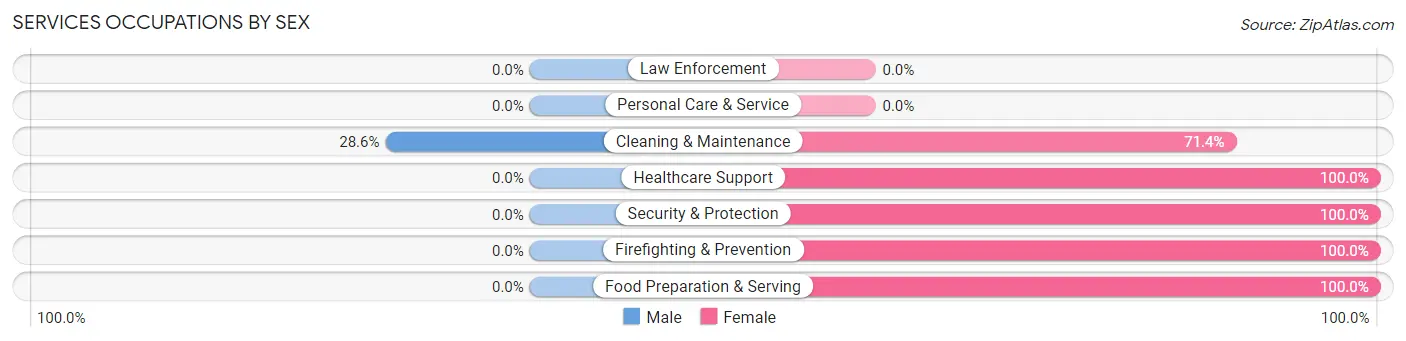
| Occupation | Male | Female |
| Healthcare Support | 0 (0.0%) | 4 (100.0%) |
| Security & Protection | 0 (0.0%) | 1 (100.0%) |
| Firefighting & Prevention | 0 (0.0%) | 1 (100.0%) |
| Law Enforcement | 0 (0.0%) | 0 (0.0%) |
| Food Preparation & Serving | 0 (0.0%) | 3 (100.0%) |
| Cleaning & Maintenance | 4 (28.6%) | 10 (71.4%) |
| Personal Care & Service | 0 (0.0%) | 0 (0.0%) |
| Total (Category) | 4 (18.2%) | 18 (81.8%) |
| Total (Overall) | 99 (64.3%) | 55 (35.7%) |
Sales and Office Occupations
The most common Sales and Office occupations in Rushville are Sales & Related (31 | 20.1%), and Office & Administration (19 | 12.3%).

Sales and Office Occupations by Sex

| Occupation | Male | Female |
| Sales & Related | 10 (32.3%) | 21 (67.7%) |
| Office & Administration | 19 (100.0%) | 0 (0.0%) |
| Total (Category) | 29 (58.0%) | 21 (42.0%) |
| Total (Overall) | 99 (64.3%) | 55 (35.7%) |
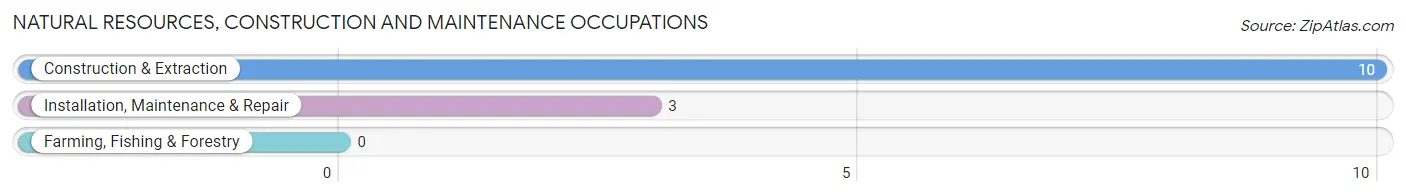
Natural Resources, Construction and Maintenance Occupations
The most common Natural Resources, Construction and Maintenance occupations in Rushville are Construction & Extraction (10 | 6.5%), and Installation, Maintenance & Repair (3 | 1.9%).
Natural Resources, Construction and Maintenance Occupations by Sex

| Occupation | Male | Female |
| Farming, Fishing & Forestry | 0 (0.0%) | 0 (0.0%) |
| Construction & Extraction | 10 (100.0%) | 0 (0.0%) |
| Installation, Maintenance & Repair | 3 (100.0%) | 0 (0.0%) |
| Total (Category) | 13 (100.0%) | 0 (0.0%) |
| Total (Overall) | 99 (64.3%) | 55 (35.7%) |
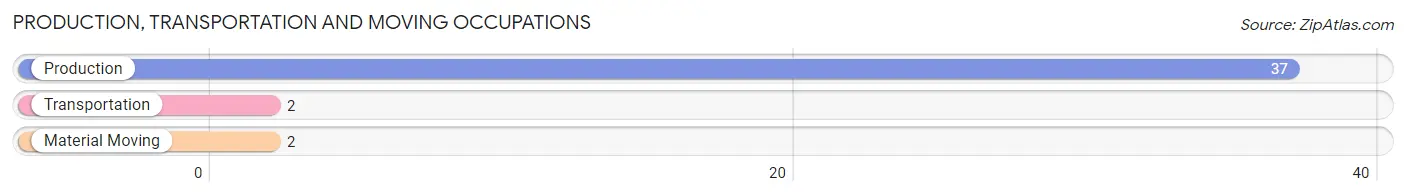
Production, Transportation and Moving Occupations
The most common Production, Transportation and Moving occupations in Rushville are Production (37 | 24.0%), Transportation (2 | 1.3%), and Material Moving (2 | 1.3%).
Production, Transportation and Moving Occupations by Sex
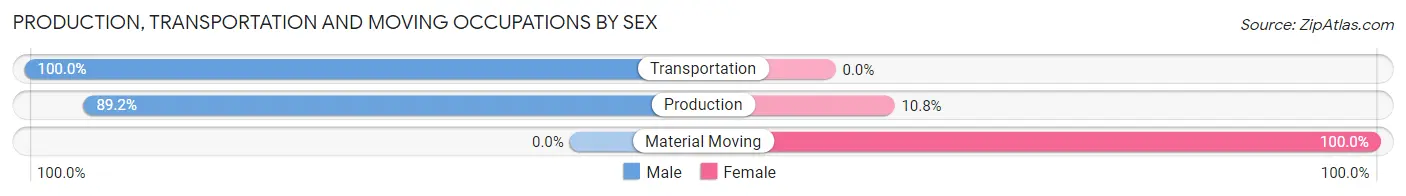
| Occupation | Male | Female |
| Production | 33 (89.2%) | 4 (10.8%) |
| Transportation | 2 (100.0%) | 0 (0.0%) |
| Material Moving | 0 (0.0%) | 2 (100.0%) |
| Total (Category) | 35 (85.4%) | 6 (14.6%) |
| Total (Overall) | 99 (64.3%) | 55 (35.7%) |
Employment Industries by Sex in Rushville
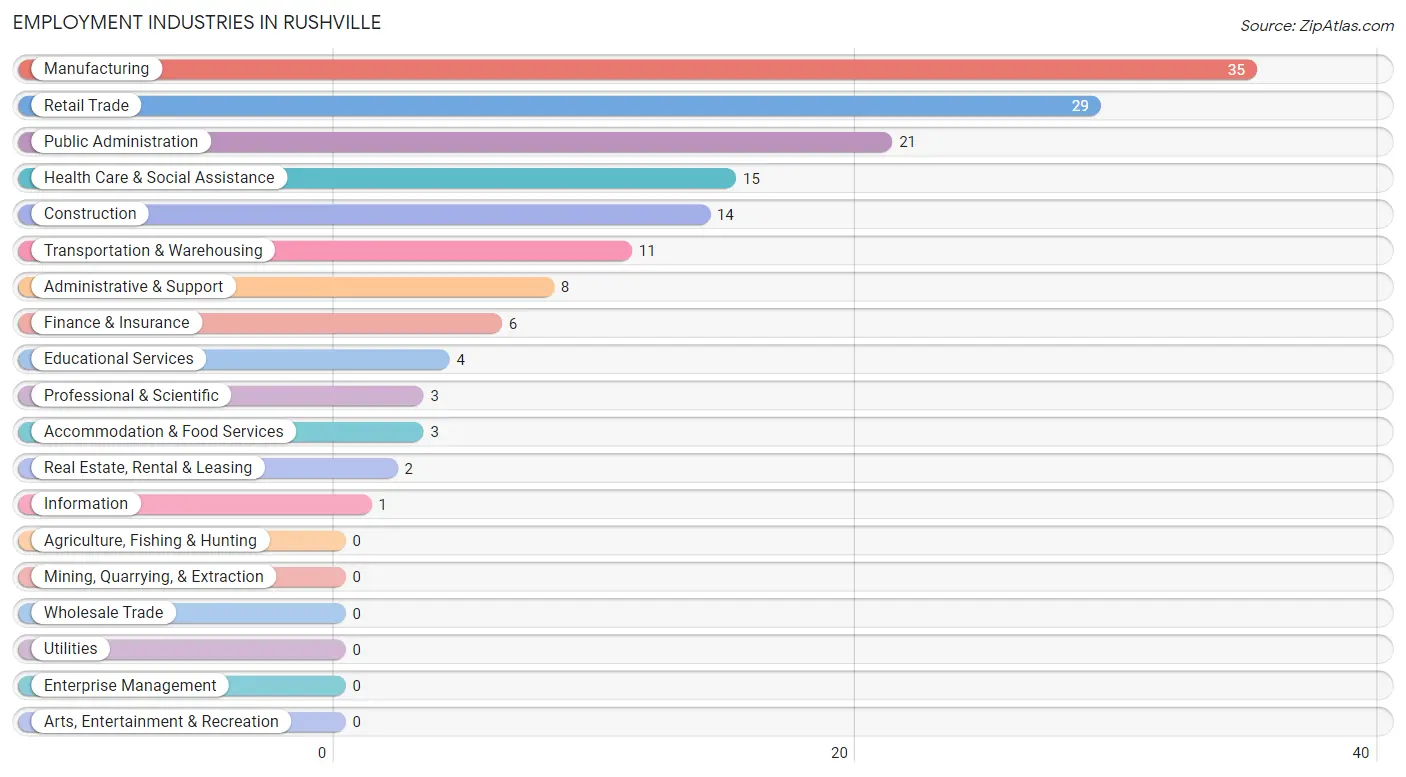
Employment Industries in Rushville
The major employment industries in Rushville include Manufacturing (35 | 22.7%), Retail Trade (29 | 18.8%), Public Administration (21 | 13.6%), Health Care & Social Assistance (15 | 9.7%), and Construction (14 | 9.1%).
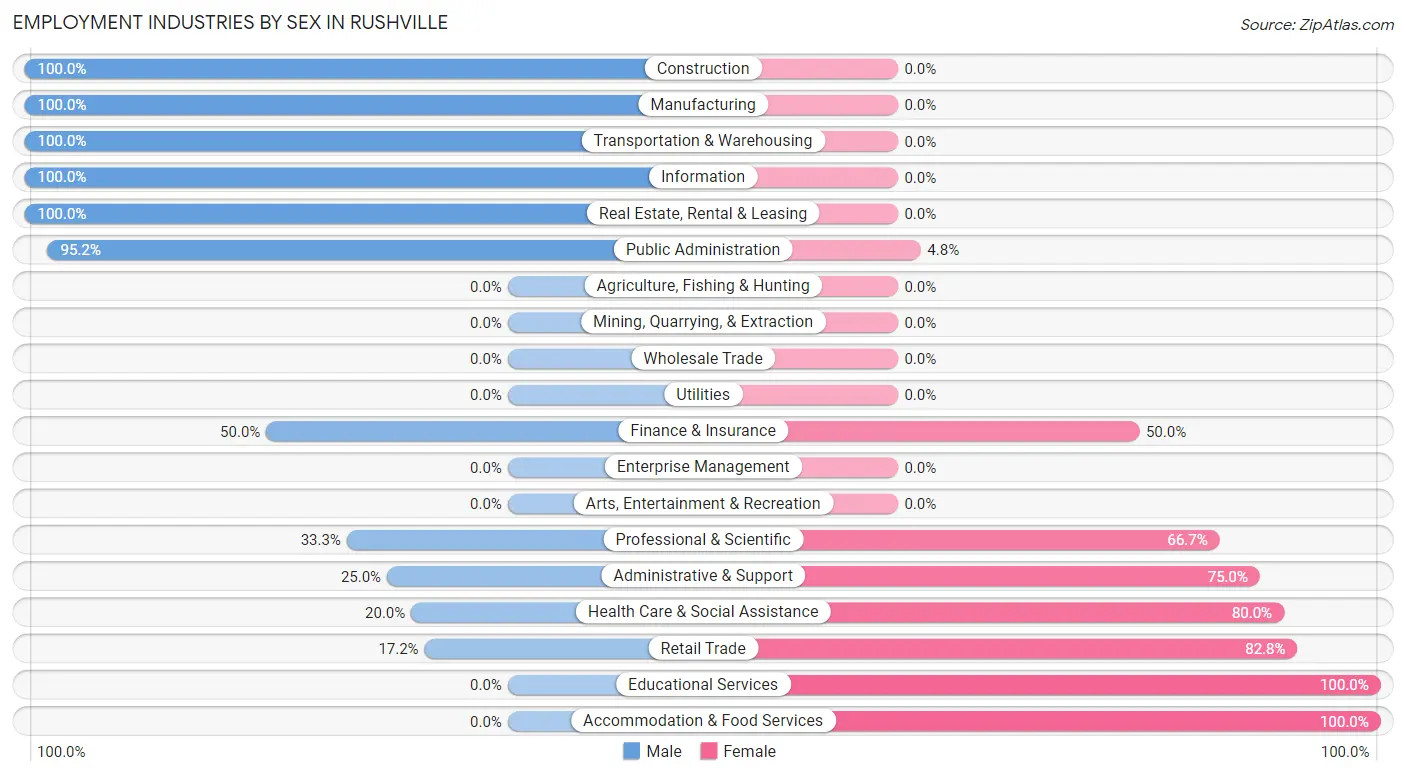
Employment Industries by Sex in Rushville
The Rushville industries that see more men than women are Construction (100.0%), Manufacturing (100.0%), and Transportation & Warehousing (100.0%), whereas the industries that tend to have a higher number of women are Educational Services (100.0%), Accommodation & Food Services (100.0%), and Retail Trade (82.8%).
| Industry | Male | Female |
| Agriculture, Fishing & Hunting | 0 (0.0%) | 0 (0.0%) |
| Mining, Quarrying, & Extraction | 0 (0.0%) | 0 (0.0%) |
| Construction | 14 (100.0%) | 0 (0.0%) |
| Manufacturing | 35 (100.0%) | 0 (0.0%) |
| Wholesale Trade | 0 (0.0%) | 0 (0.0%) |
| Retail Trade | 5 (17.2%) | 24 (82.8%) |
| Transportation & Warehousing | 11 (100.0%) | 0 (0.0%) |
| Utilities | 0 (0.0%) | 0 (0.0%) |
| Information | 1 (100.0%) | 0 (0.0%) |
| Finance & Insurance | 3 (50.0%) | 3 (50.0%) |
| Real Estate, Rental & Leasing | 2 (100.0%) | 0 (0.0%) |
| Professional & Scientific | 1 (33.3%) | 2 (66.7%) |
| Enterprise Management | 0 (0.0%) | 0 (0.0%) |
| Administrative & Support | 2 (25.0%) | 6 (75.0%) |
| Educational Services | 0 (0.0%) | 4 (100.0%) |
| Health Care & Social Assistance | 3 (20.0%) | 12 (80.0%) |
| Arts, Entertainment & Recreation | 0 (0.0%) | 0 (0.0%) |
| Accommodation & Food Services | 0 (0.0%) | 3 (100.0%) |
| Public Administration | 20 (95.2%) | 1 (4.8%) |
| Total | 99 (64.3%) | 55 (35.7%) |
Education in Rushville
School Enrollment in Rushville
The most common levels of schooling among the 83 students in Rushville are elementary school (32 | 38.6%), middle school (21 | 25.3%), and high school (21 | 25.3%).
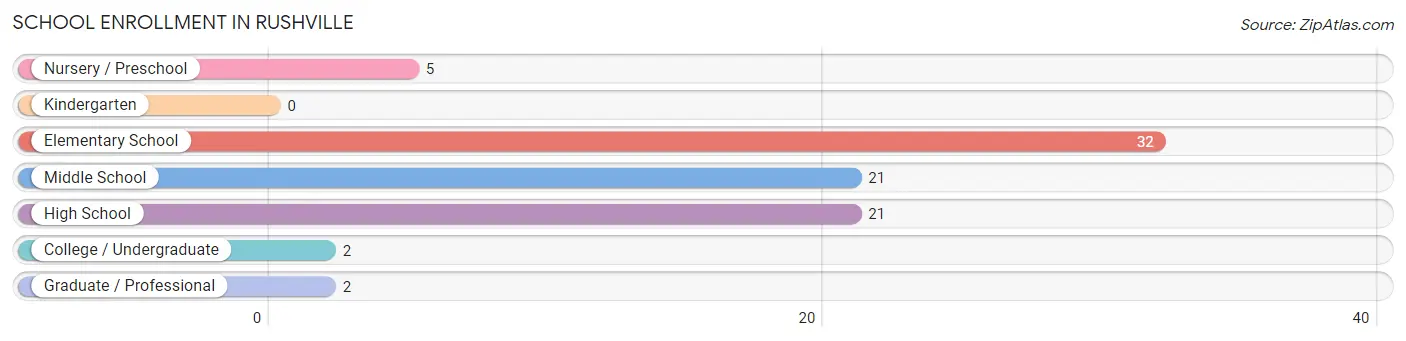
| School Level | # Students | % Students |
| Nursery / Preschool | 5 | 6.0% |
| Kindergarten | 0 | 0.0% |
| Elementary School | 32 | 38.6% |
| Middle School | 21 | 25.3% |
| High School | 21 | 25.3% |
| College / Undergraduate | 2 | 2.4% |
| Graduate / Professional | 2 | 2.4% |
| Total | 83 | 100.0% |
School Enrollment by Age by Funding Source in Rushville
Out of a total of 83 students who are enrolled in schools in Rushville, 10 (12.0%) attend a private institution, while the remaining 73 (88.0%) are enrolled in public schools. The age group of 35 years and over has the highest likelihood of being enrolled in private schools, with 2 (66.7% in the age bracket) enrolled. Conversely, the age group of 10 to 14 year olds has the lowest likelihood of being enrolled in a private school, with 28 (100.0% in the age bracket) attending a public institution.
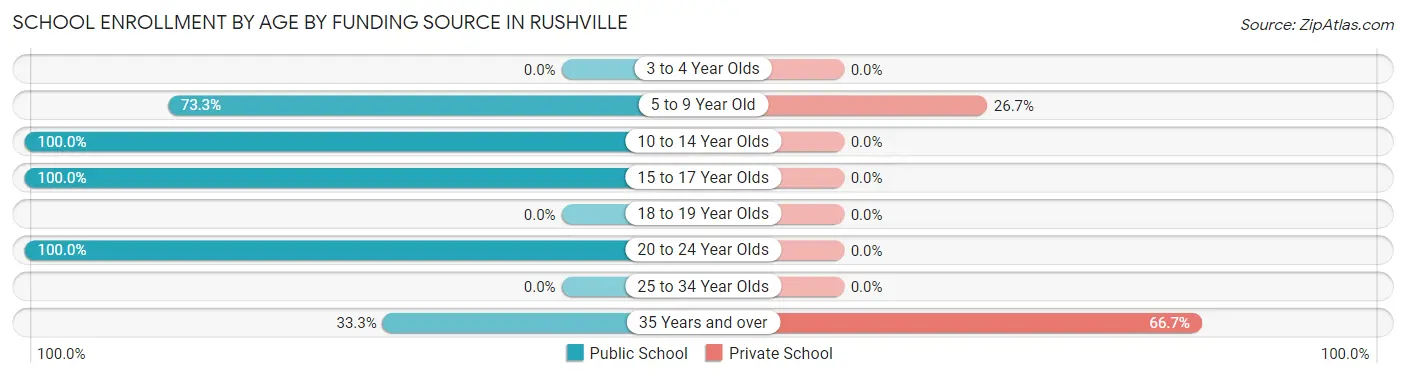
| Age Bracket | Public School | Private School |
| 3 to 4 Year Olds | 0 (0.0%) | 0 (0.0%) |
| 5 to 9 Year Old | 22 (73.3%) | 8 (26.7%) |
| 10 to 14 Year Olds | 28 (100.0%) | 0 (0.0%) |
| 15 to 17 Year Olds | 21 (100.0%) | 0 (0.0%) |
| 18 to 19 Year Olds | 0 (0.0%) | 0 (0.0%) |
| 20 to 24 Year Olds | 1 (100.0%) | 0 (0.0%) |
| 25 to 34 Year Olds | 0 (0.0%) | 0 (0.0%) |
| 35 Years and over | 1 (33.3%) | 2 (66.7%) |
| Total | 73 (88.0%) | 10 (12.0%) |
Educational Attainment by Field of Study in Rushville
Engineering (12 | 29.3%), science & technology (8 | 19.5%), education (6 | 14.6%), business (3 | 7.3%), and visual & performing arts (3 | 7.3%) are the most common fields of study among 41 individuals in Rushville who have obtained a bachelor's degree or higher.
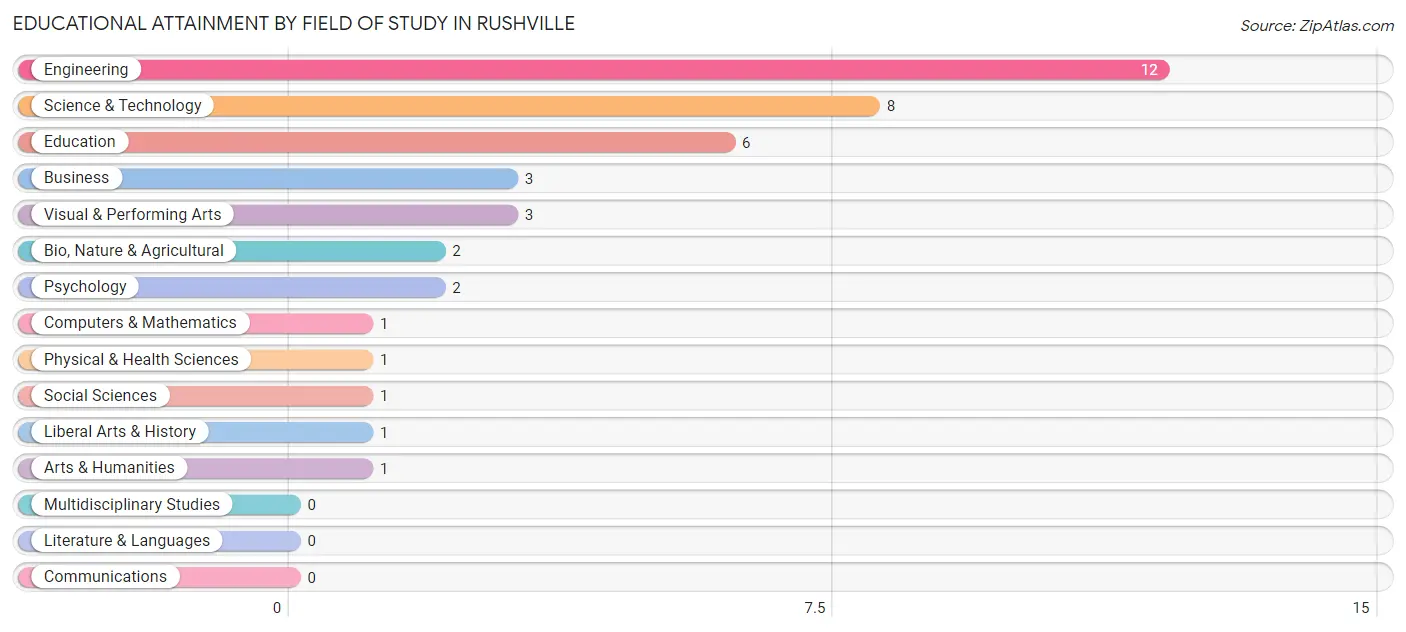
| Field of Study | # Graduates | % Graduates |
| Computers & Mathematics | 1 | 2.4% |
| Bio, Nature & Agricultural | 2 | 4.9% |
| Physical & Health Sciences | 1 | 2.4% |
| Psychology | 2 | 4.9% |
| Social Sciences | 1 | 2.4% |
| Engineering | 12 | 29.3% |
| Multidisciplinary Studies | 0 | 0.0% |
| Science & Technology | 8 | 19.5% |
| Business | 3 | 7.3% |
| Education | 6 | 14.6% |
| Literature & Languages | 0 | 0.0% |
| Liberal Arts & History | 1 | 2.4% |
| Visual & Performing Arts | 3 | 7.3% |
| Communications | 0 | 0.0% |
| Arts & Humanities | 1 | 2.4% |
| Total | 41 | 100.0% |
Transportation & Commute in Rushville
Vehicle Availability by Sex in Rushville
The most prevalent vehicle ownership categories in Rushville are males with 3 vehicles (41, accounting for 41.4%) and females with 3 vehicles (12, making up 110.8%).
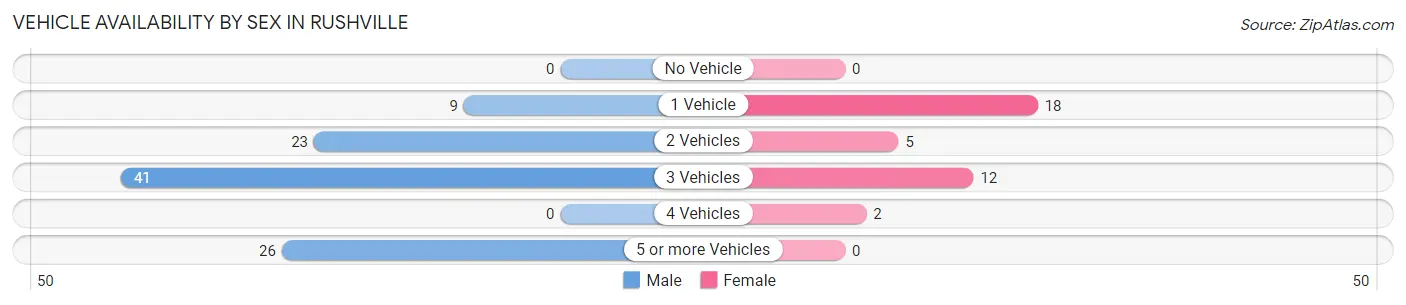
| Vehicles Available | Male | Female |
| No Vehicle | 0 (0.0%) | 0 (0.0%) |
| 1 Vehicle | 9 (9.1%) | 18 (48.6%) |
| 2 Vehicles | 23 (23.2%) | 5 (13.5%) |
| 3 Vehicles | 41 (41.4%) | 12 (32.4%) |
| 4 Vehicles | 0 (0.0%) | 2 (5.4%) |
| 5 or more Vehicles | 26 (26.3%) | 0 (0.0%) |
| Total | 99 (100.0%) | 37 (100.0%) |
Commute Time in Rushville
The most frequently occuring commute durations in Rushville are 5 to 9 minutes (27 commuters, 23.7%), 60 to 89 minutes (27 commuters, 23.7%), and 45 to 59 minutes (18 commuters, 15.8%).
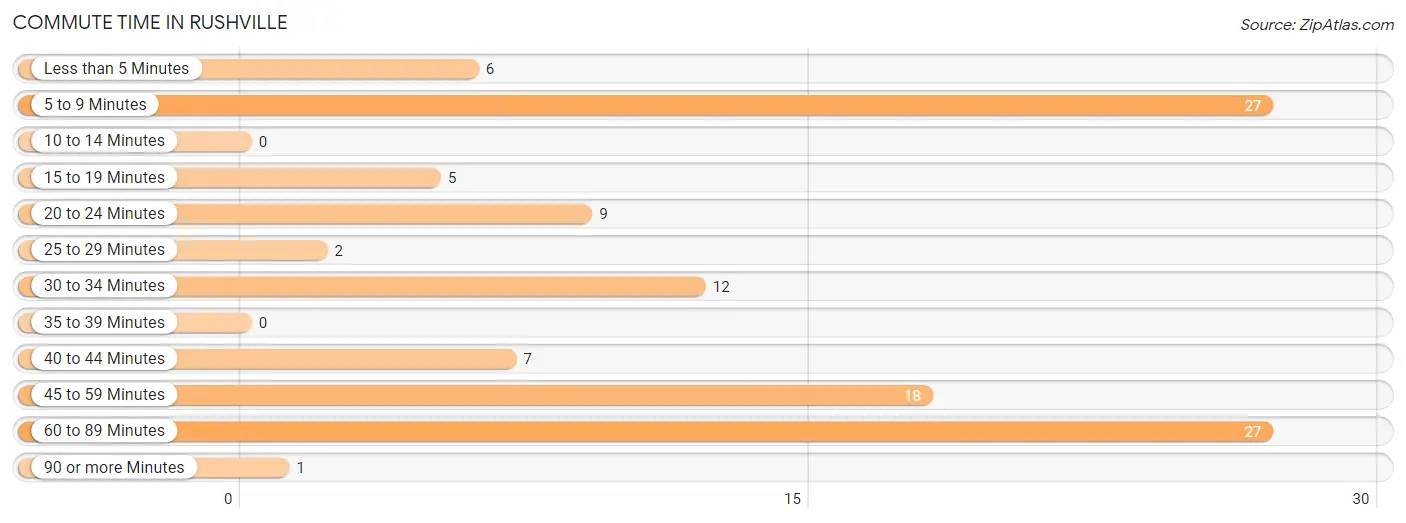
| Commute Time | # Commuters | % Commuters |
| Less than 5 Minutes | 6 | 5.3% |
| 5 to 9 Minutes | 27 | 23.7% |
| 10 to 14 Minutes | 0 | 0.0% |
| 15 to 19 Minutes | 5 | 4.4% |
| 20 to 24 Minutes | 9 | 7.9% |
| 25 to 29 Minutes | 2 | 1.8% |
| 30 to 34 Minutes | 12 | 10.5% |
| 35 to 39 Minutes | 0 | 0.0% |
| 40 to 44 Minutes | 7 | 6.1% |
| 45 to 59 Minutes | 18 | 15.8% |
| 60 to 89 Minutes | 27 | 23.7% |
| 90 or more Minutes | 1 | 0.9% |
Commute Time by Sex in Rushville
The most common commute times in Rushville are 5 to 9 minutes (27 commuters, 35.1%) for males and 30 to 34 minutes (11 commuters, 29.7%) for females.
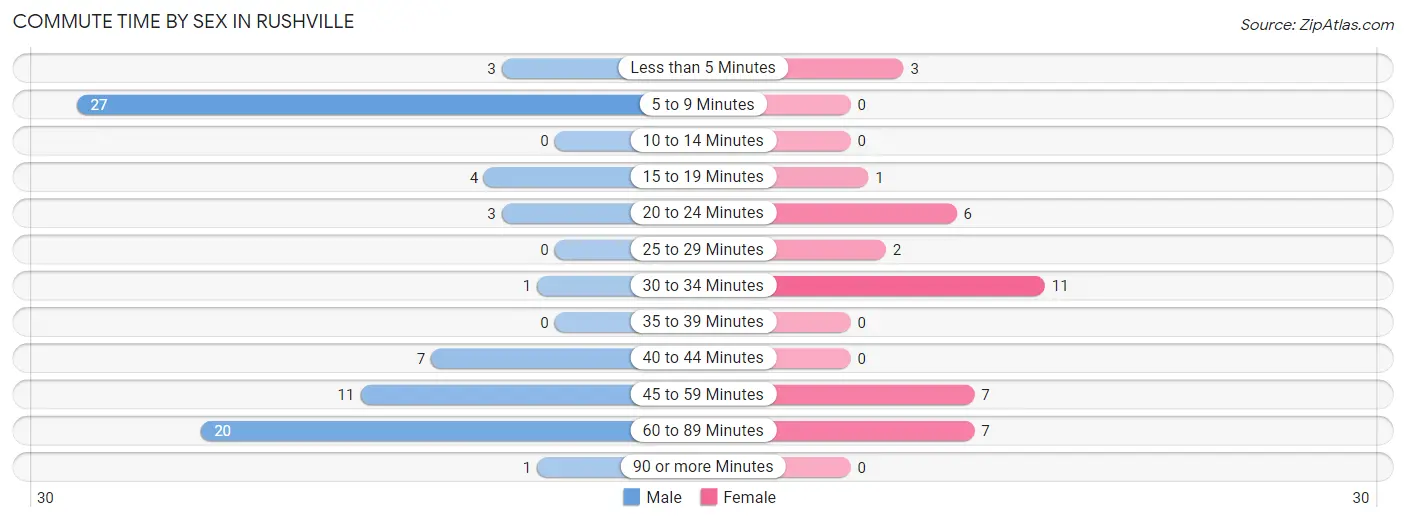
| Commute Time | Male | Female |
| Less than 5 Minutes | 3 (3.9%) | 3 (8.1%) |
| 5 to 9 Minutes | 27 (35.1%) | 0 (0.0%) |
| 10 to 14 Minutes | 0 (0.0%) | 0 (0.0%) |
| 15 to 19 Minutes | 4 (5.2%) | 1 (2.7%) |
| 20 to 24 Minutes | 3 (3.9%) | 6 (16.2%) |
| 25 to 29 Minutes | 0 (0.0%) | 2 (5.4%) |
| 30 to 34 Minutes | 1 (1.3%) | 11 (29.7%) |
| 35 to 39 Minutes | 0 (0.0%) | 0 (0.0%) |
| 40 to 44 Minutes | 7 (9.1%) | 0 (0.0%) |
| 45 to 59 Minutes | 11 (14.3%) | 7 (18.9%) |
| 60 to 89 Minutes | 20 (26.0%) | 7 (18.9%) |
| 90 or more Minutes | 1 (1.3%) | 0 (0.0%) |
Time of Departure to Work by Sex in Rushville
The most frequent times of departure to work in Rushville are 5:30 AM to 5:59 AM (29, 37.7%) for males and 7:00 AM to 7:29 AM (11, 29.7%) for females.
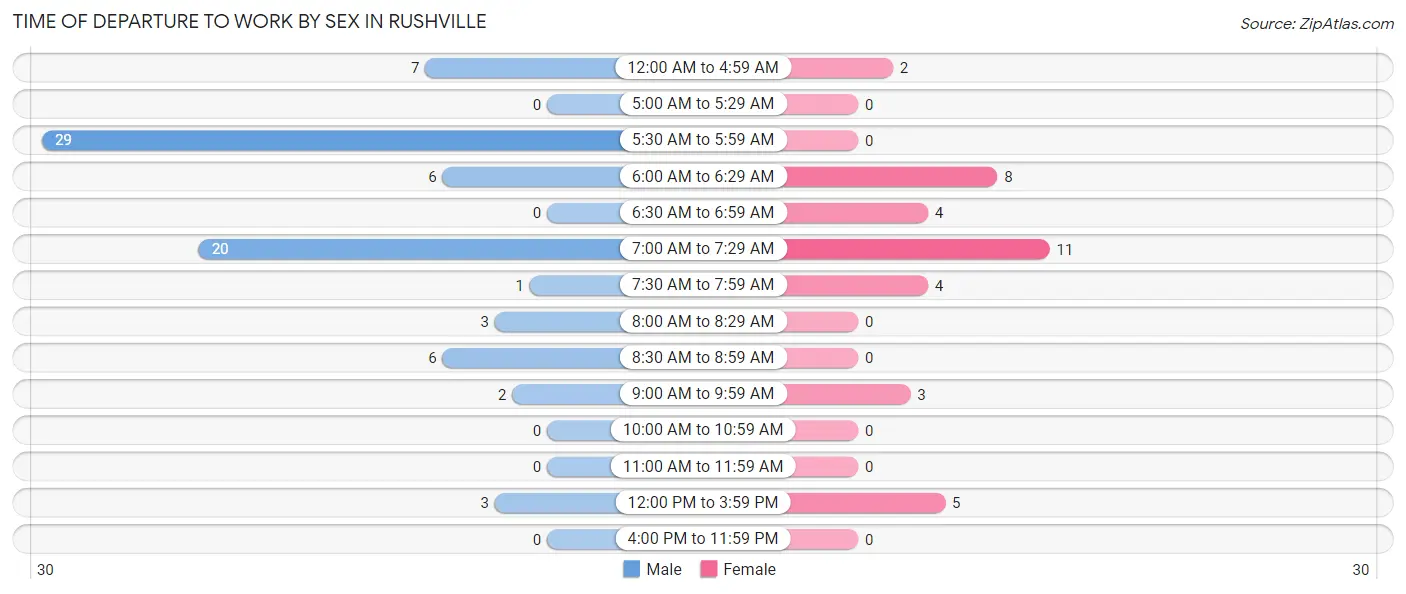
| Time of Departure | Male | Female |
| 12:00 AM to 4:59 AM | 7 (9.1%) | 2 (5.4%) |
| 5:00 AM to 5:29 AM | 0 (0.0%) | 0 (0.0%) |
| 5:30 AM to 5:59 AM | 29 (37.7%) | 0 (0.0%) |
| 6:00 AM to 6:29 AM | 6 (7.8%) | 8 (21.6%) |
| 6:30 AM to 6:59 AM | 0 (0.0%) | 4 (10.8%) |
| 7:00 AM to 7:29 AM | 20 (26.0%) | 11 (29.7%) |
| 7:30 AM to 7:59 AM | 1 (1.3%) | 4 (10.8%) |
| 8:00 AM to 8:29 AM | 3 (3.9%) | 0 (0.0%) |
| 8:30 AM to 8:59 AM | 6 (7.8%) | 0 (0.0%) |
| 9:00 AM to 9:59 AM | 2 (2.6%) | 3 (8.1%) |
| 10:00 AM to 10:59 AM | 0 (0.0%) | 0 (0.0%) |
| 11:00 AM to 11:59 AM | 0 (0.0%) | 0 (0.0%) |
| 12:00 PM to 3:59 PM | 3 (3.9%) | 5 (13.5%) |
| 4:00 PM to 11:59 PM | 0 (0.0%) | 0 (0.0%) |
| Total | 77 (100.0%) | 37 (100.0%) |
Housing Occupancy in Rushville
Occupancy by Ownership in Rushville
Of the total 115 dwellings in Rushville, owner-occupied units account for 98 (85.2%), while renter-occupied units make up 17 (14.8%).
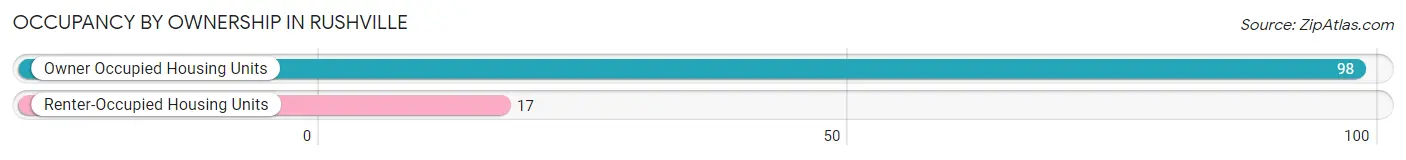
| Occupancy | # Housing Units | % Housing Units |
| Owner Occupied Housing Units | 98 | 85.2% |
| Renter-Occupied Housing Units | 17 | 14.8% |
| Total Occupied Housing Units | 115 | 100.0% |
Occupancy by Household Size in Rushville
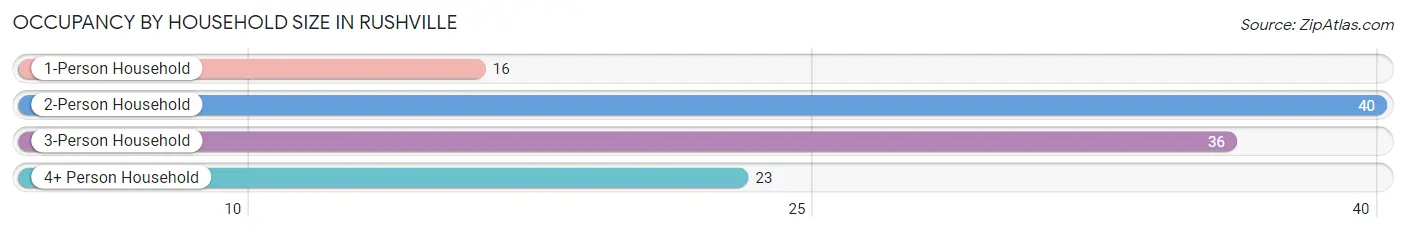
| Household Size | # Housing Units | % Housing Units |
| 1-Person Household | 16 | 13.9% |
| 2-Person Household | 40 | 34.8% |
| 3-Person Household | 36 | 31.3% |
| 4+ Person Household | 23 | 20.0% |
| Total Housing Units | 115 | 100.0% |
Occupancy by Ownership by Household Size in Rushville
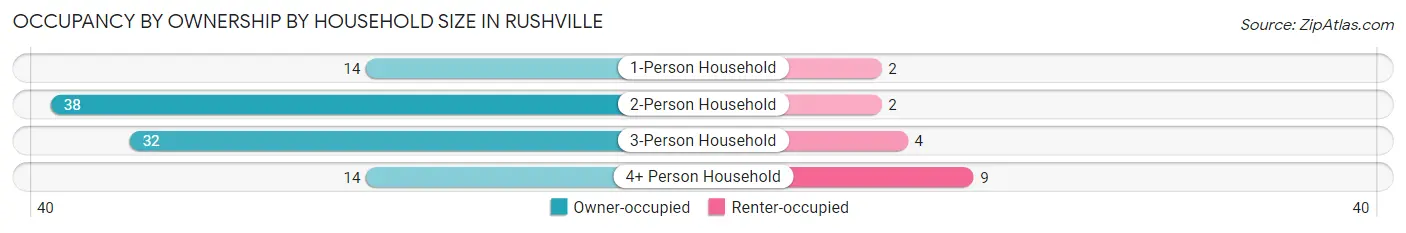
| Household Size | Owner-occupied | Renter-occupied |
| 1-Person Household | 14 (87.5%) | 2 (12.5%) |
| 2-Person Household | 38 (95.0%) | 2 (5.0%) |
| 3-Person Household | 32 (88.9%) | 4 (11.1%) |
| 4+ Person Household | 14 (60.9%) | 9 (39.1%) |
| Total Housing Units | 98 (85.2%) | 17 (14.8%) |
Occupancy by Educational Attainment in Rushville
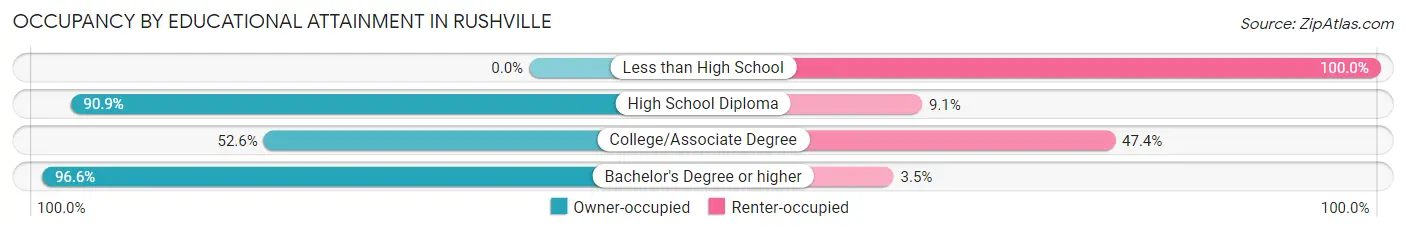
| Household Size | Owner-occupied | Renter-occupied |
| Less than High School | 0 (0.0%) | 1 (100.0%) |
| High School Diploma | 60 (90.9%) | 6 (9.1%) |
| College/Associate Degree | 10 (52.6%) | 9 (47.4%) |
| Bachelor's Degree or higher | 28 (96.6%) | 1 (3.5%) |
Occupancy by Age of Householder in Rushville
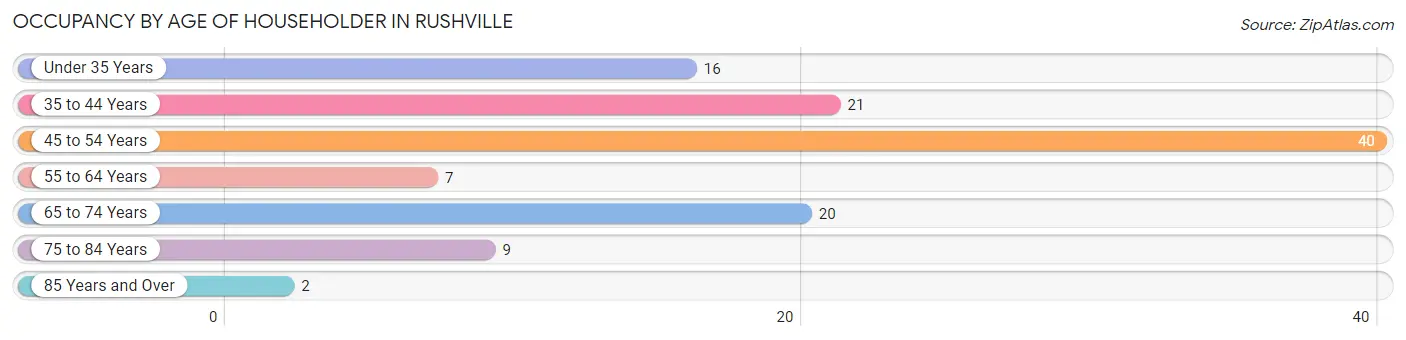
| Age Bracket | # Households | % Households |
| Under 35 Years | 16 | 13.9% |
| 35 to 44 Years | 21 | 18.3% |
| 45 to 54 Years | 40 | 34.8% |
| 55 to 64 Years | 7 | 6.1% |
| 65 to 74 Years | 20 | 17.4% |
| 75 to 84 Years | 9 | 7.8% |
| 85 Years and Over | 2 | 1.7% |
| Total | 115 | 100.0% |
Housing Finances in Rushville
Median Income by Occupancy in Rushville
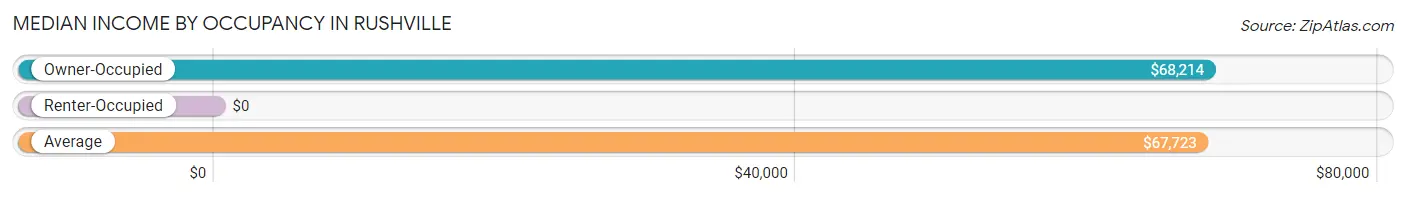
| Occupancy Type | # Households | Median Income |
| Owner-Occupied | 98 (85.2%) | $68,214 |
| Renter-Occupied | 17 (14.8%) | $0 |
| Average | 115 (100.0%) | $67,723 |
Occupancy by Householder Income Bracket in Rushville
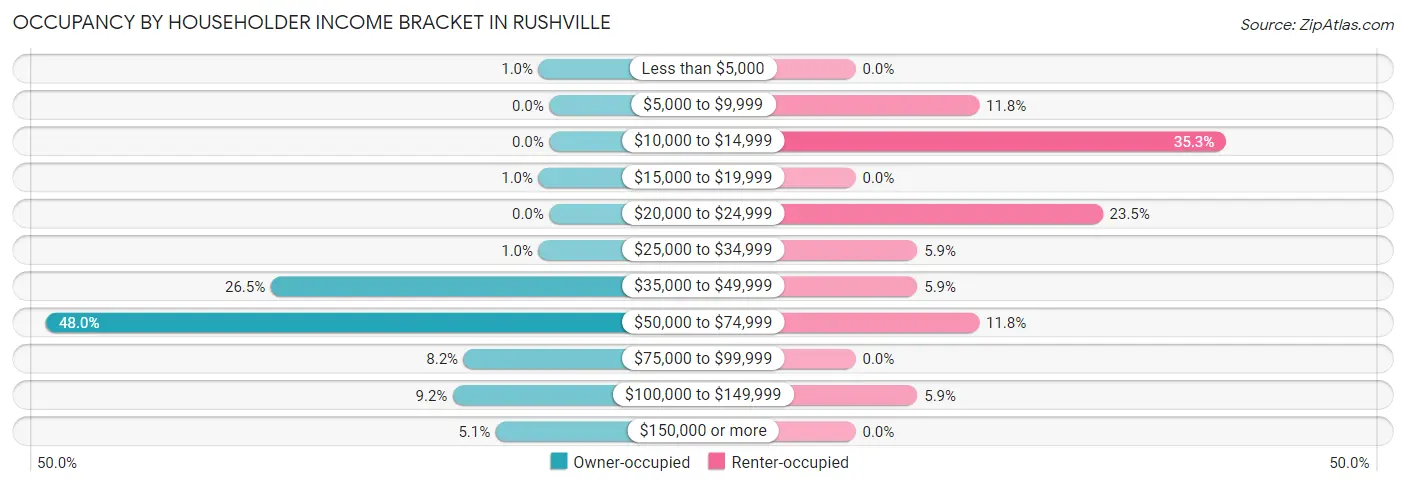
| Income Bracket | Owner-occupied | Renter-occupied |
| Less than $5,000 | 1 (1.0%) | 0 (0.0%) |
| $5,000 to $9,999 | 0 (0.0%) | 2 (11.8%) |
| $10,000 to $14,999 | 0 (0.0%) | 6 (35.3%) |
| $15,000 to $19,999 | 1 (1.0%) | 0 (0.0%) |
| $20,000 to $24,999 | 0 (0.0%) | 4 (23.5%) |
| $25,000 to $34,999 | 1 (1.0%) | 1 (5.9%) |
| $35,000 to $49,999 | 26 (26.5%) | 1 (5.9%) |
| $50,000 to $74,999 | 47 (48.0%) | 2 (11.8%) |
| $75,000 to $99,999 | 8 (8.2%) | 0 (0.0%) |
| $100,000 to $149,999 | 9 (9.2%) | 1 (5.9%) |
| $150,000 or more | 5 (5.1%) | 0 (0.0%) |
| Total | 98 (100.0%) | 17 (100.0%) |
Monthly Housing Cost Tiers in Rushville
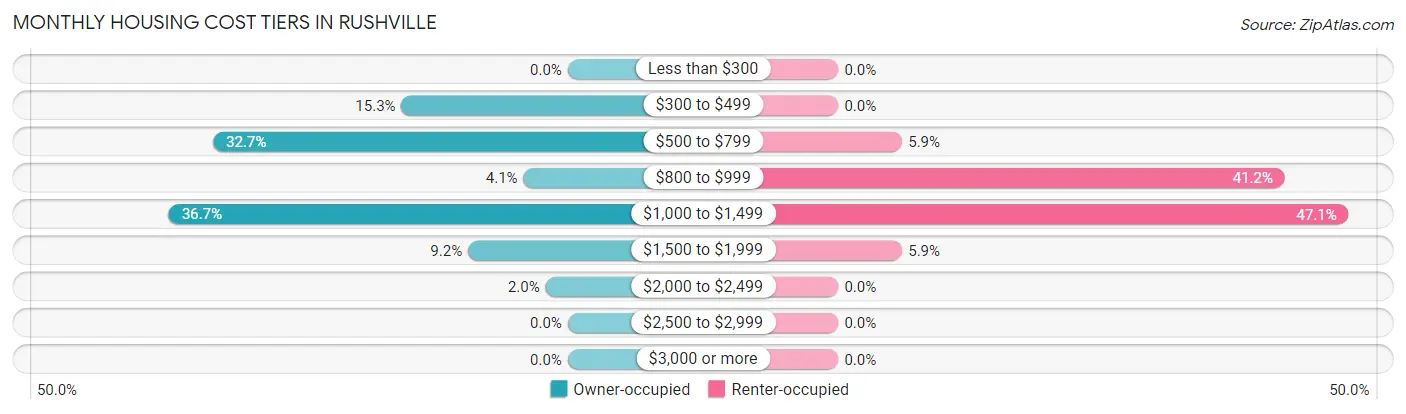
| Monthly Cost | Owner-occupied | Renter-occupied |
| Less than $300 | 0 (0.0%) | 0 (0.0%) |
| $300 to $499 | 15 (15.3%) | 0 (0.0%) |
| $500 to $799 | 32 (32.7%) | 1 (5.9%) |
| $800 to $999 | 4 (4.1%) | 7 (41.2%) |
| $1,000 to $1,499 | 36 (36.7%) | 8 (47.1%) |
| $1,500 to $1,999 | 9 (9.2%) | 1 (5.9%) |
| $2,000 to $2,499 | 2 (2.0%) | 0 (0.0%) |
| $2,500 to $2,999 | 0 (0.0%) | 0 (0.0%) |
| $3,000 or more | 0 (0.0%) | 0 (0.0%) |
| Total | 98 (100.0%) | 17 (100.0%) |
Physical Housing Characteristics in Rushville
Housing Structures in Rushville
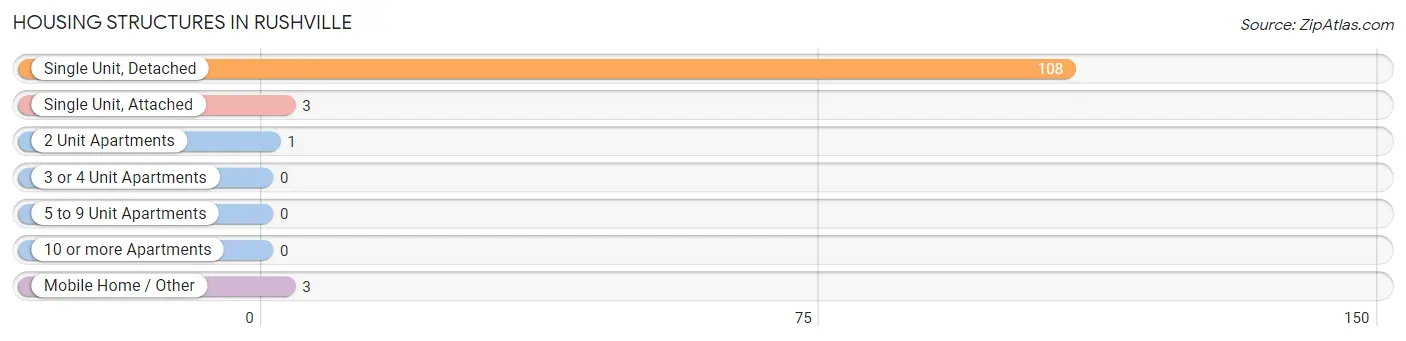
| Structure Type | # Housing Units | % Housing Units |
| Single Unit, Detached | 108 | 93.9% |
| Single Unit, Attached | 3 | 2.6% |
| 2 Unit Apartments | 1 | 0.9% |
| 3 or 4 Unit Apartments | 0 | 0.0% |
| 5 to 9 Unit Apartments | 0 | 0.0% |
| 10 or more Apartments | 0 | 0.0% |
| Mobile Home / Other | 3 | 2.6% |
| Total | 115 | 100.0% |
Housing Structures by Occupancy in Rushville
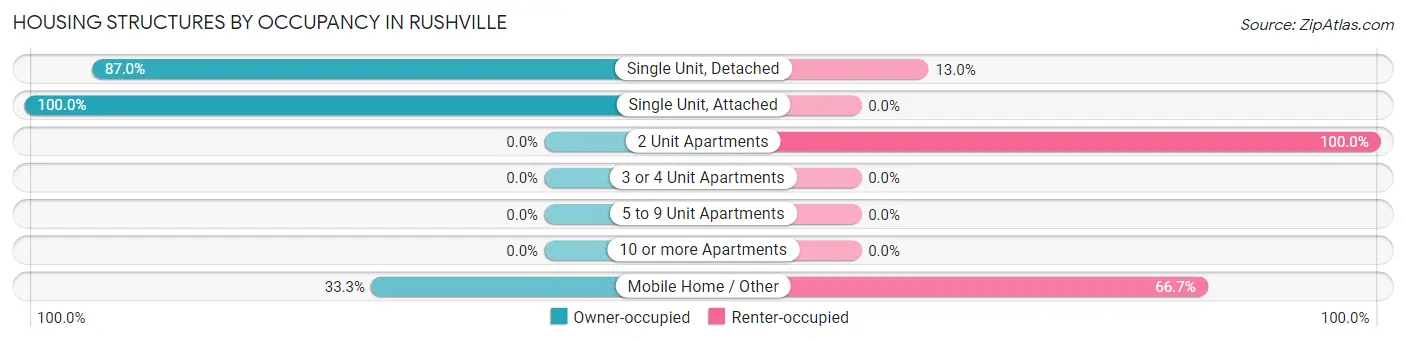
| Structure Type | Owner-occupied | Renter-occupied |
| Single Unit, Detached | 94 (87.0%) | 14 (13.0%) |
| Single Unit, Attached | 3 (100.0%) | 0 (0.0%) |
| 2 Unit Apartments | 0 (0.0%) | 1 (100.0%) |
| 3 or 4 Unit Apartments | 0 (0.0%) | 0 (0.0%) |
| 5 to 9 Unit Apartments | 0 (0.0%) | 0 (0.0%) |
| 10 or more Apartments | 0 (0.0%) | 0 (0.0%) |
| Mobile Home / Other | 1 (33.3%) | 2 (66.7%) |
| Total | 98 (85.2%) | 17 (14.8%) |
Housing Structures by Number of Rooms in Rushville
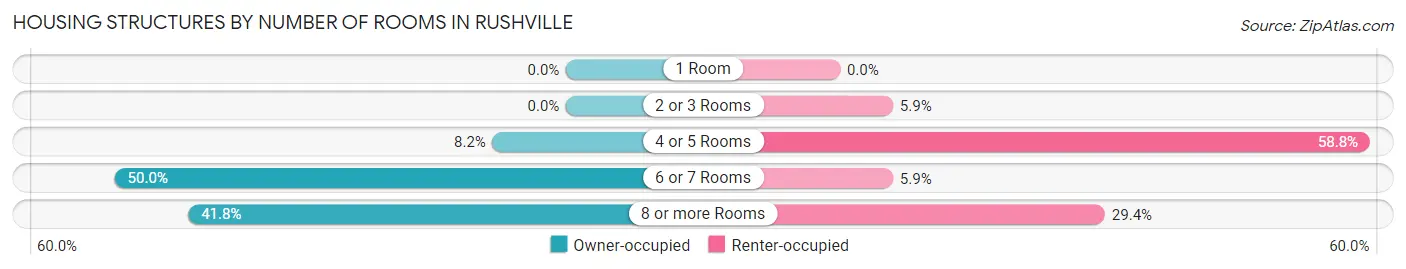
| Number of Rooms | Owner-occupied | Renter-occupied |
| 1 Room | 0 (0.0%) | 0 (0.0%) |
| 2 or 3 Rooms | 0 (0.0%) | 1 (5.9%) |
| 4 or 5 Rooms | 8 (8.2%) | 10 (58.8%) |
| 6 or 7 Rooms | 49 (50.0%) | 1 (5.9%) |
| 8 or more Rooms | 41 (41.8%) | 5 (29.4%) |
| Total | 98 (100.0%) | 17 (100.0%) |
Housing Structure by Heating Type in Rushville
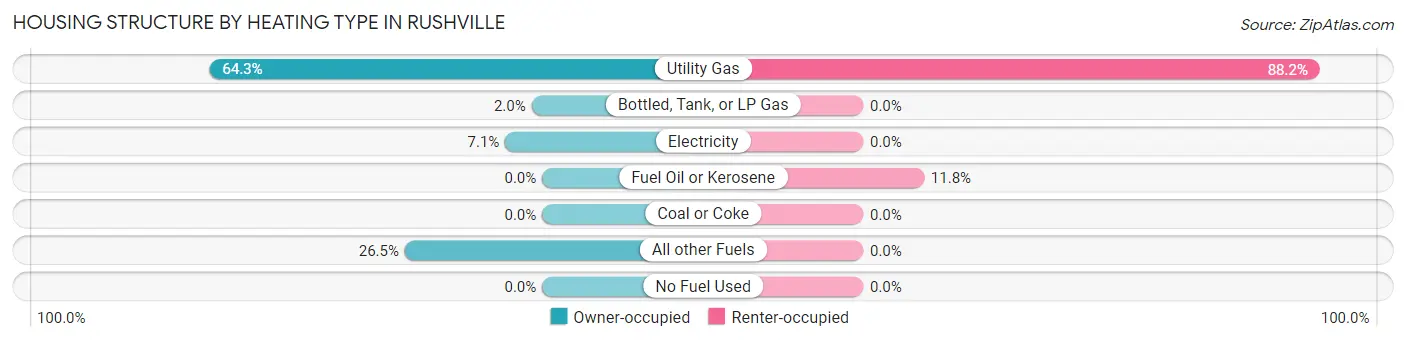
| Heating Type | Owner-occupied | Renter-occupied |
| Utility Gas | 63 (64.3%) | 15 (88.2%) |
| Bottled, Tank, or LP Gas | 2 (2.0%) | 0 (0.0%) |
| Electricity | 7 (7.1%) | 0 (0.0%) |
| Fuel Oil or Kerosene | 0 (0.0%) | 2 (11.8%) |
| Coal or Coke | 0 (0.0%) | 0 (0.0%) |
| All other Fuels | 26 (26.5%) | 0 (0.0%) |
| No Fuel Used | 0 (0.0%) | 0 (0.0%) |
| Total | 98 (100.0%) | 17 (100.0%) |
Household Vehicle Usage in Rushville
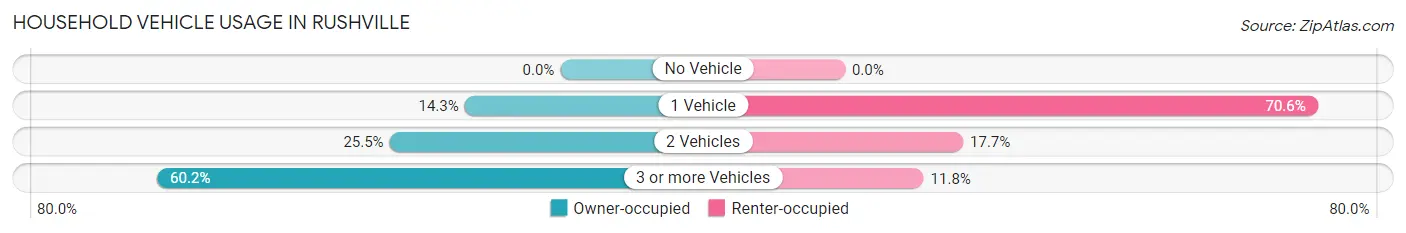
| Vehicles per Household | Owner-occupied | Renter-occupied |
| No Vehicle | 0 (0.0%) | 0 (0.0%) |
| 1 Vehicle | 14 (14.3%) | 12 (70.6%) |
| 2 Vehicles | 25 (25.5%) | 3 (17.6%) |
| 3 or more Vehicles | 59 (60.2%) | 2 (11.8%) |
| Total | 98 (100.0%) | 17 (100.0%) |
Real Estate & Mortgages in Rushville
Real Estate and Mortgage Overview in Rushville
| Characteristic | Without Mortgage | With Mortgage |
| Housing Units | 47 | 51 |
| Median Property Value | $165,400 | $150,800 |
| Median Household Income | $68,510 | $3 |
| Monthly Housing Costs | $624 | $0 |
| Real Estate Taxes | $1,711 | $0 |
Property Value by Mortgage Status in Rushville
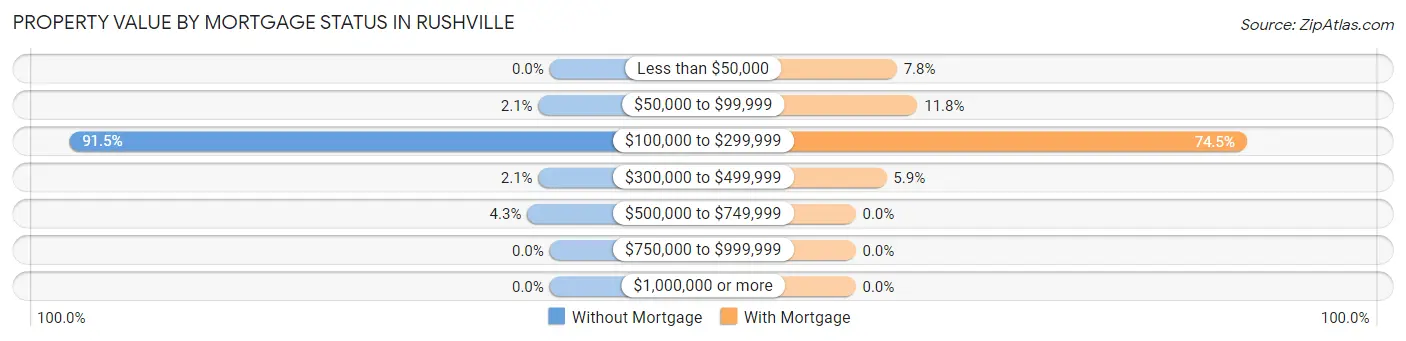
| Property Value | Without Mortgage | With Mortgage |
| Less than $50,000 | 0 (0.0%) | 4 (7.8%) |
| $50,000 to $99,999 | 1 (2.1%) | 6 (11.8%) |
| $100,000 to $299,999 | 43 (91.5%) | 38 (74.5%) |
| $300,000 to $499,999 | 1 (2.1%) | 3 (5.9%) |
| $500,000 to $749,999 | 2 (4.3%) | 0 (0.0%) |
| $750,000 to $999,999 | 0 (0.0%) | 0 (0.0%) |
| $1,000,000 or more | 0 (0.0%) | 0 (0.0%) |
| Total | 47 (100.0%) | 51 (100.0%) |
Household Income by Mortgage Status in Rushville
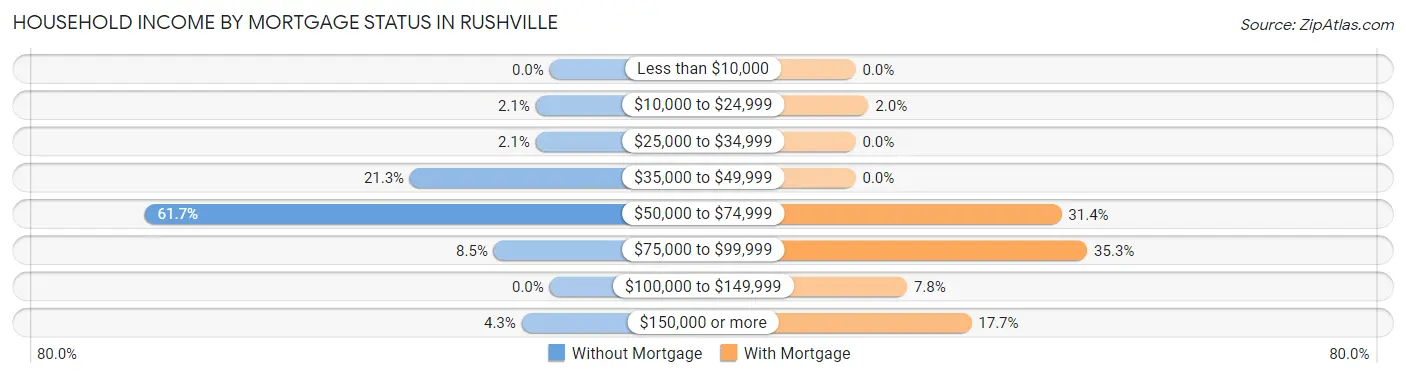
| Household Income | Without Mortgage | With Mortgage |
| Less than $10,000 | 0 (0.0%) | 0 (0.0%) |
| $10,000 to $24,999 | 1 (2.1%) | 1 (2.0%) |
| $25,000 to $34,999 | 1 (2.1%) | 0 (0.0%) |
| $35,000 to $49,999 | 10 (21.3%) | 0 (0.0%) |
| $50,000 to $74,999 | 29 (61.7%) | 16 (31.4%) |
| $75,000 to $99,999 | 4 (8.5%) | 18 (35.3%) |
| $100,000 to $149,999 | 0 (0.0%) | 4 (7.8%) |
| $150,000 or more | 2 (4.3%) | 9 (17.6%) |
| Total | 47 (100.0%) | 51 (100.0%) |
Property Value to Household Income Ratio in Rushville
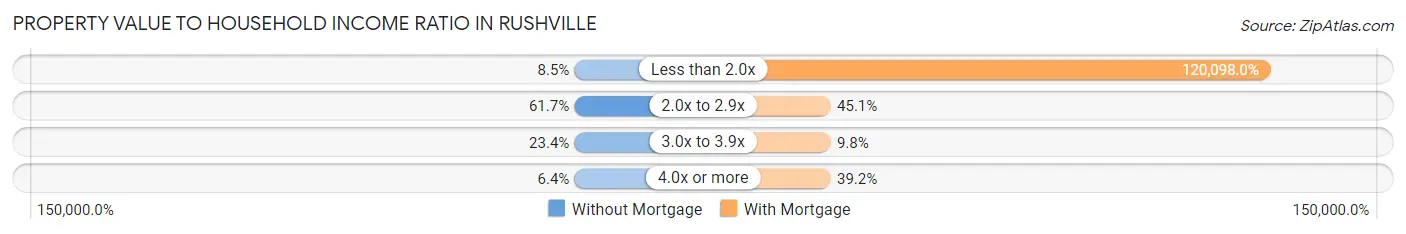
| Value-to-Income Ratio | Without Mortgage | With Mortgage |
| Less than 2.0x | 4 (8.5%) | 61,250 (120,098.0%) |
| 2.0x to 2.9x | 29 (61.7%) | 23 (45.1%) |
| 3.0x to 3.9x | 11 (23.4%) | 5 (9.8%) |
| 4.0x or more | 3 (6.4%) | 20 (39.2%) |
| Total | 47 (100.0%) | 51 (100.0%) |
Real Estate Taxes by Mortgage Status in Rushville
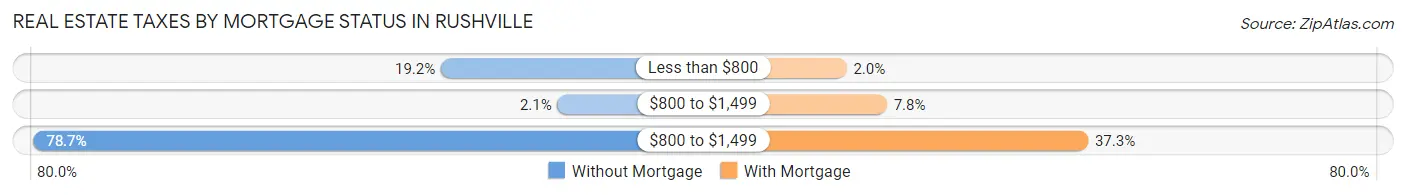
| Property Taxes | Without Mortgage | With Mortgage |
| Less than $800 | 9 (19.2%) | 1 (2.0%) |
| $800 to $1,499 | 1 (2.1%) | 4 (7.8%) |
| $800 to $1,499 | 37 (78.7%) | 19 (37.2%) |
| Total | 47 (100.0%) | 51 (100.0%) |
Health & Disability in Rushville
Health Insurance Coverage by Age in Rushville
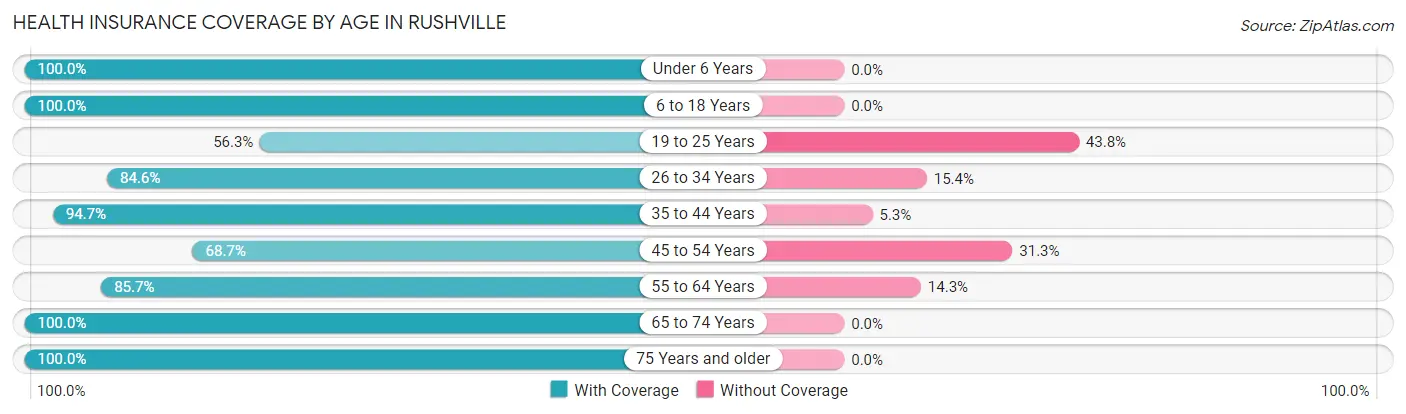
| Age Bracket | With Coverage | Without Coverage |
| Under 6 Years | 28 (100.0%) | 0 (0.0%) |
| 6 to 18 Years | 75 (100.0%) | 0 (0.0%) |
| 19 to 25 Years | 9 (56.2%) | 7 (43.8%) |
| 26 to 34 Years | 11 (84.6%) | 2 (15.4%) |
| 35 to 44 Years | 36 (94.7%) | 2 (5.3%) |
| 45 to 54 Years | 46 (68.7%) | 21 (31.3%) |
| 55 to 64 Years | 12 (85.7%) | 2 (14.3%) |
| 65 to 74 Years | 34 (100.0%) | 0 (0.0%) |
| 75 Years and older | 41 (100.0%) | 0 (0.0%) |
| Total | 292 (89.6%) | 34 (10.4%) |
Health Insurance Coverage by Citizenship Status in Rushville
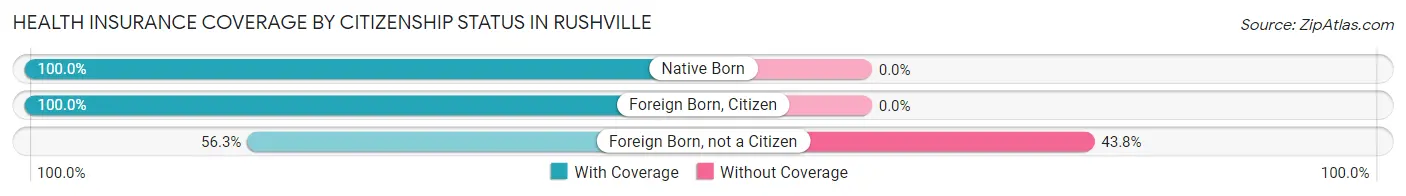
| Citizenship Status | With Coverage | Without Coverage |
| Native Born | 28 (100.0%) | 0 (0.0%) |
| Foreign Born, Citizen | 75 (100.0%) | 0 (0.0%) |
| Foreign Born, not a Citizen | 9 (56.2%) | 7 (43.8%) |
Health Insurance Coverage by Household Income in Rushville
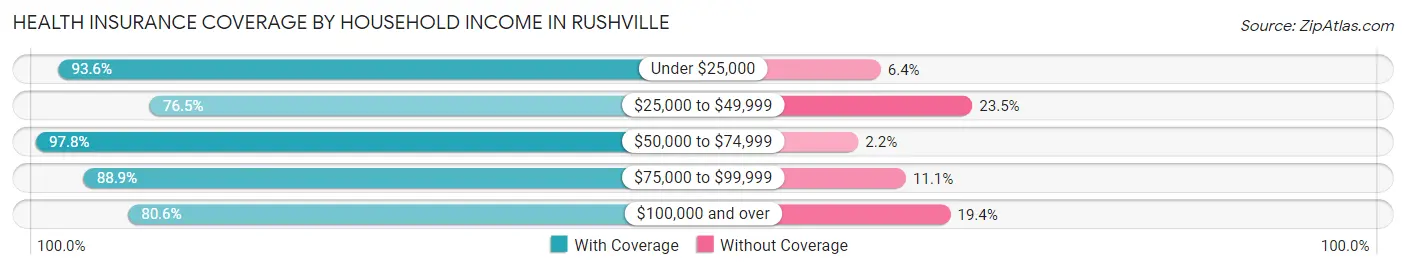
| Household Income | With Coverage | Without Coverage |
| Under $25,000 | 44 (93.6%) | 3 (6.4%) |
| $25,000 to $49,999 | 39 (76.5%) | 12 (23.5%) |
| $50,000 to $74,999 | 135 (97.8%) | 3 (2.2%) |
| $75,000 to $99,999 | 16 (88.9%) | 2 (11.1%) |
| $100,000 and over | 58 (80.6%) | 14 (19.4%) |
Public vs Private Health Insurance Coverage by Age in Rushville
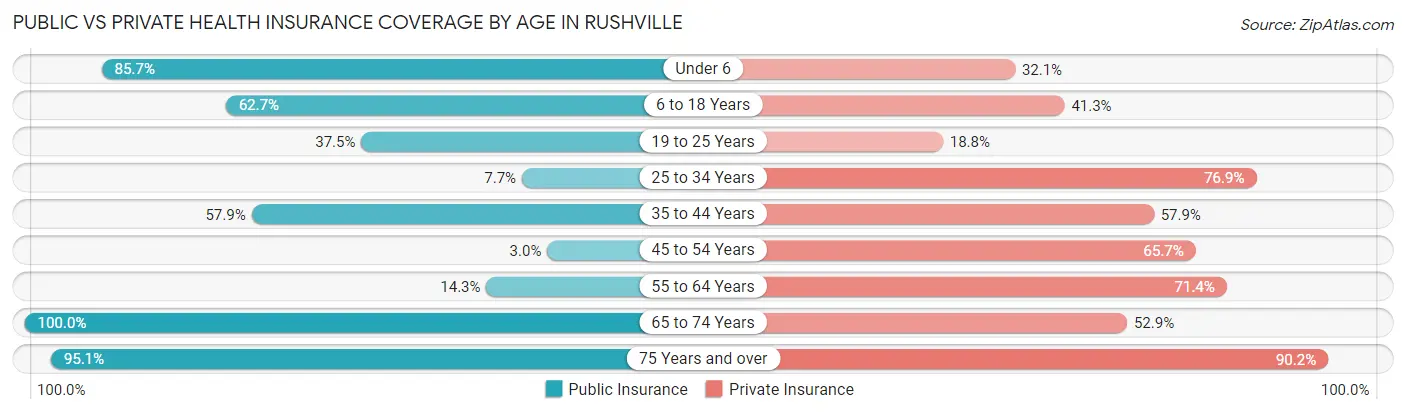
| Age Bracket | Public Insurance | Private Insurance |
| Under 6 | 24 (85.7%) | 9 (32.1%) |
| 6 to 18 Years | 47 (62.7%) | 31 (41.3%) |
| 19 to 25 Years | 6 (37.5%) | 3 (18.8%) |
| 25 to 34 Years | 1 (7.7%) | 10 (76.9%) |
| 35 to 44 Years | 22 (57.9%) | 22 (57.9%) |
| 45 to 54 Years | 2 (3.0%) | 44 (65.7%) |
| 55 to 64 Years | 2 (14.3%) | 10 (71.4%) |
| 65 to 74 Years | 34 (100.0%) | 18 (52.9%) |
| 75 Years and over | 39 (95.1%) | 37 (90.2%) |
| Total | 177 (54.3%) | 184 (56.4%) |
Disability Status by Sex by Age in Rushville
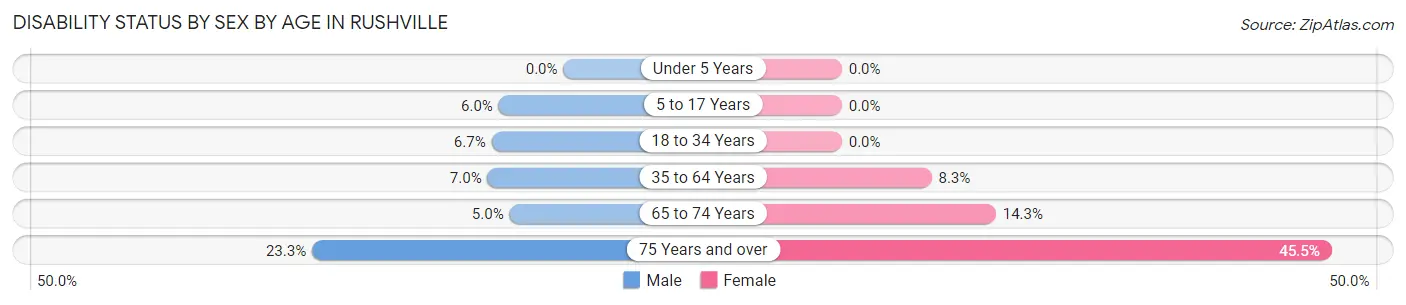
| Age Bracket | Male | Female |
| Under 5 Years | 0 (0.0%) | 0 (0.0%) |
| 5 to 17 Years | 3 (6.0%) | 0 (0.0%) |
| 18 to 34 Years | 1 (6.7%) | 0 (0.0%) |
| 35 to 64 Years | 5 (7.0%) | 4 (8.3%) |
| 65 to 74 Years | 1 (5.0%) | 2 (14.3%) |
| 75 Years and over | 7 (23.3%) | 5 (45.5%) |
Disability Class by Sex by Age in Rushville
Disability Class: Hearing Difficulty
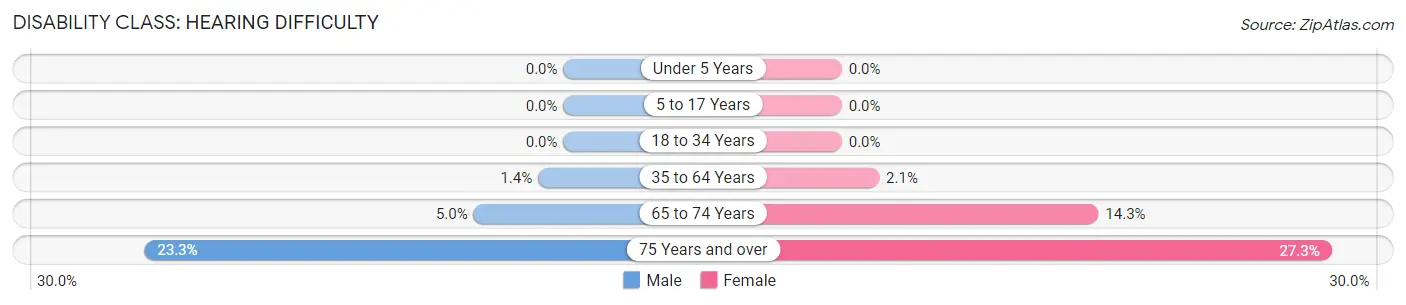
| Age Bracket | Male | Female |
| Under 5 Years | 0 (0.0%) | 0 (0.0%) |
| 5 to 17 Years | 0 (0.0%) | 0 (0.0%) |
| 18 to 34 Years | 0 (0.0%) | 0 (0.0%) |
| 35 to 64 Years | 1 (1.4%) | 1 (2.1%) |
| 65 to 74 Years | 1 (5.0%) | 2 (14.3%) |
| 75 Years and over | 7 (23.3%) | 3 (27.3%) |
Disability Class: Vision Difficulty
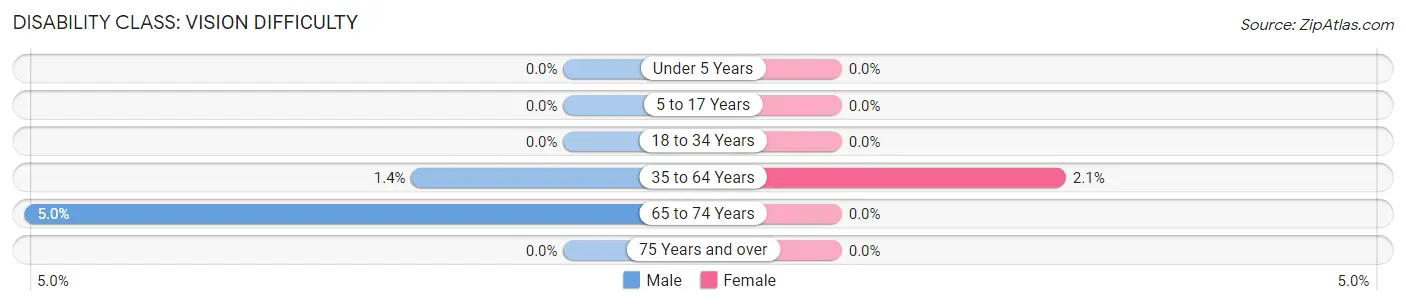
| Age Bracket | Male | Female |
| Under 5 Years | 0 (0.0%) | 0 (0.0%) |
| 5 to 17 Years | 0 (0.0%) | 0 (0.0%) |
| 18 to 34 Years | 0 (0.0%) | 0 (0.0%) |
| 35 to 64 Years | 1 (1.4%) | 1 (2.1%) |
| 65 to 74 Years | 1 (5.0%) | 0 (0.0%) |
| 75 Years and over | 0 (0.0%) | 0 (0.0%) |
Disability Class: Cognitive Difficulty
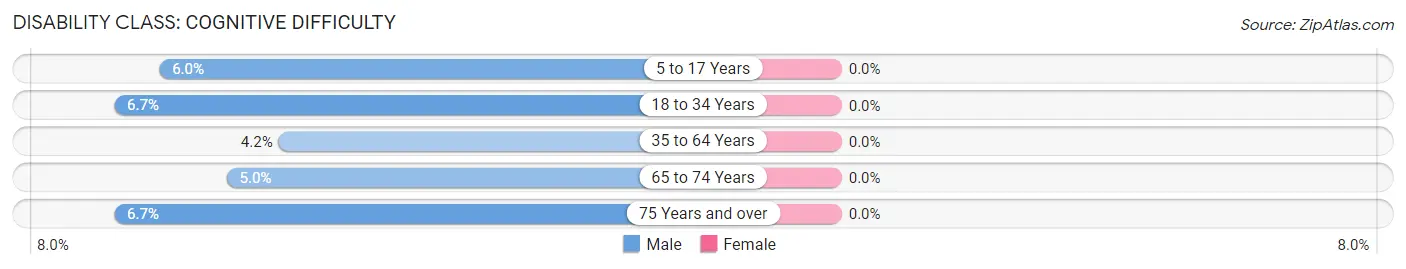
| Age Bracket | Male | Female |
| 5 to 17 Years | 3 (6.0%) | 0 (0.0%) |
| 18 to 34 Years | 1 (6.7%) | 0 (0.0%) |
| 35 to 64 Years | 3 (4.2%) | 0 (0.0%) |
| 65 to 74 Years | 1 (5.0%) | 0 (0.0%) |
| 75 Years and over | 2 (6.7%) | 0 (0.0%) |
Disability Class: Ambulatory Difficulty
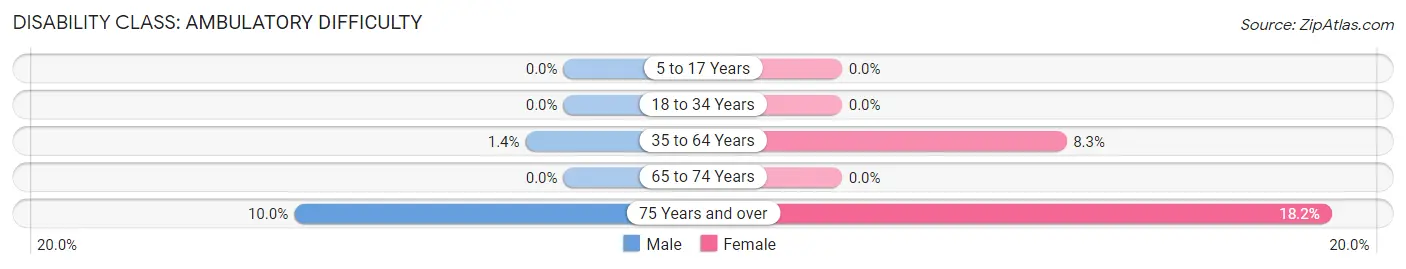
| Age Bracket | Male | Female |
| 5 to 17 Years | 0 (0.0%) | 0 (0.0%) |
| 18 to 34 Years | 0 (0.0%) | 0 (0.0%) |
| 35 to 64 Years | 1 (1.4%) | 4 (8.3%) |
| 65 to 74 Years | 0 (0.0%) | 0 (0.0%) |
| 75 Years and over | 3 (10.0%) | 2 (18.2%) |
Disability Class: Self-Care Difficulty
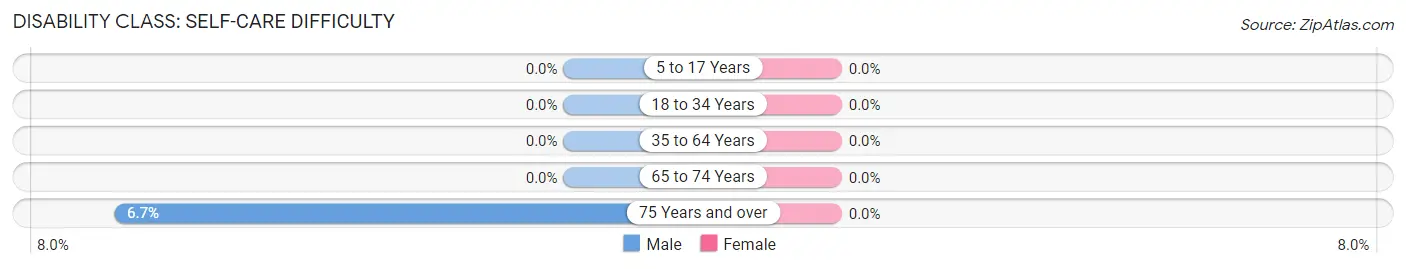
| Age Bracket | Male | Female |
| 5 to 17 Years | 0 (0.0%) | 0 (0.0%) |
| 18 to 34 Years | 0 (0.0%) | 0 (0.0%) |
| 35 to 64 Years | 0 (0.0%) | 0 (0.0%) |
| 65 to 74 Years | 0 (0.0%) | 0 (0.0%) |
| 75 Years and over | 2 (6.7%) | 0 (0.0%) |
Technology Access in Rushville
Computing Device Access in Rushville
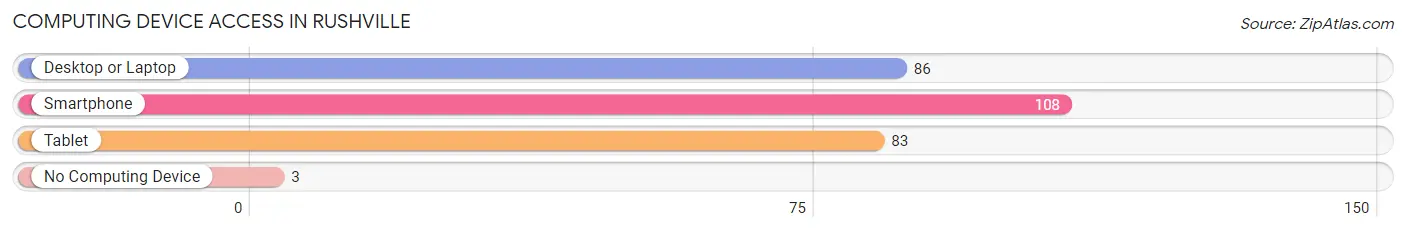
| Device Type | # Households | % Households |
| Desktop or Laptop | 86 | 74.8% |
| Smartphone | 108 | 93.9% |
| Tablet | 83 | 72.2% |
| No Computing Device | 3 | 2.6% |
| Total | 115 | 100.0% |
Internet Access in Rushville
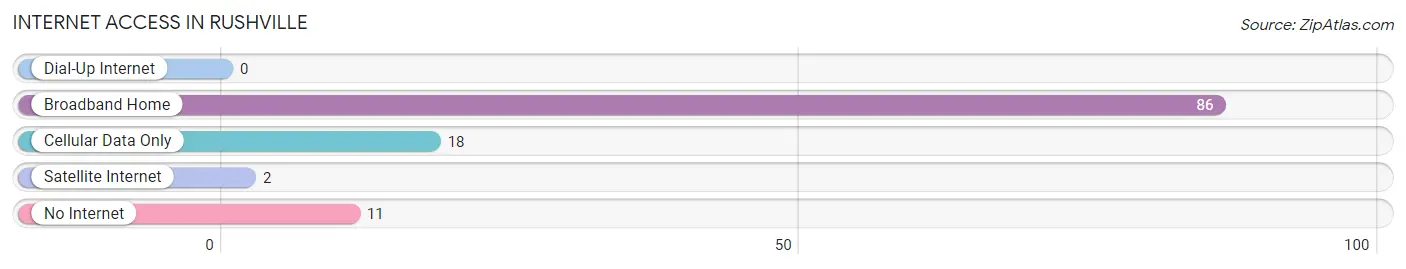
| Internet Type | # Households | % Households |
| Dial-Up Internet | 0 | 0.0% |
| Broadband Home | 86 | 74.8% |
| Cellular Data Only | 18 | 15.7% |
| Satellite Internet | 2 | 1.7% |
| No Internet | 11 | 9.6% |
| Total | 115 | 100.0% |
Rushville Summary
History
The small town of Rushville, Ohio is located in the southeastern corner of the state, in the Appalachian foothills. It was founded in 1817 by a group of settlers from Pennsylvania, who were looking for a place to settle and start a new life. The town was named after the nearby Rush Creek, which was named after the Rush family, who had settled in the area in the late 1700s.
The town grew slowly but steadily over the years, and by the mid-1800s, it had become a thriving agricultural community. The town was home to several mills, including a grist mill, a saw mill, and a woolen mill. The town also had a blacksmith shop, a general store, and a post office.
In the late 1800s, the town began to experience a period of growth and prosperity. The railroad arrived in 1881, bringing with it new opportunities for business and industry. The town was home to several factories, including a furniture factory, a canning factory, and a brickyard. The town also had several churches, a bank, and a newspaper.
By the early 1900s, the town had become a bustling center of commerce and industry. The population had grown to over 1,000 people, and the town had become a popular tourist destination. The town was home to several hotels, restaurants, and shops.
In the mid-1900s, the town began to experience a period of decline. The factories and businesses began to close, and the population began to decline. By the late 1970s, the population had dropped to just over 500 people.
Today, Rushville is a small, rural town with a population of just over 1,000 people. The town is still home to several businesses, including a grocery store, a hardware store, and a few restaurants. The town is also home to several churches, a library, and a post office.
Geography
Rushville is located in the southeastern corner of Ohio, in the Appalachian foothills. The town is situated on the banks of Rush Creek, which flows through the town and into the nearby Ohio River. The town is surrounded by rolling hills and forests, and is located about 25 miles from the nearest major city, Cincinnati.
The climate in Rushville is generally mild, with hot summers and cold winters. The average temperature in the summer is around 75 degrees Fahrenheit, and the average temperature in the winter is around 35 degrees Fahrenheit. The town receives an average of 40 inches of precipitation each year.
Economy
The economy of Rushville is largely based on agriculture and tourism. The town is home to several farms, which produce a variety of crops, including corn, soybeans, wheat, and hay. The town is also home to several wineries, which produce a variety of wines.
The town is also home to several small businesses, including a grocery store, a hardware store, and a few restaurants. The town is also home to several churches, a library, and a post office.
Demographics
As of the 2010 census, the population of Rushville was 1,072. The racial makeup of the town was 97.3% White, 0.7% African American, 0.2% Native American, 0.2% Asian, 0.1% Pacific Islander, 0.3% from other races, and 1.3% from two or more races. Hispanic or Latino of any race were 1.2% of the population.
The median household income in Rushville was $37,917, and the median family income was $45,625. The per capita income in the town was $19,945. About 11.2% of families and 14.2% of the population were below the poverty line, including 18.2% of those under age 18 and 8.3% of those age 65 or over.
Common Questions
What is Per Capita Income in Rushville?
Per Capita income in Rushville is $29,940.
What is the Median Family Income in Rushville?
Median Family Income in Rushville is $67,596.
What is the Median Household income in Rushville?
Median Household Income in Rushville is $67,723.
What is Inequality or Gini Index in Rushville?
Inequality or Gini Index in Rushville is 0.40.
What is the Total Population of Rushville?
Total Population of Rushville is 326.
What is the Total Male Population of Rushville?
Total Male Population of Rushville is 192.
What is the Total Female Population of Rushville?
Total Female Population of Rushville is 134.
What is the Ratio of Males per 100 Females in Rushville?
There are 143.28 Males per 100 Females in Rushville.
What is the Ratio of Females per 100 Males in Rushville?
There are 69.79 Females per 100 Males in Rushville.
What is the Median Population Age in Rushville?
Median Population Age in Rushville is 41.0 Years.
What is the Average Family Size in Rushville
Average Family Size in Rushville is 3.1 People.
What is the Average Household Size in Rushville
Average Household Size in Rushville is 2.8 People.
How Large is the Labor Force in Rushville?
There are 158 People in the Labor Forcein in Rushville.
What is the Percentage of People in the Labor Force in Rushville?
65.3% of People are in the Labor Force in Rushville.
What is the Unemployment Rate in Rushville?
Unemployment Rate in Rushville is 2.5%.