Rossford, OH Map & Demographics
Rossford Map
Rossford Overview
$40,299
PER CAPITA INCOME
$100,067
AVG FAMILY INCOME
$74,886
AVG HOUSEHOLD INCOME
15.2%
WAGE / INCOME GAP [ % ]
84.8¢/ $1
WAGE / INCOME GAP [ $ ]
0.41
INEQUALITY / GINI INDEX
6,314
TOTAL POPULATION
3,257
MALE POPULATION
3,057
FEMALE POPULATION
106.54
MALES / 100 FEMALES
93.86
FEMALES / 100 MALES
40.2
MEDIAN AGE
3.0
AVG FAMILY SIZE
2.3
AVG HOUSEHOLD SIZE
3,769
LABOR FORCE [ PEOPLE ]
71.0%
PERCENT IN LABOR FORCE
4.8%
UNEMPLOYMENT RATE
Rossford Zip Codes
Income in Rossford
Income Overview in Rossford
Per Capita Income in Rossford is $40,299, while median incomes of families and households are $100,067 and $74,886 respectively.
| Characteristic | Number | Measure |
| Per Capita Income | 6,314 | $40,299 |
| Median Family Income | 1,609 | $100,067 |
| Mean Family Income | 1,609 | $111,544 |
| Median Household Income | 2,697 | $74,886 |
| Mean Household Income | 2,697 | $92,442 |
| Income Deficit | 1,609 | $0 |
| Wage / Income Gap (%) | 6,314 | 15.20% |
| Wage / Income Gap ($) | 6,314 | 84.80¢ per $1 |
| Gini / Inequality Index | 6,314 | 0.41 |
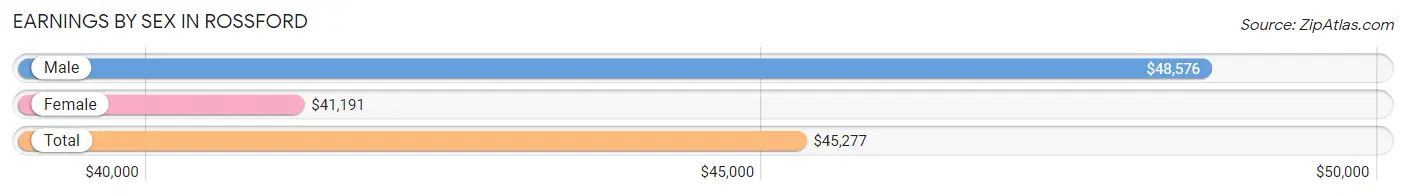
Earnings by Sex in Rossford
Average Earnings in Rossford are $45,277, $48,576 for men and $41,191 for women, a difference of 15.2%.
| Sex | Number | Average Earnings |
| Male | 2,395 (61.3%) | $48,576 |
| Female | 1,514 (38.7%) | $41,191 |
| Total | 3,909 (100.0%) | $45,277 |
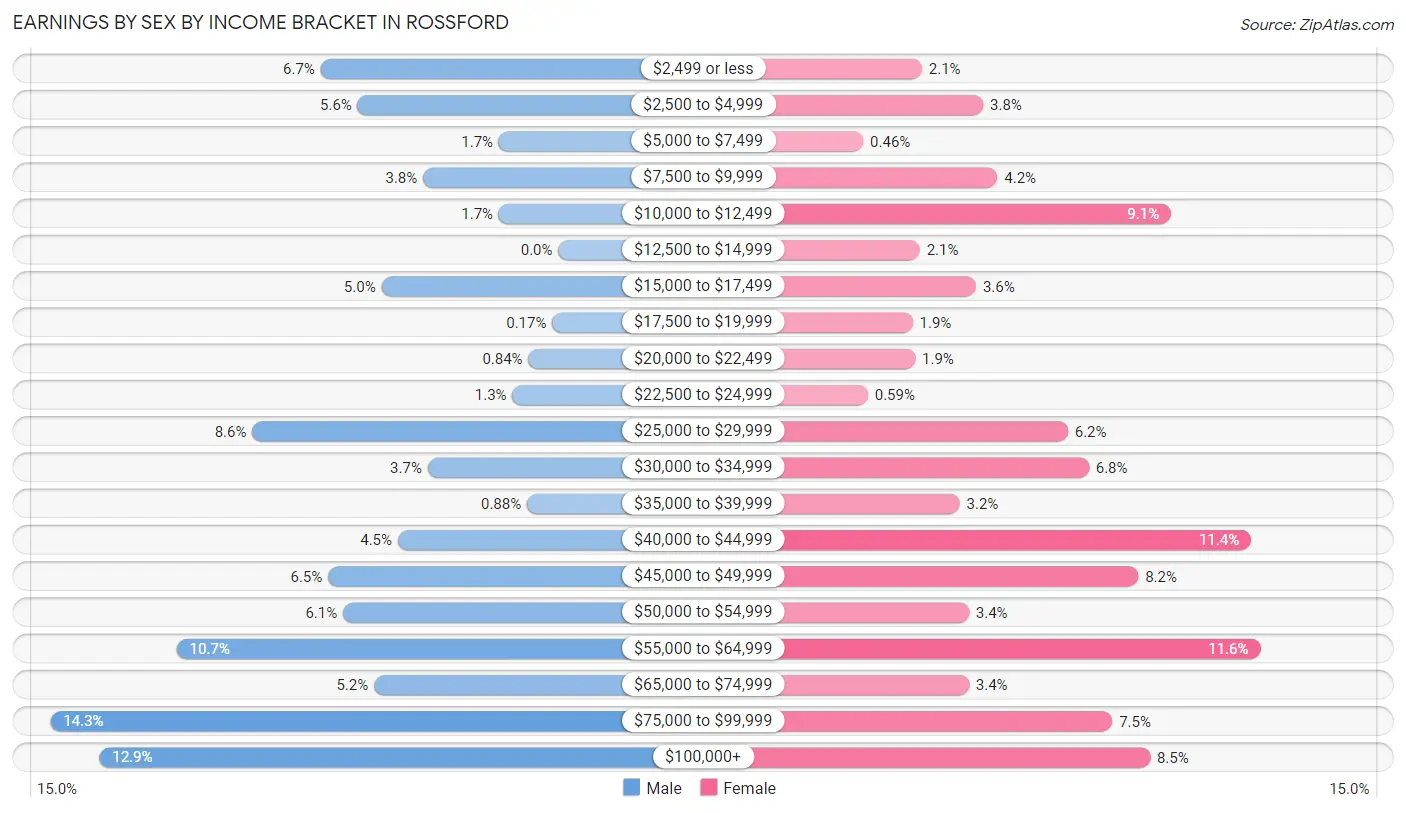
Earnings by Sex by Income Bracket in Rossford
The most common earnings brackets in Rossford are $75,000 to $99,999 for men (342 | 14.3%) and $55,000 to $64,999 for women (176 | 11.6%).
| Income | Male | Female |
| $2,499 or less | 160 (6.7%) | 32 (2.1%) |
| $2,500 to $4,999 | 135 (5.6%) | 58 (3.8%) |
| $5,000 to $7,499 | 40 (1.7%) | 7 (0.5%) |
| $7,500 to $9,999 | 91 (3.8%) | 64 (4.2%) |
| $10,000 to $12,499 | 40 (1.7%) | 138 (9.1%) |
| $12,500 to $14,999 | 0 (0.0%) | 31 (2.1%) |
| $15,000 to $17,499 | 119 (5.0%) | 55 (3.6%) |
| $17,500 to $19,999 | 4 (0.2%) | 28 (1.8%) |
| $20,000 to $22,499 | 20 (0.8%) | 29 (1.9%) |
| $22,500 to $24,999 | 31 (1.3%) | 9 (0.6%) |
| $25,000 to $29,999 | 206 (8.6%) | 94 (6.2%) |
| $30,000 to $34,999 | 88 (3.7%) | 103 (6.8%) |
| $35,000 to $39,999 | 21 (0.9%) | 48 (3.2%) |
| $40,000 to $44,999 | 108 (4.5%) | 172 (11.4%) |
| $45,000 to $49,999 | 155 (6.5%) | 124 (8.2%) |
| $50,000 to $54,999 | 145 (6.0%) | 52 (3.4%) |
| $55,000 to $64,999 | 257 (10.7%) | 176 (11.6%) |
| $65,000 to $74,999 | 124 (5.2%) | 52 (3.4%) |
| $75,000 to $99,999 | 342 (14.3%) | 113 (7.5%) |
| $100,000+ | 309 (12.9%) | 129 (8.5%) |
| Total | 2,395 (100.0%) | 1,514 (100.0%) |
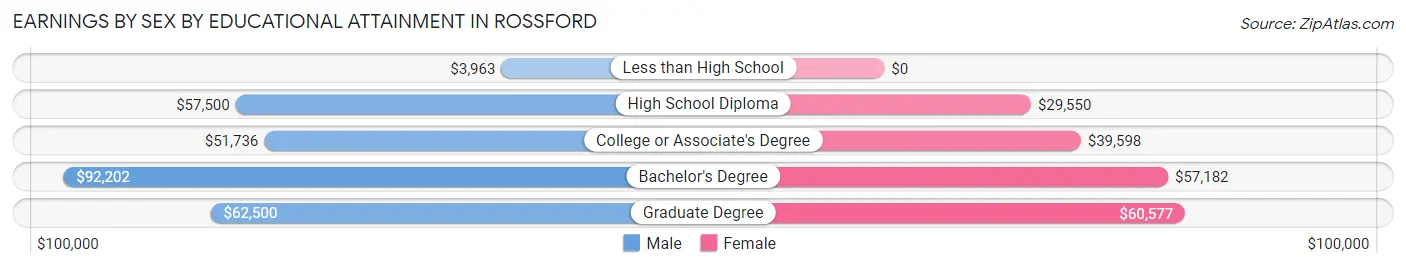
Earnings by Sex by Educational Attainment in Rossford
Average earnings in Rossford are $59,375 for men and $42,614 for women, a difference of 28.2%. Men with an educational attainment of bachelor's degree enjoy the highest average annual earnings of $92,202, while those with less than high school education earn the least with $3,963. Women with an educational attainment of graduate degree earn the most with the average annual earnings of $60,577, while those with high school diploma education have the smallest earnings of $29,550.
| Educational Attainment | Male Income | Female Income |
| Less than High School | $3,963 | $0 |
| High School Diploma | $57,500 | $29,550 |
| College or Associate's Degree | $51,736 | $39,598 |
| Bachelor's Degree | $92,202 | $57,182 |
| Graduate Degree | $62,500 | $60,577 |
| Total | $59,375 | $42,614 |
Family Income in Rossford
Family Income Brackets in Rossford
According to the Rossford family income data, there are 323 families falling into the $100,000 to $149,999 income range, which is the most common income bracket and makes up 20.1% of all families. Conversely, the $10,000 to $14,999 income bracket is the least frequent group with only 6 families (0.4%) belonging to this category.
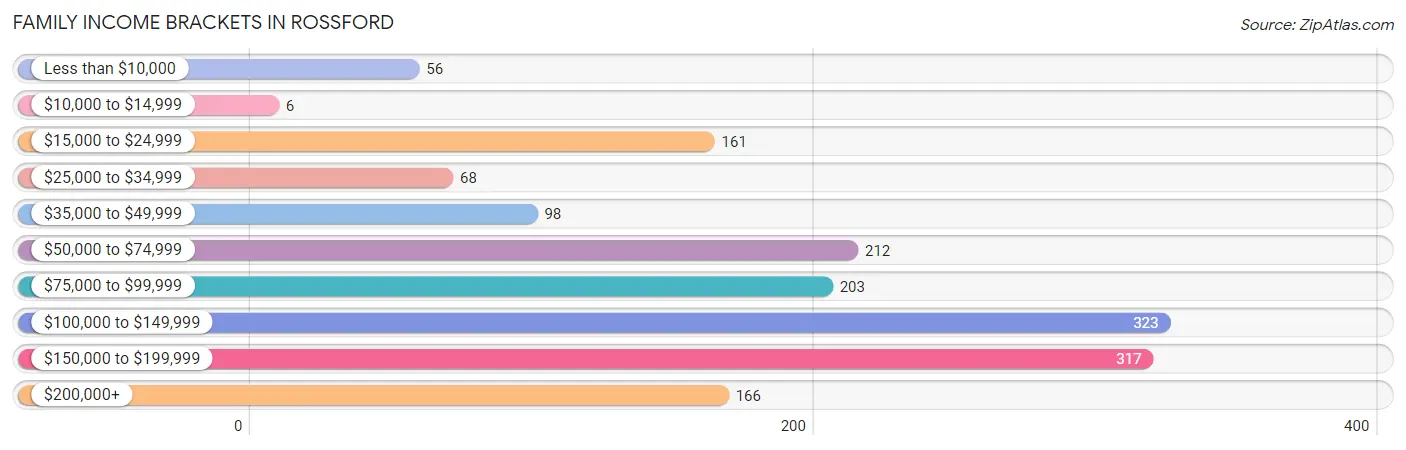
| Income Bracket | # Families | % Families |
| Less than $10,000 | 56 | 3.5% |
| $10,000 to $14,999 | 6 | 0.4% |
| $15,000 to $24,999 | 161 | 10.0% |
| $25,000 to $34,999 | 68 | 4.2% |
| $35,000 to $49,999 | 98 | 6.1% |
| $50,000 to $74,999 | 212 | 13.2% |
| $75,000 to $99,999 | 203 | 12.6% |
| $100,000 to $149,999 | 323 | 20.1% |
| $150,000 to $199,999 | 317 | 19.7% |
| $200,000+ | 166 | 10.3% |
Family Income by Famaliy Size in Rossford
4-person families (294 | 18.3%) account for the highest median family income in Rossford with $146,458 per family, while 2-person families (778 | 48.3%) have the highest median income of $44,348 per family member.
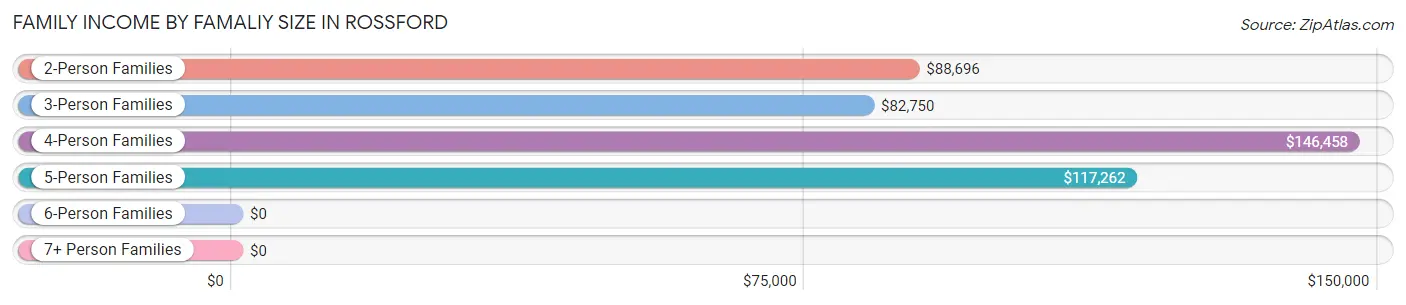
| Income Bracket | # Families | Median Income |
| 2-Person Families | 778 (48.3%) | $88,696 |
| 3-Person Families | 373 (23.2%) | $82,750 |
| 4-Person Families | 294 (18.3%) | $146,458 |
| 5-Person Families | 144 (8.9%) | $117,262 |
| 6-Person Families | 0 (0.0%) | $0 |
| 7+ Person Families | 20 (1.2%) | $0 |
| Total | 1,609 (100.0%) | $100,067 |
Family Income by Number of Earners in Rossford
The median family income in Rossford is $100,067, with families comprising 3+ earners (282) having the highest median family income of $192,907, while families with 1 earner (346) have the lowest median family income of $65,125, accounting for 17.5% and 21.5% of families, respectively.
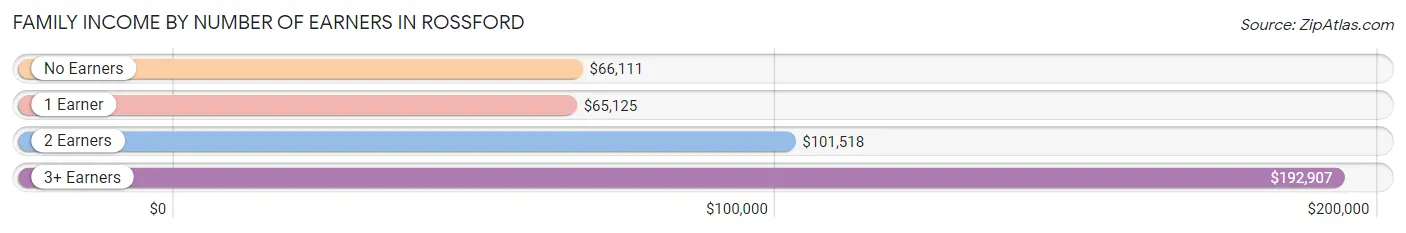
| Number of Earners | # Families | Median Income |
| No Earners | 254 (15.8%) | $66,111 |
| 1 Earner | 346 (21.5%) | $65,125 |
| 2 Earners | 727 (45.2%) | $101,518 |
| 3+ Earners | 282 (17.5%) | $192,907 |
| Total | 1,609 (100.0%) | $100,067 |
Household Income in Rossford
Household Income Brackets in Rossford
With 494 households falling in the category, the $100,000 to $149,999 income range is the most frequent in Rossford, accounting for 18.3% of all households. In contrast, only 35 households (1.3%) fall into the $10,000 to $14,999 income bracket, making it the least populous group.
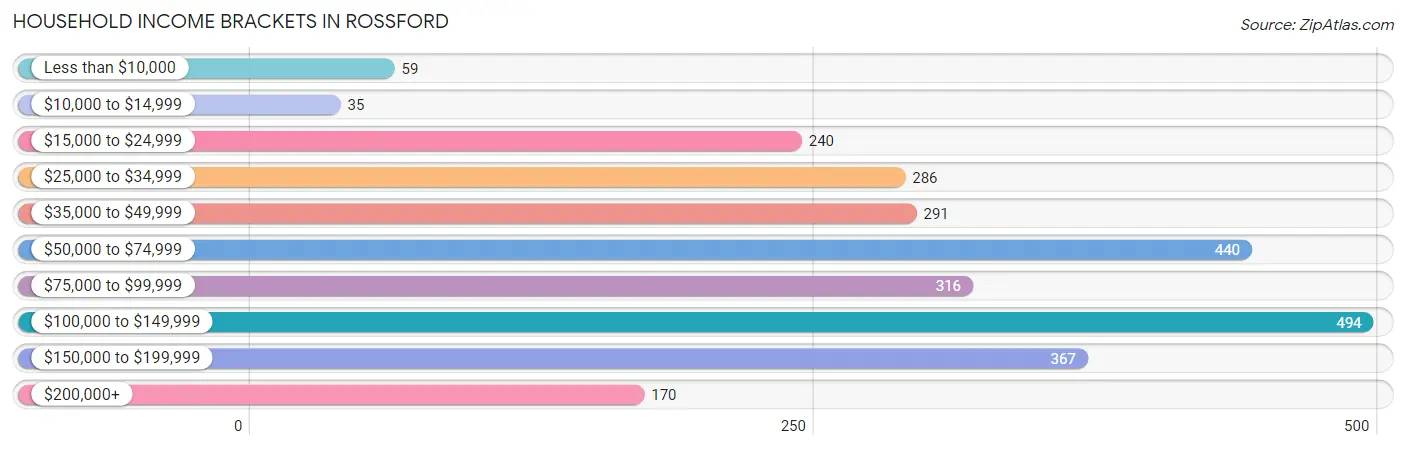
| Income Bracket | # Households | % Households |
| Less than $10,000 | 59 | 2.2% |
| $10,000 to $14,999 | 35 | 1.3% |
| $15,000 to $24,999 | 240 | 8.9% |
| $25,000 to $34,999 | 286 | 10.6% |
| $35,000 to $49,999 | 291 | 10.8% |
| $50,000 to $74,999 | 440 | 16.3% |
| $75,000 to $99,999 | 316 | 11.7% |
| $100,000 to $149,999 | 494 | 18.3% |
| $150,000 to $199,999 | 367 | 13.6% |
| $200,000+ | 170 | 6.3% |
Household Income by Householder Age in Rossford
The median household income in Rossford is $74,886, with the highest median household income of $100,522 found in the 45 to 64 years age bracket for the primary householder. A total of 943 households (35.0%) fall into this category. Meanwhile, the 15 to 24 years age bracket for the primary householder has the lowest median household income of $45,741, with 148 households (5.5%) in this group.
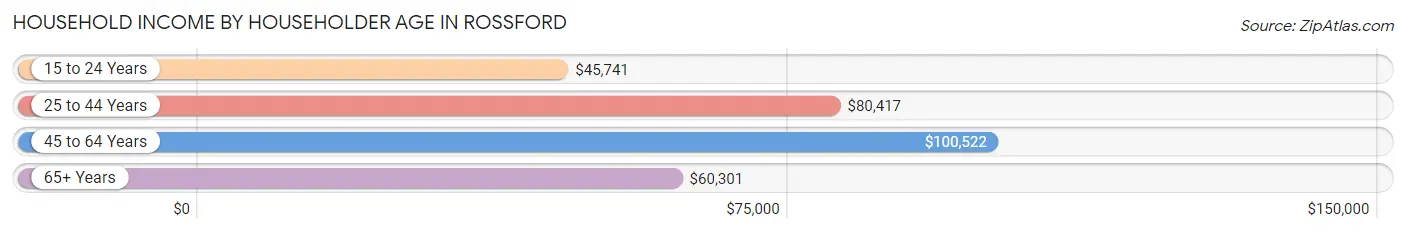
| Income Bracket | # Households | Median Income |
| 15 to 24 Years | 148 (5.5%) | $45,741 |
| 25 to 44 Years | 933 (34.6%) | $80,417 |
| 45 to 64 Years | 943 (35.0%) | $100,522 |
| 65+ Years | 673 (24.9%) | $60,301 |
| Total | 2,697 (100.0%) | $74,886 |
Poverty in Rossford
Income Below Poverty by Sex and Age in Rossford
With 7.6% poverty level for males and 15.3% for females among the residents of Rossford, 55 to 64 year old males and 15 year old females are the most vulnerable to poverty, with 93 males (22.3%) and 65 females (76.5%) in their respective age groups living below the poverty level.
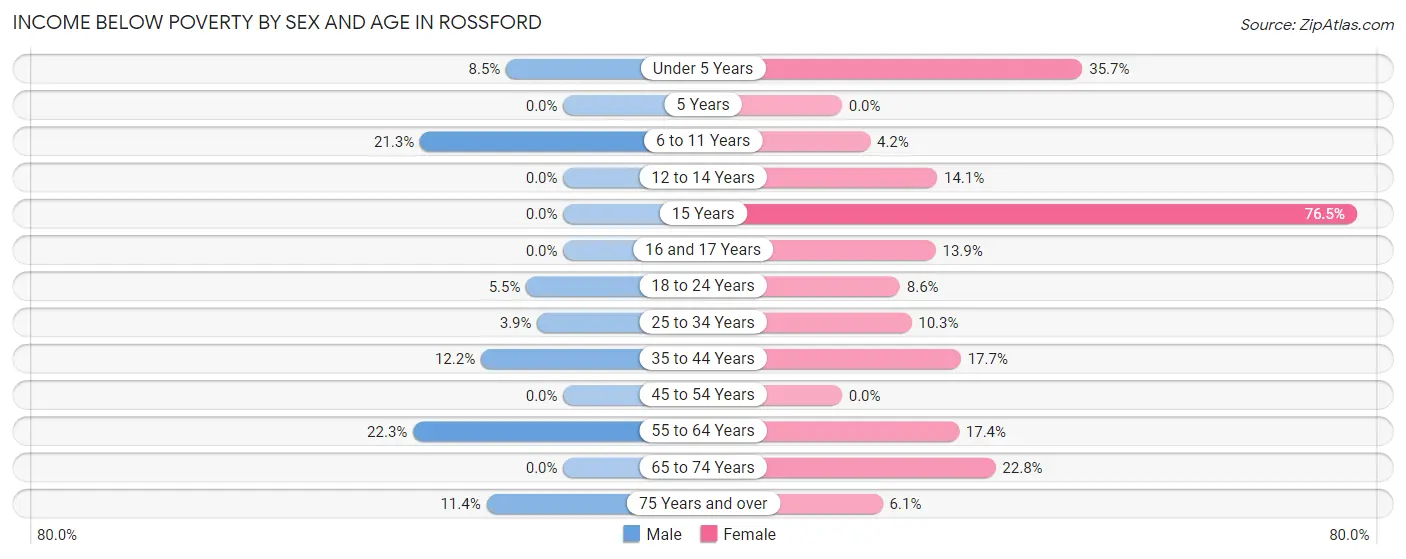
| Age Bracket | Male | Female |
| Under 5 Years | 9 (8.5%) | 45 (35.7%) |
| 5 Years | 0 (0.0%) | 0 (0.0%) |
| 6 to 11 Years | 20 (21.3%) | 8 (4.2%) |
| 12 to 14 Years | 0 (0.0%) | 28 (14.1%) |
| 15 Years | 0 (0.0%) | 65 (76.5%) |
| 16 and 17 Years | 0 (0.0%) | 11 (13.9%) |
| 18 to 24 Years | 30 (5.5%) | 15 (8.6%) |
| 25 to 34 Years | 21 (3.9%) | 36 (10.3%) |
| 35 to 44 Years | 57 (12.2%) | 83 (17.7%) |
| 45 to 54 Years | 0 (0.0%) | 0 (0.0%) |
| 55 to 64 Years | 93 (22.3%) | 102 (17.4%) |
| 65 to 74 Years | 0 (0.0%) | 60 (22.8%) |
| 75 Years and over | 17 (11.4%) | 15 (6.1%) |
| Total | 247 (7.6%) | 468 (15.3%) |
Income Above Poverty by Sex and Age in Rossford
According to the poverty statistics in Rossford, males aged 5 years and females aged 5 years are the age groups that are most secure financially, with 100.0% of males and 100.0% of females in these age groups living above the poverty line.
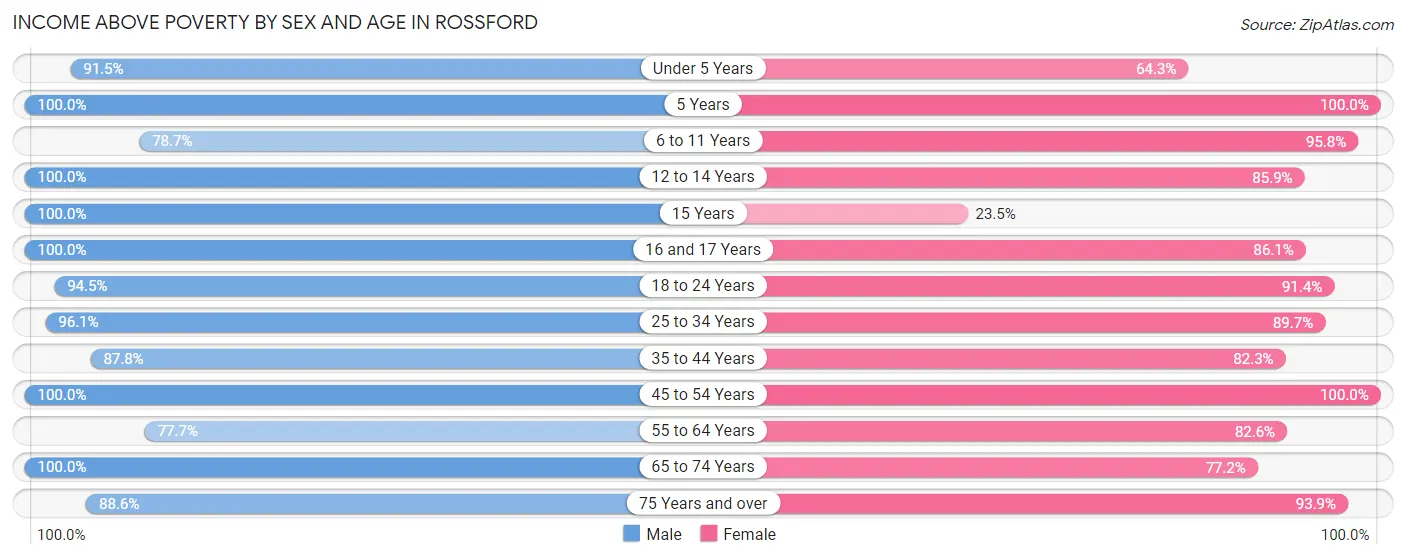
| Age Bracket | Male | Female |
| Under 5 Years | 97 (91.5%) | 81 (64.3%) |
| 5 Years | 70 (100.0%) | 30 (100.0%) |
| 6 to 11 Years | 74 (78.7%) | 183 (95.8%) |
| 12 to 14 Years | 87 (100.0%) | 170 (85.9%) |
| 15 Years | 19 (100.0%) | 20 (23.5%) |
| 16 and 17 Years | 22 (100.0%) | 68 (86.1%) |
| 18 to 24 Years | 515 (94.5%) | 159 (91.4%) |
| 25 to 34 Years | 523 (96.1%) | 313 (89.7%) |
| 35 to 44 Years | 409 (87.8%) | 387 (82.3%) |
| 45 to 54 Years | 411 (100.0%) | 258 (100.0%) |
| 55 to 64 Years | 324 (77.7%) | 485 (82.6%) |
| 65 to 74 Years | 327 (100.0%) | 203 (77.2%) |
| 75 Years and over | 132 (88.6%) | 232 (93.9%) |
| Total | 3,010 (92.4%) | 2,589 (84.7%) |
Income Below Poverty Among Married-Couple Families in Rossford
The poverty statistics for married-couple families in Rossford show that 7.5% or 100 of the total 1,324 families live below the poverty line. Families with no children have the highest poverty rate of 8.6%, comprising of 71 families. On the other hand, families with 3 or 4 children have the lowest poverty rate of 0.0%, which includes 0 families.
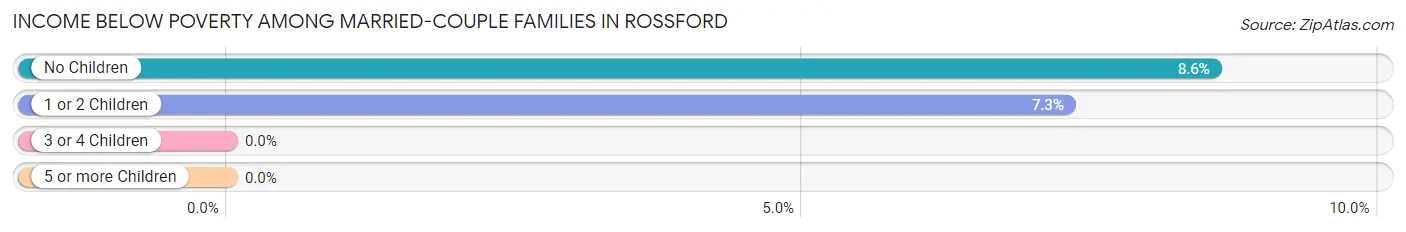
| Children | Above Poverty | Below Poverty |
| No Children | 758 (91.4%) | 71 (8.6%) |
| 1 or 2 Children | 369 (92.7%) | 29 (7.3%) |
| 3 or 4 Children | 77 (100.0%) | 0 (0.0%) |
| 5 or more Children | 20 (100.0%) | 0 (0.0%) |
| Total | 1,224 (92.4%) | 100 (7.5%) |
Income Below Poverty Among Single-Parent Households in Rossford
According to the poverty data in Rossford, 17.4% or 12 single-father households and 44.0% or 95 single-mother households are living below the poverty line. Among single-father households, those with 1 or 2 children have the highest poverty rate, with 12 households (19.4%) experiencing poverty. Likewise, among single-mother households, those with 1 or 2 children have the highest poverty rate, with 88 households (68.2%) falling below the poverty line.
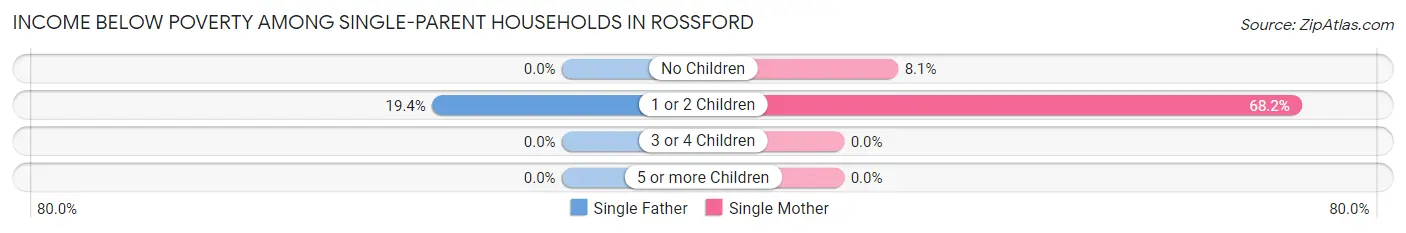
| Children | Single Father | Single Mother |
| No Children | 0 (0.0%) | 7 (8.1%) |
| 1 or 2 Children | 12 (19.4%) | 88 (68.2%) |
| 3 or 4 Children | 0 (0.0%) | 0 (0.0%) |
| 5 or more Children | 0 (0.0%) | 0 (0.0%) |
| Total | 12 (17.4%) | 95 (44.0%) |
Income Below Poverty Among Married-Couple vs Single-Parent Households in Rossford
The poverty data for Rossford shows that 100 of the married-couple family households (7.5%) and 107 of the single-parent households (37.5%) are living below the poverty level. Within the married-couple family households, those with no children have the highest poverty rate, with 71 households (8.6%) falling below the poverty line. Among the single-parent households, those with 1 or 2 children have the highest poverty rate, with 100 household (52.4%) living below poverty.
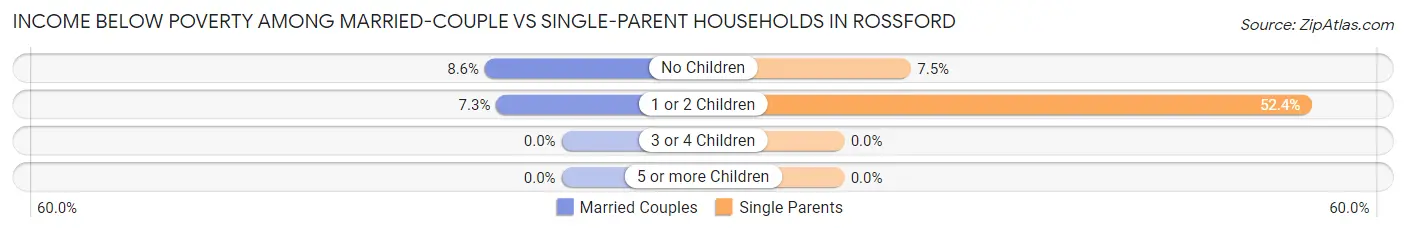
| Children | Married-Couple Families | Single-Parent Households |
| No Children | 71 (8.6%) | 7 (7.4%) |
| 1 or 2 Children | 29 (7.3%) | 100 (52.4%) |
| 3 or 4 Children | 0 (0.0%) | 0 (0.0%) |
| 5 or more Children | 0 (0.0%) | 0 (0.0%) |
| Total | 100 (7.5%) | 107 (37.5%) |
Race in Rossford
The most populous races in Rossford are White / Caucasian (5,922 | 93.8%), Hispanic or Latino (277 | 4.4%), and Two or more Races (236 | 3.7%).
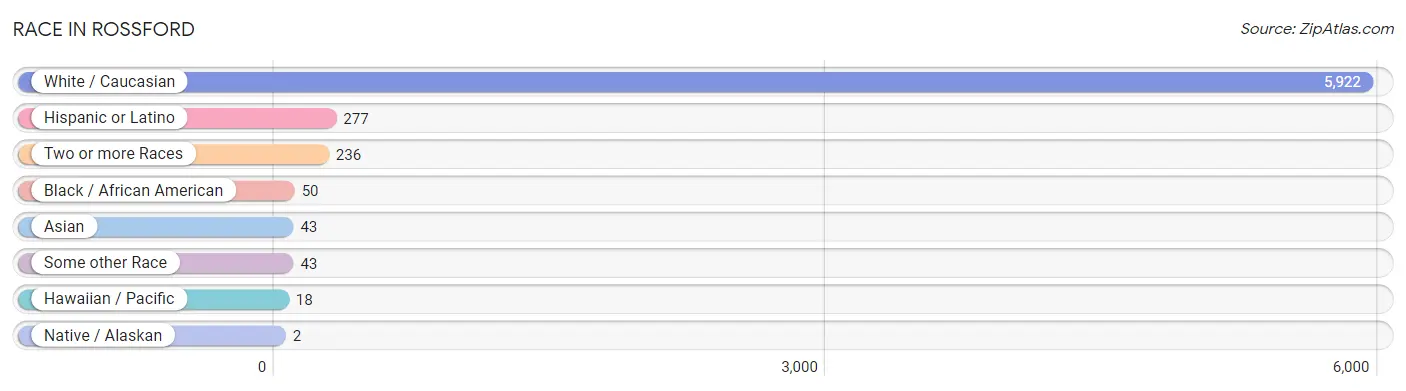
| Race | # Population | % Population |
| Asian | 43 | 0.7% |
| Black / African American | 50 | 0.8% |
| Hawaiian / Pacific | 18 | 0.3% |
| Hispanic or Latino | 277 | 4.4% |
| Native / Alaskan | 2 | 0.0% |
| White / Caucasian | 5,922 | 93.8% |
| Two or more Races | 236 | 3.7% |
| Some other Race | 43 | 0.7% |
| Total | 6,314 | 100.0% |
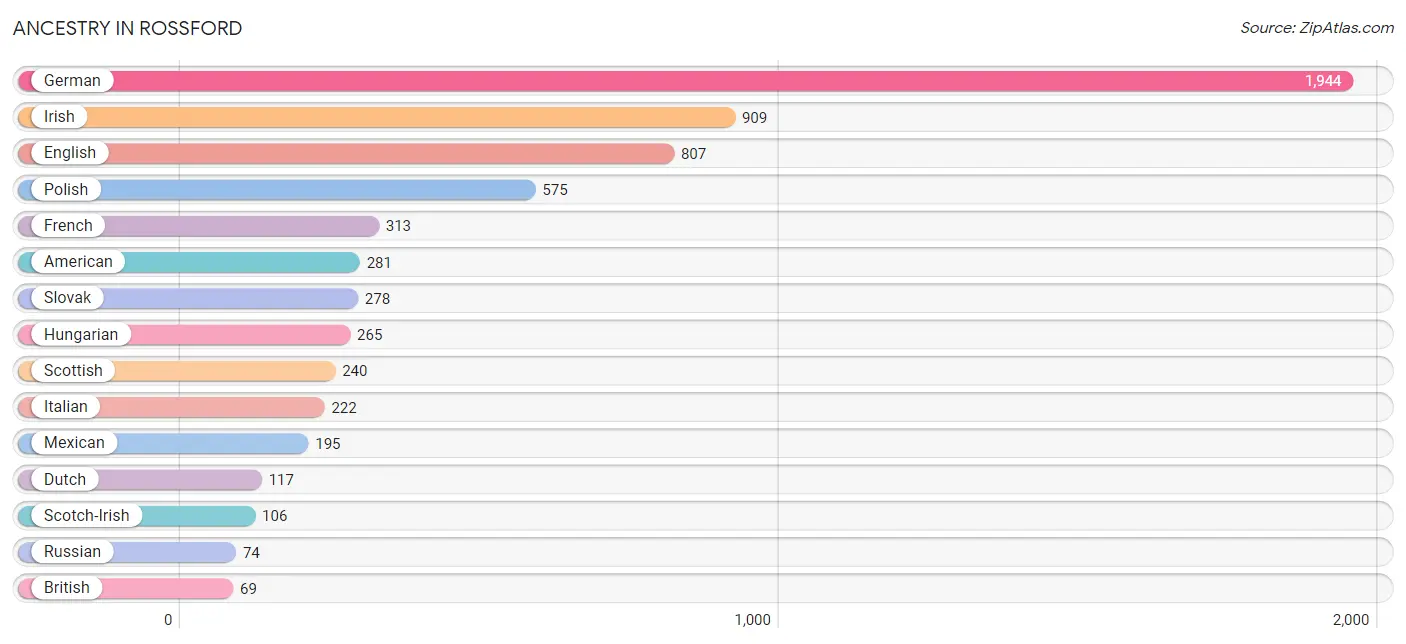
Ancestry in Rossford
The most populous ancestries reported in Rossford are German (1,944 | 30.8%), Irish (909 | 14.4%), English (807 | 12.8%), Polish (575 | 9.1%), and French (313 | 5.0%), together accounting for 72.0% of all Rossford residents.
| Ancestry | # Population | % Population |
| African | 20 | 0.3% |
| Albanian | 5 | 0.1% |
| American | 281 | 4.4% |
| Arab | 13 | 0.2% |
| Belgian | 18 | 0.3% |
| Bhutanese | 7 | 0.1% |
| British | 69 | 1.1% |
| Bulgarian | 33 | 0.5% |
| Canadian | 36 | 0.6% |
| Celtic | 15 | 0.2% |
| Central American | 61 | 1.0% |
| Czech | 67 | 1.1% |
| Czechoslovakian | 24 | 0.4% |
| Dutch | 117 | 1.8% |
| Eastern European | 14 | 0.2% |
| English | 807 | 12.8% |
| European | 28 | 0.4% |
| French | 313 | 5.0% |
| German | 1,944 | 30.8% |
| Greek | 22 | 0.4% |
| Guatemalan | 61 | 1.0% |
| Hungarian | 265 | 4.2% |
| Indian (Asian) | 11 | 0.2% |
| Irish | 909 | 14.4% |
| Italian | 222 | 3.5% |
| Latvian | 5 | 0.1% |
| Mexican | 195 | 3.1% |
| Native Hawaiian | 18 | 0.3% |
| Navajo | 2 | 0.0% |
| Northern European | 6 | 0.1% |
| Norwegian | 24 | 0.4% |
| Pakistani | 17 | 0.3% |
| Polish | 575 | 9.1% |
| Puerto Rican | 21 | 0.3% |
| Russian | 74 | 1.2% |
| Scotch-Irish | 106 | 1.7% |
| Scottish | 240 | 3.8% |
| Slovak | 278 | 4.4% |
| Slovene | 19 | 0.3% |
| Subsaharan African | 20 | 0.3% |
| Syrian | 13 | 0.2% |
| Thai | 8 | 0.1% |
| Turkish | 4 | 0.1% |
| Ukrainian | 18 | 0.3% |
| Welsh | 42 | 0.7% | View All 45 Rows |
Immigrants in Rossford
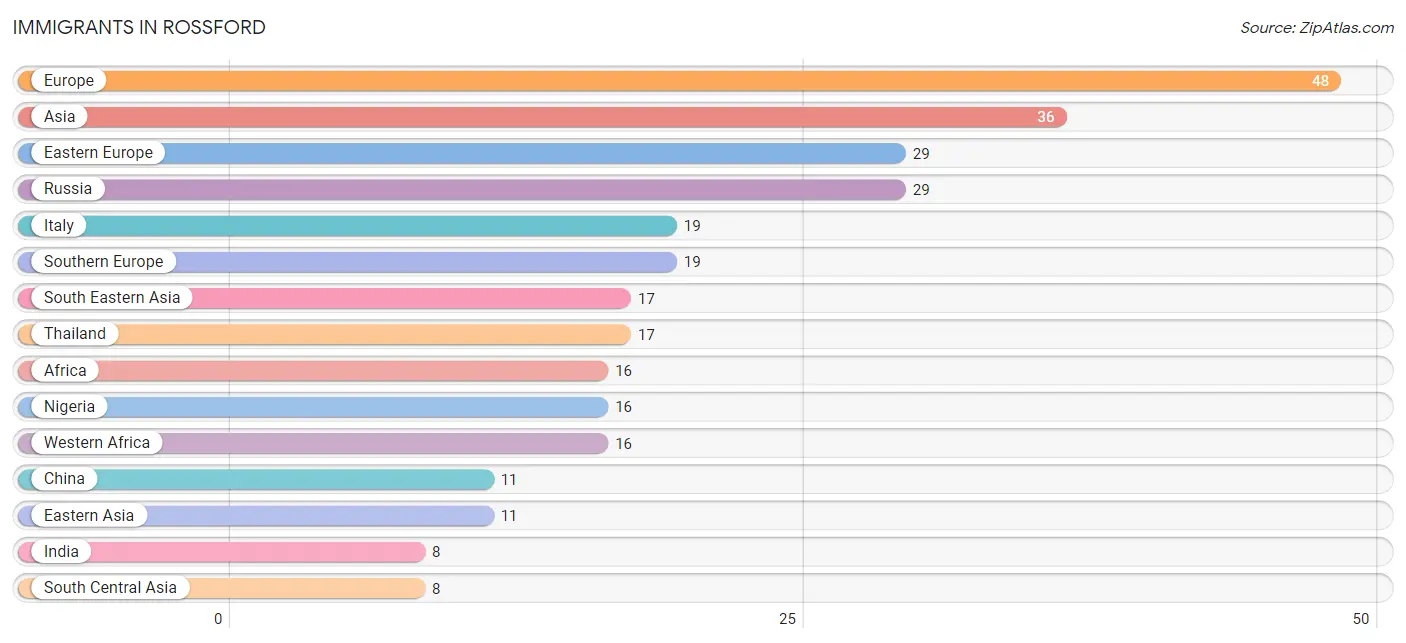
The most numerous immigrant groups reported in Rossford came from Europe (48 | 0.8%), Asia (36 | 0.6%), Eastern Europe (29 | 0.5%), Russia (29 | 0.5%), and Italy (19 | 0.3%), together accounting for 2.5% of all Rossford residents.
| Immigration Origin | # Population | % Population |
| Africa | 16 | 0.3% |
| Asia | 36 | 0.6% |
| Central America | 5 | 0.1% |
| China | 11 | 0.2% |
| Eastern Asia | 11 | 0.2% |
| Eastern Europe | 29 | 0.5% |
| Europe | 48 | 0.8% |
| India | 8 | 0.1% |
| Italy | 19 | 0.3% |
| Latin America | 5 | 0.1% |
| Mexico | 5 | 0.1% |
| Nigeria | 16 | 0.3% |
| Russia | 29 | 0.5% |
| South Central Asia | 8 | 0.1% |
| South Eastern Asia | 17 | 0.3% |
| Southern Europe | 19 | 0.3% |
| Thailand | 17 | 0.3% |
| Western Africa | 16 | 0.3% | View All 18 Rows |
Sex and Age in Rossford
Sex and Age in Rossford
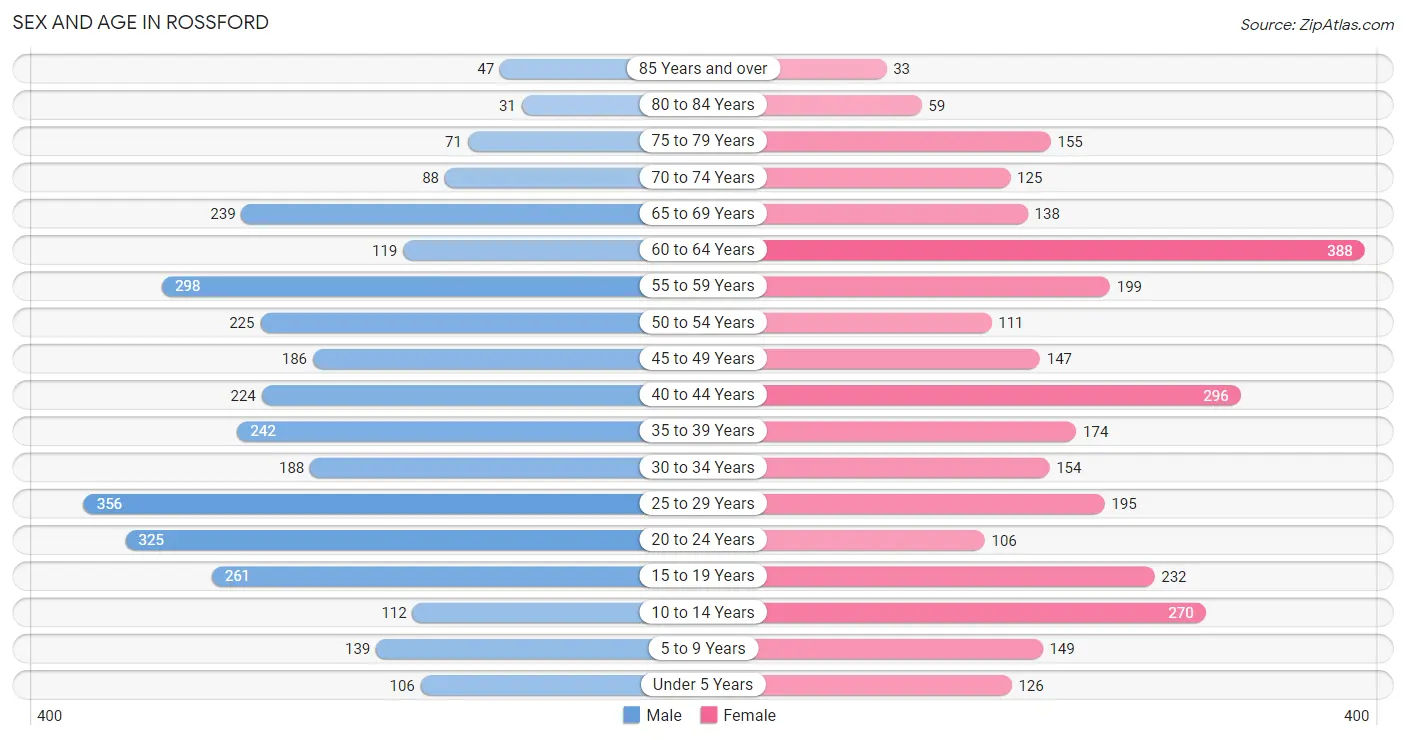
The most populous age groups in Rossford are 25 to 29 Years (356 | 10.9%) for men and 60 to 64 Years (388 | 12.7%) for women.
| Age Bracket | Male | Female |
| Under 5 Years | 106 (3.3%) | 126 (4.1%) |
| 5 to 9 Years | 139 (4.3%) | 149 (4.9%) |
| 10 to 14 Years | 112 (3.4%) | 270 (8.8%) |
| 15 to 19 Years | 261 (8.0%) | 232 (7.6%) |
| 20 to 24 Years | 325 (10.0%) | 106 (3.5%) |
| 25 to 29 Years | 356 (10.9%) | 195 (6.4%) |
| 30 to 34 Years | 188 (5.8%) | 154 (5.0%) |
| 35 to 39 Years | 242 (7.4%) | 174 (5.7%) |
| 40 to 44 Years | 224 (6.9%) | 296 (9.7%) |
| 45 to 49 Years | 186 (5.7%) | 147 (4.8%) |
| 50 to 54 Years | 225 (6.9%) | 111 (3.6%) |
| 55 to 59 Years | 298 (9.1%) | 199 (6.5%) |
| 60 to 64 Years | 119 (3.6%) | 388 (12.7%) |
| 65 to 69 Years | 239 (7.3%) | 138 (4.5%) |
| 70 to 74 Years | 88 (2.7%) | 125 (4.1%) |
| 75 to 79 Years | 71 (2.2%) | 155 (5.1%) |
| 80 to 84 Years | 31 (0.9%) | 59 (1.9%) |
| 85 Years and over | 47 (1.4%) | 33 (1.1%) |
| Total | 3,257 (100.0%) | 3,057 (100.0%) |
Families and Households in Rossford
Median Family Size in Rossford
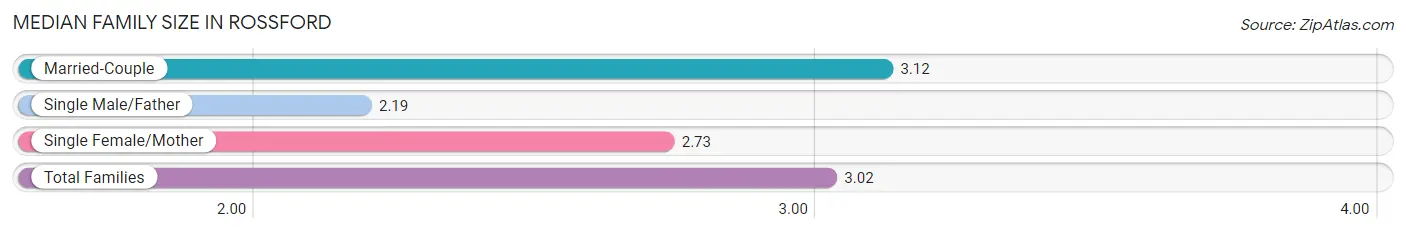
The median family size in Rossford is 3.02 persons per family, with married-couple families (1,324 | 82.3%) accounting for the largest median family size of 3.12 persons per family. On the other hand, single male/father families (69 | 4.3%) represent the smallest median family size with 2.19 persons per family.
| Family Type | # Families | Family Size |
| Married-Couple | 1,324 (82.3%) | 3.12 |
| Single Male/Father | 69 (4.3%) | 2.19 |
| Single Female/Mother | 216 (13.4%) | 2.73 |
| Total Families | 1,609 (100.0%) | 3.02 |
Median Household Size in Rossford
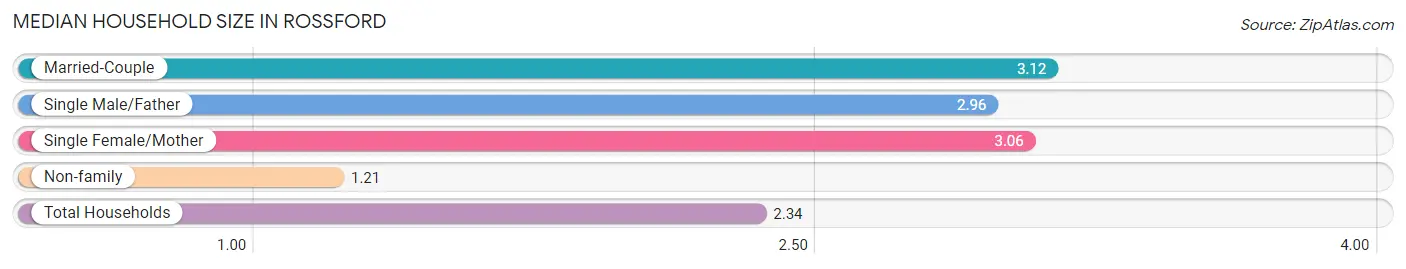
The median household size in Rossford is 2.34 persons per household, with married-couple households (1,324 | 49.1%) accounting for the largest median household size of 3.12 persons per household. non-family households (1,088 | 40.3%) represent the smallest median household size with 1.21 persons per household.
| Household Type | # Households | Household Size |
| Married-Couple | 1,324 (49.1%) | 3.12 |
| Single Male/Father | 69 (2.6%) | 2.96 |
| Single Female/Mother | 216 (8.0%) | 3.06 |
| Non-family | 1,088 (40.3%) | 1.21 |
| Total Households | 2,697 (100.0%) | 2.34 |
Household Size by Marriage Status in Rossford
Out of a total of 2,697 households in Rossford, 1,609 (59.7%) are family households, while 1,088 (40.3%) are nonfamily households. The most numerous type of family households are 2-person households, comprising 697, and the most common type of nonfamily households are 1-person households, comprising 869.
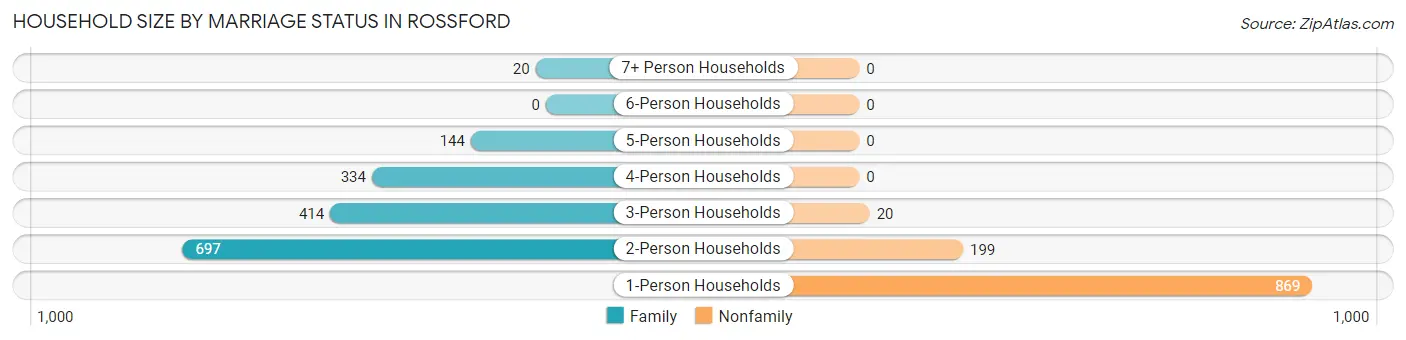
| Household Size | Family Households | Nonfamily Households |
| 1-Person Households | - | 869 (32.2%) |
| 2-Person Households | 697 (25.8%) | 199 (7.4%) |
| 3-Person Households | 414 (15.3%) | 20 (0.7%) |
| 4-Person Households | 334 (12.4%) | 0 (0.0%) |
| 5-Person Households | 144 (5.3%) | 0 (0.0%) |
| 6-Person Households | 0 (0.0%) | 0 (0.0%) |
| 7+ Person Households | 20 (0.7%) | 0 (0.0%) |
| Total | 1,609 (59.7%) | 1,088 (40.3%) |
Female Fertility in Rossford
Fertility by Age in Rossford
Average fertility rate in Rossford is 69.0 births per 1,000 women. Women in the age bracket of 35 to 50 years have the highest fertility rate with 95.0 births per 1,000 women. Women in the age bracket of 35 to 50 years acount for 66.3% of all women with births.
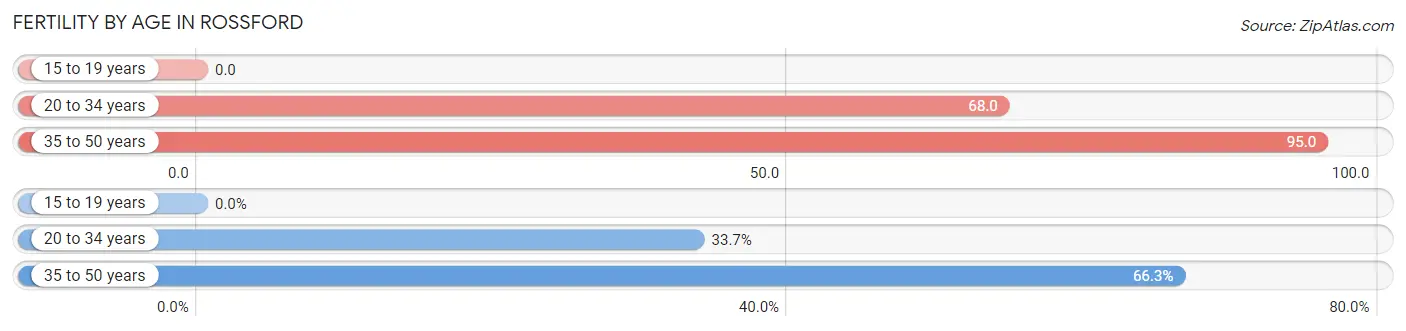
| Age Bracket | Women with Births | Births / 1,000 Women |
| 15 to 19 years | 0 (0.0%) | 0.0 |
| 20 to 34 years | 31 (33.7%) | 68.0 |
| 35 to 50 years | 61 (66.3%) | 95.0 |
| Total | 92 (100.0%) | 69.0 |
Fertility by Age by Marriage Status in Rossford
81.5% of women with births (92) in Rossford are married. The highest percentage of unmarried women with births falls into 20 to 34 years age bracket with 54.8% of them unmarried at the time of birth, while the lowest percentage of unmarried women with births belong to 35 to 50 years age bracket with 0.0% of them unmarried.
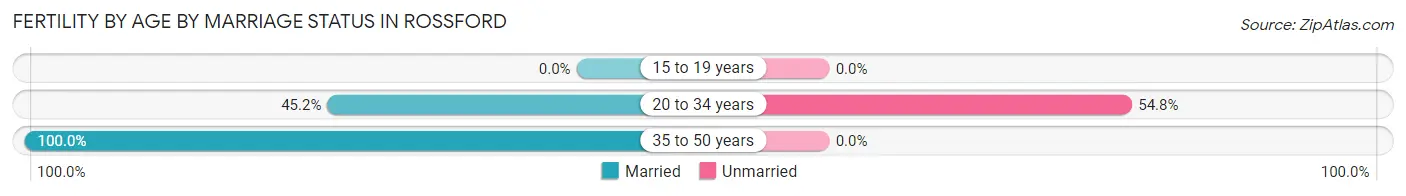
| Age Bracket | Married | Unmarried |
| 15 to 19 years | 0 (0.0%) | 0 (0.0%) |
| 20 to 34 years | 14 (45.2%) | 17 (54.8%) |
| 35 to 50 years | 61 (100.0%) | 0 (0.0%) |
| Total | 75 (81.5%) | 17 (18.5%) |
Fertility by Education in Rossford
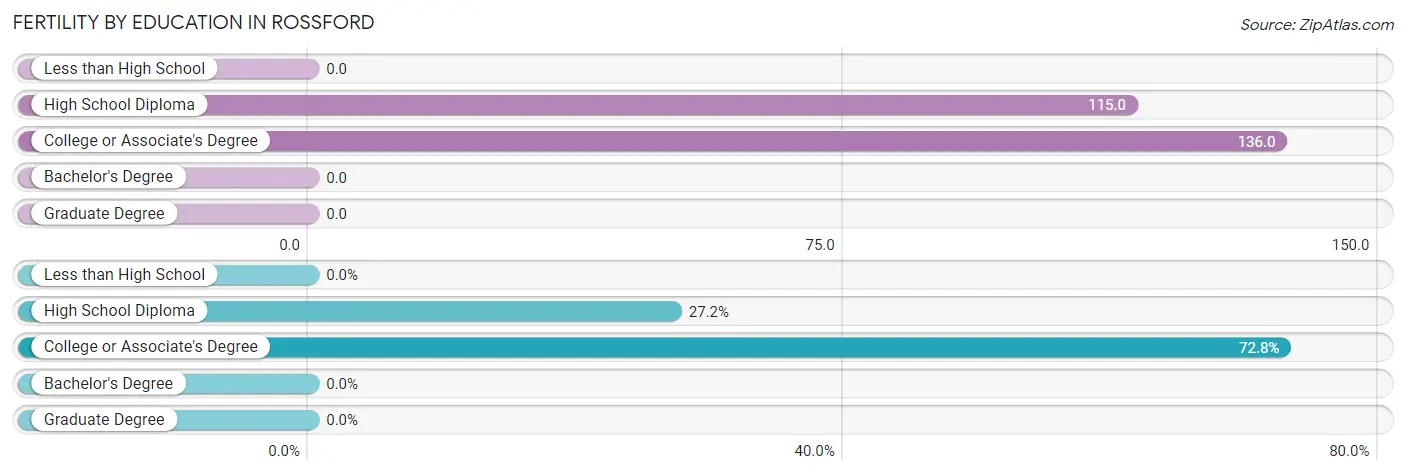
| Educational Attainment | Women with Births | Births / 1,000 Women |
| Less than High School | 0 (0.0%) | 0.0 |
| High School Diploma | 25 (27.2%) | 115.0 |
| College or Associate's Degree | 67 (72.8%) | 136.0 |
| Bachelor's Degree | 0 (0.0%) | 0.0 |
| Graduate Degree | 0 (0.0%) | 0.0 |
| Total | 92 (100.0%) | 69.0 |
Fertility by Education by Marriage Status in Rossford
18.5% of women with births in Rossford are unmarried. Women with the educational attainment of college or associate's degree are most likely to be married with 91.0% of them married at childbirth, while women with the educational attainment of high school diploma are least likely to be married with 44.0% of them unmarried at childbirth.
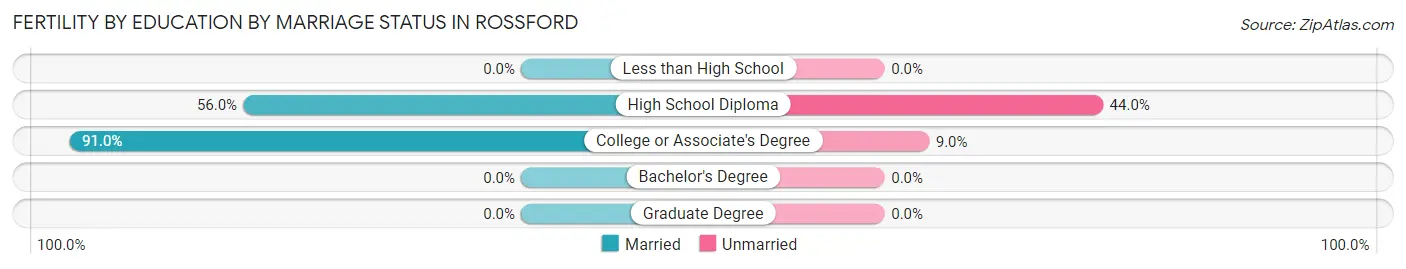
| Educational Attainment | Married | Unmarried |
| Less than High School | 0 (0.0%) | 0 (0.0%) |
| High School Diploma | 14 (56.0%) | 11 (44.0%) |
| College or Associate's Degree | 61 (91.0%) | 6 (9.0%) |
| Bachelor's Degree | 0 (0.0%) | 0 (0.0%) |
| Graduate Degree | 0 (0.0%) | 0 (0.0%) |
| Total | 75 (81.5%) | 17 (18.5%) |
Employment Characteristics in Rossford
Employment by Class of Employer in Rossford
Among the 3,525 employed individuals in Rossford, private company employees (2,626 | 74.5%), not-for-profit organizations (328 | 9.3%), and local government employees (225 | 6.4%) make up the most common classes of employment.
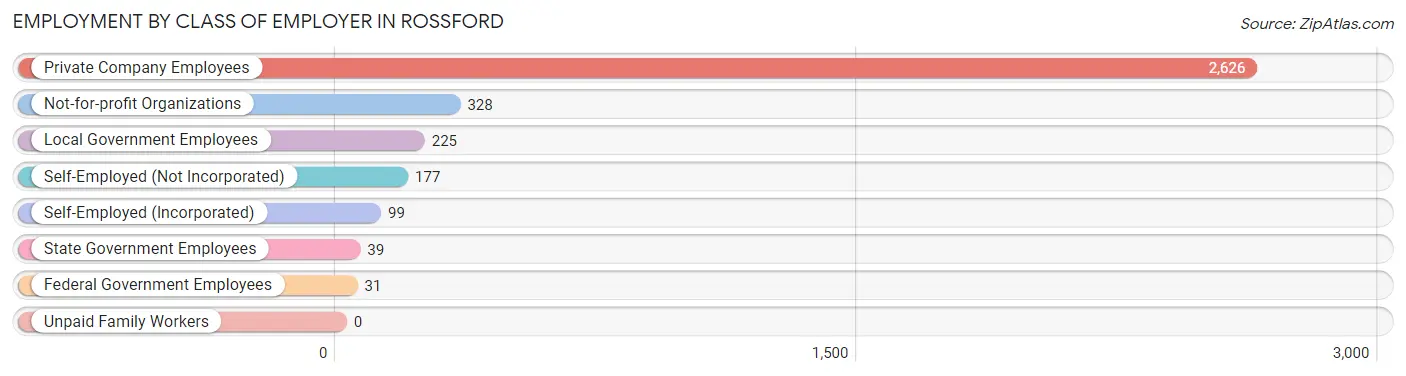
| Employer Class | # Employees | % Employees |
| Private Company Employees | 2,626 | 74.5% |
| Self-Employed (Incorporated) | 99 | 2.8% |
| Self-Employed (Not Incorporated) | 177 | 5.0% |
| Not-for-profit Organizations | 328 | 9.3% |
| Local Government Employees | 225 | 6.4% |
| State Government Employees | 39 | 1.1% |
| Federal Government Employees | 31 | 0.9% |
| Unpaid Family Workers | 0 | 0.0% |
| Total | 3,525 | 100.0% |
Employment Status by Age in Rossford
According to the labor force statistics for Rossford, out of the total population over 16 years of age (5,308), 71.0% or 3,769 individuals are in the labor force, with 4.8% or 181 of them unemployed. The age group with the highest labor force participation rate is 45 to 54 years, with 99.3% or 664 individuals in the labor force. Within the labor force, the 16 to 19 years age range has the highest percentage of unemployed individuals, with 19.2% or 55 of them being unemployed.
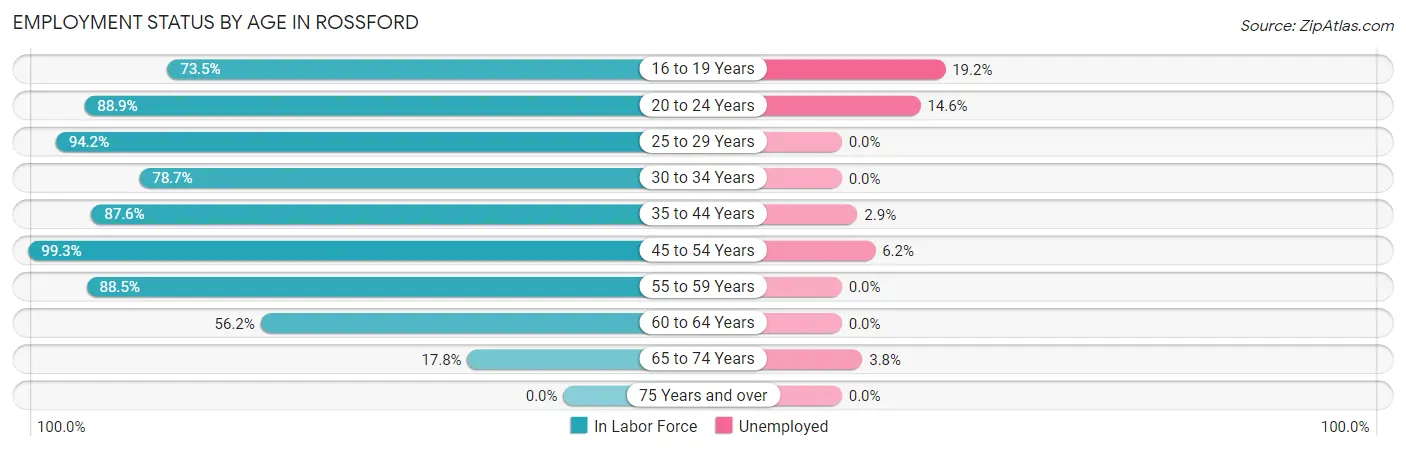
| Age Bracket | In Labor Force | Unemployed |
| 16 to 19 Years | 286 (73.5%) | 55 (19.2%) |
| 20 to 24 Years | 383 (88.9%) | 56 (14.6%) |
| 25 to 29 Years | 519 (94.2%) | 0 (0.0%) |
| 30 to 34 Years | 269 (78.7%) | 0 (0.0%) |
| 35 to 44 Years | 820 (87.6%) | 24 (2.9%) |
| 45 to 54 Years | 664 (99.3%) | 41 (6.2%) |
| 55 to 59 Years | 440 (88.5%) | 0 (0.0%) |
| 60 to 64 Years | 285 (56.2%) | 0 (0.0%) |
| 65 to 74 Years | 105 (17.8%) | 4 (3.8%) |
| 75 Years and over | 0 (0.0%) | 0 (0.0%) |
| Total | 3,769 (71.0%) | 181 (4.8%) |
Employment Status by Educational Attainment in Rossford
According to labor force statistics for Rossford, 85.6% of individuals (2,998) out of the total population between 25 and 64 years of age (3,502) are in the labor force, with 2.2% or 66 of them being unemployed. The group with the highest labor force participation rate are those with the educational attainment of bachelor's degree or higher, with 92.0% or 1,039 individuals in the labor force. Within the labor force, individuals with high school diploma education have the highest percentage of unemployment, with 3.5% or 21 of them being unemployed.
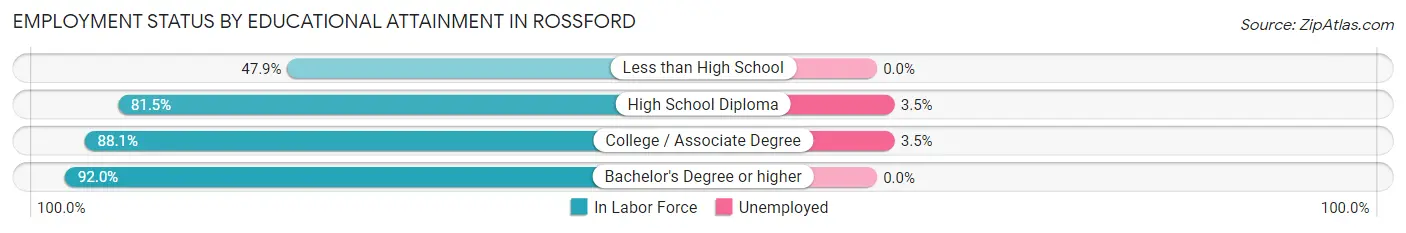
| Educational Attainment | In Labor Force | Unemployed |
| Less than High School | 101 (47.9%) | 0 (0.0%) |
| High School Diploma | 601 (81.5%) | 26 (3.5%) |
| College / Associate Degree | 1,255 (88.1%) | 50 (3.5%) |
| Bachelor's Degree or higher | 1,039 (92.0%) | 0 (0.0%) |
| Total | 2,998 (85.6%) | 77 (2.2%) |
Employment Occupations by Sex in Rossford
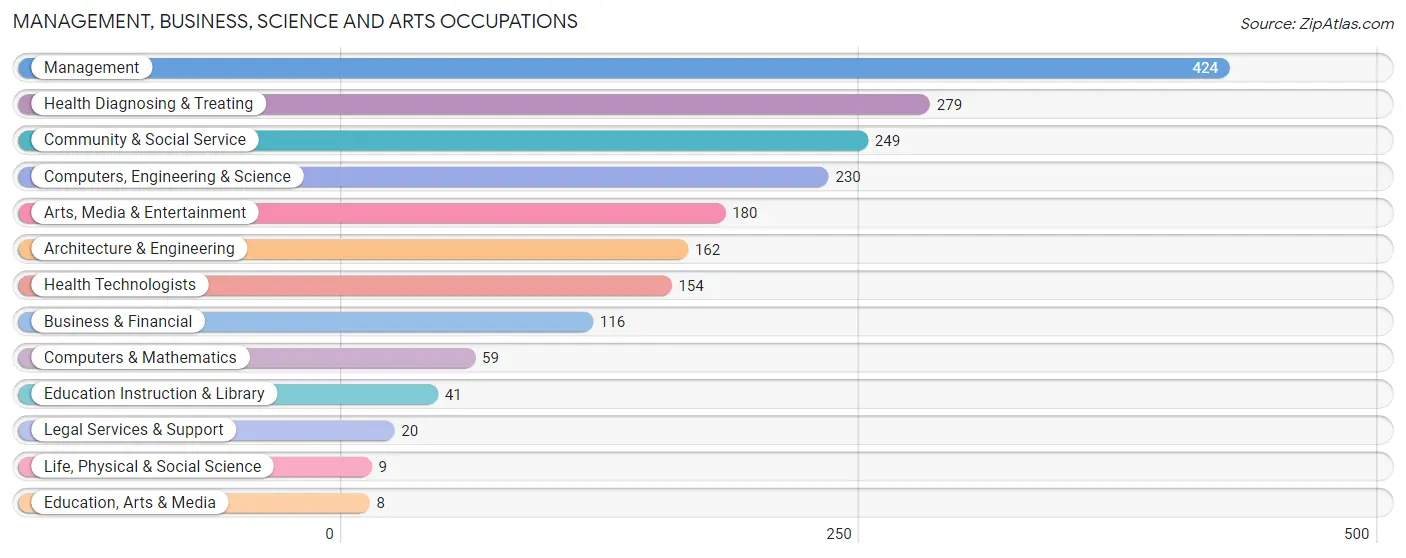
Management, Business, Science and Arts Occupations
The most common Management, Business, Science and Arts occupations in Rossford are Management (424 | 11.8%), Health Diagnosing & Treating (279 | 7.8%), Community & Social Service (249 | 6.9%), Computers, Engineering & Science (230 | 6.4%), and Arts, Media & Entertainment (180 | 5.0%).
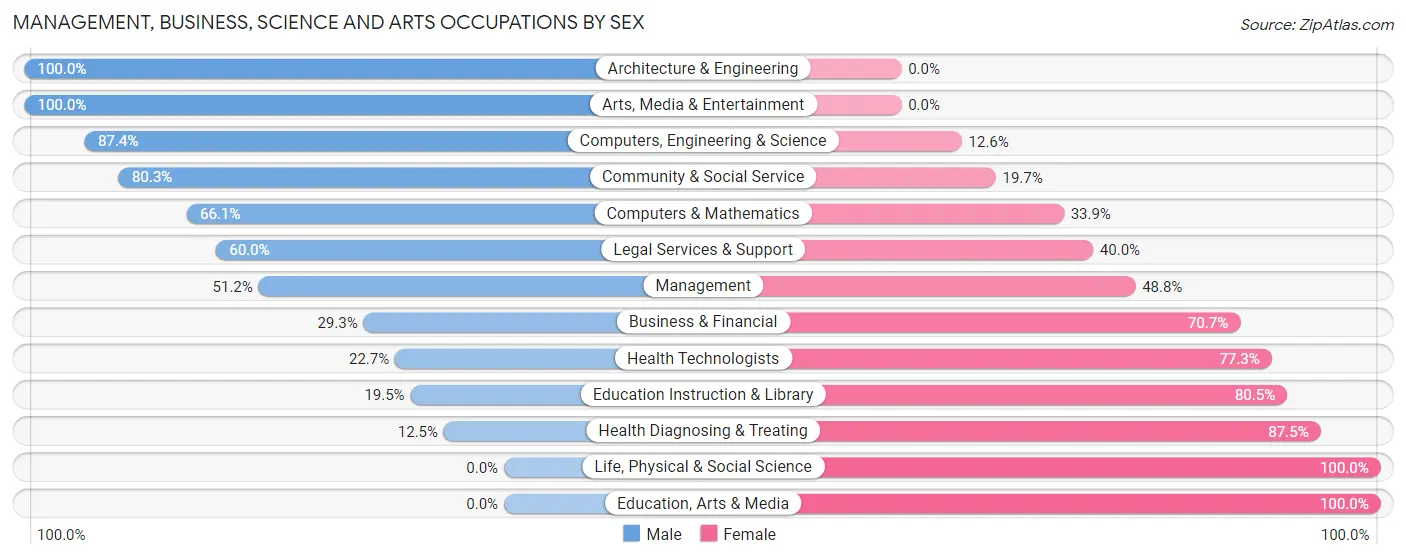
Management, Business, Science and Arts Occupations by Sex
Within the Management, Business, Science and Arts occupations in Rossford, the most male-oriented occupations are Architecture & Engineering (100.0%), Arts, Media & Entertainment (100.0%), and Computers, Engineering & Science (87.4%), while the most female-oriented occupations are Life, Physical & Social Science (100.0%), Education, Arts & Media (100.0%), and Health Diagnosing & Treating (87.5%).
| Occupation | Male | Female |
| Management | 217 (51.2%) | 207 (48.8%) |
| Business & Financial | 34 (29.3%) | 82 (70.7%) |
| Computers, Engineering & Science | 201 (87.4%) | 29 (12.6%) |
| Computers & Mathematics | 39 (66.1%) | 20 (33.9%) |
| Architecture & Engineering | 162 (100.0%) | 0 (0.0%) |
| Life, Physical & Social Science | 0 (0.0%) | 9 (100.0%) |
| Community & Social Service | 200 (80.3%) | 49 (19.7%) |
| Education, Arts & Media | 0 (0.0%) | 8 (100.0%) |
| Legal Services & Support | 12 (60.0%) | 8 (40.0%) |
| Education Instruction & Library | 8 (19.5%) | 33 (80.5%) |
| Arts, Media & Entertainment | 180 (100.0%) | 0 (0.0%) |
| Health Diagnosing & Treating | 35 (12.5%) | 244 (87.5%) |
| Health Technologists | 35 (22.7%) | 119 (77.3%) |
| Total (Category) | 687 (52.9%) | 611 (47.1%) |
| Total (Overall) | 2,190 (61.0%) | 1,401 (39.0%) |
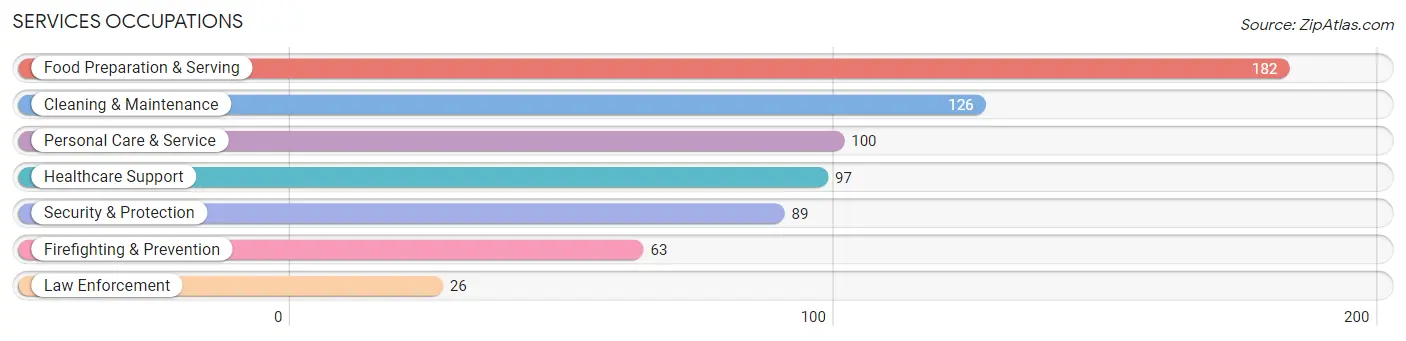
Services Occupations
The most common Services occupations in Rossford are Food Preparation & Serving (182 | 5.1%), Cleaning & Maintenance (126 | 3.5%), Personal Care & Service (100 | 2.8%), Healthcare Support (97 | 2.7%), and Security & Protection (89 | 2.5%).
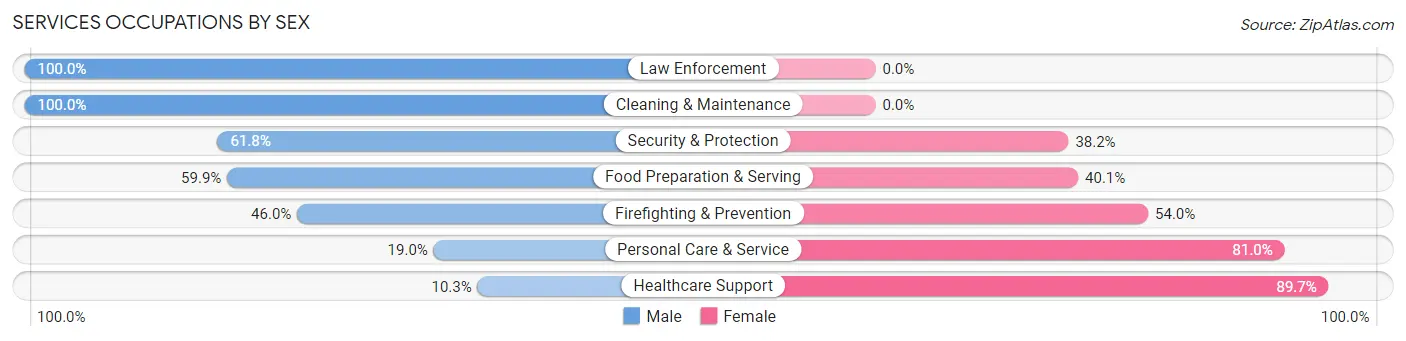
Services Occupations by Sex
Within the Services occupations in Rossford, the most male-oriented occupations are Law Enforcement (100.0%), Cleaning & Maintenance (100.0%), and Security & Protection (61.8%), while the most female-oriented occupations are Healthcare Support (89.7%), Personal Care & Service (81.0%), and Firefighting & Prevention (54.0%).
| Occupation | Male | Female |
| Healthcare Support | 10 (10.3%) | 87 (89.7%) |
| Security & Protection | 55 (61.8%) | 34 (38.2%) |
| Firefighting & Prevention | 29 (46.0%) | 34 (54.0%) |
| Law Enforcement | 26 (100.0%) | 0 (0.0%) |
| Food Preparation & Serving | 109 (59.9%) | 73 (40.1%) |
| Cleaning & Maintenance | 126 (100.0%) | 0 (0.0%) |
| Personal Care & Service | 19 (19.0%) | 81 (81.0%) |
| Total (Category) | 319 (53.7%) | 275 (46.3%) |
| Total (Overall) | 2,190 (61.0%) | 1,401 (39.0%) |
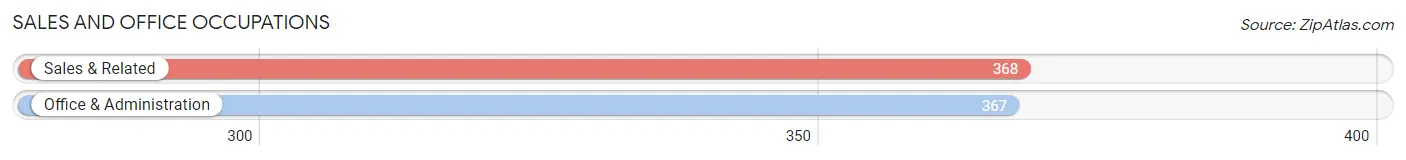
Sales and Office Occupations
The most common Sales and Office occupations in Rossford are Sales & Related (368 | 10.2%), and Office & Administration (367 | 10.2%).
Sales and Office Occupations by Sex
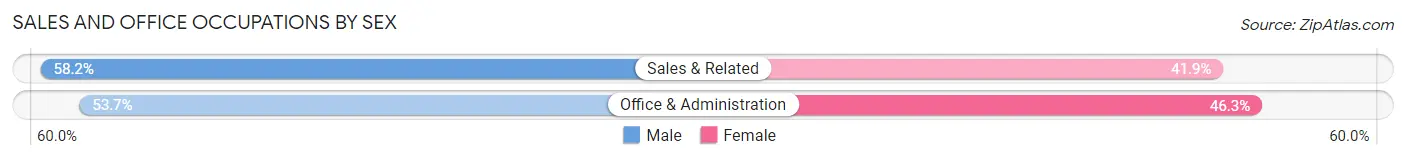
| Occupation | Male | Female |
| Sales & Related | 214 (58.2%) | 154 (41.8%) |
| Office & Administration | 197 (53.7%) | 170 (46.3%) |
| Total (Category) | 411 (55.9%) | 324 (44.1%) |
| Total (Overall) | 2,190 (61.0%) | 1,401 (39.0%) |
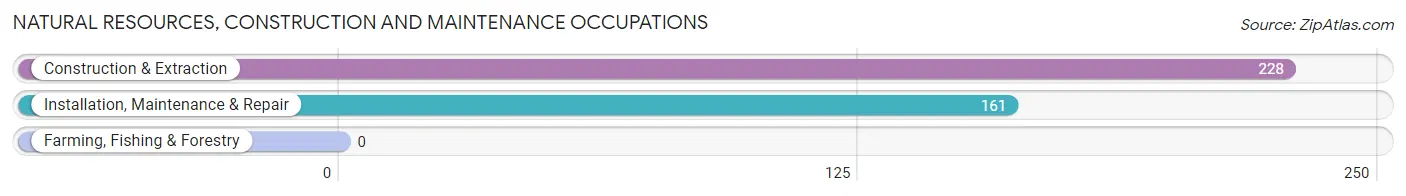
Natural Resources, Construction and Maintenance Occupations
The most common Natural Resources, Construction and Maintenance occupations in Rossford are Construction & Extraction (228 | 6.4%), and Installation, Maintenance & Repair (161 | 4.5%).
Natural Resources, Construction and Maintenance Occupations by Sex
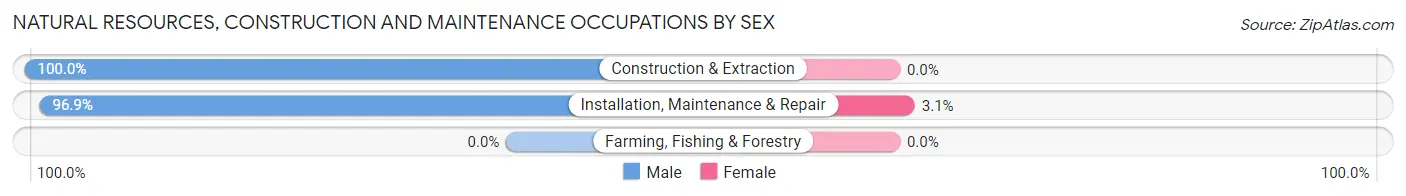
| Occupation | Male | Female |
| Farming, Fishing & Forestry | 0 (0.0%) | 0 (0.0%) |
| Construction & Extraction | 228 (100.0%) | 0 (0.0%) |
| Installation, Maintenance & Repair | 156 (96.9%) | 5 (3.1%) |
| Total (Category) | 384 (98.7%) | 5 (1.3%) |
| Total (Overall) | 2,190 (61.0%) | 1,401 (39.0%) |
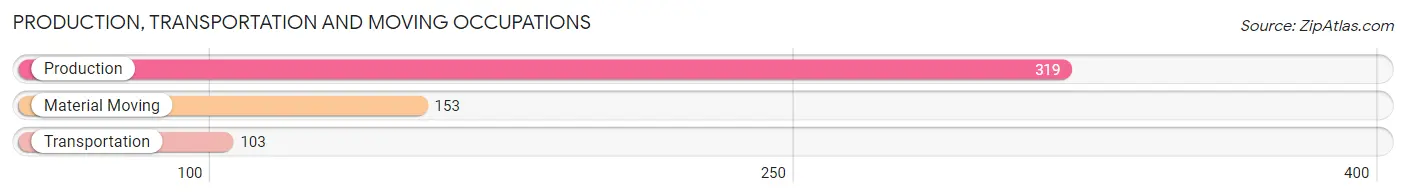
Production, Transportation and Moving Occupations
The most common Production, Transportation and Moving occupations in Rossford are Production (319 | 8.9%), Material Moving (153 | 4.3%), and Transportation (103 | 2.9%).
Production, Transportation and Moving Occupations by Sex
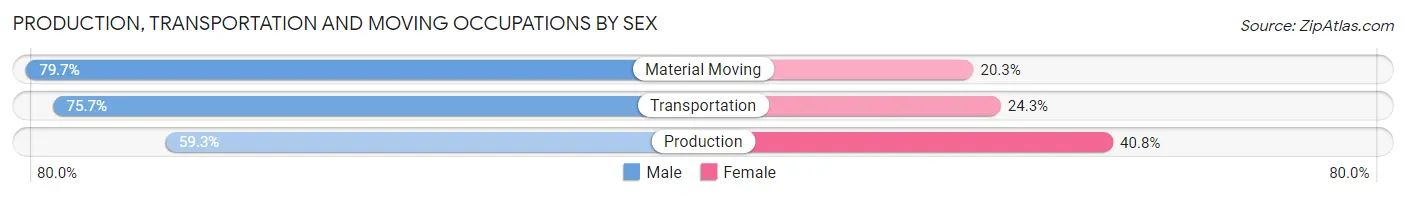
| Occupation | Male | Female |
| Production | 189 (59.3%) | 130 (40.7%) |
| Transportation | 78 (75.7%) | 25 (24.3%) |
| Material Moving | 122 (79.7%) | 31 (20.3%) |
| Total (Category) | 389 (67.6%) | 186 (32.4%) |
| Total (Overall) | 2,190 (61.0%) | 1,401 (39.0%) |
Employment Industries by Sex in Rossford
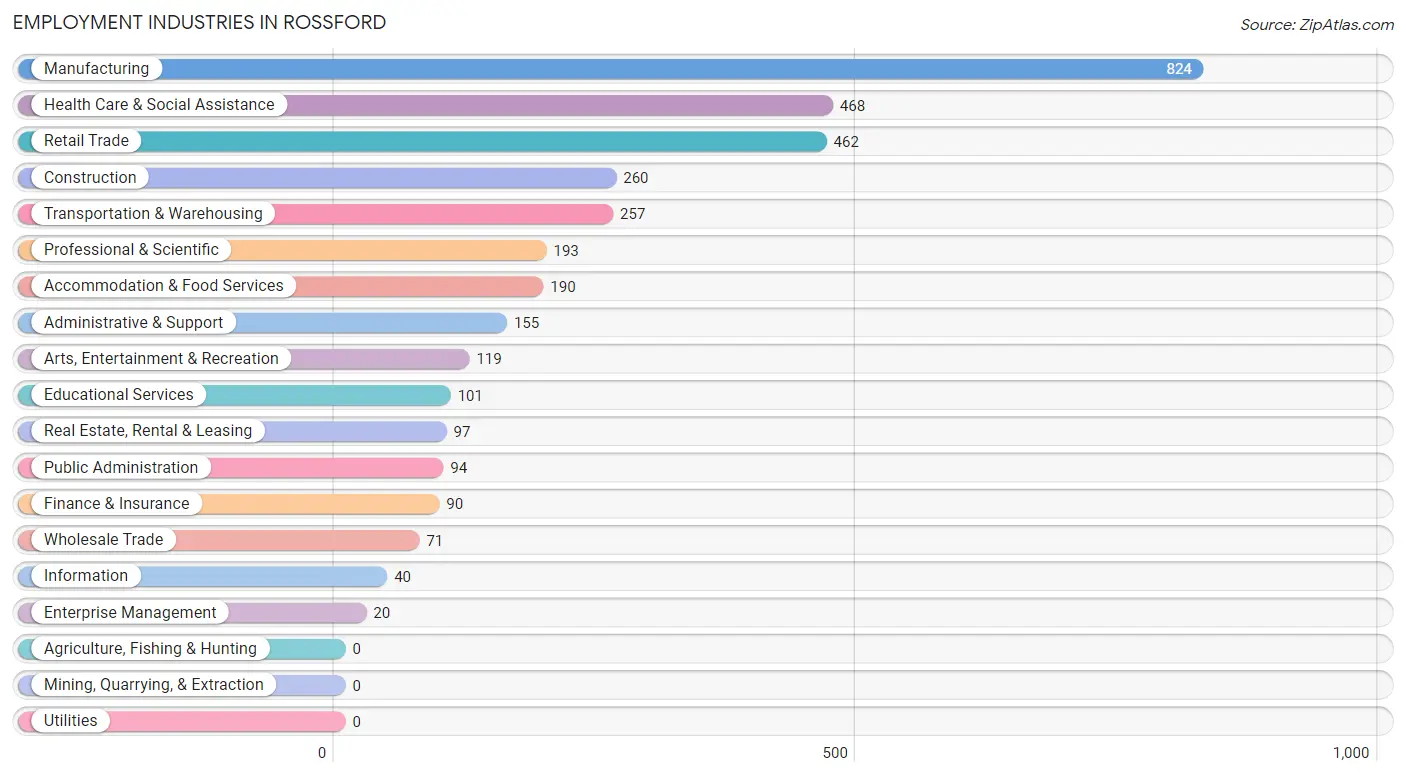
Employment Industries in Rossford
The major employment industries in Rossford include Manufacturing (824 | 23.0%), Health Care & Social Assistance (468 | 13.0%), Retail Trade (462 | 12.9%), Construction (260 | 7.2%), and Transportation & Warehousing (257 | 7.2%).
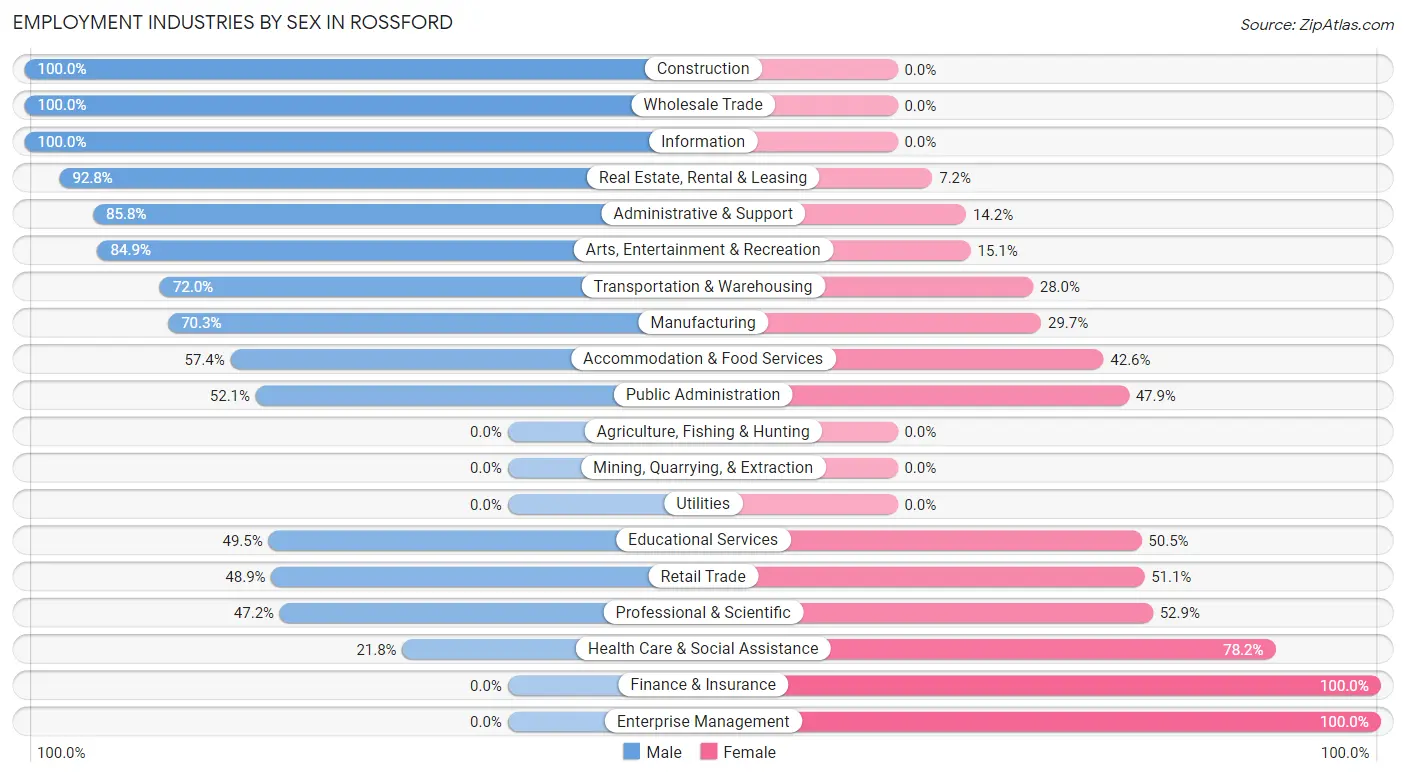
Employment Industries by Sex in Rossford
The Rossford industries that see more men than women are Construction (100.0%), Wholesale Trade (100.0%), and Information (100.0%), whereas the industries that tend to have a higher number of women are Finance & Insurance (100.0%), Enterprise Management (100.0%), and Health Care & Social Assistance (78.2%).
| Industry | Male | Female |
| Agriculture, Fishing & Hunting | 0 (0.0%) | 0 (0.0%) |
| Mining, Quarrying, & Extraction | 0 (0.0%) | 0 (0.0%) |
| Construction | 260 (100.0%) | 0 (0.0%) |
| Manufacturing | 579 (70.3%) | 245 (29.7%) |
| Wholesale Trade | 71 (100.0%) | 0 (0.0%) |
| Retail Trade | 226 (48.9%) | 236 (51.1%) |
| Transportation & Warehousing | 185 (72.0%) | 72 (28.0%) |
| Utilities | 0 (0.0%) | 0 (0.0%) |
| Information | 40 (100.0%) | 0 (0.0%) |
| Finance & Insurance | 0 (0.0%) | 90 (100.0%) |
| Real Estate, Rental & Leasing | 90 (92.8%) | 7 (7.2%) |
| Professional & Scientific | 91 (47.1%) | 102 (52.8%) |
| Enterprise Management | 0 (0.0%) | 20 (100.0%) |
| Administrative & Support | 133 (85.8%) | 22 (14.2%) |
| Educational Services | 50 (49.5%) | 51 (50.5%) |
| Health Care & Social Assistance | 102 (21.8%) | 366 (78.2%) |
| Arts, Entertainment & Recreation | 101 (84.9%) | 18 (15.1%) |
| Accommodation & Food Services | 109 (57.4%) | 81 (42.6%) |
| Public Administration | 49 (52.1%) | 45 (47.9%) |
| Total | 2,190 (61.0%) | 1,401 (39.0%) |
Education in Rossford
School Enrollment in Rossford
The most common levels of schooling among the 1,383 students in Rossford are high school (415 | 30.0%), college / undergraduate (277 | 20.0%), and middle school (271 | 19.6%).
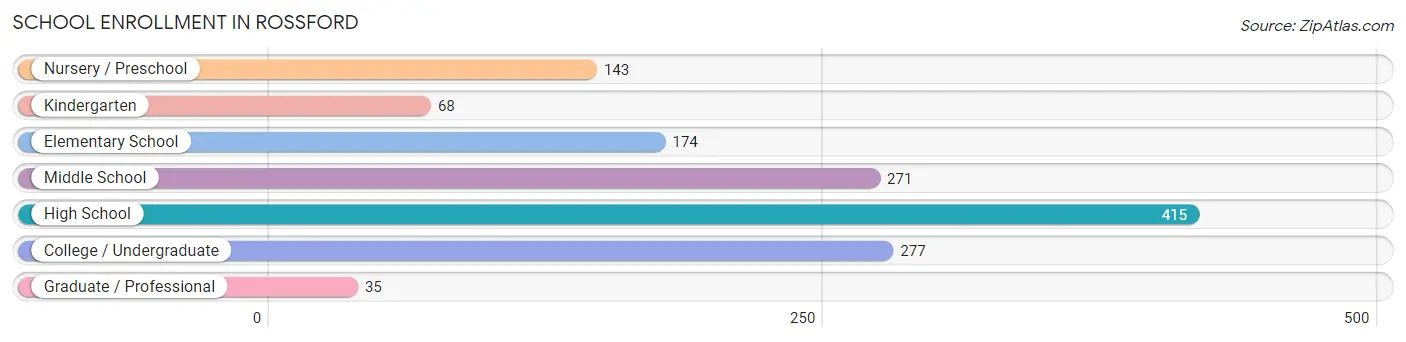
| School Level | # Students | % Students |
| Nursery / Preschool | 143 | 10.3% |
| Kindergarten | 68 | 4.9% |
| Elementary School | 174 | 12.6% |
| Middle School | 271 | 19.6% |
| High School | 415 | 30.0% |
| College / Undergraduate | 277 | 20.0% |
| Graduate / Professional | 35 | 2.5% |
| Total | 1,383 | 100.0% |
School Enrollment by Age by Funding Source in Rossford
Out of a total of 1,383 students who are enrolled in schools in Rossford, 199 (14.4%) attend a private institution, while the remaining 1,184 (85.6%) are enrolled in public schools. The age group of 35 years and over has the highest likelihood of being enrolled in private schools, with 20 (80.0% in the age bracket) enrolled. Conversely, the age group of 20 to 24 year olds has the lowest likelihood of being enrolled in a private school, with 113 (100.0% in the age bracket) attending a public institution.
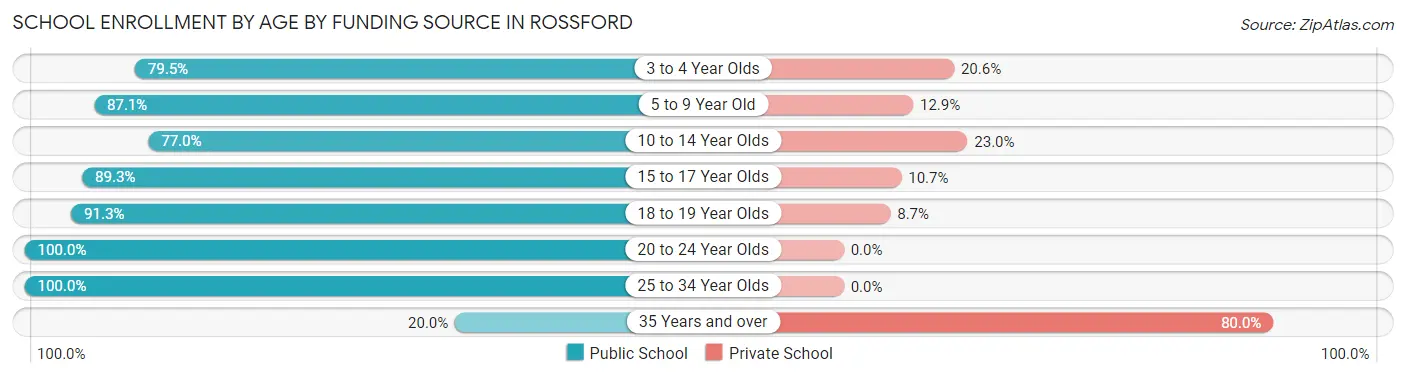
| Age Bracket | Public School | Private School |
| 3 to 4 Year Olds | 58 (79.4%) | 15 (20.5%) |
| 5 to 9 Year Old | 236 (87.1%) | 35 (12.9%) |
| 10 to 14 Year Olds | 294 (77.0%) | 88 (23.0%) |
| 15 to 17 Year Olds | 183 (89.3%) | 22 (10.7%) |
| 18 to 19 Year Olds | 200 (91.3%) | 19 (8.7%) |
| 20 to 24 Year Olds | 113 (100.0%) | 0 (0.0%) |
| 25 to 34 Year Olds | 95 (100.0%) | 0 (0.0%) |
| 35 Years and over | 5 (20.0%) | 20 (80.0%) |
| Total | 1,184 (85.6%) | 199 (14.4%) |
Educational Attainment by Field of Study in Rossford
Business (446 | 30.9%), education (205 | 14.2%), science & technology (175 | 12.1%), engineering (134 | 9.3%), and visual & performing arts (124 | 8.6%) are the most common fields of study among 1,443 individuals in Rossford who have obtained a bachelor's degree or higher.
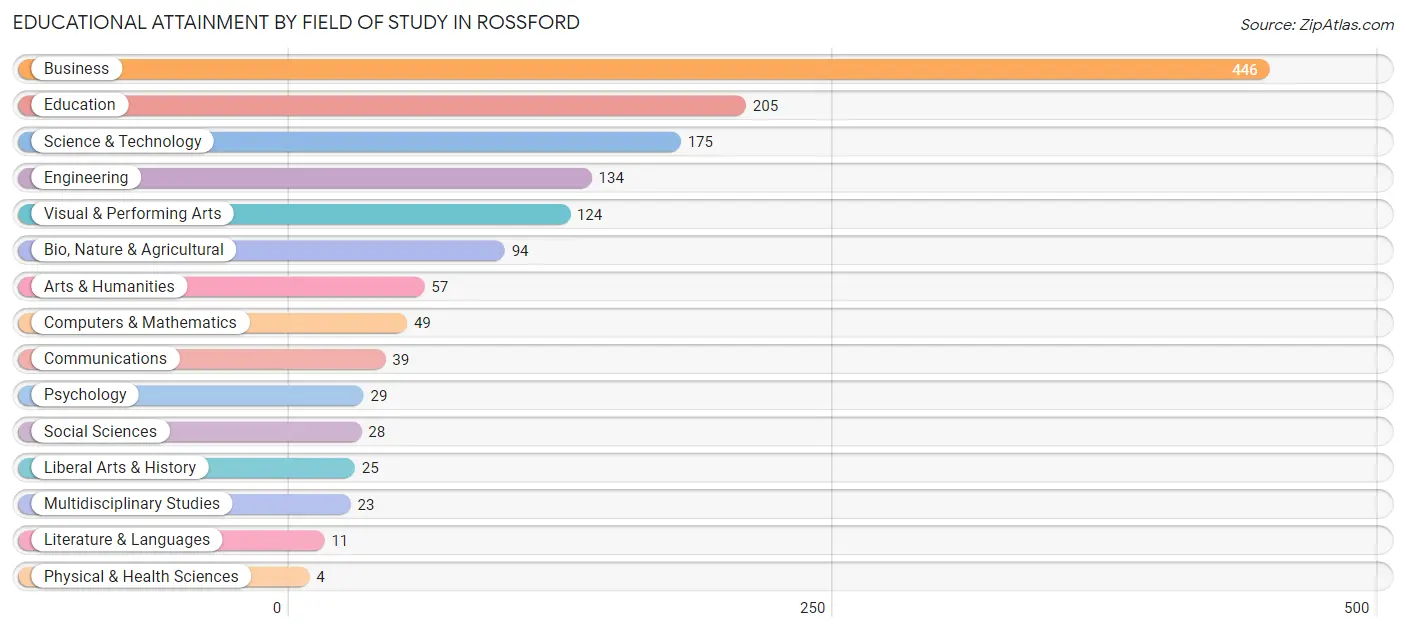
| Field of Study | # Graduates | % Graduates |
| Computers & Mathematics | 49 | 3.4% |
| Bio, Nature & Agricultural | 94 | 6.5% |
| Physical & Health Sciences | 4 | 0.3% |
| Psychology | 29 | 2.0% |
| Social Sciences | 28 | 1.9% |
| Engineering | 134 | 9.3% |
| Multidisciplinary Studies | 23 | 1.6% |
| Science & Technology | 175 | 12.1% |
| Business | 446 | 30.9% |
| Education | 205 | 14.2% |
| Literature & Languages | 11 | 0.8% |
| Liberal Arts & History | 25 | 1.7% |
| Visual & Performing Arts | 124 | 8.6% |
| Communications | 39 | 2.7% |
| Arts & Humanities | 57 | 4.0% |
| Total | 1,443 | 100.0% |
Transportation & Commute in Rossford
Vehicle Availability by Sex in Rossford
The most prevalent vehicle ownership categories in Rossford are males with 2 vehicles (962, accounting for 44.4%) and females with 2 vehicles (686, making up 70.9%).
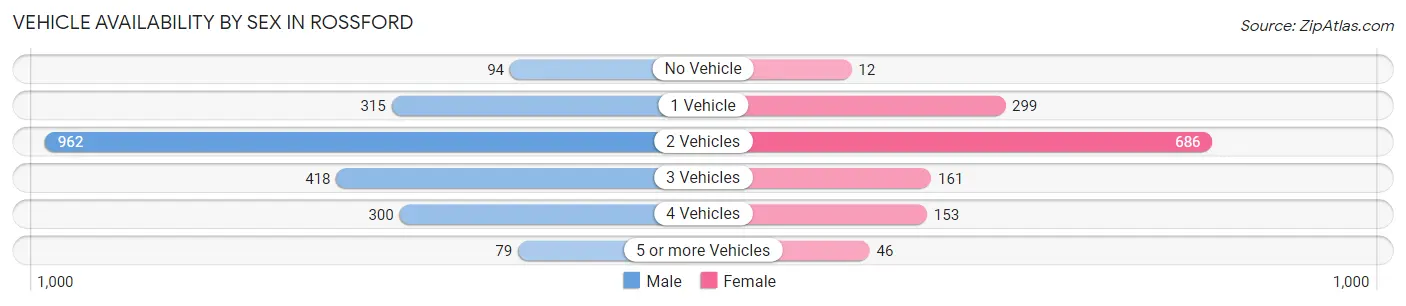
| Vehicles Available | Male | Female |
| No Vehicle | 94 (4.3%) | 12 (0.9%) |
| 1 Vehicle | 315 (14.5%) | 299 (22.0%) |
| 2 Vehicles | 962 (44.4%) | 686 (50.5%) |
| 3 Vehicles | 418 (19.3%) | 161 (11.9%) |
| 4 Vehicles | 300 (13.8%) | 153 (11.3%) |
| 5 or more Vehicles | 79 (3.6%) | 46 (3.4%) |
| Total | 2,168 (100.0%) | 1,357 (100.0%) |
Commute Time in Rossford
The most frequently occuring commute durations in Rossford are 15 to 19 minutes (874 commuters, 25.6%), 20 to 24 minutes (763 commuters, 22.4%), and 10 to 14 minutes (532 commuters, 15.6%).
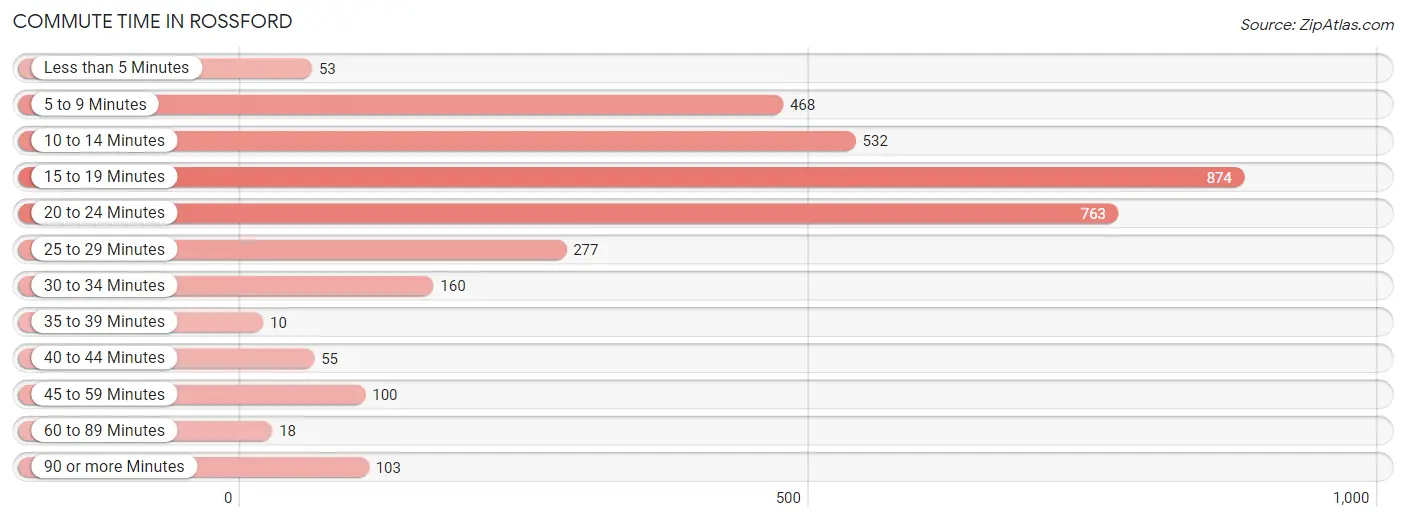
| Commute Time | # Commuters | % Commuters |
| Less than 5 Minutes | 53 | 1.5% |
| 5 to 9 Minutes | 468 | 13.7% |
| 10 to 14 Minutes | 532 | 15.6% |
| 15 to 19 Minutes | 874 | 25.6% |
| 20 to 24 Minutes | 763 | 22.4% |
| 25 to 29 Minutes | 277 | 8.1% |
| 30 to 34 Minutes | 160 | 4.7% |
| 35 to 39 Minutes | 10 | 0.3% |
| 40 to 44 Minutes | 55 | 1.6% |
| 45 to 59 Minutes | 100 | 2.9% |
| 60 to 89 Minutes | 18 | 0.5% |
| 90 or more Minutes | 103 | 3.0% |
Commute Time by Sex in Rossford
The most common commute times in Rossford are 20 to 24 minutes (475 commuters, 22.4%) for males and 15 to 19 minutes (423 commuters, 32.7%) for females.
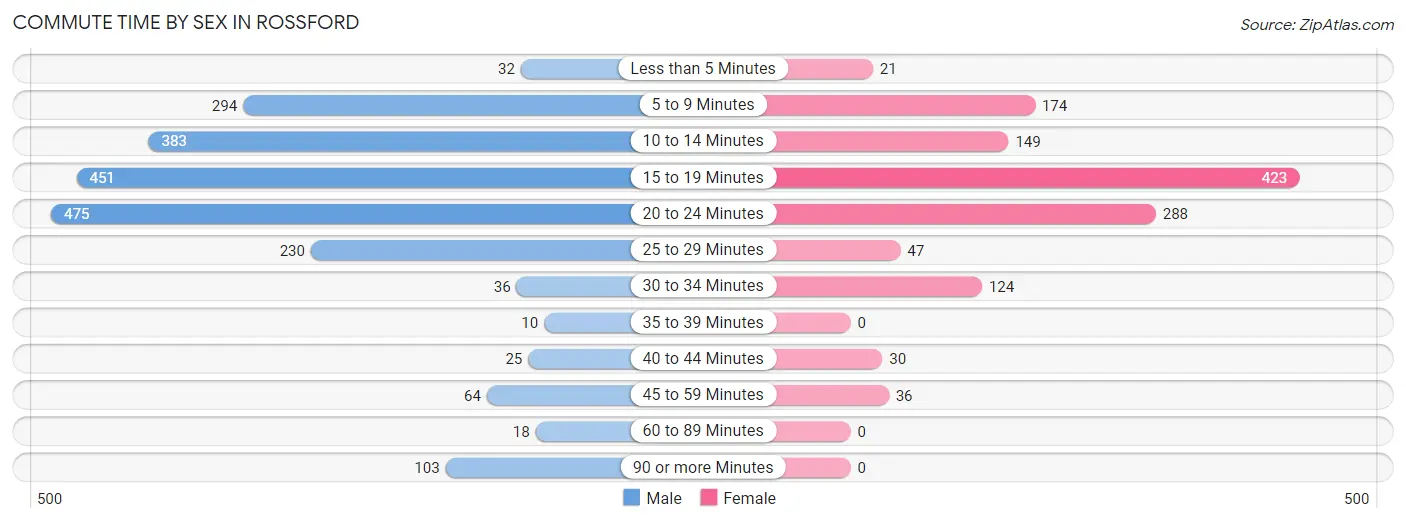
| Commute Time | Male | Female |
| Less than 5 Minutes | 32 (1.5%) | 21 (1.6%) |
| 5 to 9 Minutes | 294 (13.9%) | 174 (13.5%) |
| 10 to 14 Minutes | 383 (18.1%) | 149 (11.5%) |
| 15 to 19 Minutes | 451 (21.3%) | 423 (32.7%) |
| 20 to 24 Minutes | 475 (22.4%) | 288 (22.3%) |
| 25 to 29 Minutes | 230 (10.8%) | 47 (3.6%) |
| 30 to 34 Minutes | 36 (1.7%) | 124 (9.6%) |
| 35 to 39 Minutes | 10 (0.5%) | 0 (0.0%) |
| 40 to 44 Minutes | 25 (1.2%) | 30 (2.3%) |
| 45 to 59 Minutes | 64 (3.0%) | 36 (2.8%) |
| 60 to 89 Minutes | 18 (0.9%) | 0 (0.0%) |
| 90 or more Minutes | 103 (4.9%) | 0 (0.0%) |
Time of Departure to Work by Sex in Rossford
The most frequent times of departure to work in Rossford are 7:00 AM to 7:29 AM (295, 13.9%) for males and 7:30 AM to 7:59 AM (268, 20.7%) for females.
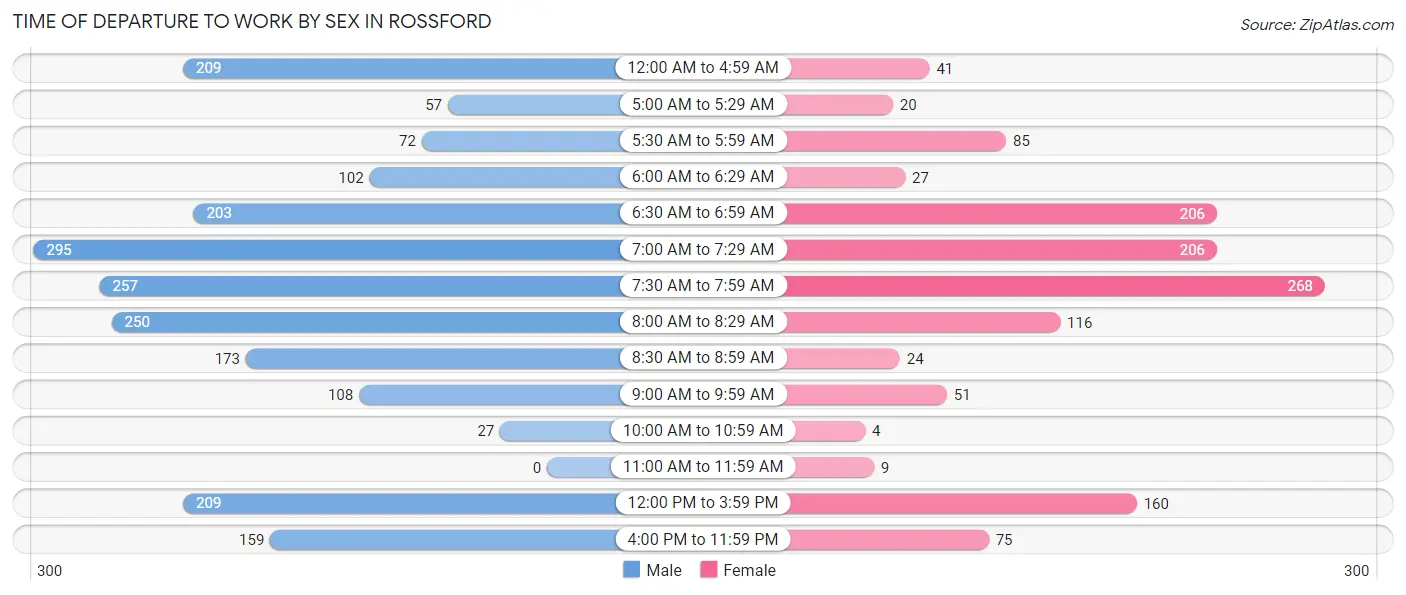
| Time of Departure | Male | Female |
| 12:00 AM to 4:59 AM | 209 (9.9%) | 41 (3.2%) |
| 5:00 AM to 5:29 AM | 57 (2.7%) | 20 (1.5%) |
| 5:30 AM to 5:59 AM | 72 (3.4%) | 85 (6.6%) |
| 6:00 AM to 6:29 AM | 102 (4.8%) | 27 (2.1%) |
| 6:30 AM to 6:59 AM | 203 (9.6%) | 206 (15.9%) |
| 7:00 AM to 7:29 AM | 295 (13.9%) | 206 (15.9%) |
| 7:30 AM to 7:59 AM | 257 (12.1%) | 268 (20.7%) |
| 8:00 AM to 8:29 AM | 250 (11.8%) | 116 (9.0%) |
| 8:30 AM to 8:59 AM | 173 (8.2%) | 24 (1.9%) |
| 9:00 AM to 9:59 AM | 108 (5.1%) | 51 (4.0%) |
| 10:00 AM to 10:59 AM | 27 (1.3%) | 4 (0.3%) |
| 11:00 AM to 11:59 AM | 0 (0.0%) | 9 (0.7%) |
| 12:00 PM to 3:59 PM | 209 (9.9%) | 160 (12.4%) |
| 4:00 PM to 11:59 PM | 159 (7.5%) | 75 (5.8%) |
| Total | 2,121 (100.0%) | 1,292 (100.0%) |
Housing Occupancy in Rossford
Occupancy by Ownership in Rossford
Of the total 2,697 dwellings in Rossford, owner-occupied units account for 1,879 (69.7%), while renter-occupied units make up 818 (30.3%).
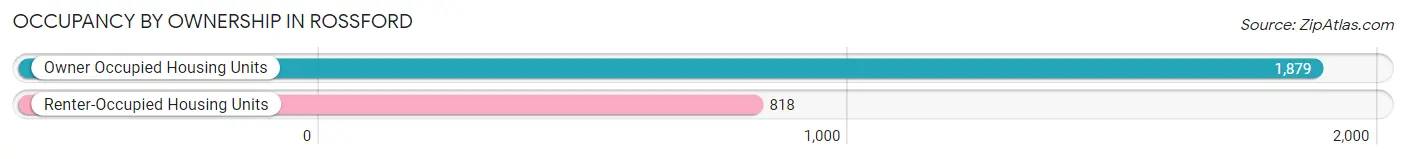
| Occupancy | # Housing Units | % Housing Units |
| Owner Occupied Housing Units | 1,879 | 69.7% |
| Renter-Occupied Housing Units | 818 | 30.3% |
| Total Occupied Housing Units | 2,697 | 100.0% |
Occupancy by Household Size in Rossford
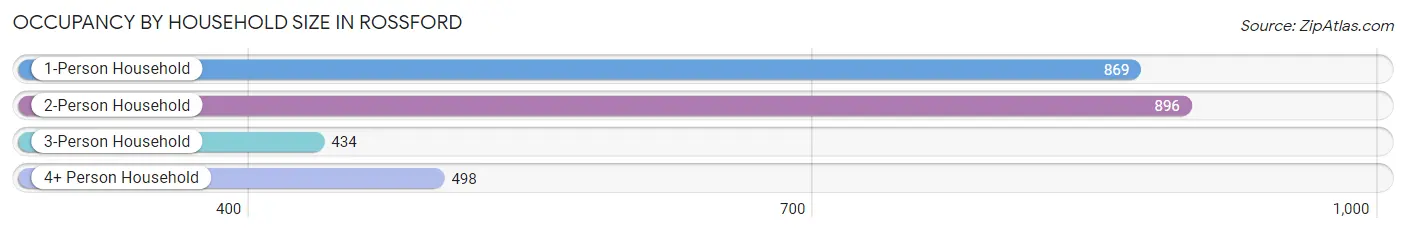
| Household Size | # Housing Units | % Housing Units |
| 1-Person Household | 869 | 32.2% |
| 2-Person Household | 896 | 33.2% |
| 3-Person Household | 434 | 16.1% |
| 4+ Person Household | 498 | 18.5% |
| Total Housing Units | 2,697 | 100.0% |
Occupancy by Ownership by Household Size in Rossford
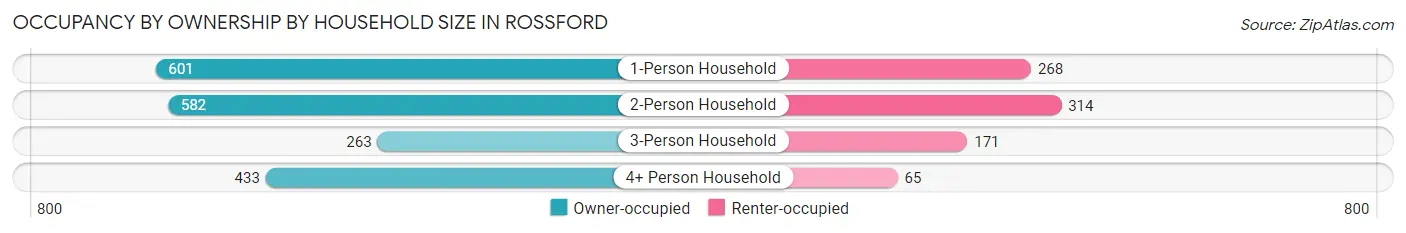
| Household Size | Owner-occupied | Renter-occupied |
| 1-Person Household | 601 (69.2%) | 268 (30.8%) |
| 2-Person Household | 582 (65.0%) | 314 (35.0%) |
| 3-Person Household | 263 (60.6%) | 171 (39.4%) |
| 4+ Person Household | 433 (87.0%) | 65 (13.1%) |
| Total Housing Units | 1,879 (69.7%) | 818 (30.3%) |
Occupancy by Educational Attainment in Rossford
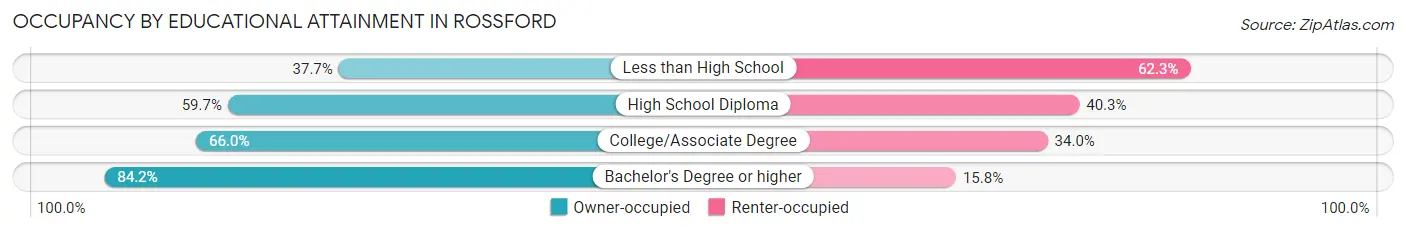
| Household Size | Owner-occupied | Renter-occupied |
| Less than High School | 40 (37.7%) | 66 (62.3%) |
| High School Diploma | 347 (59.7%) | 234 (40.3%) |
| College/Associate Degree | 726 (66.0%) | 374 (34.0%) |
| Bachelor's Degree or higher | 766 (84.2%) | 144 (15.8%) |
Occupancy by Age of Householder in Rossford
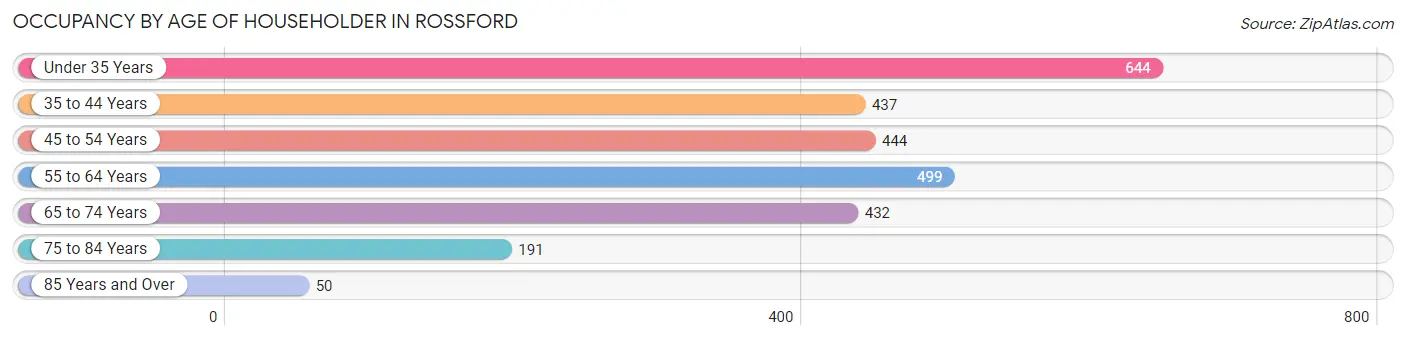
| Age Bracket | # Households | % Households |
| Under 35 Years | 644 | 23.9% |
| 35 to 44 Years | 437 | 16.2% |
| 45 to 54 Years | 444 | 16.5% |
| 55 to 64 Years | 499 | 18.5% |
| 65 to 74 Years | 432 | 16.0% |
| 75 to 84 Years | 191 | 7.1% |
| 85 Years and Over | 50 | 1.8% |
| Total | 2,697 | 100.0% |
Housing Finances in Rossford
Median Income by Occupancy in Rossford
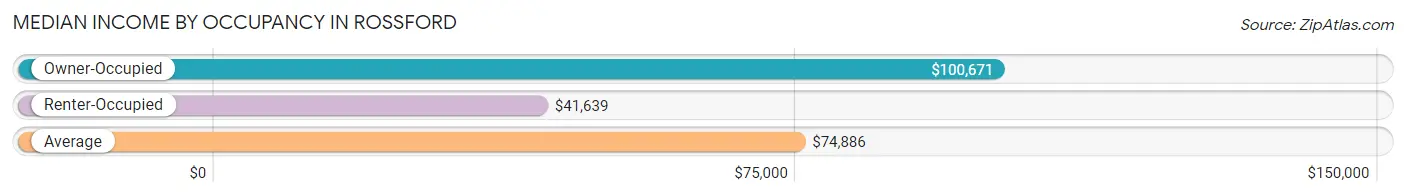
| Occupancy Type | # Households | Median Income |
| Owner-Occupied | 1,879 (69.7%) | $100,671 |
| Renter-Occupied | 818 (30.3%) | $41,639 |
| Average | 2,697 (100.0%) | $74,886 |
Occupancy by Householder Income Bracket in Rossford
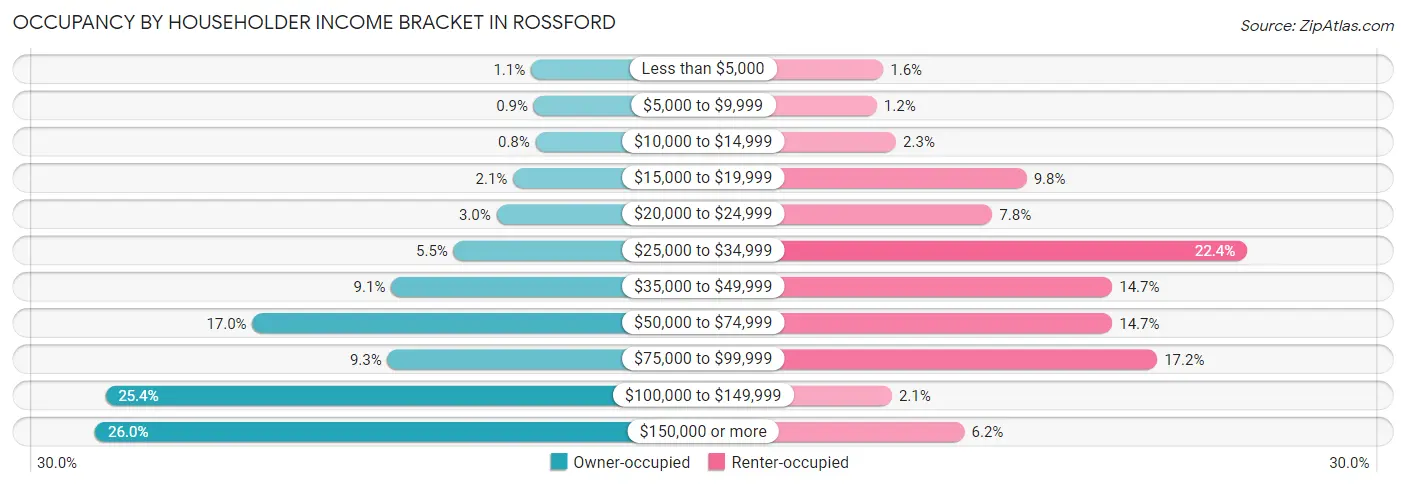
| Income Bracket | Owner-occupied | Renter-occupied |
| Less than $5,000 | 20 (1.1%) | 13 (1.6%) |
| $5,000 to $9,999 | 17 (0.9%) | 10 (1.2%) |
| $10,000 to $14,999 | 15 (0.8%) | 19 (2.3%) |
| $15,000 to $19,999 | 39 (2.1%) | 80 (9.8%) |
| $20,000 to $24,999 | 57 (3.0%) | 64 (7.8%) |
| $25,000 to $34,999 | 103 (5.5%) | 183 (22.4%) |
| $35,000 to $49,999 | 170 (9.0%) | 120 (14.7%) |
| $50,000 to $74,999 | 319 (17.0%) | 120 (14.7%) |
| $75,000 to $99,999 | 174 (9.3%) | 141 (17.2%) |
| $100,000 to $149,999 | 477 (25.4%) | 17 (2.1%) |
| $150,000 or more | 488 (26.0%) | 51 (6.2%) |
| Total | 1,879 (100.0%) | 818 (100.0%) |
Monthly Housing Cost Tiers in Rossford
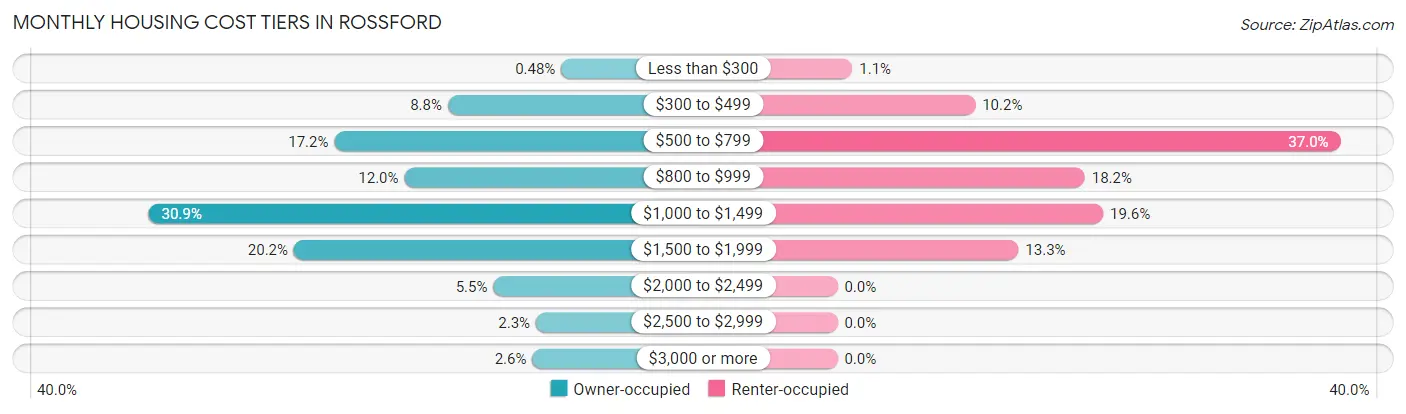
| Monthly Cost | Owner-occupied | Renter-occupied |
| Less than $300 | 9 (0.5%) | 9 (1.1%) |
| $300 to $499 | 166 (8.8%) | 83 (10.2%) |
| $500 to $799 | 323 (17.2%) | 303 (37.0%) |
| $800 to $999 | 226 (12.0%) | 149 (18.2%) |
| $1,000 to $1,499 | 580 (30.9%) | 160 (19.6%) |
| $1,500 to $1,999 | 379 (20.2%) | 109 (13.3%) |
| $2,000 to $2,499 | 103 (5.5%) | 0 (0.0%) |
| $2,500 to $2,999 | 44 (2.3%) | 0 (0.0%) |
| $3,000 or more | 49 (2.6%) | 0 (0.0%) |
| Total | 1,879 (100.0%) | 818 (100.0%) |
Physical Housing Characteristics in Rossford
Housing Structures in Rossford
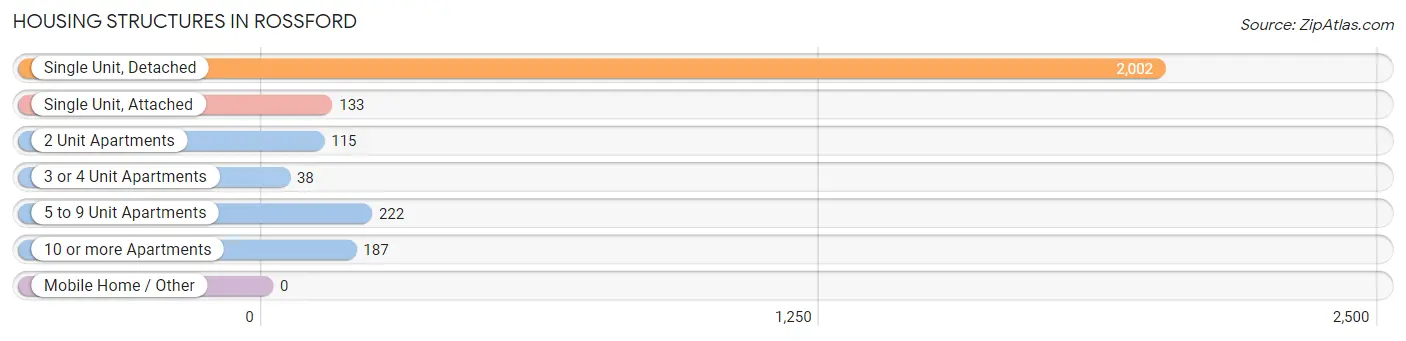
| Structure Type | # Housing Units | % Housing Units |
| Single Unit, Detached | 2,002 | 74.2% |
| Single Unit, Attached | 133 | 4.9% |
| 2 Unit Apartments | 115 | 4.3% |
| 3 or 4 Unit Apartments | 38 | 1.4% |
| 5 to 9 Unit Apartments | 222 | 8.2% |
| 10 or more Apartments | 187 | 6.9% |
| Mobile Home / Other | 0 | 0.0% |
| Total | 2,697 | 100.0% |
Housing Structures by Occupancy in Rossford
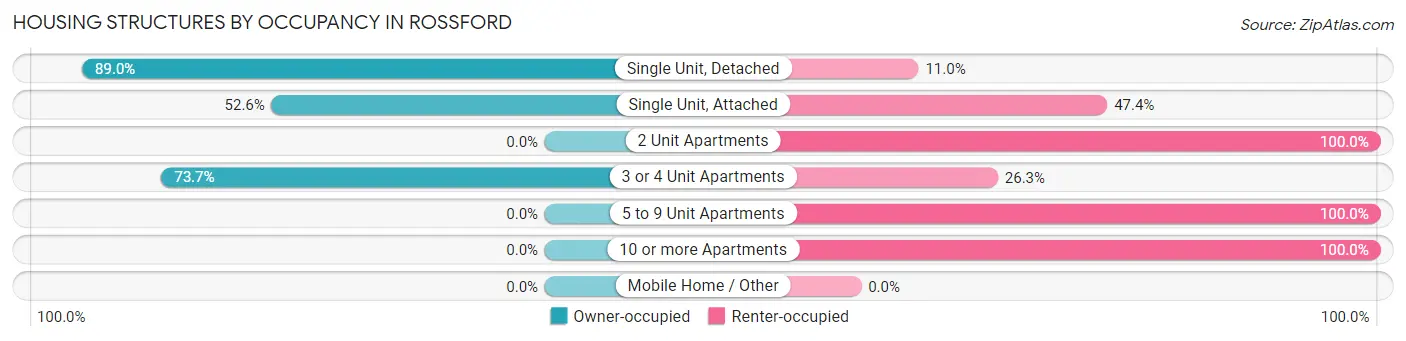
| Structure Type | Owner-occupied | Renter-occupied |
| Single Unit, Detached | 1,781 (89.0%) | 221 (11.0%) |
| Single Unit, Attached | 70 (52.6%) | 63 (47.4%) |
| 2 Unit Apartments | 0 (0.0%) | 115 (100.0%) |
| 3 or 4 Unit Apartments | 28 (73.7%) | 10 (26.3%) |
| 5 to 9 Unit Apartments | 0 (0.0%) | 222 (100.0%) |
| 10 or more Apartments | 0 (0.0%) | 187 (100.0%) |
| Mobile Home / Other | 0 (0.0%) | 0 (0.0%) |
| Total | 1,879 (69.7%) | 818 (30.3%) |
Housing Structures by Number of Rooms in Rossford
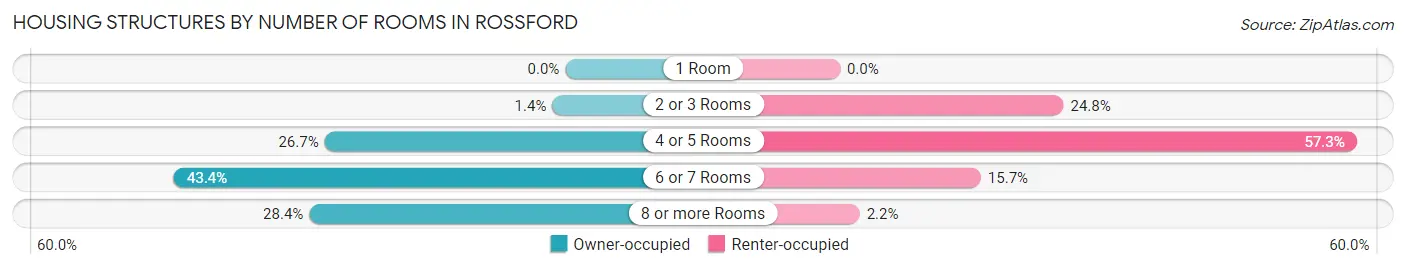
| Number of Rooms | Owner-occupied | Renter-occupied |
| 1 Room | 0 (0.0%) | 0 (0.0%) |
| 2 or 3 Rooms | 27 (1.4%) | 203 (24.8%) |
| 4 or 5 Rooms | 502 (26.7%) | 469 (57.3%) |
| 6 or 7 Rooms | 816 (43.4%) | 128 (15.7%) |
| 8 or more Rooms | 534 (28.4%) | 18 (2.2%) |
| Total | 1,879 (100.0%) | 818 (100.0%) |
Housing Structure by Heating Type in Rossford
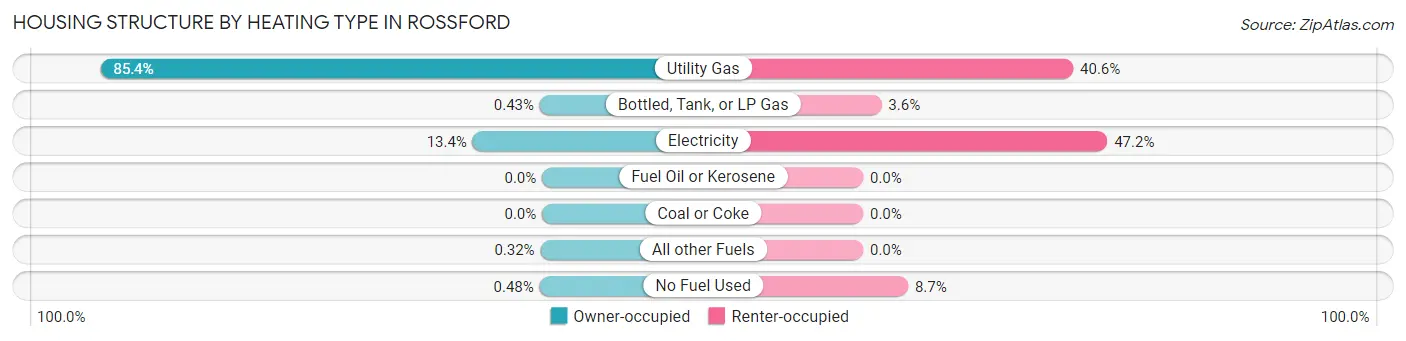
| Heating Type | Owner-occupied | Renter-occupied |
| Utility Gas | 1,604 (85.4%) | 332 (40.6%) |
| Bottled, Tank, or LP Gas | 8 (0.4%) | 29 (3.5%) |
| Electricity | 252 (13.4%) | 386 (47.2%) |
| Fuel Oil or Kerosene | 0 (0.0%) | 0 (0.0%) |
| Coal or Coke | 0 (0.0%) | 0 (0.0%) |
| All other Fuels | 6 (0.3%) | 0 (0.0%) |
| No Fuel Used | 9 (0.5%) | 71 (8.7%) |
| Total | 1,879 (100.0%) | 818 (100.0%) |
Household Vehicle Usage in Rossford
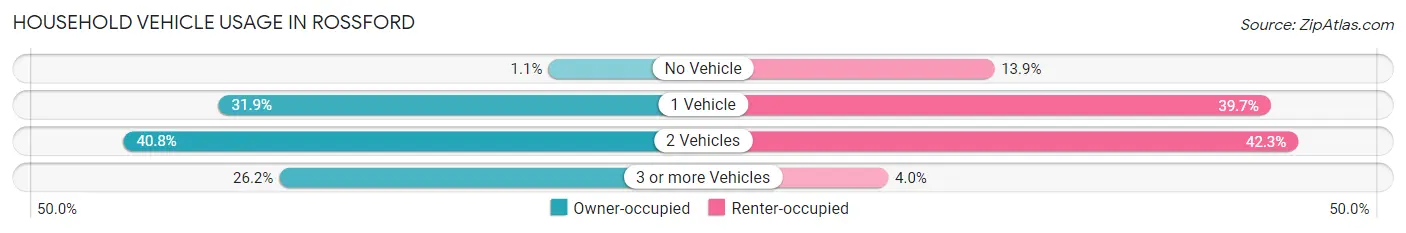
| Vehicles per Household | Owner-occupied | Renter-occupied |
| No Vehicle | 21 (1.1%) | 114 (13.9%) |
| 1 Vehicle | 599 (31.9%) | 325 (39.7%) |
| 2 Vehicles | 766 (40.8%) | 346 (42.3%) |
| 3 or more Vehicles | 493 (26.2%) | 33 (4.0%) |
| Total | 1,879 (100.0%) | 818 (100.0%) |
Real Estate & Mortgages in Rossford
Real Estate and Mortgage Overview in Rossford
| Characteristic | Without Mortgage | With Mortgage |
| Housing Units | 541 | 1,338 |
| Median Property Value | $154,700 | $171,000 |
| Median Household Income | $63,750 | $398 |
| Monthly Housing Costs | $581 | $49 |
| Real Estate Taxes | $2,842 | $24 |
Property Value by Mortgage Status in Rossford
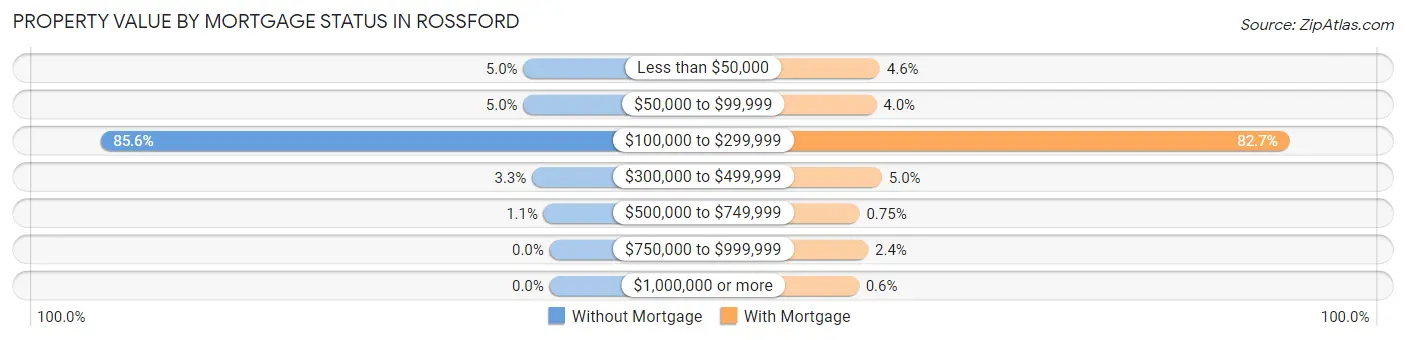
| Property Value | Without Mortgage | With Mortgage |
| Less than $50,000 | 27 (5.0%) | 62 (4.6%) |
| $50,000 to $99,999 | 27 (5.0%) | 53 (4.0%) |
| $100,000 to $299,999 | 463 (85.6%) | 1,106 (82.7%) |
| $300,000 to $499,999 | 18 (3.3%) | 67 (5.0%) |
| $500,000 to $749,999 | 6 (1.1%) | 10 (0.7%) |
| $750,000 to $999,999 | 0 (0.0%) | 32 (2.4%) |
| $1,000,000 or more | 0 (0.0%) | 8 (0.6%) |
| Total | 541 (100.0%) | 1,338 (100.0%) |
Household Income by Mortgage Status in Rossford
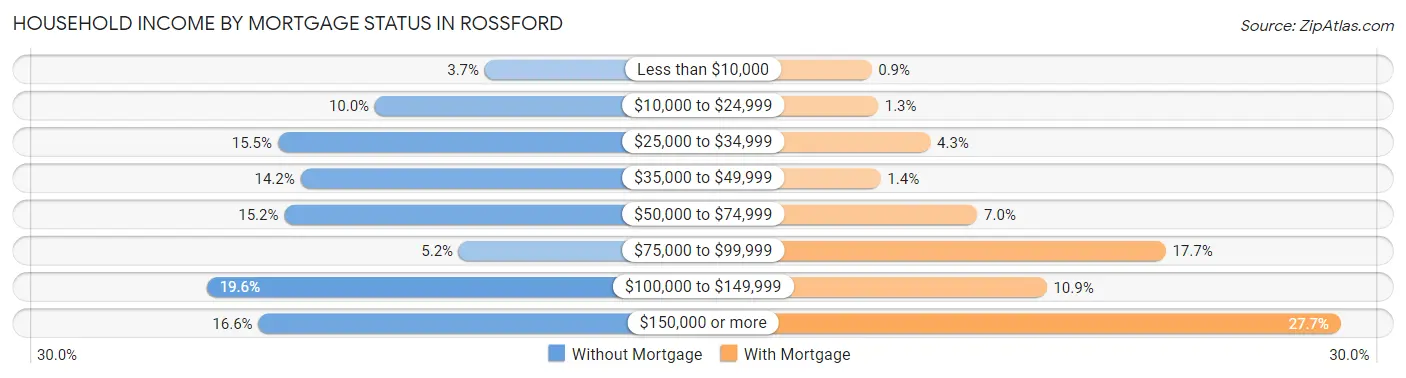
| Household Income | Without Mortgage | With Mortgage |
| Less than $10,000 | 20 (3.7%) | 12 (0.9%) |
| $10,000 to $24,999 | 54 (10.0%) | 17 (1.3%) |
| $25,000 to $34,999 | 84 (15.5%) | 57 (4.3%) |
| $35,000 to $49,999 | 77 (14.2%) | 19 (1.4%) |
| $50,000 to $74,999 | 82 (15.2%) | 93 (7.0%) |
| $75,000 to $99,999 | 28 (5.2%) | 237 (17.7%) |
| $100,000 to $149,999 | 106 (19.6%) | 146 (10.9%) |
| $150,000 or more | 90 (16.6%) | 371 (27.7%) |
| Total | 541 (100.0%) | 1,338 (100.0%) |
Property Value to Household Income Ratio in Rossford
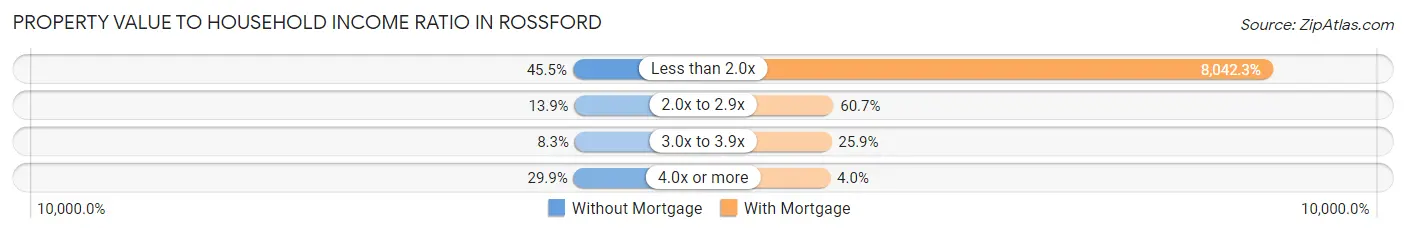
| Value-to-Income Ratio | Without Mortgage | With Mortgage |
| Less than 2.0x | 246 (45.5%) | 107,606 (8,042.3%) |
| 2.0x to 2.9x | 75 (13.9%) | 812 (60.7%) |
| 3.0x to 3.9x | 45 (8.3%) | 347 (25.9%) |
| 4.0x or more | 162 (29.9%) | 53 (4.0%) |
| Total | 541 (100.0%) | 1,338 (100.0%) |
Real Estate Taxes by Mortgage Status in Rossford
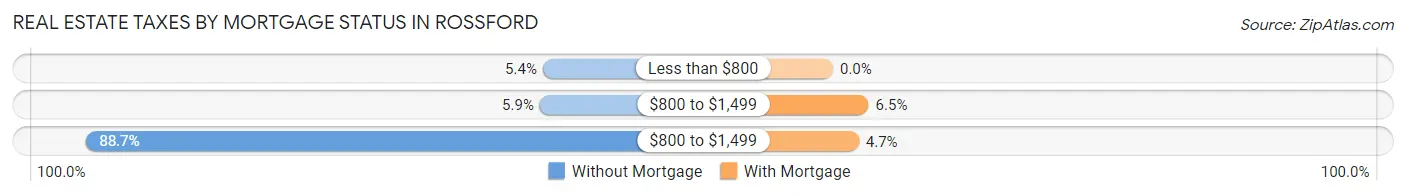
| Property Taxes | Without Mortgage | With Mortgage |
| Less than $800 | 29 (5.4%) | 0 (0.0%) |
| $800 to $1,499 | 32 (5.9%) | 87 (6.5%) |
| $800 to $1,499 | 480 (88.7%) | 63 (4.7%) |
| Total | 541 (100.0%) | 1,338 (100.0%) |
Health & Disability in Rossford
Health Insurance Coverage by Age in Rossford
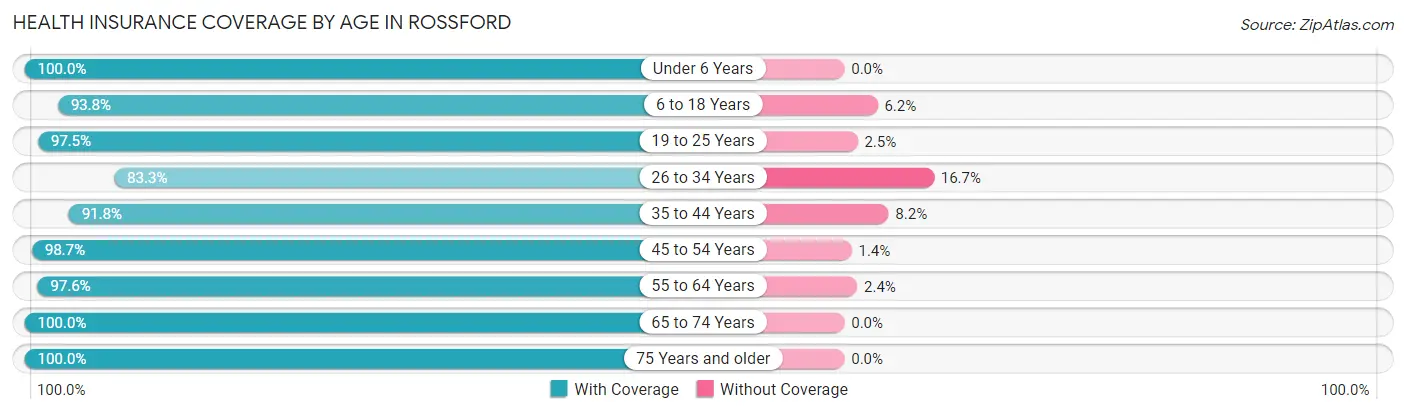
| Age Bracket | With Coverage | Without Coverage |
| Under 6 Years | 332 (100.0%) | 0 (0.0%) |
| 6 to 18 Years | 881 (93.8%) | 58 (6.2%) |
| 19 to 25 Years | 594 (97.5%) | 15 (2.5%) |
| 26 to 34 Years | 699 (83.3%) | 140 (16.7%) |
| 35 to 44 Years | 859 (91.8%) | 77 (8.2%) |
| 45 to 54 Years | 660 (98.7%) | 9 (1.3%) |
| 55 to 64 Years | 980 (97.6%) | 24 (2.4%) |
| 65 to 74 Years | 590 (100.0%) | 0 (0.0%) |
| 75 Years and older | 396 (100.0%) | 0 (0.0%) |
| Total | 5,991 (94.9%) | 323 (5.1%) |
Health Insurance Coverage by Citizenship Status in Rossford
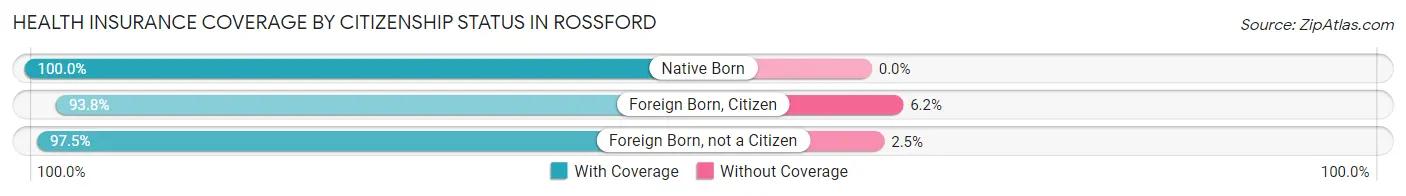
| Citizenship Status | With Coverage | Without Coverage |
| Native Born | 332 (100.0%) | 0 (0.0%) |
| Foreign Born, Citizen | 881 (93.8%) | 58 (6.2%) |
| Foreign Born, not a Citizen | 594 (97.5%) | 15 (2.5%) |
Health Insurance Coverage by Household Income in Rossford
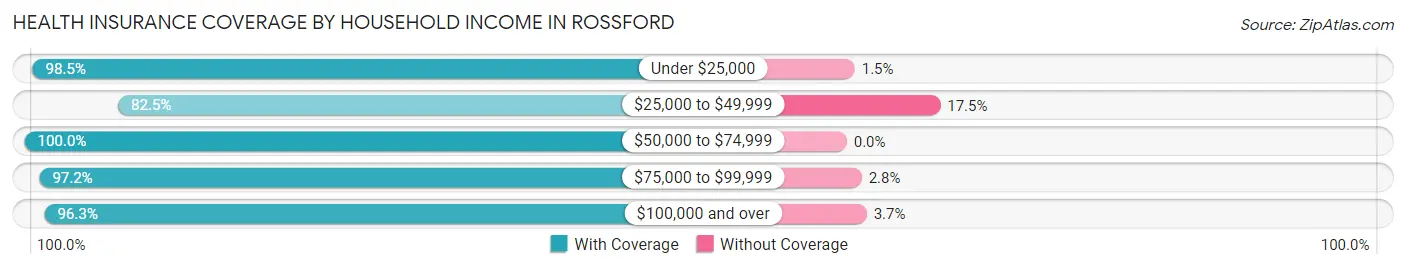
| Household Income | With Coverage | Without Coverage |
| Under $25,000 | 590 (98.5%) | 9 (1.5%) |
| $25,000 to $49,999 | 843 (82.5%) | 179 (17.5%) |
| $50,000 to $74,999 | 859 (100.0%) | 0 (0.0%) |
| $75,000 to $99,999 | 801 (97.2%) | 23 (2.8%) |
| $100,000 and over | 2,894 (96.3%) | 112 (3.7%) |
Public vs Private Health Insurance Coverage by Age in Rossford
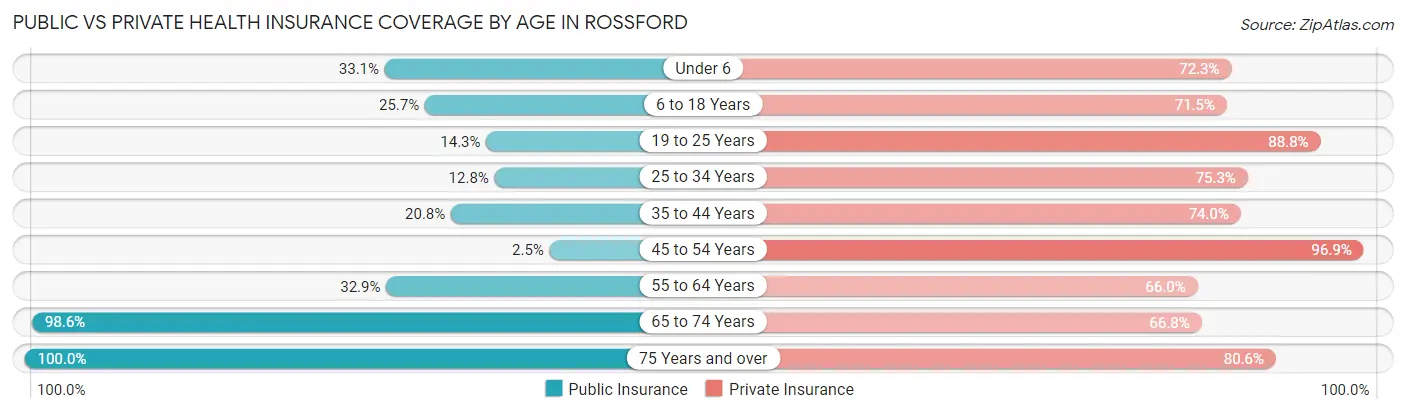
| Age Bracket | Public Insurance | Private Insurance |
| Under 6 | 110 (33.1%) | 240 (72.3%) |
| 6 to 18 Years | 241 (25.7%) | 671 (71.5%) |
| 19 to 25 Years | 87 (14.3%) | 541 (88.8%) |
| 25 to 34 Years | 107 (12.8%) | 632 (75.3%) |
| 35 to 44 Years | 195 (20.8%) | 693 (74.0%) |
| 45 to 54 Years | 17 (2.5%) | 648 (96.9%) |
| 55 to 64 Years | 330 (32.9%) | 663 (66.0%) |
| 65 to 74 Years | 582 (98.6%) | 394 (66.8%) |
| 75 Years and over | 396 (100.0%) | 319 (80.6%) |
| Total | 2,065 (32.7%) | 4,801 (76.0%) |
Disability Status by Sex by Age in Rossford
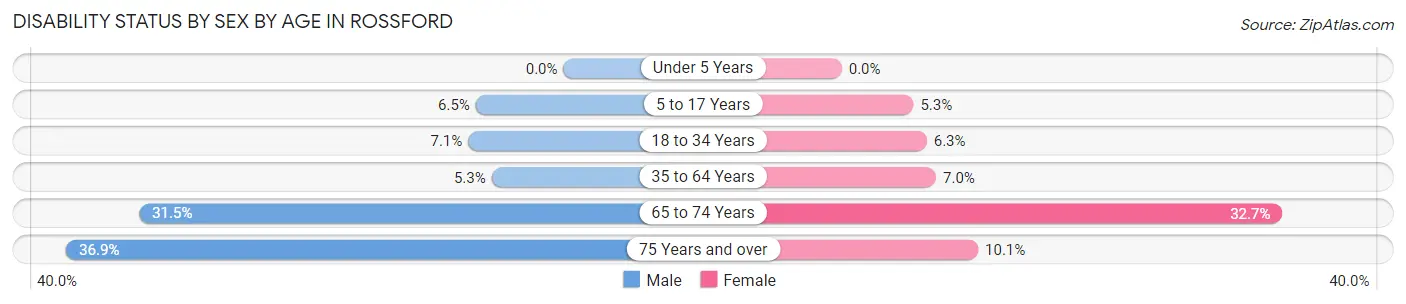
| Age Bracket | Male | Female |
| Under 5 Years | 0 (0.0%) | 0 (0.0%) |
| 5 to 17 Years | 19 (6.5%) | 31 (5.3%) |
| 18 to 34 Years | 77 (7.1%) | 33 (6.3%) |
| 35 to 64 Years | 69 (5.3%) | 92 (7.0%) |
| 65 to 74 Years | 103 (31.5%) | 86 (32.7%) |
| 75 Years and over | 55 (36.9%) | 25 (10.1%) |
Disability Class by Sex by Age in Rossford
Disability Class: Hearing Difficulty
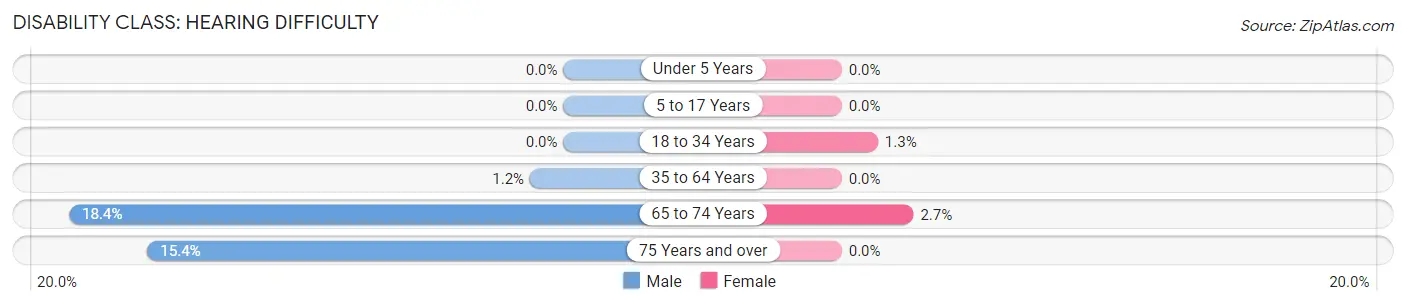
| Age Bracket | Male | Female |
| Under 5 Years | 0 (0.0%) | 0 (0.0%) |
| 5 to 17 Years | 0 (0.0%) | 0 (0.0%) |
| 18 to 34 Years | 0 (0.0%) | 7 (1.3%) |
| 35 to 64 Years | 16 (1.2%) | 0 (0.0%) |
| 65 to 74 Years | 60 (18.3%) | 7 (2.7%) |
| 75 Years and over | 23 (15.4%) | 0 (0.0%) |
Disability Class: Vision Difficulty
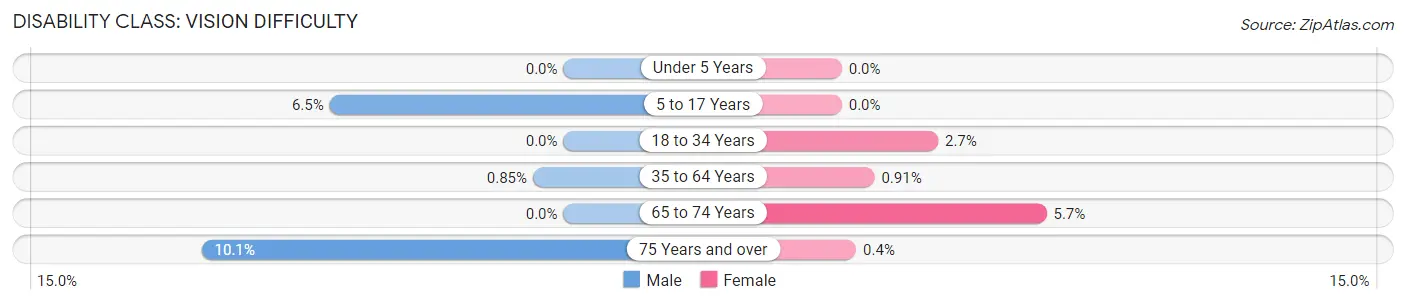
| Age Bracket | Male | Female |
| Under 5 Years | 0 (0.0%) | 0 (0.0%) |
| 5 to 17 Years | 19 (6.5%) | 0 (0.0%) |
| 18 to 34 Years | 0 (0.0%) | 14 (2.7%) |
| 35 to 64 Years | 11 (0.9%) | 12 (0.9%) |
| 65 to 74 Years | 0 (0.0%) | 15 (5.7%) |
| 75 Years and over | 15 (10.1%) | 1 (0.4%) |
Disability Class: Cognitive Difficulty
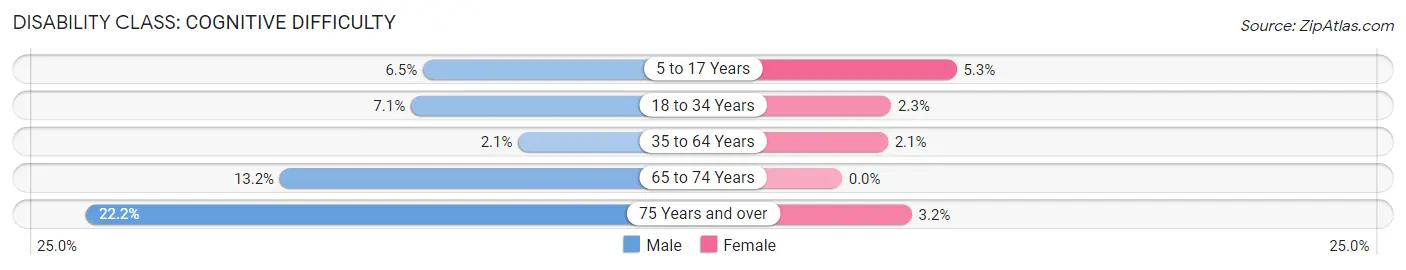
| Age Bracket | Male | Female |
| 5 to 17 Years | 19 (6.5%) | 31 (5.3%) |
| 18 to 34 Years | 77 (7.1%) | 12 (2.3%) |
| 35 to 64 Years | 27 (2.1%) | 28 (2.1%) |
| 65 to 74 Years | 43 (13.2%) | 0 (0.0%) |
| 75 Years and over | 33 (22.2%) | 8 (3.2%) |
Disability Class: Ambulatory Difficulty
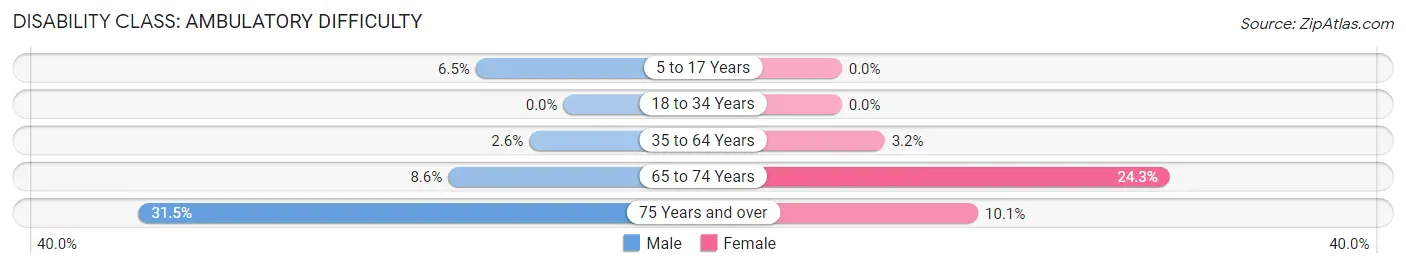
| Age Bracket | Male | Female |
| 5 to 17 Years | 19 (6.5%) | 0 (0.0%) |
| 18 to 34 Years | 0 (0.0%) | 0 (0.0%) |
| 35 to 64 Years | 33 (2.5%) | 42 (3.2%) |
| 65 to 74 Years | 28 (8.6%) | 64 (24.3%) |
| 75 Years and over | 47 (31.5%) | 25 (10.1%) |
Disability Class: Self-Care Difficulty
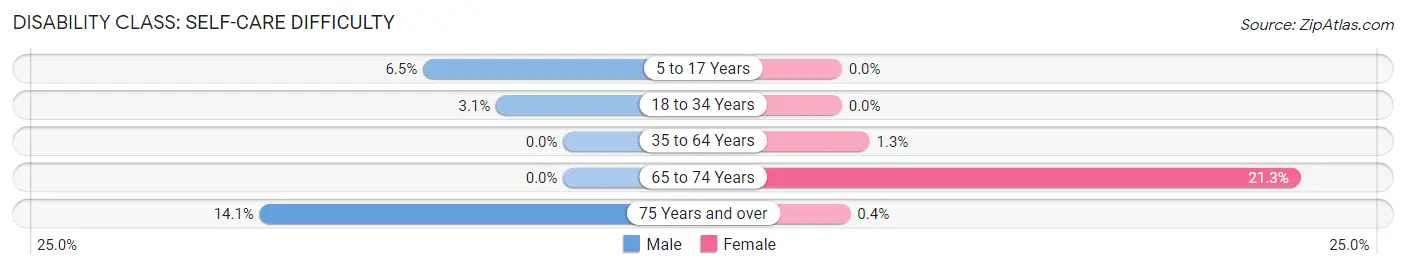
| Age Bracket | Male | Female |
| 5 to 17 Years | 19 (6.5%) | 0 (0.0%) |
| 18 to 34 Years | 34 (3.1%) | 0 (0.0%) |
| 35 to 64 Years | 0 (0.0%) | 17 (1.3%) |
| 65 to 74 Years | 0 (0.0%) | 56 (21.3%) |
| 75 Years and over | 21 (14.1%) | 1 (0.4%) |
Technology Access in Rossford
Computing Device Access in Rossford
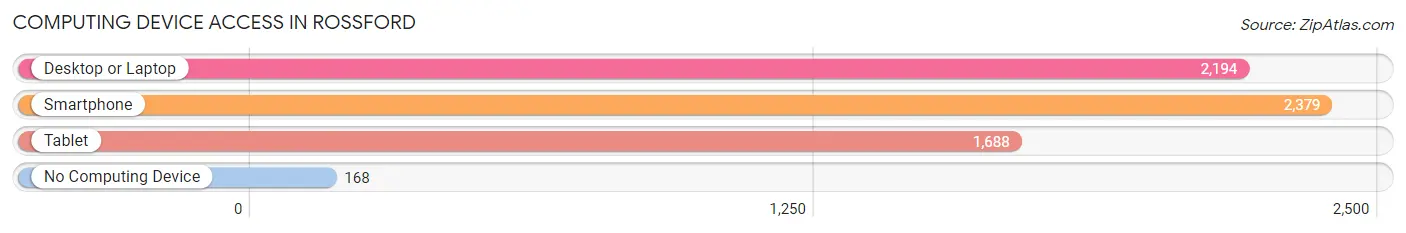
| Device Type | # Households | % Households |
| Desktop or Laptop | 2,194 | 81.4% |
| Smartphone | 2,379 | 88.2% |
| Tablet | 1,688 | 62.6% |
| No Computing Device | 168 | 6.2% |
| Total | 2,697 | 100.0% |
Internet Access in Rossford
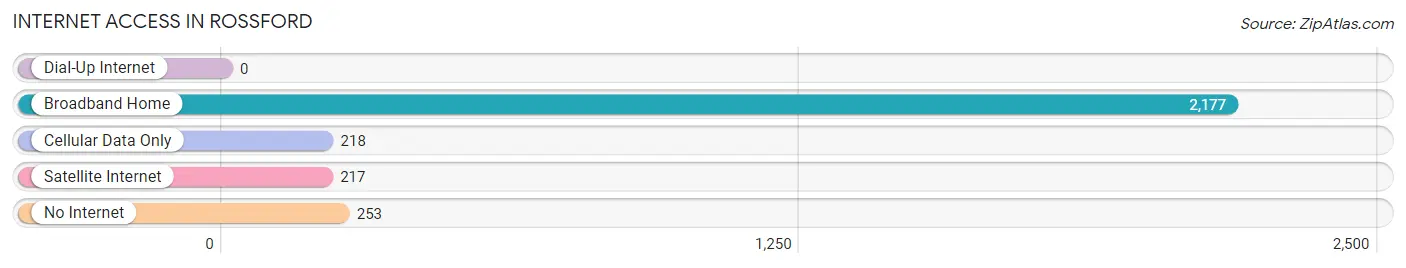
| Internet Type | # Households | % Households |
| Dial-Up Internet | 0 | 0.0% |
| Broadband Home | 2,177 | 80.7% |
| Cellular Data Only | 218 | 8.1% |
| Satellite Internet | 217 | 8.1% |
| No Internet | 253 | 9.4% |
| Total | 2,697 | 100.0% |
Rossford Summary
Rossford, Ohio is a small city located in Wood County, Ohio, United States. It is situated along the Maumee River, just east of Toledo. The city has a population of 6,293 as of the 2010 census.
History
The area that is now Rossford was first settled in 1835 by a group of German immigrants. The settlement was originally known as “German Town” and was located along the Maumee River. In 1854, the settlement was renamed Rossford, after the Ross family, who had purchased the land from the original settlers.
The city was officially incorporated in 1876 and was home to a variety of industries, including a glass factory, a brickyard, and a sawmill. The city also had a thriving agricultural industry, with many farmers growing corn, wheat, and other crops.
In the early 20th century, the city began to experience a period of growth and development. The city was connected to Toledo by a streetcar line in 1910, and the Rossford Bridge was built in 1912, connecting the city to the other side of the Maumee River.
Geography
Rossford is located at 41°32'25" North, 83°33'45" West (41.540278, -83.5625). According to the United States Census Bureau, the city has a total area of 4.2 square miles, all of it land.
The city is situated along the Maumee River, just east of Toledo. It is bordered by the cities of Perrysburg and Northwood to the north, and by the townships of Lake and Troy to the south.
Economy
The economy of Rossford is largely based on manufacturing and retail. The city is home to several manufacturing companies, including the Rossford Glass Company, which produces glass products for the automotive and construction industries. The city is also home to several retail stores, including a Walmart Supercenter and a Lowe’s Home Improvement store.
Demographics
As of the 2010 census, there were 6,293 people, 2,541 households, and 1,637 families residing in the city. The population density was 1,496.3 people per square mile. The racial makeup of the city was 94.2% White, 1.7% African American, 0.3% Native American, 0.7% Asian, 0.1% Pacific Islander, 1.2% from other races, and 1.9% from two or more races. Hispanic or Latino of any race were 3.2% of the population.
There were 2,541 households, out of which 30.2% had children under the age of 18 living with them, 44.2% were married couples living together, 14.2% had a female householder with no husband present, and 36.2% were non-families. 30.2% of all households were made up of individuals, and 11.3% had someone living alone who was 65 years of age or older. The average household size was 2.45 and the average family size was 3.04.
In the city, the population was spread out, with 24.7% under the age of 18, 8.2% from 18 to 24, 28.7% from 25 to 44, 24.2% from 45 to 64, and 14.2% who were 65 years of age or older. The median age was 37 years. For every 100 females, there were 93.2 males. For every 100 females age 18 and over, there were 89.3 males.
The median income for a household in the city was $41,944, and the median income for a family was $50,938. Males had a median income of $37,917 versus $27,917 for females. The per capita income for the city was $20,945. About 6.2% of families and 8.2% of the population were below the poverty line, including 11.2% of those under age 18 and 6.2% of those age 65 or over.
Common Questions
What is Per Capita Income in Rossford?
Per Capita income in Rossford is $40,299.
What is the Median Family Income in Rossford?
Median Family Income in Rossford is $100,067.
What is the Median Household income in Rossford?
Median Household Income in Rossford is $74,886.
What is Income or Wage Gap in Rossford?
Income or Wage Gap in Rossford is 15.2%.
Women in Rossford earn 84.8 cents for every dollar earned by a man.
What is Inequality or Gini Index in Rossford?
Inequality or Gini Index in Rossford is 0.41.
What is the Total Population of Rossford?
Total Population of Rossford is 6,314.
What is the Total Male Population of Rossford?
Total Male Population of Rossford is 3,257.
What is the Total Female Population of Rossford?
Total Female Population of Rossford is 3,057.
What is the Ratio of Males per 100 Females in Rossford?
There are 106.54 Males per 100 Females in Rossford.
What is the Ratio of Females per 100 Males in Rossford?
There are 93.86 Females per 100 Males in Rossford.
What is the Median Population Age in Rossford?
Median Population Age in Rossford is 40.2 Years.
What is the Average Family Size in Rossford
Average Family Size in Rossford is 3.0 People.
What is the Average Household Size in Rossford
Average Household Size in Rossford is 2.3 People.
How Large is the Labor Force in Rossford?
There are 3,769 People in the Labor Forcein in Rossford.
What is the Percentage of People in the Labor Force in Rossford?
71.0% of People are in the Labor Force in Rossford.
What is the Unemployment Rate in Rossford?
Unemployment Rate in Rossford is 4.8%.